Embed Size (px)
Citation preview
Tanzania Journal of Engineering and Technology (Tanz. J. Engrg. Technol.), Vol. 39 (No. 2), Dec. 2020 198
Vol. 39(2), pp. 198-212, Dec. 2020ISSN 1821-536X (print)ISSN 2619-8789 (electronic)
Tanzania Journal of Engineering and TechnologyCopyright © 2020 College of Engineering andTechnology, University of Dar es Salaam
Full Length Research Paper
Fermentability of Concentrated Sulfuric acid Hydrolyzates fromAspenwood and Pinewood
1,*Kando K. Janga, 2Nils Dyrset, 3Karin Øyaas, 4Størker T. Moe
1Department of Chemical and Mining Engineering, University of Dar es Salaam,Tanzania.
2SINTEF Materials and Chemistry, NO-7491 Trondheim, Norway3 Paper and Fibre Research Institute, NO-7491 Trondheim, Norway
4Norwegian University of Science and Technology (NTNU), Department of ChemicalEngineering, NO-7491 Trondheim, Norway
*Correspondence author: [email protected]
ABSTRACT
The fermentability of hydrolyzates derived from two-stage concentrated sulfuricacid hydrolysis of Trembling aspen (Populus tremula) and Scots pine (Pinussylvestris) were investigated. Three types of hydrolyzates were produced atmild, moderate and high decrystallization severity conditions. Portions of eachof the original hydrolyzates were concentrated by vacuum evaporation toincrease the sugar fraction to simulate industrial applications. Both sets ofhydrolyzates were fermented anaerobically using Saccharomyces cerevisiaeATCC 96581. After 23 hours of fermentation, complete glucose consumptionwas observed for all the original hydrolyzates, with no signs of inhibition. Theethanol yields from these hydrolyzates ranged from 68% to 90% of theoreticalvalue. Fermentation of concentrated aspen hydrolyzates produced at mild ormoderate decrystallization severity showed a significant lag phase, associatedwith relatively high furfural content in the samples (approximately 2 g/L). Nolag phase was apparent for aspen produced at high decrystallization severity orpine hydrolyzates. However, furfural had no adverse effect on the maximumethanol yield. No inhibitory effect of HMF, acetic acid, formic acid or levulinicacid was detected in the concentrated hydrolyzates due to the relatively lowconcentrations of these compounds. The ethanol yields from concentratedhydrolyzates were above 97% of theoretical with exception of pine hydrolyzateproduced at high severity which had a fairy good yield of 87%. The quantitativeanalysis of inhibitors and the fermentability investigation showed that both theoriginal and concentrated hydrolyzates from the concentrated sulfuric acidprocess were readily fermentable, and furfural was singled out as the mostimportant inhibitor in these hydrolyzates.
Keywords: Decrystallization; trembling aspen (Populus tremula); scots pine(Pinus sylvestris); concentrated sulfuric acid; hydrolyzate; fermentability;fermentation inhibitors.
Fermentability of Concentrated Sulfuric acid Hydrolyzates from Aspenwood and Pinewood
199 Tanzania Journal of Engineering and Technology (Tanz. J. Engrg. Technol.), Vol. 39 (No. 2), Dec. 2020
INTRODUCTION
The use of lignocellulosic biomass as asource of sugars for production ofethanol and other biofuels has been ofgrowing interest due to its abundance,renewability and low cost (Sun andCheng, 2002; Knauf and Moniruzzaman,2004). Compared to othersaccharification processes, theconcentrated acid hydrolysis process isbelieved to achieve near theoreticalbiomass-to-sugar yields with fewerdegradation products (Schell and Duff,1996; Miller and Hester, 2007). Thenear theoretical sugar yields and fewerdegradation products are achievablebecause the process employs lowertemperatures and concentrated acids andthe reaction time is practically feasible.Although consumption of largequantities of concentrated acids has beena major drawback of this process, theinvention of new acid recoverytechnologies (Nanguneri and Hester1990; Springfield and Hester 1999;Weydahl, 2010) has renewed interest onthis process.
In acid hydrolysis, sugars will degradeto a certain extent during thesaccharification process. However, theamount and extent of degradation issignificantly influenced by the intensityof the hydrolysis conditions (hydrolysisseverity) and the type of biomass Rajanand Carrier, 2014). The most importantbiomass-derived sugar degradationproducts in acid hydrolyzates are furansof which furfural and 5-hydroxymethylfurfural (HMF) are of interest as thesecompounds are usually found insignificant quantities (Taherzadeh et al.,1997). Furfural and HMF are toxic tofermenting microorganisms and havebeen described as the strongestinhibitors to Saccharomyces cerevisiae(Sanchez and Bautista, 1988). Inhibitorscan severely affect the fermentation ofsugar to ethanol, and as one of the
degradation products, they reduce thesugar yield, hence decreasing the overallbiomass-to-ethanol conversionefficiency (Badger, 2002). Otherfermentation inhibitors in woodhydrolyzates are organic (carboxylic)acids such as acetic acid which isreleased from the side groups ofheteropolymers (acetylatedhemicelluloses) during hydrolysis andlevulinic and formic acids which resultsfrom further degradation of sugarsdegradation products. Phenoliccompounds resulting from lignindegradation and extractives have beendescribed as important inhibitorsreleased into wood hydrolyzates duringacid hydrolysis process (Clark andMackie, 1984). In some cases, inhibitorhave to be removed to improve thefermentability (Huang et al., 2020).
In a study by Wayman and Parekh(1987), hydrolyzates from concentratedsulfuric acid hydrolysis of Pinus patuladid not show any inhibition to themicroorganisms, but the inhibitors levelswere not investigated. To the knowledgeof this work’s authors, the literatureaddressing the formation of biomass-derived sugar degradation products andother inhibitors and the fermentability ofhydrolyzates from concentrated acidprocesses is very limited. On the otherhand, such information on dilute acidhydrolyzates is extensively studied(Larsson et al., 1998; Boussaid et al.,1999; Lee et al., 1999; Robinson et al.,2003). In our previous study (Janga etal., 2012), hydrolyzates fromconcentrated sulfuric acid hydrolysis ofaspen and pine were quantitativelyanalyzed and correlations betweendecystallization conditions, sugar yieldsand inhibitor production wereestablished. However, fermenting anumber of selected hydrolyzates cangive a direct product (hydrolyzate)quality test in terms of fermentabilityrather than relying on the quantitative
Kando K. Janga, Nils Dyrset, Karin Øyaas, Størker T. Moe
Tanzania Journal of Engineering and Technology (Tanz. J. Engrg. Technol.), Vol. 39 (No. 2), Dec. 2020 200
analysis, since such a test also may showeffects of unknown and/or unquantifiedinhibitors present in the hydrolyzates.
Thus, in this study, inhibitor content andthe fermentation characteristics orfermentability (quality) of aspenwoodand pinewood hydrolyzates derivedfrom a two-stage concentrated sulfuricacid hydrolysis process are investigated.The hydrolyzates were produced atdifferent decrystallization severitiesdetermined by the time, temperature andacid concentration combined together inthe generalized severity parameter. Thesamples were studied at low (originalhydrolyzates) and high (concentratedhydrolyzates) sugar and inhibitor
concentrations. Fermentability trialswere performed using the ethanologenicyeast Saccharomyces cerevisiae ATCC96581.
MATERIALS AND METHODS
Lignocellulosic Biomass
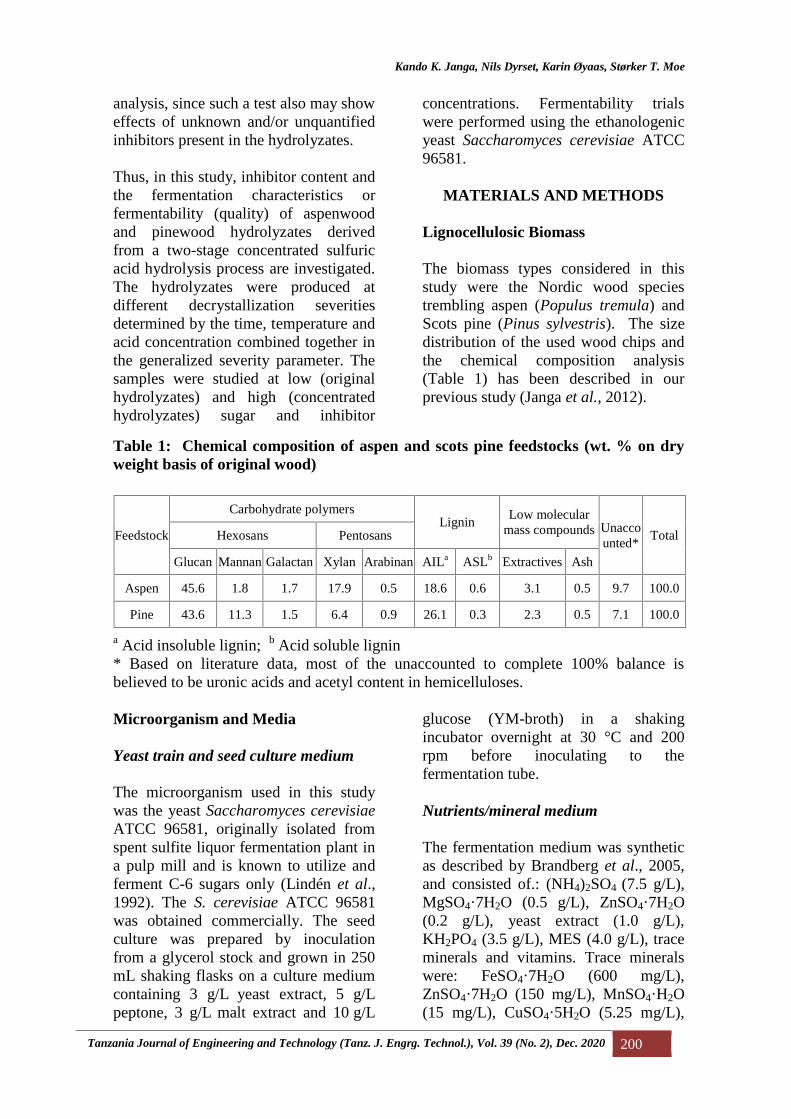
The biomass types considered in thisstudy were the Nordic wood speciestrembling aspen (Populus tremula) andScots pine (Pinus sylvestris). The sizedistribution of the used wood chips andthe chemical composition analysis(Table 1) has been described in ourprevious study (Janga et al., 2012).
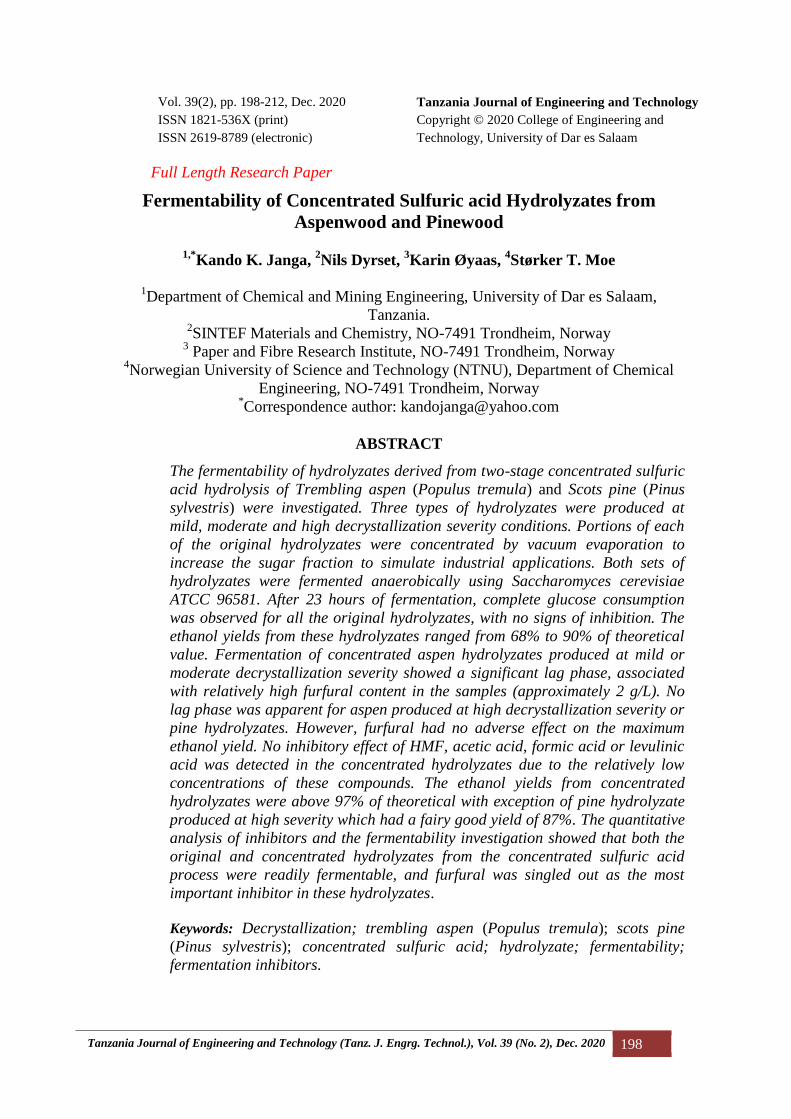
Table 1: Chemical composition of aspen and scots pine feedstocks (wt. % on dryweight basis of original wood)
Feedstock
Carbohydrate polymersLignin
Low molecularmass compounds Unacco
unted*TotalHexosans Pentosans
Glucan Mannan Galactan Xylan Arabinan AILa ASLb Extractives Ash
Aspen 45.6 1.8 1.7 17.9 0.5 18.6 0.6 3.1 0.5 9.7 100.0
Pine 43.6 11.3 1.5 6.4 0.9 26.1 0.3 2.3 0.5 7.1 100.0
a Acid insoluble lignin; b Acid soluble lignin* Based on literature data, most of the unaccounted to complete 100% balance isbelieved to be uronic acids and acetyl content in hemicelluloses.
Microorganism and Media
Yeast train and seed culture medium
The microorganism used in this studywas the yeast Saccharomyces cerevisiaeATCC 96581, originally isolated fromspent sulfite liquor fermentation plant ina pulp mill and is known to utilize andferment C-6 sugars only (Lindén et al.,1992). The S. cerevisiae ATCC 96581was obtained commercially. The seedculture was prepared by inoculationfrom a glycerol stock and grown in 250mL shaking flasks on a culture mediumcontaining 3 g/L yeast extract, 5 g/Lpeptone, 3 g/L malt extract and 10 g/L
glucose (YM-broth) in a shakingincubator overnight at 30 °C and 200rpm before inoculating to thefermentation tube.
Nutrients/mineral medium
The fermentation medium was syntheticas described by Brandberg et al., 2005,and consisted of.: (NH4)2SO4 (7.5 g/L),MgSO4·7H2O (0.5 g/L), ZnSO4·7H2O(0.2 g/L), yeast extract (1.0 g/L),KH2PO4 (3.5 g/L), MES (4.0 g/L), traceminerals and vitamins. Trace mineralswere: FeSO4·7H2O (600 mg/L),ZnSO4·7H2O (150 mg/L), MnSO4·H2O(15 mg/L), CuSO4·5H2O (5.25 mg/L),
Fermentability of Concentrated Sulfuric acid Hydrolyzates from Aspenwood and Pinewood
201 Tanzania Journal of Engineering and Technology (Tanz. J. Engrg. Technol.), Vol. 39 (No. 2), Dec. 2020
NaMoO4·H2O (5.25 mg/L), CoCl2·6H2O(1.5 mg/L), boric acid (0.38 mg·L-1) andvitamins were: Ca-pantothenate (30mg/L), biotin (4.5 mg/L), thiamine-HCl(2.25 mg/L).
Preparation of Hydrolyzates by theTwo-stage Concentrated Sulfuric AcidHydrolysis Process
The hydrolyzates used in this study wereproduced by the two-stage concentratedsulfuric acid hydrolysis processconsisting of one decrystallization stageand one hydrolysis stage. Two sets ofhydrolyzates were used for studying thefermentation characteristics. The first setof hydrolyzates called the original(unconcentrated) hydrolyzates wasproduced directly from the two-stageconcentrated sulfuric acid hydrolysis asdescribed by Janga et al. (2012). Arelatively high liquid-to-wood ratio of15:1 (w/w) was used duringdecrystallization due to mixinglimitations in the laboratory. However,industrially relevant acid-to-wood ratiosof down to 1:1 can be achieved by theuse of efficient mixing equipment suchas twin-screw extruder reactor (Millerand Hester, 2007).
The decrystallization conditionintensities (severities) were categorizedas mild, moderate and high severitybased on glucose recovery (Table 2) todescribe the extent of reactions at thedecrystallization stage in the two-stageconcentrated sulfuric acid hydrolysis.The severity (CSFSA) expressed as thelogarithm of generalized severityparameter (ROH) [Equations (1) and (2)]combines the reaction temperature, time
and acid concentration in a singlereaction ordinate to describe thehydrolysis effect on carbohydratepolymer solubilization or sugar yields(Abatzoglou et al., 1992). Theparameters in ROH describing the effectof temperature (ω) and acid effect () atthe decrystallization stage forconcentrated sulfuric acid hydrolysis ofaspen and pine has been estimated in ourprevious study (Janga et al., 2011).
Generalized Severity parameter is givenby equation (1).
0
exp expt
ref refOH
ref
C C T TR dt
C
……………………………… (1)
Where: C and Cref are the acidconcentration and reference acidconcentration in mol/L or % w/w, T andTref are the temperature and referencetemperature in K, respectively.The severity for concentrated sulfuricacid hydrolysis is given by equation (2).
CSFSA = ln(ROH) ……...…………… (2)
Where for glucose in aspen: = 0.12; = 15.82; glucose in pine: = 0.21; =20.26 (Janga et al., 2011)
The second set of hydrolyzates calledconcentrated hydrolyzates was obtainedby concentrating a portion of theoriginal hydrolyzate by vacuumevaporation in order to increase theconcentration of sugars and otherreaction products, e.g. inhibitors andsugar degradation products in an attemptto simulate industrial hydrolysis at highdry matter content.
Kando K. Janga, Nils Dyrset, Karin Øyaas, Størker T. Moe
Tanzania Journal of Engineering and Technology (Tanz. J. Engrg. Technol.), Vol. 39 (No. 2), Dec. 2020 202
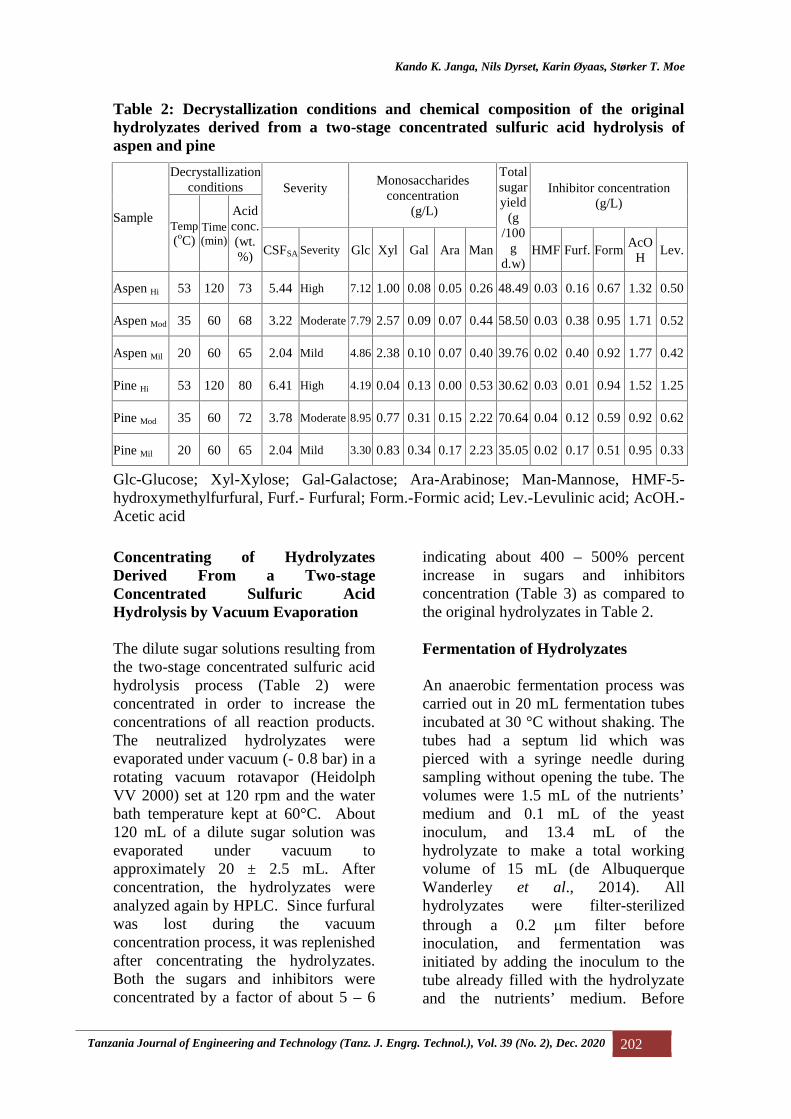
Table 2: Decrystallization conditions and chemical composition of the originalhydrolyzates derived from a two-stage concentrated sulfuric acid hydrolysis ofaspen and pine
Sample
Decrystallizationconditions Severity
Monosaccharidesconcentration
(g/L)
Totalsugaryield
(g/100
gd.w)
Inhibitor concentration(g/L)
Temp(oC)
Time(min)
Acidconc.(wt.%) CSFSA Severity Glc Xyl Gal Ara Man HMF Furf. Form
AcOH
Lev.
Aspen Hi 53 120 73 5.44 High 7.12 1.00 0.08 0.05 0.26 48.49 0.03 0.16 0.67 1.32 0.50
Aspen Mod 35 60 68 3.22 Moderate 7.79 2.57 0.09 0.07 0.44 58.50 0.03 0.38 0.95 1.71 0.52
Aspen Mil 20 60 65 2.04 Mild 4.86 2.38 0.10 0.07 0.40 39.76 0.02 0.40 0.92 1.77 0.42
Pine Hi 53 120 80 6.41 High 4.19 0.04 0.13 0.00 0.53 30.62 0.03 0.01 0.94 1.52 1.25
Pine Mod 35 60 72 3.78 Moderate 8.95 0.77 0.31 0.15 2.22 70.64 0.04 0.12 0.59 0.92 0.62
Pine Mil 20 60 65 2.04 Mild 3.30 0.83 0.34 0.17 2.23 35.05 0.02 0.17 0.51 0.95 0.33
Glc-Glucose; Xyl-Xylose; Gal-Galactose; Ara-Arabinose; Man-Mannose, HMF-5-hydroxymethylfurfural, Furf.- Furfural; Form.-Formic acid; Lev.-Levulinic acid; AcOH.-Acetic acid
Concentrating of HydrolyzatesDerived From a Two-stageConcentrated Sulfuric AcidHydrolysis by Vacuum Evaporation
The dilute sugar solutions resulting fromthe two-stage concentrated sulfuric acidhydrolysis process (Table 2) wereconcentrated in order to increase theconcentrations of all reaction products.The neutralized hydrolyzates wereevaporated under vacuum (- 0.8 bar) in arotating vacuum rotavapor (HeidolphVV 2000) set at 120 rpm and the waterbath temperature kept at 60°C. About120 mL of a dilute sugar solution wasevaporated under vacuum toapproximately 20 ± 2.5 mL. Afterconcentration, the hydrolyzates wereanalyzed again by HPLC. Since furfuralwas lost during the vacuumconcentration process, it was replenishedafter concentrating the hydrolyzates.Both the sugars and inhibitors wereconcentrated by a factor of about 5 – 6
indicating about 400 – 500% percentincrease in sugars and inhibitorsconcentration (Table 3) as compared tothe original hydrolyzates in Table 2.
Fermentation of Hydrolyzates
An anaerobic fermentation process wascarried out in 20 mL fermentation tubesincubated at 30 °C without shaking. Thetubes had a septum lid which waspierced with a syringe needle duringsampling without opening the tube. Thevolumes were 1.5 mL of the nutrients’medium and 0.1 mL of the yeastinoculum, and 13.4 mL of thehydrolyzate to make a total workingvolume of 15 mL (de AlbuquerqueWanderley et al., 2014). Allhydrolyzates were filter-sterilizedthrough a 0.2 m filter beforeinoculation, and fermentation wasinitiated by adding the inoculum to thetube already filled with the hydrolyzateand the nutrients’ medium. Before
Fermentability of Concentrated Sulfuric acid Hydrolyzates from Aspenwood and Pinewood
203 Tanzania Journal of Engineering and Technology (Tanz. J. Engrg. Technol.), Vol. 39 (No. 2), Dec. 2020
incubation 1 mL of the sample wastaken, and after incubation, a series of 1mL aliquots were sampled at a constanttime interval until no more glucose wasleft. Before sampling the tubes wereshaken and the sampled aliquots werecentrifuged and later stored at -4°C forsugar and ethanol quantitative analysis.
Analyses of Hydrolyzates andFermentation Broths
Monosaccharides (glucose, xylose,galactose, mannose and arabinose) in theoriginal and concentrated hydrolyzateswere separated on an anion-exchange 4× 250 mm CarboPac PA1 analyticalcolumn at 30°C. The eluate was 1.5 mMNaOH at an isocratic flowrate of 1mL/min. The system consisted ofDionex ICS-5000 HPLC and ICS-5000ED electrochemical detector (DionexCorp., USA).
The concentration of glucose andethanol in the fermentation broth andinhibitors in the original andconcentrated hydrolyzates was analyzedon the Shimadzu HPLC system (Kyoto,Japan). Ethanol concentration in thefermented broth and sugar degradationproducts in the original and concentratedhydrolyzates were quantified using anAminex HPX-87H column (Bio-Rad,Hercules, CA, USA) in line with aCation-H guard column (Biorad 125-0129). A 5 mM amount of sulfuric acidwas used as a mobile phase at anisocratic flow rate of 0.6 mL/min andcolumn temperature of 65oC. Furfural,5-hydroxymethylfurfural (HMF), andlevulinic acid were detected at 280 nmwhile acetic acid and formic acid weredetected at 210 nm on a ultraviolet (UV-VIS) absorbance detector (ShimadzuSPD-6AV). Glucose was separated on aLead (Pb2+) cation-exchange resincolumn (Aminex HPX-87P, Bio-Rad,USA) at 85°C with deionized water asan eluent at a flow rate of 0.6 mL/min.
Both glucose and ethanol were detectedby a refractive index (RI) detector(Shimadzu RID-6A).
Fermentation Characterization
The important fermentation parametersused to characterize and assess thefermentation characteristics ofhydrolyzates were maximum ethanolyield (YEtOH), volumetric ethanolproductivity (QEtOH) and glucoseutilization rate (Gr). The maximumethanol yield indicated the sugars-to-ethanol conversion efficiency, and wascalculated based on the initialconcentration of total C-6sugars/fermentable sugars (glucose,mannose and galactose) in the broth asgrams of ethanol produced per grams ofhexoses because S. cerevisiae ATCC96581 can only ferment hexoses.Equation (3) was used to calculate thetheoretical maximum ethanol yieldbased on hexoses (de AlbuquerqueWanderley et al., 2014, Vogel et al.,2011).
( )(%) 100
( ) 0.511EtOH
E gY x
H g x …... (3)
Where E and H are the maximumamount of ethanol produced in thefermentation broth (g) and the initialhexose concentration in the hydrolyzate(g), respectively. Coefficient 0.511 is thestoichiometric yield of ethanol fromhexoses. The volumetric ethanolproductivity (QEtOH) determines thecapital investment cost in terms of sizeand cost of the fermenter, and wascalculated as the ethanol concentrationproduced (g/L) divided by fermentationtime (hours) taken to reach that ethanolconcentration. The glucose consumptionrate was calculated as the amount ofglucose utilized (g/L) per time (hrs).Lag time (LT) is also used tocharacterize the fermentability.

Kando K. Janga, Nils Dyrset, Karin Øyaas, Størker T. Moe
Tanzania Journal of Engineering and Technology (Tanz. J. Engrg. Technol.), Vol. 39 (No. 2), Dec. 2020 204
RESULTS AND DISCUSSION
Two-stage Concentrated Sulfuric AcidHydrolysis of Pine and Aspen
The decrystallization conditions and thechemical compositions of the originalaspen and pine hydrolyzates producedfrom the two-stage concentrated sulfuricacid hydrolysis are shown in Table 2.
It can be seen from the data that theoriginal hydrolyzates had quite lowsugar concentrations due to dilutioncaused by high acid/wood ratio, sincethe monosaccharide yields were fairlyhigh. Both aspen and pine hydrolyzatesproduced at moderate severity had thebest monosaccharides yields with thepine hydrolyzates approaching neartheoretical yield values. The correlationbetween glucose and HMFconcentration in the originalhydrolyzates and that between xyloseand furfural are shown on Figure 1.
A fairly good but weak linear correlationexist between the glucose and HMFyields (Figure 1A). The lowercorrelation coefficient in glucose-HMFprofile can be explained by the presenceof other hexoses (mannose, whichmakes up a significant fraction of thewood sugars, and galactose) degradingto form HMF and, more importantly, theinstability of HMF under acidichydrolysis conditions (Lewkowski,2001) forming secondary degradation. Avery strong linear correlation wasobserved between xylose and furfuralyields (Figure 1B). The high correlationcoefficient in the xylose-furfural profilecan be explained by the high fraction ofxylose in pentoses as compared toarabinose, which can degrade to furfuraland the high stability of furfural towardsfurther degradation to secondarydegradation products under acidichydrolysis conditions (Dunlop, 1948;Lehnen et al., 2001). Table 2 also
clearly shows that aspen hydrolyzateshad relatively high levels of furfural ascompared to pine hydrolyzates. This wasanticipated due to the high xylan contentin aspen and xylose’s vulnerability todegradation at acidic hydrolysisconditions.
R2 = 0.66
0
0.01
0.02
0.03
0.04
0.05
0 2 4 6 8 10Glucose concentration (g/L)
HM
F co
ncen
trat
ion
(g/L
)
R2 = 0.98
0
0.1
0.2
0.3
0.4
0.5
0 1 2 3Xylose concentration (g/L)
Furf
ural
con
cent
ratio
n (g
/L)
Figure 1: Correlation between initialmonosaccharides concentration anddegradation products in originalhydrolyzates of aspen and pine. (A)glucose against HMF and (B) xyloseagainst furfural
Fermentation of the OriginalHydrolyzates
The results of fermentation of theoriginal hydrolyzates from aspen andpine are shown in Figure 2. The glucoseutilization and ethanol production trendsshow that hydrolyzates produced at allseverities were readily fermentable.
A
B

Fermentability of Concentrated Sulfuric acid Hydrolyzates from Aspenwood and Pinewood
205 Tanzania Journal of Engineering and Technology (Tanz. J. Engrg. Technol.), Vol. 39 (No. 2), Dec. 2020
Despite the differences in initial sugarconcentrations, complete glucoseutilization were observed after 23 hoursfor all aspen (Figure 2A) and pine(Figure 2B) hydrolyzates. The glucoseconsumption rate calculated over thefermentation period of 23 hours seemedto depend largely on the initial glucoseconcentration in the hydrolyzates andincreased as the initial glucoseconcentration increased. A similarobservation on increase in fermentationrate as a function of initial hexosesconcentration has been reported byRobinson et al. (2003). The maximumethanol concentration was stronglypositive linearly correlated (R2 = 0.96) tothe initial hexoses concentration. Themaximum ethanol produced in pinehydrolyzates was relative higher than inaspen due to the presence of mannoseand galactose, which are also utilized byS. cerevisiae ATCC 96581 as a carbonsource after glucose utilization. Theethanol yield data showed that themaximum theoretical ethanol yields inthe original hydrolyzates ranged from68% to 90%, with hydrolyzatesproduced at moderate severities showingthe best yields of about 85% (aspen) and83% (pine).
The sugar utilization and ethanolproduction patterns for all threehydrolyzates produced at differentseverities from aspen (Figure 2A) andpine (Figure 2B) did not show anysignificant inhibition effect to themicroorganisms. This was attributed tothe low levels of inhibitors in thesehydrolyzates (Table 2).
0
1
2
3
4
5
6
7
0 10 20 30Fermentation time (Hrs)
Glu
cose
con
cent
ratio
n (g
/L)
0
1
2
3
4
Etha
nol c
once
ntra
tion
(g/L
)
0
1
2
3
4
5
6
7
8
0 10 20 30Fermentation time (Hrs)
Glu
cose
con
cent
ratio
n (g
/L)
0
1
2
3
4
5
Etha
nol c
once
ntra
tion
(g/L
)
Figure 2: Fermentation profiles oforiginal hydrolyzates derived fromtwo-stage concentrated sulphuric acidhydrolysis. Glucose consumption(open symbols), ethanol production(filled symbols). : Moderateseverity, : Mild severity, : Highseverity. (A) Aspen (B) Pine.
Effect of Inhibitors on theFermentation of OriginalHydrolyzates
Lack of correlation between inhibitorsconcentration and maximum ethanolyield and glucose consumption ratesuggests the same observation. Thereported inhibitory levels of fur furaland HMF to S. cerevisiae ATCC 96581and other ethanologenic yeasts are 2 g/Land 3 g/L, respectively (Sanchez andBautista, 1988; Boyer et al., 1992;Keating et al., 2006), which issignificantly higher than theconcentrations found in ourhydrolyzates. However, a fairy strongpositive linear correlation (R2 = 0.84)was observed between HMFconcentration and the volumetric ethanolproductivity. This correlation cannot be
A
B

Kando K. Janga, Nils Dyrset, Karin Øyaas, Størker T. Moe
Tanzania Journal of Engineering and Technology (Tanz. J. Engrg. Technol.), Vol. 39 (No. 2), Dec. 2020 206
explained precisely by the data gatheredin this study due to the low levels ofHMF in the hydrolyzates. However, itcan probably be related to the ability ofS. cerevisiae ATCC 96581 to assimilateHMF and convert it to the less toxiccompound 5-hydroxymethylfurfurylalcohol and consequently diminishing itsinhibitory effect (Taherzadeh et al.,2000). Product (ethanol) inhibition wasnot anticipated in these hydrolyzatesbecause the maximum ethanolconcentration reached was only 3.3 g/Land 4.7 g/L in aspen and pinerespectively. These ethanolconcentration values were far from theethanol inhibitory level of S. cerevisiaeATCC 96581 and other S. cerevisiaespecies, which can tolerate up to 15%ethanol concentration (Ghareib et al.,1988; Geng et al., 2010).
Fermentation of ConcentratedHydrolyzates
The results of chemical composition ofthe concentrated aspen and pinehydrolyzates after vacuum evaporationprocess and furfural replenishment andsubsequent fermentation are shown inTable 3. The ratio of monosaccharidesin the original to concentratedhydrolyzates appeared to be constant.This crosschecking indicated that therewas no noticeable sugar degradationduring the vacuum concentrationprocess. The highest C-6 sugarconcentrations reached about 44.45 g/Land 69.33 g/L for concentrated samplesproduced at moderate severity fromaspen and pine, respectively. For themost important inhibitors, the highestconcentrations were 2.09 g/L, 0.26 g/Land 10.07 g/L for furfural, HMF andacetic acid, respectively.
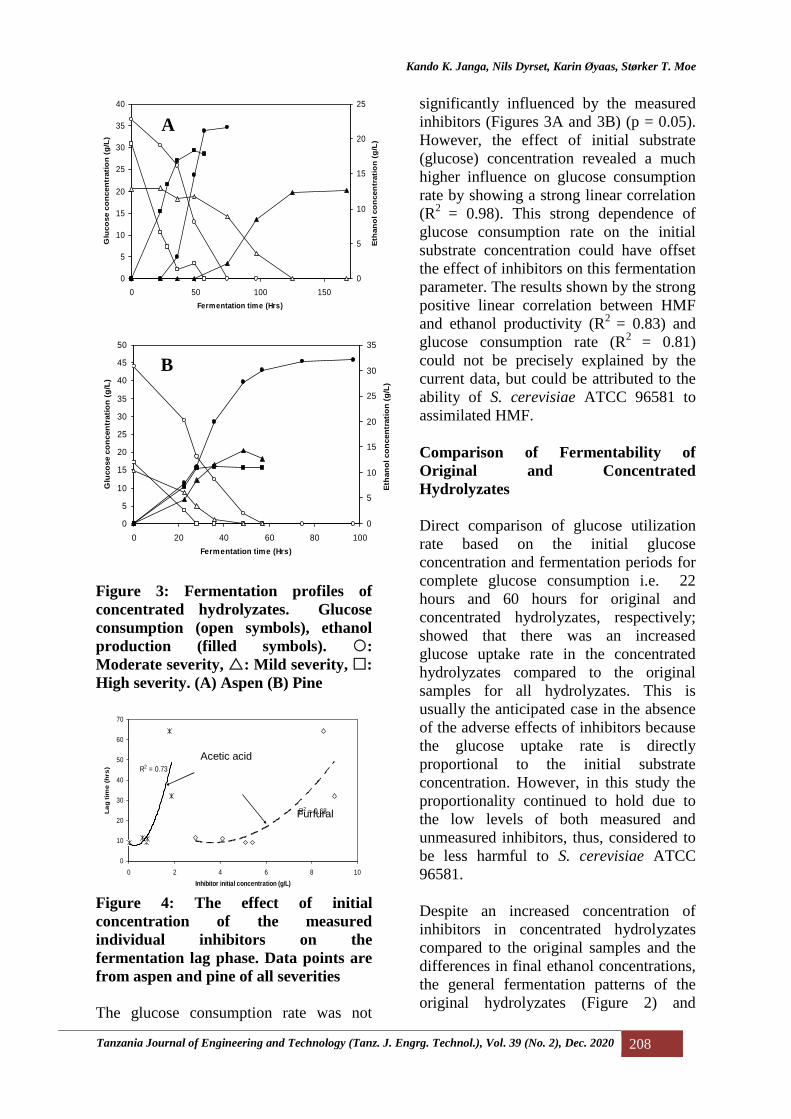
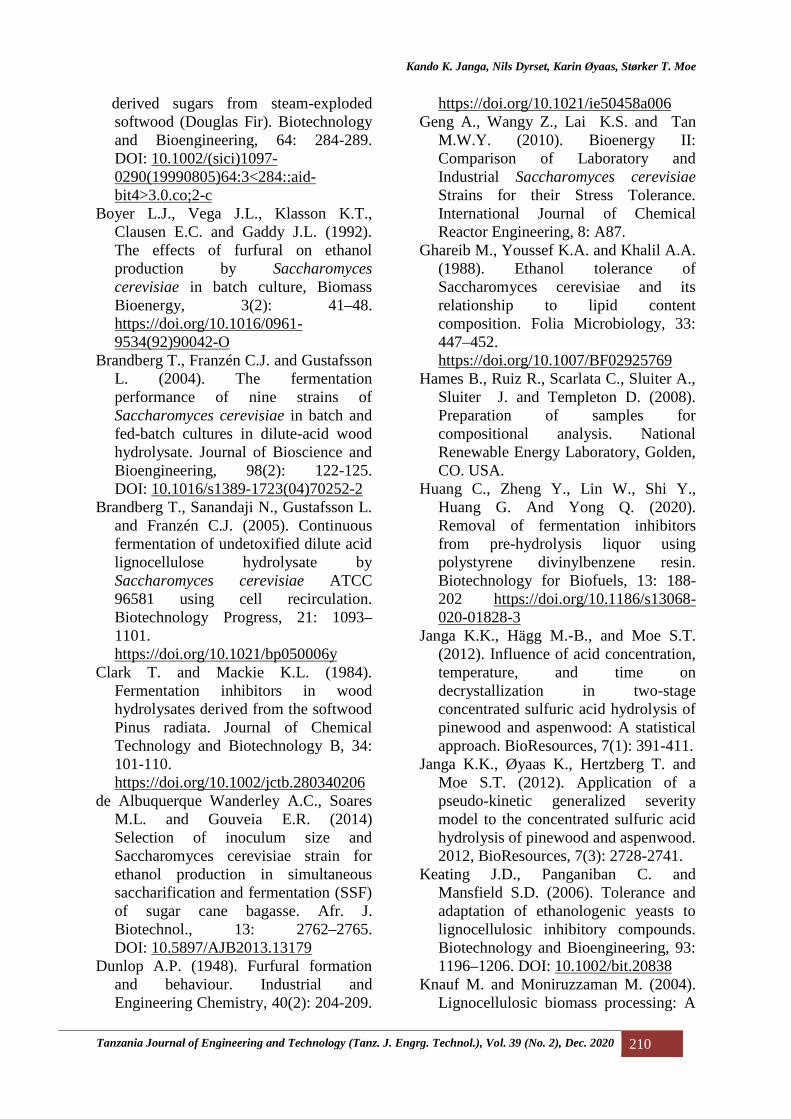
The results of fermentation profiles ofconcentrated hydrolyzates of aspen andpine are shown in Figure 3. The glucoseutilization curves show complete
glucose consumption after about 60hours of fermentation in all samplesexcept the aspen sample hydrolyzed atmild severity which showed a markedlyincreased lag phase (Figure 3A). Theethanol production curves show that theaspen and pine concentrated samplesproduced at moderate severity had thehighest ethanol concentration of about21.0 g/L and 32.0 g/L, respectively. Thiswas anticipated because these sampleshad a relatively high concentration offermentable sugars (hexoses) ascompared to those at low and highseverity for both aspen and pine.However, all samples at all severities inaspen and pine showed excellenttheoretical ethanol yields of above 97%on hexoses except the pine hydrolyzatesat mild severity which had a fairy goodyield of 87%. The fermentationcharacterizing parameters (maximumethanol yield, glucose consumption rateand volumetric ethanol productivity) foreach of the three hydrolyzates in aspenand pine are summarized in Table 3.
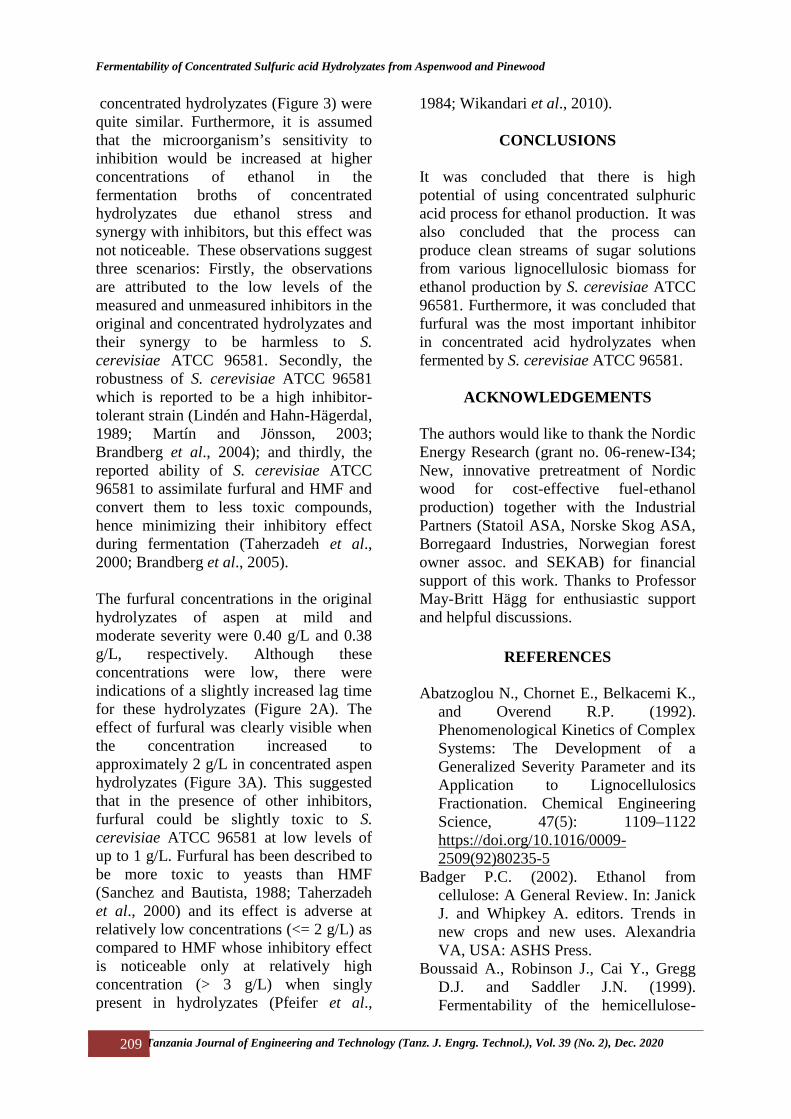
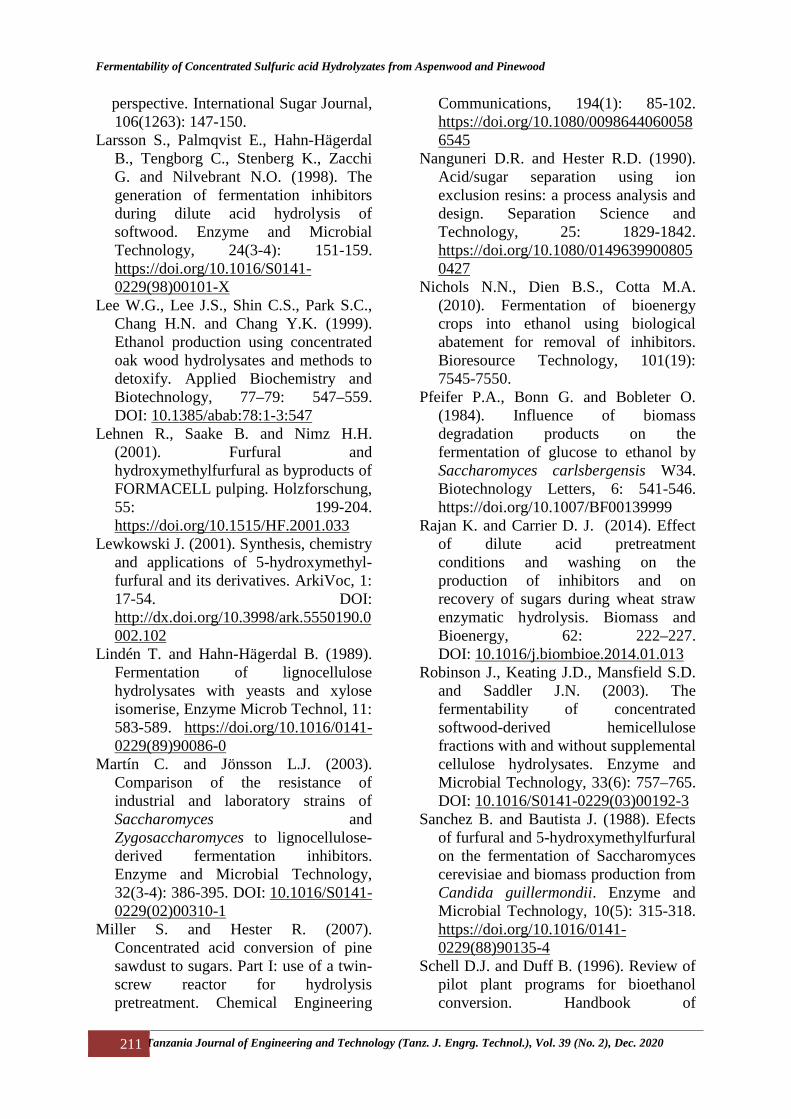
The increase in concentration of themeasured inhibitors after concentratinghydrolyzates resulted in a noticeableinhibitory effect revealed by a prolongedfermentation lag phase for concentratedaspen samples hydrolyzed at mild andmoderate severities (Figure 3A). Nofermentation lag phase was clearlyobserved for pine concentrated samplesof all severities (Figure 3B). A plot ofthe initial concentrations of inhibitors asfunction of fermentation lag times(Figure 4) showed that the lag phaseincreased as furfural concentrationincreased, with a fairly reasonable, butweak correlation (R2 = 0.73). Inspectionof the composition of each of theconcentrated samples, which revealedsignificant fermentation lag times i.e.concentrated aspen samples at mild andmoderate severities show that thesesamples had higher furfuralconcentration (~2 g/L) as compared to

Fermentability of Concentrated Sulfuric acid Hydrolyzates from Aspenwood and Pinewood
207 Tanzania Journal of Engineering and Technology (Tanz. J. Engrg. Technol.), Vol. 39 (No. 2), Dec. 2020
the rest from aspen and pine. Furfuralhas been reported to impose stronginhibition to S. cerevisiae ATCC 96581in hydrolyzates at a concentration ofabout 2 g/L (Boyer et al., 1992) and toS. cerevisiae 87 in hydrolyzates at aconcentration of about 0.2% (Sanchezand Bautista, 1988). Apart from aceticacid, which showed a weaker positivecorrelation (R2 = 0.68) with fermentationlag time, the rest of the individualmeasured inhibitors shown in Table 3did not show any inhibition correlationwith the lag time. The simple cumulativeof all measured inhibitors shown inTable 3 did not show any correlationwith the fermentation lag time.
Effect of Inhibitors on the ExtentFermentation of ConcentratedHydrolyzates
The final or maximum ethanolproduction was not influenced by the
measured inhibitors. This is apparentlyvisible in Figure 3 which shows thatdespite the increased lag time for aspensamples at mild and moderate severities,fermentation continued to maximumethanol concentration and completeglucose consumption for all aspen andpine samples of all severities withexcellent ethanol theoretical yields. Theeffect of furfural on ethanol productivityis linked to its effect on the lag phase.Increasing furfural concentrationincreased the lag time (Figure 4),consequently this resulted in increasingthe fermentation time and decreases involumetric ethanol productivity. Thedecreased volumetric ethanolproductivity upon furfural concentrationincrease has also been reported byKeating et al. (2006) when fermentingfurfural-supplemented syntheticmixtures of hexoses using the yeast S.cerevisiae Y-1528 and Larsson et al.,1998 using Baker’s yeast (S. cerevisiae).
Table 3: Chemical composition and fermentation of concentrated hydrolyzatesfrom aspen and scots pine
Sample
Monosugar concentration(g/L) a
Inhibitor concentration(g/L) a Fermentation parameters b
Glc Xyl Gal Ara Man HMF Furf. Form. AcOH Lev. LT Grc YEtOH QEtOH
c
Aspen Hi 37.02 5.57 0.39 0.27 1.41 0.17 0.87 3.34 6.09 3.00 9.00 0.51 0.50 0.29
Aspen Mod 41.47 14.01 0.49 0.36 2.49 0.18 2.09 5.45 10.07 3.02 32.00 0.61 0.53 0.33
Aspen Mil 23.16 11.51 0.47 0.34 1.95 0.12 2.01 4.79 9.55 2.14 64.00 0.34 0.55 0.00
Pine Hi 20.15 0.17 0.63 0.02 2.65 0.13 0.05 4.06 5.70 6.94 9.00 0.29 0.52 0.18
Pine Mod 52.30 5.02 1.92 0.95 15.11 0.26 0.70 3.66 3.27 4.00 11.50 0.73 0.52 0.50
Pine Mil 17.41 4.73 1.87 0.96 12.97 0.14 0.92 2.67 4.59 1.91 11.00 0.25 0.44 0.21
aGlc-Glucose; Xyl-Xylose; Gal-Galactose; Ara-Arabinose; Man-Mannose; HMF-5-hydroxymethylfurfural, Furf.- Furfural; Form.-Formic acid; Lev.-Levulinic acid; AcOH.-Acetic acid.bGr – Glucose consumption rate (g glucose ·L-1·h-1 ); YEtOH – Maximum ethanol yield (gethanol / g hexoses); QEtOH – Volumetric ethanol productivity (g ethanol ·L-1·h-1); LT-Lag time (hrs): calculated as time to reach 5% of maximum ethanol production (Nicholset al., 2010).c Values calculated over a fermentation period of 60 hours.
Kando K. Janga, Nils Dyrset, Karin Øyaas, Størker T. Moe
Tanzania Journal of Engineering and Technology (Tanz. J. Engrg. Technol.), Vol. 39 (No. 2), Dec. 2020 208
0
5
10
15
20
25
30
35
40
0 50 100 150Fermentation time (Hrs)
Glu
cose
co
nce
ntr
atio
n (
g/L
)
0
5
10
15
20
25
Eth
ano
l co
nce
ntr
atio
n (
g/L
)
0
5
10
15
20
25
30
35
40
45
50
0 20 40 60 80 100Fermentation time (Hrs)
Glu
cose
con
cent
ratio
n (g
/L)
0
5
10
15
20
25
30
35
Etha
nol c
once
ntra
tion
(g/L
)
Figure 3: Fermentation profiles ofconcentrated hydrolyzates. Glucoseconsumption (open symbols), ethanolproduction (filled symbols). :Moderate severity,: Mild severity, :High severity. (A) Aspen (B) Pine
R2 = 0.73
R2 = 0.68
0
10
20
30
40
50
60
70
0 2 4 6 8 10Inhibitor initial concentration (g/L)
Lag
time
(hrs
)
Figure 4: The effect of initialconcentration of the measuredindividual inhibitors on thefermentation lag phase. Data points arefrom aspen and pine of all severities
The glucose consumption rate was not
significantly influenced by the measuredinhibitors (Figures 3A and 3B) (p = 0.05).However, the effect of initial substrate(glucose) concentration revealed a muchhigher influence on glucose consumptionrate by showing a strong linear correlation(R2 = 0.98). This strong dependence ofglucose consumption rate on the initialsubstrate concentration could have offsetthe effect of inhibitors on this fermentationparameter. The results shown by the strongpositive linear correlation between HMFand ethanol productivity (R2 = 0.83) andglucose consumption rate (R2 = 0.81)could not be precisely explained by thecurrent data, but could be attributed to theability of S. cerevisiae ATCC 96581 toassimilated HMF.
Comparison of Fermentability ofOriginal and ConcentratedHydrolyzates
Direct comparison of glucose utilizationrate based on the initial glucoseconcentration and fermentation periods forcomplete glucose consumption i.e. 22hours and 60 hours for original andconcentrated hydrolyzates, respectively;showed that there was an increasedglucose uptake rate in the concentratedhydrolyzates compared to the originalsamples for all hydrolyzates. This isusually the anticipated case in the absenceof the adverse effects of inhibitors becausethe glucose uptake rate is directlyproportional to the initial substrateconcentration. However, in this study theproportionality continued to hold due tothe low levels of both measured andunmeasured inhibitors, thus, considered tobe less harmful to S. cerevisiae ATCC96581.
Despite an increased concentration ofinhibitors in concentrated hydrolyzatescompared to the original samples and thedifferences in final ethanol concentrations,the general fermentation patterns of theoriginal hydrolyzates (Figure 2) and
Furfural
Acetic acid
A
B
Fermentability of Concentrated Sulfuric acid Hydrolyzates from Aspenwood and Pinewood
209 Tanzania Journal of Engineering and Technology (Tanz. J. Engrg. Technol.), Vol. 39 (No. 2), Dec. 2020
concentrated hydrolyzates (Figure 3) werequite similar. Furthermore, it is assumedthat the microorganism’s sensitivity toinhibition would be increased at higherconcentrations of ethanol in thefermentation broths of concentratedhydrolyzates due ethanol stress andsynergy with inhibitors, but this effect wasnot noticeable. These observations suggestthree scenarios: Firstly, the observationsare attributed to the low levels of themeasured and unmeasured inhibitors in theoriginal and concentrated hydrolyzates andtheir synergy to be harmless to S.cerevisiae ATCC 96581. Secondly, therobustness of S. cerevisiae ATCC 96581which is reported to be a high inhibitor-tolerant strain (Lindén and Hahn-Hägerdal,1989; Martín and Jönsson, 2003;Brandberg et al., 2004); and thirdly, thereported ability of S. cerevisiae ATCC96581 to assimilate furfural and HMF andconvert them to less toxic compounds,hence minimizing their inhibitory effectduring fermentation (Taherzadeh et al.,2000; Brandberg et al., 2005).
The furfural concentrations in the originalhydrolyzates of aspen at mild andmoderate severity were 0.40 g/L and 0.38g/L, respectively. Although theseconcentrations were low, there wereindications of a slightly increased lag timefor these hydrolyzates (Figure 2A). Theeffect of furfural was clearly visible whenthe concentration increased toapproximately 2 g/L in concentrated aspenhydrolyzates (Figure 3A). This suggestedthat in the presence of other inhibitors,furfural could be slightly toxic to S.cerevisiae ATCC 96581 at low levels ofup to 1 g/L. Furfural has been described tobe more toxic to yeasts than HMF(Sanchez and Bautista, 1988; Taherzadehet al., 2000) and its effect is adverse atrelatively low concentrations (<= 2 g/L) ascompared to HMF whose inhibitory effectis noticeable only at relatively highconcentration (> 3 g/L) when singlypresent in hydrolyzates (Pfeifer et al.,
1984; Wikandari et al., 2010).
CONCLUSIONS
It was concluded that there is highpotential of using concentrated sulphuricacid process for ethanol production. It wasalso concluded that the process canproduce clean streams of sugar solutionsfrom various lignocellulosic biomass forethanol production by S. cerevisiae ATCC96581. Furthermore, it was concluded thatfurfural was the most important inhibitorin concentrated acid hydrolyzates whenfermented by S. cerevisiae ATCC 96581.
ACKNOWLEDGEMENTS
The authors would like to thank the NordicEnergy Research (grant no. 06-renew-I34;New, innovative pretreatment of Nordicwood for cost-effective fuel-ethanolproduction) together with the IndustrialPartners (Statoil ASA, Norske Skog ASA,Borregaard Industries, Norwegian forestowner assoc. and SEKAB) for financialsupport of this work. Thanks to ProfessorMay-Britt Hägg for enthusiastic supportand helpful discussions.
REFERENCES
Abatzoglou N., Chornet E., Belkacemi K.,and Overend R.P. (1992).Phenomenological Kinetics of ComplexSystems: The Development of aGeneralized Severity Parameter and itsApplication to LignocellulosicsFractionation. Chemical EngineeringScience, 47(5): 1109–1122https://doi.org/10.1016/0009-2509(92)80235-5
Badger P.C. (2002). Ethanol fromcellulose: A General Review. In: JanickJ. and Whipkey A. editors. Trends innew crops and new uses. AlexandriaVA, USA: ASHS Press.
Boussaid A., Robinson J., Cai Y., GreggD.J. and Saddler J.N. (1999).Fermentability of the hemicellulose-
Kando K. Janga, Nils Dyrset, Karin Øyaas, Størker T. Moe
Tanzania Journal of Engineering and Technology (Tanz. J. Engrg. Technol.), Vol. 39 (No. 2), Dec. 2020 210
derived sugars from steam-explodedsoftwood (Douglas Fir). Biotechnologyand Bioengineering, 64: 284-289.DOI: 10.1002/(sici)1097-0290(19990805)64:3<284::aid-bit4>3.0.co;2-c
Boyer L.J., Vega J.L., Klasson K.T.,Clausen E.C. and Gaddy J.L. (1992).The effects of furfural on ethanolproduction by Saccharomycescerevisiae in batch culture, BiomassBioenergy, 3(2): 41–48.https://doi.org/10.1016/0961-9534(92)90042-O
Brandberg T., Franzén C.J. and GustafssonL. (2004). The fermentationperformance of nine strains ofSaccharomyces cerevisiae in batch andfed-batch cultures in dilute-acid woodhydrolysate. Journal of Bioscience andBioengineering, 98(2): 122-125.DOI: 10.1016/s1389-1723(04)70252-2
Brandberg T., Sanandaji N., Gustafsson L.and Franzén C.J. (2005). Continuousfermentation of undetoxified dilute acidlignocellulose hydrolysate bySaccharomyces cerevisiae ATCC96581 using cell recirculation.Biotechnology Progress, 21: 1093–1101.https://doi.org/10.1021/bp050006y
Clark T. and Mackie K.L. (1984).Fermentation inhibitors in woodhydrolysates derived from the softwoodPinus radiata. Journal of ChemicalTechnology and Biotechnology B, 34:101-110.https://doi.org/10.1002/jctb.280340206
de Albuquerque Wanderley A.C., SoaresM.L. and Gouveia E.R. (2014)Selection of inoculum size andSaccharomyces cerevisiae strain forethanol production in simultaneoussaccharification and fermentation (SSF)of sugar cane bagasse. Afr. J.Biotechnol., 13: 2762–2765.DOI: 10.5897/AJB2013.13179
Dunlop A.P. (1948). Furfural formationand behaviour. Industrial andEngineering Chemistry, 40(2): 204-209.
https://doi.org/10.1021/ie50458a006Geng A., Wangy Z., Lai K.S. and Tan
M.W.Y. (2010). Bioenergy II:Comparison of Laboratory andIndustrial Saccharomyces cerevisiaeStrains for their Stress Tolerance.International Journal of ChemicalReactor Engineering, 8: A87.
Ghareib M., Youssef K.A. and Khalil A.A.(1988). Ethanol tolerance ofSaccharomyces cerevisiae and itsrelationship to lipid contentcomposition. Folia Microbiology, 33:447–452.https://doi.org/10.1007/BF02925769
Hames B., Ruiz R., Scarlata C., Sluiter A.,Sluiter J. and Templeton D. (2008).Preparation of samples forcompositional analysis. NationalRenewable Energy Laboratory, Golden,CO. USA.
Huang C., Zheng Y., Lin W., Shi Y.,Huang G. And Yong Q. (2020).Removal of fermentation inhibitorsfrom pre-hydrolysis liquor usingpolystyrene divinylbenzene resin.Biotechnology for Biofuels, 13: 188-202 https://doi.org/10.1186/s13068-020-01828-3
Janga K.K., Hägg M.-B., and Moe S.T.(2012). Influence of acid concentration,temperature, and time ondecrystallization in two-stageconcentrated sulfuric acid hydrolysis ofpinewood and aspenwood: A statisticalapproach. BioResources, 7(1): 391-411.
Janga K.K., Øyaas K., Hertzberg T. andMoe S.T. (2012). Application of apseudo-kinetic generalized severitymodel to the concentrated sulfuric acidhydrolysis of pinewood and aspenwood.2012, BioResources, 7(3): 2728-2741.
Keating J.D., Panganiban C. andMansfield S.D. (2006). Tolerance andadaptation of ethanologenic yeasts tolignocellulosic inhibitory compounds.Biotechnology and Bioengineering, 93:1196–1206. DOI: 10.1002/bit.20838
Knauf M. and Moniruzzaman M. (2004).Lignocellulosic biomass processing: A
Fermentability of Concentrated Sulfuric acid Hydrolyzates from Aspenwood and Pinewood
211 Tanzania Journal of Engineering and Technology (Tanz. J. Engrg. Technol.), Vol. 39 (No. 2), Dec. 2020
perspective. International Sugar Journal,106(1263): 147-150.
Larsson S., Palmqvist E., Hahn-HägerdalB., Tengborg C., Stenberg K., ZacchiG. and Nilvebrant N.O. (1998). Thegeneration of fermentation inhibitorsduring dilute acid hydrolysis ofsoftwood. Enzyme and MicrobialTechnology, 24(3-4): 151-159.https://doi.org/10.1016/S0141-0229(98)00101-X
Lee W.G., Lee J.S., Shin C.S., Park S.C.,Chang H.N. and Chang Y.K. (1999).Ethanol production using concentratedoak wood hydrolysates and methods todetoxify. Applied Biochemistry andBiotechnology, 77–79: 547–559.DOI: 10.1385/abab:78:1-3:547
Lehnen R., Saake B. and Nimz H.H.(2001). Furfural andhydroxymethylfurfural as byproducts ofFORMACELL pulping. Holzforschung,55: 199-204.https://doi.org/10.1515/HF.2001.033
Lewkowski J. (2001). Synthesis, chemistryand applications of 5-hydroxymethyl-furfural and its derivatives. ArkiVoc, 1:17-54. DOI:http://dx.doi.org/10.3998/ark.5550190.0002.102
Lindén T. and Hahn-Hägerdal B. (1989).Fermentation of lignocellulosehydrolysates with yeasts and xyloseisomerise, Enzyme Microb Technol, 11:583-589. https://doi.org/10.1016/0141-0229(89)90086-0
Martín C. and Jönsson L.J. (2003).Comparison of the resistance ofindustrial and laboratory strains ofSaccharomyces andZygosaccharomyces to lignocellulose-derived fermentation inhibitors.Enzyme and Microbial Technology,32(3-4): 386-395. DOI: 10.1016/S0141-0229(02)00310-1
Miller S. and Hester R. (2007).Concentrated acid conversion of pinesawdust to sugars. Part I: use of a twin-screw reactor for hydrolysispretreatment. Chemical Engineering
Communications, 194(1): 85-102.https://doi.org/10.1080/00986440600586545
Nanguneri D.R. and Hester R.D. (1990).Acid/sugar separation using ionexclusion resins: a process analysis anddesign. Separation Science andTechnology, 25: 1829-1842.https://doi.org/10.1080/01496399008050427
Nichols N.N., Dien B.S., Cotta M.A.(2010). Fermentation of bioenergycrops into ethanol using biologicalabatement for removal of inhibitors.Bioresource Technology, 101(19):7545-7550.
Pfeifer P.A., Bonn G. and Bobleter O.(1984). Influence of biomassdegradation products on thefermentation of glucose to ethanol bySaccharomyces carlsbergensis W34.Biotechnology Letters, 6: 541-546.https://doi.org/10.1007/BF00139999
Rajan K. and Carrier D. J. (2014). Effectof dilute acid pretreatmentconditions and washing on theproduction of inhibitors and onrecovery of sugars during wheat strawenzymatic hydrolysis. Biomass andBioenergy, 62: 222–227.DOI: 10.1016/j.biombioe.2014.01.013
Robinson J., Keating J.D., Mansfield S.D.and Saddler J.N. (2003). Thefermentability of concentratedsoftwood-derived hemicellulosefractions with and without supplementalcellulose hydrolysates. Enzyme andMicrobial Technology, 33(6): 757–765.DOI: 10.1016/S0141-0229(03)00192-3
Sanchez B. and Bautista J. (1988). Efectsof furfural and 5-hydroxymethylfurfuralon the fermentation of Saccharomycescerevisiae and biomass production fromCandida guillermondii. Enzyme andMicrobial Technology, 10(5): 315-318.https://doi.org/10.1016/0141-0229(88)90135-4
Schell D.J. and Duff B. (1996). Review ofpilot plant programs for bioethanolconversion. Handbook of
Kando K. Janga, Nils Dyrset, Karin Øyaas, Størker T. Moe
Tanzania Journal of Engineering and Technology (Tanz. J. Engrg. Technol.), Vol. 39 (No. 2), Dec. 2020 212
Bioethanology: Production andutilization. Ed. Wyman C.E., Taylor &Francis, Washington, D.C., 381–394.
Sluiter A., Hames B., Ruiz R., Scarlata C.,Sluiter J. and Templeton D. (2008a).Determination of ash in biomass.National Renewable EnergyLaboratory, Golden, CO. USA.
Sluiter A., Hames B., Ruiz R., Scarlata C.,Sluiter J., Templeton D. and Crocker D.(2008b). Determination of structuralcarbohydrates and lignin in biomass.National Renewable EnergyLaboratory, Golden, CO. USA.
Sluiter A., Ruiz R., Scarlata C., Sluiter J.and Templeton D. (2008c).Determination of extractives inbiomass. National Renewable EnergyLaboratory, Golden, CO. USA.
Springfield R.M. and Hester R.D. (1999).Continuous ion-exclusionchromatography system for acid/sugarseparation. Separation Science andTechnology, 34(6-7): 1217-1241.https://doi.org/10.1080/01496399908951090
Sun Y. and Cheng J. (2002). Hydrolysis oflignocellulosic materials for ethanolproduction: A review. BioresourceTechnology, 83(1): 1-11.https://doi.org/10.1016/S0960-8524(01)00212-7
Taherzadeh M.J., Eklund R., GustafssonL., Niklasson C. and Lidén G. (1997).Characterization and Fermentation of
Dilute-Acid Hydrolyzates from Wood.Industrial and Engineering ChemistryResearch, 36(11): 4659-4665.https://doi.org/10.1021/ie9700831
Taherzadeh M.J., Gustafsson L., NiklassonC. and Lidén G. (2000). Physiologicaleffects of 5-hydroxymethylfurfural onSaccharomyces cerevisiae. AppliedMicrobiology and Biotechnology, 53:701–708.https://doi.org/10.1007/s002530000328
Vogel K.P., Dien B. S, Jung H.G., CaslerM. D., Masterson S. D., Mitchell R. B.,(2011). Quantifying Actual andTheoretical Ethanol Yields forSwitchgrass Strains Using NIRSAnalyses. Bioenerg. Res., 4: 96–110.DOI 10.1007/s12155-010-9104-4
Wayman M. and Parekh S.R. (1987).Hydrolysis and fermentation of Africanpine. Biotechnology Letters, 9: 445-446.
Weydahl K.R. (2010). Method ofProduction of Alcohol. WIPO PatentApplication, WO/2010/038021.
Wikandari R., Millati R., Syamsiyah S.,Muriana R. and Ayuningsih Y. (2010).Effect of furfural,hydroxymethylfurfural and acetic acidon indigenous microbial isolate forbioethanol production. AgriculturalJournal, 2: 105–109.DOI: 10.3923/aj.2010.105.109