Embed Size (px)
Citation preview

Remote Sensing of Drought
Lecture 9

What is drought?
• Drought is a normal, recurrent feature of climate. It occurs almost everywhere, although its features vary from region to region. Defining drought is therefore difficult
• Conceptual definition of drought– A protracted period of deficient precipitation resulting in
extensive damage to crops, resulting in loss of yield
• Operational definitions of drought– Meteorological drought (region specific)– Agricultural drought (not enough soil moisture for crop needs)– Hydrological drought (deficiency in water suppliers at a
watershed or river basin scale)– Socioeconomic drought (affect people and food supply)


Monitoring drought
• Since no single definition of drought, so there are various indicators of drought
• Palmer drought index (PDI)– Use T and rainfall– More efficient for long term drought (several months)
• Standardized precipitation index (SPI)– Use rainfall only– The SPI can be used to monitor conditions on a variety of time
scales. This temporal flexibility allows the SPI to be useful in both short-term agricultural and long-term hydrological applications
• Drought monitor– A comprehensive drought monitoring effort between the USDA
(JAWF/NRCS), NOAA/CPC (NCEP/NWS), NCDC (DOC/NOAA), and the National Drought Mitigation Center.
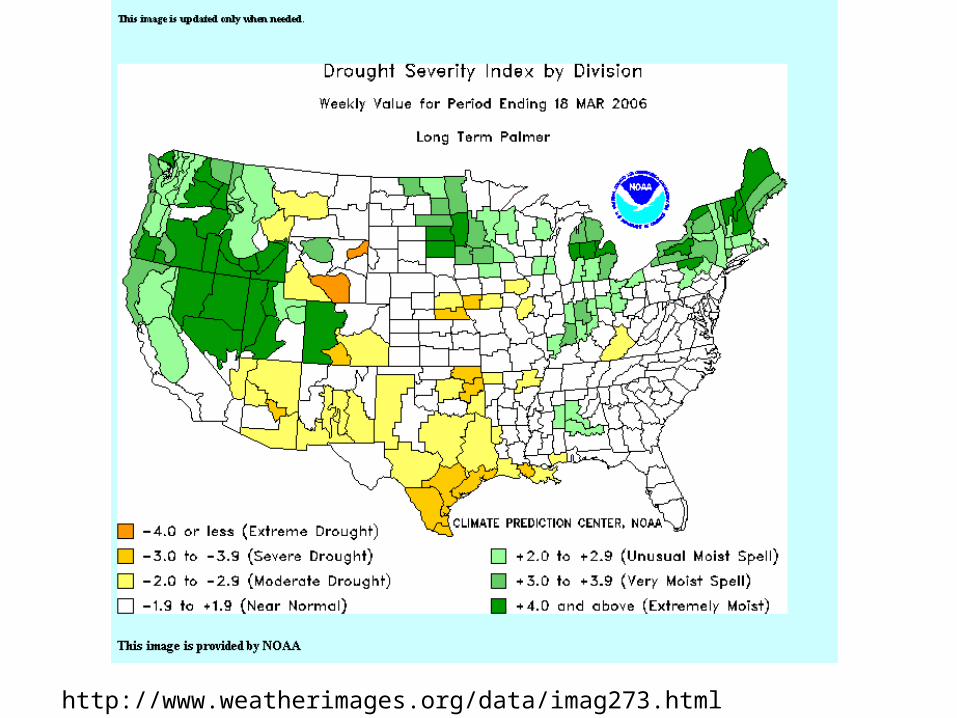
http://www.weatherimages.org/data/imag273.html

http://www.txwin.net/Monitoring/Meteorological/Drought/pdsi.htm
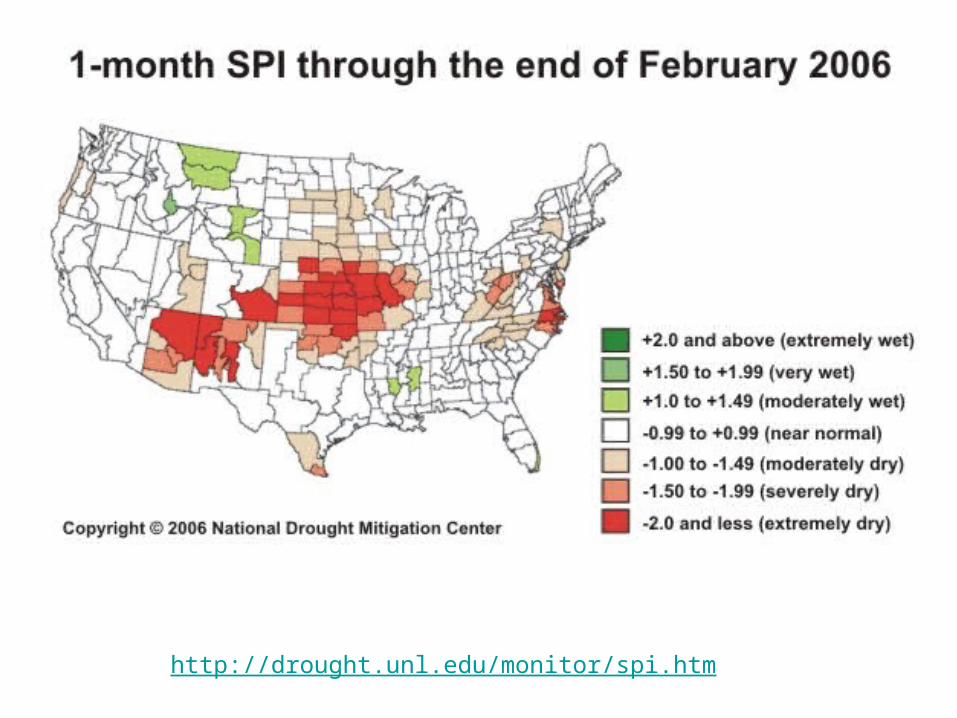
http://drought.unl.edu/monitor/spi.htm

Drought Monitor

http://drought.unl.edu/dm/archive.html

Remote sensing for drought monitoring
• Optical image: – AVHRR, Landsat, SPOT, and MODIS
• Thermal image:– Landsat, AVHRR, MODIS

-
1. Surface reflectance (%)2. NDVI3. Brightness temperature (K) at top of atmosphere4. Surface temperature (K)
1982-1999 AVHRR2000-present MODIS
Thenkabail et al. 2004

MODIS bands 31 (10.78-11.28) and 32 (11.77-12.27)

Current NDVI of a month – long term mean of the month
NDVI itself doesn’t reflect drought or not
Negative means below normal
VCI close to 50% means fair condition. Below 50% means below normal, below 35% is extreme drought.

TCI close to 50% means fair condition. Below 50% means below normal, 0% means very hot.

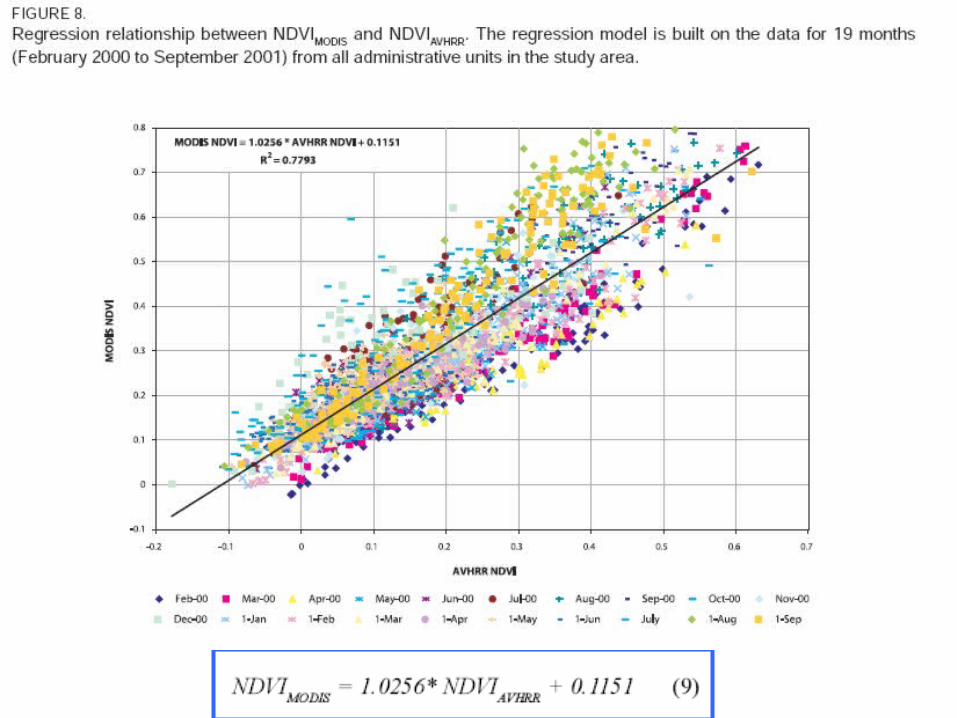
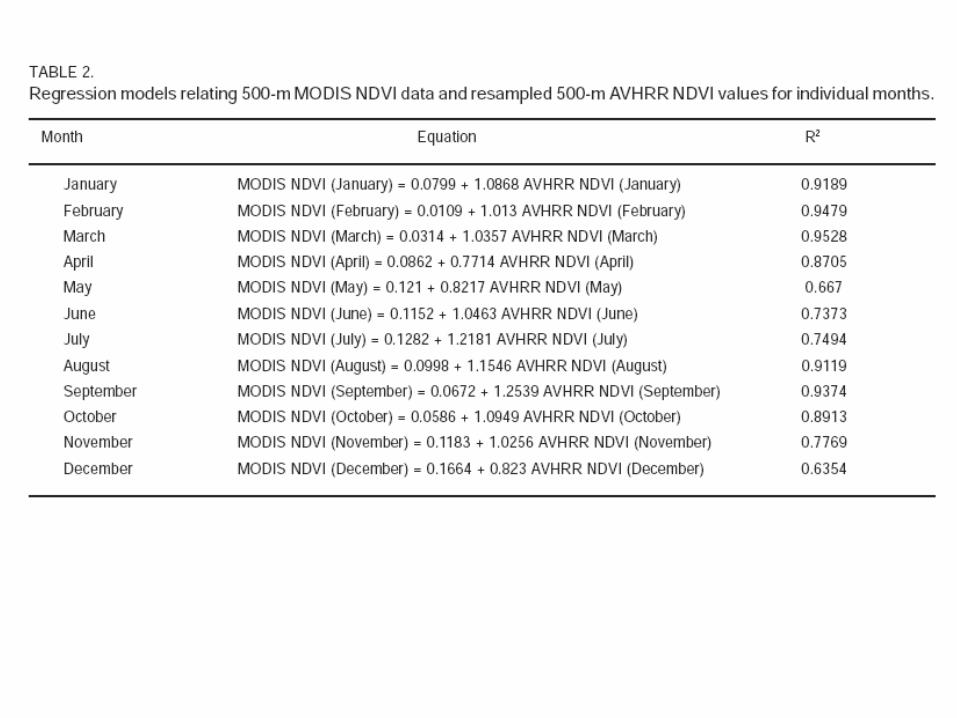
Linking AVHRR and MODIS for continuous drought assessment
• Differences: – preprocessing and spatial resolution (10km for AVHRR VS. 500 m
for MODIS)– Narrow bands of MODIS result in a greater dynamic range of NDVI
for the same given biomass than AVHRR (AVHRR is likely to “saturate” faster)
• Two datasets overlap in 2/2000-8/2001, which offers the opportunity to link NDVIAVHRR and NDVIMODIS
• NDVIAVHRR is monthly, NDVIMODIS is 16-day, so NDVIMODIS needs to composite to a 32-day product for comparison.
• Established regression models for two sources allow drought occurrences to be examined from 1982 to present, and well into future.


Study area was India and Pakistan

In most cases, the VCI and DEV complement each other, strong correlations. TCI mostly reflect surface T, is not so valid as VCI and DEV, is not suggested for use