Embed Size (px)
Citation preview
Remote Sensing Applications for Agriculture: A Feasibility Study
Austin Cross, M.Sc. International Agriculture Development Candidate
UC Davis
Winter Quarter 2019
2
Table of Contents
Introduction 3
Background and Context 3
Introducing Mars La Chola 7 Figure 1: Mars La Chola 7
Feasibility Study Contents 8 Figure 2: Zone Map 10 Figure 3: Digitized Zones 10 Figure 4: Soil Map 10 Figure 5: Digitized Soils 10 Figure 6: MicaSense electromagnetic band illustration 12 Figure 9: LAI Samples 15
Conclusion 15 Figure 10: Cacao Grove 17 Figure 11: Cacao Pods 17
3
Introduction
With the development of geospatial and imaging technologies, the potential
application for the agriculture industry increases. Remote sensing is becoming a vital
part of agricultural research and crop mass-production, especially in areas with limited
available labor. This technology can benefit farmers by helping them maximize their
input costs and increase yields (Santhosh, 2003.) However, many of these innovations
are inaccessible to rural producers, and if they are available, farmers often lack the
required skills and knowledge required to use the technology effectively. As technology
availability and adoption progress, knowledge transfer and application will become
equally important. This paper aims to identify these applications of geospatial
technologies for farms who have access to these tools. These applications were
researched through a feasibility study that was conducted with a large scale cacao
operation in Ecuador.
Background and Context
Remote sensing is the practice of using scientific data-recording instruments that
do not directly contact the targeted specimen or area. In addition, this field contains the
interpretation and application of this data. On a large scale, remote sensing assists the
task of land classification, making it possible to even distinguish sub-classes of similar
ground type. It also aids efforts in managing changes to the earth's surfaces such as
natural disasters, vegetation changes, or urban development. Compared to manual data
collection, remote sensing is more time and labor efficient because it can cover large
areas of land in a short time. It enables scientists to track and analyze physical
4
conditions, all the while recording the coordinates, or geolocation of the selected
attributes. (Khoram, 2012). This requires the remotely sensed data to be related to
physical measurements. These quantifiable relationships give insight into how the
information might be utilized. These applications are used in many sectors, including
agriculture and, in the context of this paper, application to the farm level.
Agriculture has been proven to have a significant impact on the economy of
developing countries (DFID, 2014). This industry has an important effect on the gross
domestic product of these nations and is often targeted by economists to contribute
towards poverty reduction (Cervantes-Godoy). This is why intentional and focused
efforts are made to stabilize or improve food systems along the entire market chain,
because of their capability to improve both food security and economic capacity. These
endeavors take many forms such as NGO efforts, extension services, policy writing,
government projects, and technological innovations. In this case, current geospatial
technologies will be examined and how it might contribute towards improving
agricultural operations.
Farm managers aim to maximize input costs such as labor, water, pesticides,
seeds, and fertilizer. Remote sensing offers the ability for farmers to analyze their
required inputs by giving data on each plant or study area, indicating individual needs.
This specialization is called precision agriculture. On a similar note, this technology
gives the opportunity for maximizing yields due to the ability to monitor the crop health
of an entire area. For example, a nitrogen deficient area can receive more fertilizer in
order to produce its maximum yield. Precision agriculture requires heavy data collection
5
and research in order to make actual input suggestions. However, these
recommendations are typically only studied and identified with major commodity crops
such as corn, wheat, and rice.
The demand for chocolate, which cacao is the main ingredient for, has gone up
17% in the decade, particularly in India and China (WCF, 2014). To meet this demand,
farmers had to start producing more cacao. Since 2000, global production has
increased by 50% (Wessel and Quist-Wessel, 2015). This increase has been primarily
due to newly farmed areas, which has forced large amounts of deforestation.
Sustainably increasing production per unit area is becoming the only viable solution to
the high demand of cacao due to the environmental impact of farm expansion.
Research, new technologies and better farming practices will contribute to higher yields
in order to meet rising demands for cacao.
15% of worldwide cacao is grown in South America and, in this region, the top
producing countries are Ecuador, Brazil, and Colombia (WCF, 2014). 90% of this cacao
is grown on small-scale, family owned farms. These farmers rely on their cacao yields
for their primary source of income. For them, growing more cacao means higher profits.
Research studies in Malaysia have shown the possibility of reaching 6300 kg/ha in
cacao yields (Yapp and Hadley, 1991). While these high yields are found possible,
actual yields in South America average 400-500 kg/ha. Farms that grow the CCN-51
intensively variety average 907 kg/ha, but can reach up to 2721.55 with intensive
practices (Boza, 2014).
6
There are several factors that lead to persistent yield gaps in cacao. Pest and
disease dramatically reduce yields. Common diseases include Witches Broom
(Moniliophthora perniciosa) and Frosty Pod Rot (Moniliophthora roreri). The cost of
maintenance for healthy farms that effectively control disease often exceeds the
producer’s budget (van Vliet and Giller, 2017). Additionally, declining soil conditions
lead to reduced production. Likewise, farmers are hesitant to invest in large amounts of
fertilizers and manually manage soil nutrients. This is because fertilization rates for
cacao are not clearly identified and proven, which is why it is uncommonly practiced in
cacao farming (Miller, 2019). To address this issue, D.Snoeck et al. conducted a study
in order to make a fertilization recommendation map of Ghana. This study used several
modeling techniques along with remote sensing data to make the identified
recommendations.
Climate change has impacted cacao production and will continue to do so as it
intensifies (Laderach, 2010). This is due to both the annual temperature and
precipitation fluxuations. Since most cacao farms are entirely rain fed, alterations in
these patterns disrupts the production cycle. This might push the industry towards
improved irrigation systems, which is common for intensive cacao production. Another
limiting factor is the available sunlight for cacao trees. This remains to be one of the
questions amongst cacao researchers, to determine the optimal amount of sun vs.
shade for the trees. Geospatial studies and LiDar imaging pose great tools in analyzing
available sunlight for tree canopies, and should be utilized to answer this research
question.
7
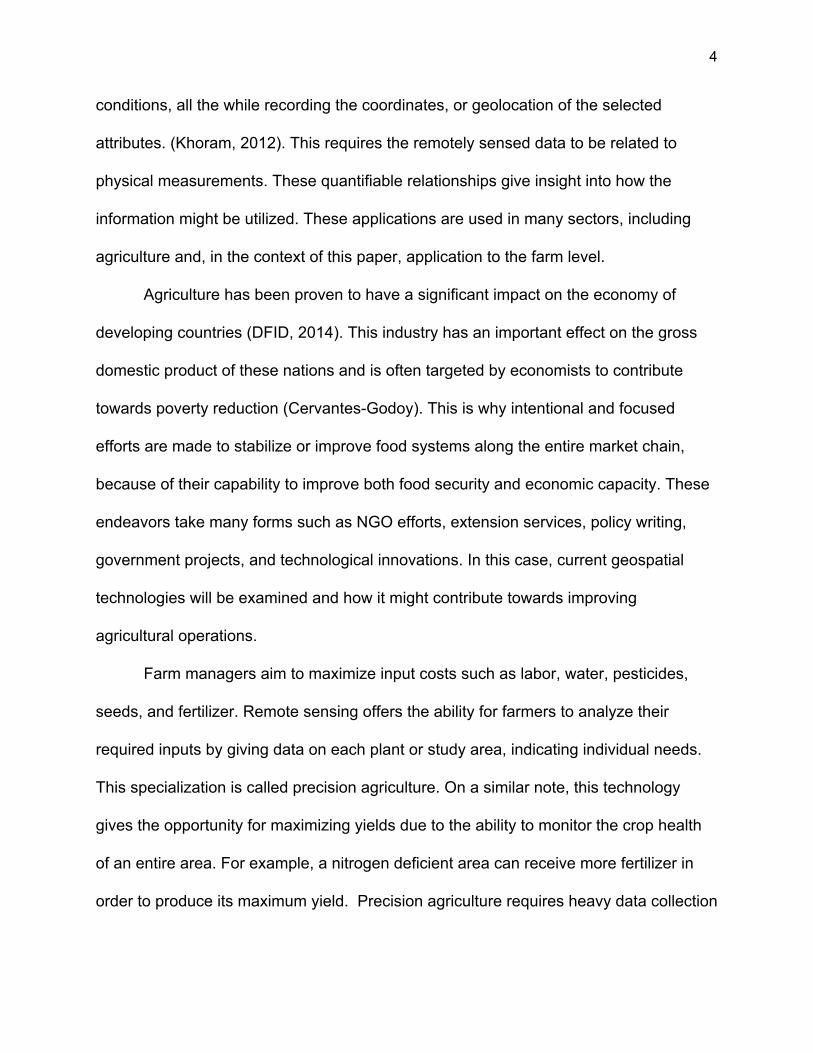
Introducing Mars La Chola
This feasibility study aims to analyze the remote sensing tools owned by Mars La
Chola and was initiated May 2018. This farm is 500 hectares and was acquired by Mars
Incorporated in 2016, but was first started in 1997. The farm is situated 40 miles away
from Ecuador’s largest city, Guayaquil. It is divided into 3 major sectors, then subdivided
into 32 lots, ranging from 4-34 hectares. This area has a tropical savanna climate, with
a rainy season that runs from January to April. The daily average temperature ranges
from 28-32 degrees Celsius. The farm location and climate conditions make it an
optimal area for growing cacao.
Figure 1: Mars La Chola
8
In terms of genetic varieties of cacao, Nacional and CCN-51 are grown on La
Chola. The Nacional variety offers an excellent flavor and market price, while the
CCN-51 variety “has a higher resistance to climate conditions and pathogens and
higher yields than other cocoa types and therefore is popular for cultivation by
Ecuadorian farmers” (Hermann et. al, 2015). 30% of the farm has shaded cacao,
meaning it is grown along side scattered native trees. This farm is unique because it
has access to several pieces of remote sensing technology. Although this is uncommon
for cacao farms, it is necessary for this study and if proven effective and feasible over
time, might increase popularity among cacao farmers.
La Chola is a carefully managed cacao farm with around 160 employees. During
the dry season from May to December, the farm is irrigated through a network of pipes
that connect to sprinklers and drip devices. During the rainy season, no additional
irrigation is necessary. Pesticides are applied as needed in localized areas. The farm is
also fertigated and pruned on a bimonthly basis. When pruning, the cuttings are left on
the ground to eventually become organic matter for the trees, as this has been an issue
for the soil. Most of the soils on the farm are inceptisols and several areas display high
salinity.
Feasibility Study Contents
For this feasibility study, direct contact was had with the research and
development team at Mars La Chola. This team consists of seven Ecuadorian scientists
who operate on the farm, conducting data gathering and a wide variety of agronomic
research pertaining to cacao. Two specific members of this team who collaborated on
9
this study are working to maximizing the use of remote sensing instruments. They are
also working to manage the vast datasets that come from the farm by using a software
called AgStudio. During this study, a summer visit to La Chola was able to further
develop the understanding of current field applications of this technology. During the
farm stay, the GIS database was designed for the farm and the team was worked with
to capture drone images of several plots of cacao. In addition, each piece of remote
sensing equipment was inspected.
One of the common applications of GIS is to store, manage, and visualize large
data sets. For La Chola, Microsoft Excel is currently used to record farm data such as
lot information and yield. One of the project goals was to construct a GIS based platform
for La Chola to visualize farm data. For the GIS software, ESRI ArcMaps was initially
used, however the La Chola research team preferred QGIS due to its open source
platform and the model was transferred to QGIS. The La Chola staff contracted a
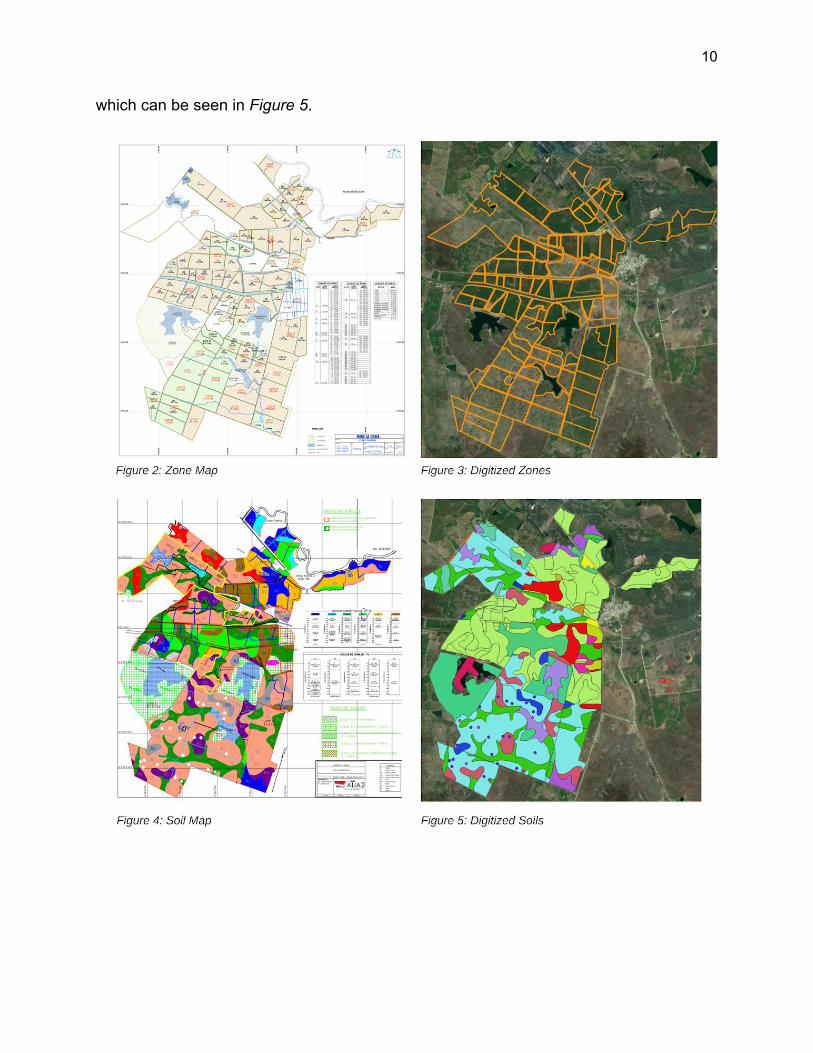
company to make a map of the farm, which distinguishes each lot. In order to put this
information into a GIS software, the farm map had to first be georegistered. This is the
process of placing the map precisely on the location that it represents. For this to work,
the GIS file must be in the same coordinate system as the formulated map. In this case,
the World Geodetic System 1984 (WGS84) was used. After this, the map and farm lots
were digitized into a vector shapefile as can be seen in Figure 3. The farm data excel
file was then joined to each lot in the GIS file, so the information for each lot could be
accessible through GIS as a shapefile attribute table. In addition to the lot information,
the La Chola research team followed these steps to make a digital soil map of the farm
10
which can be seen in Figure 5.
Figure 2: Zone Map Figure 3: Digitized Zones Figure 4: Soil Map Figure 5: Digitized Soils
11
During this study, aerial imagery data was collected and stored on a cloud
platform. This allowed easy sharing and collaboration for the large datasets, which
contained aerial photos of several cacao plots. The flights were conducted near the end
of the dry season in November. The images were taken at an elevation of 65 meters,
using a software called Drone Deploy to choose the flight plan and settings. 75%
overlap was used when recording the imagery. The R&D team has a DJI Inspire 2
drone that is used for the aerial imaging and a Parrot Sequoia camera that is used for
recording the imagery. Due to the light sensitivity of the camera, the flights were only
executed on days with either full sun or overcast. Spotted clouds are undesirable when
capturing images due to the fluctuation of radiation intensity on the camera sensor.
The Parrot Sequoia captures standard RGB images by using a Visible 16 MPixel
with a frame size of 4608 × 3456 pixels. These images are taken at lower elevations
than satellites and can be used for farm visualization and mapping. For the chosen
elevation, this resulted in a resolution of 1.75 cm/pixel. This map can be seen in Figure
9 This device also has a sensor that is also able to capture four different wavelengths at
1.2 MPixel with a frame size of 1280x960, or commonly known as bands. These include
the green, red, red-edge, and near infrared bands and has a wavelength range of
550-790 nanometers. The camera sensor is able to record the reflectance of radiation
from the sun’s energy on each pixel. “The amount of radiation reflected from plants is
inversely related to radiation absorbed by plant pigments, and varies with the
wavelength of incident radiation” (Santosh, 2003). Wavelength zones can be interpreted
singularly, or they can be manipulated and combined to formulate complex
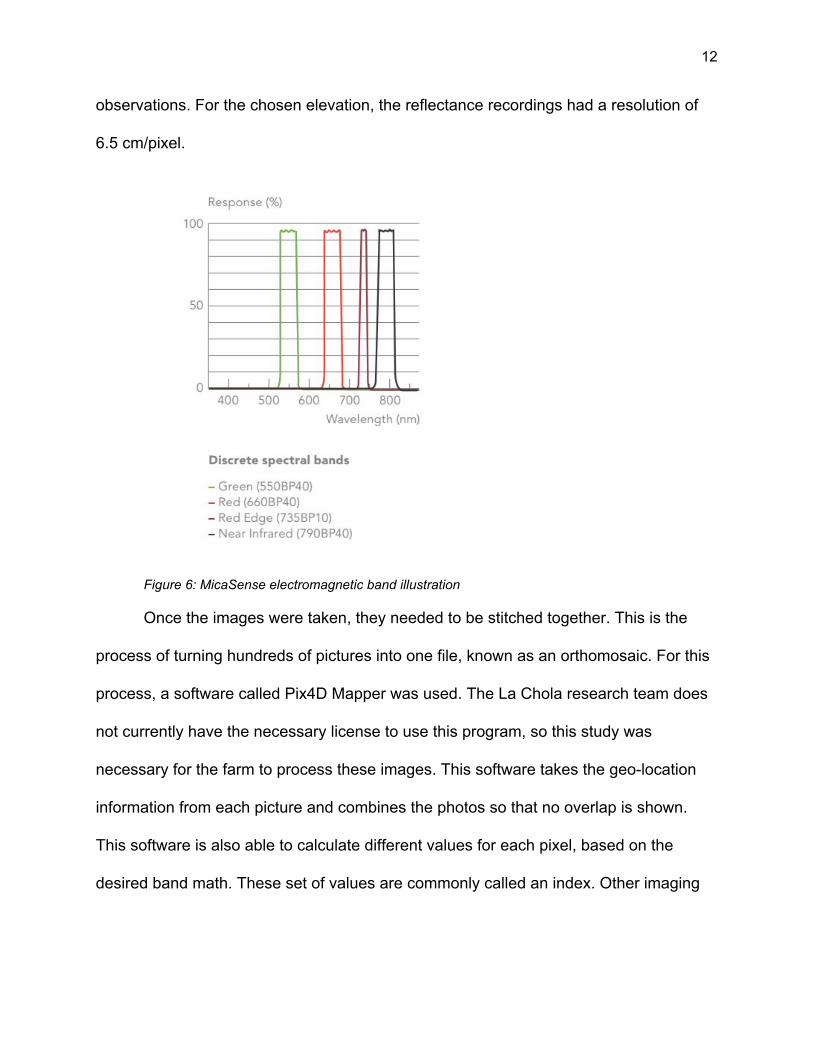
12
observations. For the chosen elevation, the reflectance recordings had a resolution of
6.5 cm/pixel.
Figure 6: MicaSense electromagnetic band illustration
Once the images were taken, they needed to be stitched together. This is the
process of turning hundreds of pictures into one file, known as an orthomosaic. For this
process, a software called Pix4D Mapper was used. The La Chola research team does
not currently have the necessary license to use this program, so this study was
necessary for the farm to process these images. This software takes the geo-location
information from each picture and combines the photos so that no overlap is shown.
This software is also able to calculate different values for each pixel, based on the
desired band math. These set of values are commonly called an index. Other imaging
13
softwares such as ENVI can do complex band math. Based on the chosen equation,
they help display a map of certain qualities and properties.
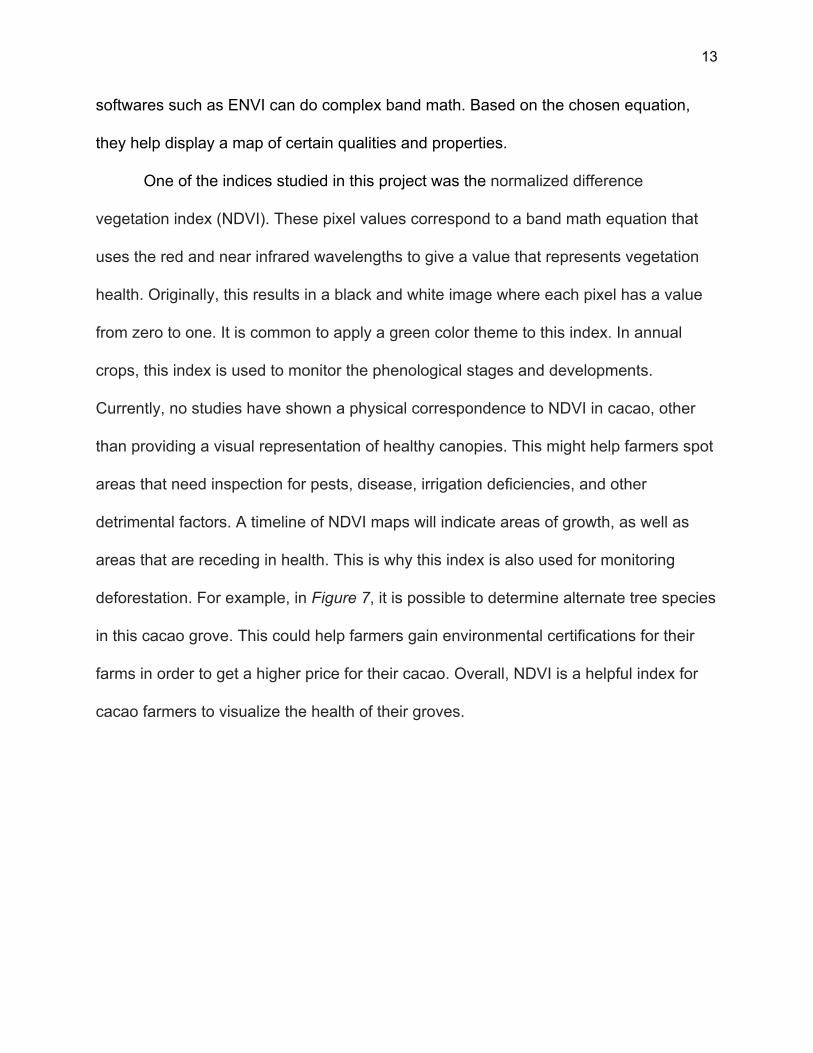
One of the indices studied in this project was the normalized difference
vegetation index (NDVI). These pixel values correspond to a band math equation that
uses the red and near infrared wavelengths to give a value that represents vegetation
health. Originally, this results in a black and white image where each pixel has a value
from zero to one. It is common to apply a green color theme to this index. In annual
crops, this index is used to monitor the phenological stages and developments.
Currently, no studies have shown a physical correspondence to NDVI in cacao, other
than providing a visual representation of healthy canopies. This might help farmers spot
areas that need inspection for pests, disease, irrigation deficiencies, and other
detrimental factors. A timeline of NDVI maps will indicate areas of growth, as well as
areas that are receding in health. This is why this index is also used for monitoring
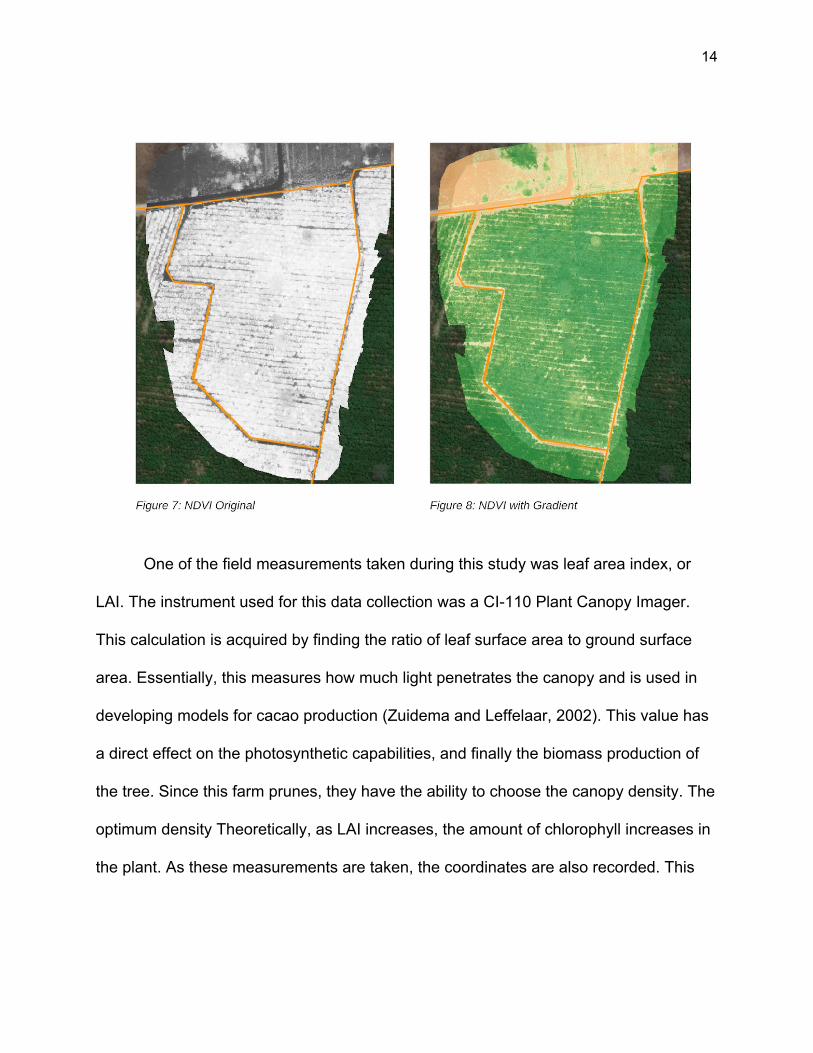
deforestation. For example, in Figure 7, it is possible to determine alternate tree species
in this cacao grove. This could help farmers gain environmental certifications for their
farms in order to get a higher price for their cacao. Overall, NDVI is a helpful index for
cacao farmers to visualize the health of their groves.
14
One of the field measurements taken during this study was leaf area index, or
LAI. The instrument used for this data collection was a CI-110 Plant Canopy Imager.
This calculation is acquired by finding the ratio of leaf surface area to ground surface
area. Essentially, this measures how much light penetrates the canopy and is used in
developing models for cacao production (Zuidema and Leffelaar, 2002). This value has
a direct effect on the photosynthetic capabilities, and finally the biomass production of
the tree. Since this farm prunes, they have the ability to choose the canopy density. The
optimum density Theoretically, as LAI increases, the amount of chlorophyll increases in
the plant. As these measurements are taken, the coordinates are also recorded. This
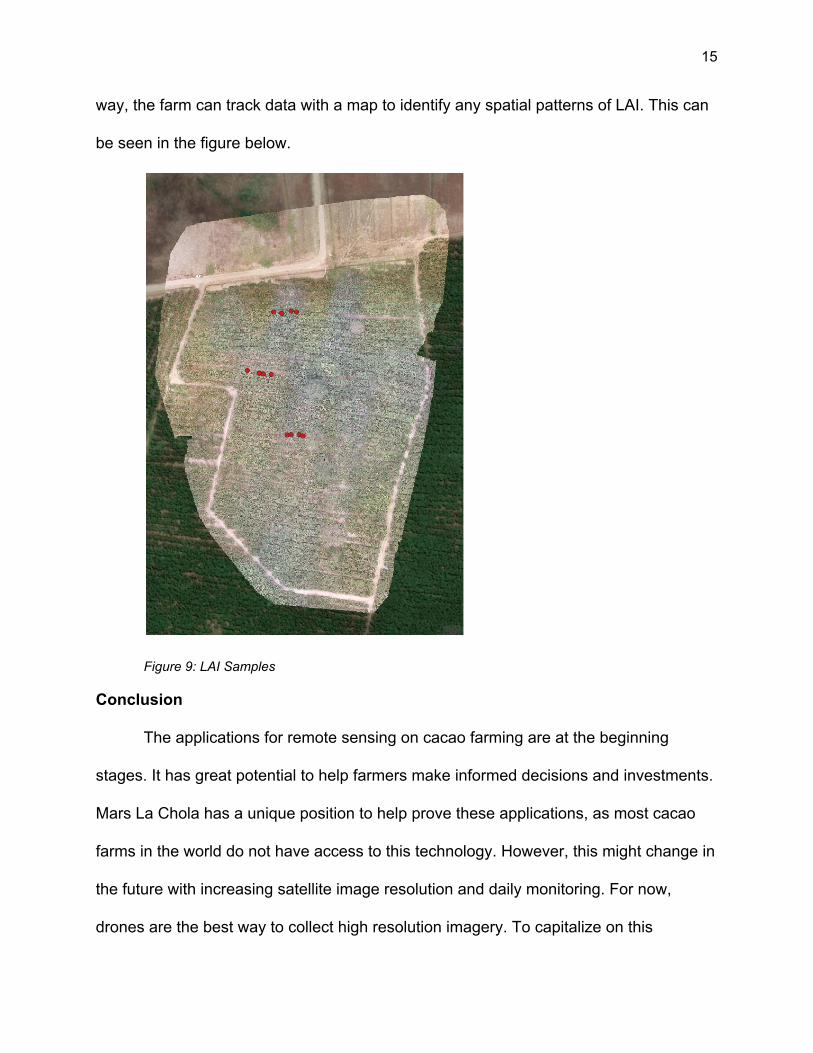
15
way, the farm can track data with a map to identify any spatial patterns of LAI. This can
be seen in the figure below.
Figure 9: LAI Samples
Conclusion
The applications for remote sensing on cacao farming are at the beginning
stages. It has great potential to help farmers make informed decisions and investments.
Mars La Chola has a unique position to help prove these applications, as most cacao
farms in the world do not have access to this technology. However, this might change in
the future with increasing satellite image resolution and daily monitoring. For now,
drones are the best way to collect high resolution imagery. To capitalize on this
16
opportunity, the research and development team at La Chola needs to record the
coordinates of their observations during studies. For example, the team is currently
conducting a study about the flushing and flowering habits of the cacao trees. GPS data
would make it possible to analyze this topic spatially and to identify any trends based on
tree location. The research team also needs to get the appropriate software licensing in
order to do image processing in the future. Remote sensing technologies are a efficient
way to both store and display data. It plays a crucial role in research as well. Mars La
Chola manages large historical datasets, as well as recording new data from the field.
Even though there are not yet precision agriculture recommendations for cacao like
there are for commodity crops, it can still use these instruments to make informed
decisions on crop management.

17
Figure 10: Cacao Grove
Figure 11: Cacao Pods
18
Citations
Boza, Edward J., Juan Carlos Motamayor, Freddy M. Amores, Sergio Cedeño-Amador,
Cecile L. Tondo, Donald S. Livingstone, Raymond J. Schnell, and Osman A.
Gutiérrez. "Genetic Characterization of the Cacao Cultivar CCN 51: Its Impact
and Significance on Global Cacao Improvement and Production". Journal of the
American Society for Horticultural Science J. Amer. Soc. Hort. Sci. 2014. 139.2:
219-229.
DFID. Agriculture and Growth (2014).
Cervantes-Godoy, D. and J. Dewbre (2010), "Economic Importance of Agriculture for
Poverty Reduction", OECD Food, Agriculture and Fisheries Papers, No. 23,
OECD Publishing, Paris
Herrmann, Luise, Christine Felbinger, Ilka Haase, Barbara Rudolph, Bernhard
Biermann, and Markus Fischer. "Food Fingerprinting: Characterization of the
Ecuadorean Type CCN-51 of Theobroma Cacao L. Using Microsatellite
Markers." Journal of Agricultural and Food Chemistry 63.18 (2015): 4539-44.
Web.
Hunt, E. Raymond Jr, et al. "Remote Sensing Leaf Chlorophyll Content Using a Visible
Band Index." Agronomy journal, v. 103,.4 pp. 1990.
Hunter, J.R. “The status of cacao (Theobroma cacao, sterculiaceae) in the western
hemisphere”.Economic Botany. 1990. Vol. 44, 425
Khorram, Siamak. Remote Sensing (2012).
19
Laderach, P., Martinez-Valle, A., Schroth, G., Castro, N., 2013. “Predicting the future
climatic suitability for cocoa farming of the world’s leading producer countries:
Ghana and Cote d’Ivoire”. Climate Change. Vol. 119, 841–854.
Miller, David. “Biomass, Nutrient Content and Allometric Relations of Intensively Grown
Cocoa (Theobroma Cacao) Trees in Ecuador.” 2019.
Santhosh K Seelan, Soizik Laguette, Grant M Casady, George A Seielstad. “Remote
sensing applications for precision agriculture: A learning community approach:
Remote Sensing of Environment.” Volume 88, Issues 1–2, 2003, Pages 157-169
Seelan, Laguette, Casady, & Seielstad. (2003). Remote sensing applications for
precision agriculture: A learning community approach. Remote Sensing of
Environment, 88(1), 157-169.
Snoeck D., Afrifa A., Ofori-Frimpong K., Boateng E., Abekoe M. (2010) Mapping
fertilizer recommendations for cocoa production in Ghana using soil diagnostic
and GIS tools. West African Journal of Applied Ecology 17:97-107.
van Vliet J.A., Giller K.E. (2017) Chapter Five - Mineral Nutrition of Cocoa: A Review, in:
D. L. Sparks (Ed.), Advances in Agronomy, Academic Press. pp. 185-270.
Wessel M., Quist-Wessel P.M.F. (2015) Cocoa production in West Africa, a review and
analysis of recent developments. NJAS - Wageningen Journal of Life Sciences
74-75:1-7.

20