Embed Size (px)
Citation preview
Remote Sens. 2014, 6, 10888-10912; doi:10.3390/rs61110888
remote sensing ISSN 2072-4292
www.mdpi.com/journal/remotesensing
Review
The Potential and Uptake of Remote Sensing in Insurance: A Review
Jan de Leeuw 1,*, Anton Vrieling 2, Apurba Shee 3, Clement Atzberger 4, Kiros M. Hadgu 5,
Chandrashekhar M. Biradar 6, Humphrey Keah 7 and Calum Turvey 8
1 World Agroforestry Center (ICRAF), Eastern and Southern African Region, P.O. Box 30677-00100
Nairobi, Kenya; E-Mail: [email protected] 2 Faculty of Geo-Information Science and Earth Observation (ITC), University of Twente, P.O. Box
217 7500 AE Enschede, The Netherlands; E-Mail: [email protected] 3 International Livestock Research Institute (ILRI), P.O. Box 30709-00100 Nairobi, Kenya;
E-Mail: [email protected] 4 Institute of Surveying, Remote Sensing & Land Information (IVFL), University of Natural
Resources and Life Sciences (BOKU), Peter Jordanstrasse 82, 1190 Vienna, Austria;
E-Mail: [email protected] 5 World Agroforestry Center (ICRAF), Eastern and Southern African Region, P.O. Box 5689 Addis
Ababa, Ethiopia; E-Mail: [email protected] 6 International Center for Agricultural Research in Dry Areas (ICARDA), P.O. Box 950764 Amman,
Jordan; E-Mail: [email protected] 7 World Agroforestry Center (ICRAF), P.O. Box 30677-00100 Nairobi, Kenya; E-Mail:
[email protected] 8 Charles H. Dyson School of Applied Economics and Management, Cornell University, Ithaca, NY
14853-7801, USA; E-Mail: [email protected]
* Author to whom correspondence should be addressed; E-Mail: [email protected];
Tel.: +254-737-223-157.
External Editors: Bingfang Wu and Prasad S. Thenkabail
Received: 25 May 2014; in revised form: 28 October 2014 / Accepted: 28 October 2014 /
Published: 7 November 2014
Abstract: Global insurance markets are vast and diverse, and may offer many opportunities
for remote sensing. To date, however, few operational applications of remote sensing for
insurance exist. Papers claiming potential application of remote sensing typically stress the
technical possibilities, without considering its contribution to customer value for the insured
OPEN ACCESS
Remote Sens. 2014, 6 10889
or to the profitability of the insurance industry. Based on a systematic search of available
literature, this review investigates the potential and actual support of remote sensing to the
insurance industry. The review reveals that research on remote sensing in classical
claim-based insurance described in the literature revolve around crop damage and flood and
fire risk assessment. Surprisingly, the use of remote sensing in claim-based insurance
appears to be instigated by government rather than the insurance industry. In contrast,
insurance companies are offering various index insurance products that are based on remote
sensing. For example, remotely sensed index insurance for rangelands and livestock are
operational, while various applications in crop index insurance are being considered or under
development. The paper discusses these differences and concludes that there is particular
scope for application of remote sensing by the insurance industry in index insurance because
(1) indices can be constructed that correlate well with what is insured; (2) these indices can
be delivered at low cost; and (3) it opens up new markets that are not served by claim-based
insurance. The paper finally suggests that limited adoption of remote sensing in insurance
results from a lack of mutual understanding and calls for greater cooperation between the
insurance industry and the remote sensing community.
Keywords: insurance; remote sensing; index insurance; agriculture; flood risk management
1. Introduction
Remote sensing has the potential to support the insurance industry. This suggestion has been repeated
since 1975 when Towery described the potential of aerial photography and remote sensing in crop hail
damage assessment [1,2]. The remote sensing literature offers numerous other examples proposing earth
observation techniques to support insurance, for example in assessment of damage from fire [3], hail [4],
and drought [5]. The insurance industry represents a large market of USD 4.3 trillion or 6.4 percent of
global GDP [6], while worldwide agricultural insurance markets have a collective premium pool worth
€12.5 billion [7]. Because of the size of these markets insurance may constitute an important application
field for remote sensing. So far, however, operational applications of remote sensing in the insurance
industry appear to be few, notwithstanding the size of the market and the potential and recent progress
of the technology.
Why does the insurance industry have reservations about adopting remote sensing? The insurance
industry is among the most information intensive of all service enterprises [8] so at first glance the
detailed information from remote sensing would appear to be attractive to insurance companies. Yet,
a 2008 review of the value-added from spatial information ranked the insurance sector among the lowest
intensity users in Australia [9]. The same study suggested that the insurance sector had potential for
increased use of spatial information, particularly in better risk assessment.
The discrepancy between the perceived potential and the actual uptake by the industry is probably
the result of over-optimistic assumptions by the remote sensing community regarding the industry’s
readiness to adopt the information that remote sensing could provide. One factor hindering the uptake
of remote sensing might be its appropriateness for the purpose, because of the indirect relation
Remote Sens. 2014, 6 10890
between remote sensing information and the insured damage as well as the limited duration of available
time series. However, the adoption of a new technology by an industry depends not only on the
appropriateness of the technique to support business processes, but also on its impact on customer value
and the industry’s productivity and profitability. Proper assessment of the potential of remote sensing in
insurance therefore requires consideration of the technology from the perspective of the industry’s
business processes and profitability.
In this paper, we review relevant literature on remote sensing and insurance to investigate the potential
and actual use of earth observation in support of the insurance industry. The review is based on a search
of the literature that was accessible in Scopus (Elsevier) using the keywords “Remote Sensing AND
Insurance” and searching the title, abstract, keywords and references (date of access 24 March 2014).
The retrieved publications were further examined to select those publications with applications of remote
sensing in insurance as their core subject matter. This sample was complemented with additional
professional reports found on the web or referred to in the peer-reviewed literature. The assembled
compilation of relevant literature reveals that papers on the application of remote sensing in insurance
have for long been dominated by examples in classical claim-based insurance in agriculture and flood
and fire risk management, while a smaller but rapidly growing number of papers describe its potential
in so-called index insurance in agriculture. This paper reviews the actual and potential contribution of
remotely sensed information in support of conventional claim-based insurance and index insurance.
The remainder of the paper is structured as follows. Section two provides an introduction about the
basic working principles of insurance. The use and potential of remote sensing in classical (claim-based)
insurance is presented in section three. Section four reviews the application of remote sensing in index
insurance. Section five discusses the findings of the reviews while section six provides concluding
comments and recommendations.
2. An Overview of Insurance
Insurance is a financial instrument, which allows exposed individuals to pool resources to spread their
risk. They do so by contributing premium to an insurance fund, which will indemnify those who suffer
insured loss. This procedure reduces the risk for an individual by spreading his risk among the multiple
fund contributors. Insurance can be designed to protect many types of individuals and assets against
single or multiple perils and buffer insured parties against sudden and dramatic income or asset loss.
2.1. Classification of Insurance
Insurance varies based on a number of characteristics, two of which are particularly relevant for this
review. The first is the geographical distribution of the shock causing the risk. Risks vary
between idiosyncratic risk, the situation where an individual’s exposure does not concur with that of its
neighbors and covariate or systemic risk where a single shock affects neighboring individuals at the
same time [10]. Drought and floods can affect many people concurrently over larger areas and are thus
examples of covariate risks. Covariate risk, by definition, captures the degree of correlation between a
peril (event) and economic loss. It is the degree of co-variation between an event and a loss that
determines an insurable event; not all droughts or floods result in economic loss, and not all losses are
insurable. Insurance can be further differentiated according to the criterion used for indemnification.
Remote Sens. 2014, 6 10891
Classical claim-based insurance pays an indemnity following a claim of loss by the insured customer.
Index insurance in contrast indemnifies the insured customer based on an index related to such losses
rather than the claimed loss.
Table 1 provides a classification of insurance according to these two criteria. Classical claim-based
insurance covers both idiosyncratic (Table 1, class a) and covariate risks (Table 1, class b). From
a business perspective, idiosyncratic risk insurance is relatively easy to manage because the administration
can be optimized to a regular and continuous flow of incoming claims. The management of covariate
risk is a challenge to insurance companies in several ways. First, in case of a covariate shock, insurers
are often at unpredictable moments confronted with a huge number of claims, thus stressing their ability
to handle all claims properly. In such situations, it becomes a challenge to verify claims in time and
particularly before verifiable signs of damage and loss have disappeared. Second, covariate shocks
expose the insurer to the risky obligation of making massive indemnity payments that may exceed their
solvability. Insurers mitigate this threat by dispersing their policyholders beyond the geographical
distribution of covariate shocks, or transferring the risk to reinsurers who can absorb covariate shocks at
local levels through a global spread of their portfolios.
Table 1. Classification of insurance according to indemnification and distribution of risk.
Indemnification Geographical Distribution of Risk
Idiosyncratic Covariate
Claim a b
Index -- c
Index insurance is appropriate to address covariate risk (Table 1, class c), but not idiosyncratic risk
because it is the covariate nature of a hazard that allows the insurer to predict losses and determine
indemnity payments for a large number of policyholders over a wide geographical area. Unlike classical
insurance, it indemnifies policyholders on the basis of an index correlated with the insured losses. In
fact, index insurance establishes a trigger point below or above which an indemnity payment is made.
An example of such an index is rainfall during the growing season used in index-based crop insurance.
The contract pays the same amount per unit premium to each policyholder within the spatial domain for
which the index value is valid, regardless of the actual losses they face. Similar to classical insurance,
the index insurer also needs to take precautions to spread their business risk imposed by covariate shocks
among a wider group of policyholders or reinsurers.
2.2. Advantages and Disadvantages of Claim and Index-Insurance
The two insurance types have advantages and disadvantages. An advantage of index insurance is that
it can potentially be delivered at lower cost. A significant barrier that hinders uptake of claim-based
insurance is the high transaction cost for searching for prospective policyholders, negotiating and
administering contracts, verifying losses and determining payouts. Index insurance eliminates the loss
verification step, thereby mitigating a significant transaction cost. However, the administration, contract
design, client search, premium collection, and claims disbursement processes remain labor- and
cost-intensive in index insurance, which has additional initial cost related to the development of an index
Remote Sens. 2014, 6 10892
that has good relation with insured losses and recurrent costs for the acquisition and processing
information on the state of the index [11].
A second advantage of index insurance is that, because it pays an indemnity based on the reading of
an index rather than individual losses or individual risk profiles, it eliminates much of the fraud, moral
hazard and adverse selection, which are common in classical claim-based insurance. Moral hazard is the
situation where a policyholder engages in risky behavior, increasing his actual risk profile beyond that
originally considered by the insurer. Adverse selection is the situation where people exposed to higher
risk seek insurance more frequently than those exposed to lower risk. This occurs when the insured has
more information about his “risk profile” than the insurer, a case of information asymmetry. Raised
premiums are a consequence of fraud, moral hazard and adverse selection. Index insurance avoids this,
provided that an index is used that cannot be manipulated by the parties involved. A further advantage
of index insurance is that payments based on a standardized and indisputable index also allow for a fast
indemnity payment [12] that could be automated, further reducing transaction costs.
Basis risk is a major disadvantage of index insurance. It is the situation where an individual
experiences a loss without receiving payment or vice versa [13]. Basis risk is a direct result of the
strength of the relation between the index that estimates the average loss by the insured group and the
loss of insured assets by an individual. The weaker this relation the higher the basis risk. It is obvious
that high basis risk undermines the willingness of potential clients to purchase insurance. It thus
challenges insurance companies to design insurances such as to minimize basis risk.
The described advantages can allow delivery of index insurance at lower cost than claim-based
insurance. This makes index insurance potentially affordable in remote areas, and thus opens up markets
for insurance in areas where it has not previously been offered. Examples of this are insurance for crops
and livestock in drylands, where the insurer’s costs of writing individual insurance contracts and
verifying individual claims would be prohibitive.
Reduced cost also makes index insurance more affordable to smallholder farmers in the developing
world. These smallholder farmers rely for their livelihoods, to a large extent, on their farm products
while facing major risks that can profoundly affect their livelihoods, such as crop failure or loss of
livestock during drought. Until recently insurance companies did not, or would not offer agricultural
insurance products for smallholder farmers in the developing world because of the associated costs.
Instead, smallholder farmers traditionally reduce adverse effects of risks through transferring these
risks within their community [14]. This is particularly effective in covering idiosyncratic risk, when the
non-affected fraction of a community remains capable of covering and absorbing the losses of those
affected. Traditional arrangements are less effective in insuring covariate risk. The ubiquity of damage
and loss caused by covariate hazards erodes the ability of one community member to cover the loss of
others. Traditional arrangements thus lack the desirable robustness to cover people against systemic risk
imposed, for example, by drought or floods. Insurers capable of spreading risk beyond the geographical
region affected by the covariate shock may however insure against this risk. This insight spurred a recent
interest in the possibility of index-based micro-insurance for smallholder farmers in the
developing world.
Remote Sens. 2014, 6 10893
2.3. Social Security Nets and Subsidies
Thus far, insurance has been presented from a private enterprise perspective, focusing on the
transactions between the insured and the private enterprise delivering the insurance product. In many
countries, government plays an important regulatory and facilitating role; they provide legal frameworks
within which the insurance industry operates and subsidizes various forms of insurance to keep them
affordable. The latter is a common practice in agricultural insurance, which is subsidized or supported
in other ways by governments in many developed countries to ensure sufficient uptake of the insurance
product. The government support to agricultural insurances varies from virtually nil in Australia and
Africa to 73% of all costs in the USA [15,16]. An important reason motivating governments to subsidize
agricultural insurance is the realization that fully commercial insurance would be too expensive,
resulting in limited adoption. Yet, many governments also subsidize agricultural insurance because of
the importance of the agricultural sector from electoral, employment, food security and social security
net perspectives. In the developing world where governments may not have the financial strength to
prioritize subsidizing agricultural risk, donors supporting relief and development are increasingly
interested in supporting the development of agricultural insurance. A proper perspective of the role of
government and other parties supporting insurance is important to understand the latter parts of this
paper where we will see that these parties play an important role in supporting the development of
applications of remote sensing in insurance.
3. Claim-Based Insurance and Remote Sensing
3.1. Business Processes in Claim-Based Insurance
The literature describes various examples of how earth observation and GIS might support the
insurance industry in managing its business operations in claim-based insurance. Below we first describe
claim based insurance in some more detail and next review the possibilities and actual use of
remote sensing to contribute to insurance business processes related to risk assessment and the handling
of claims.
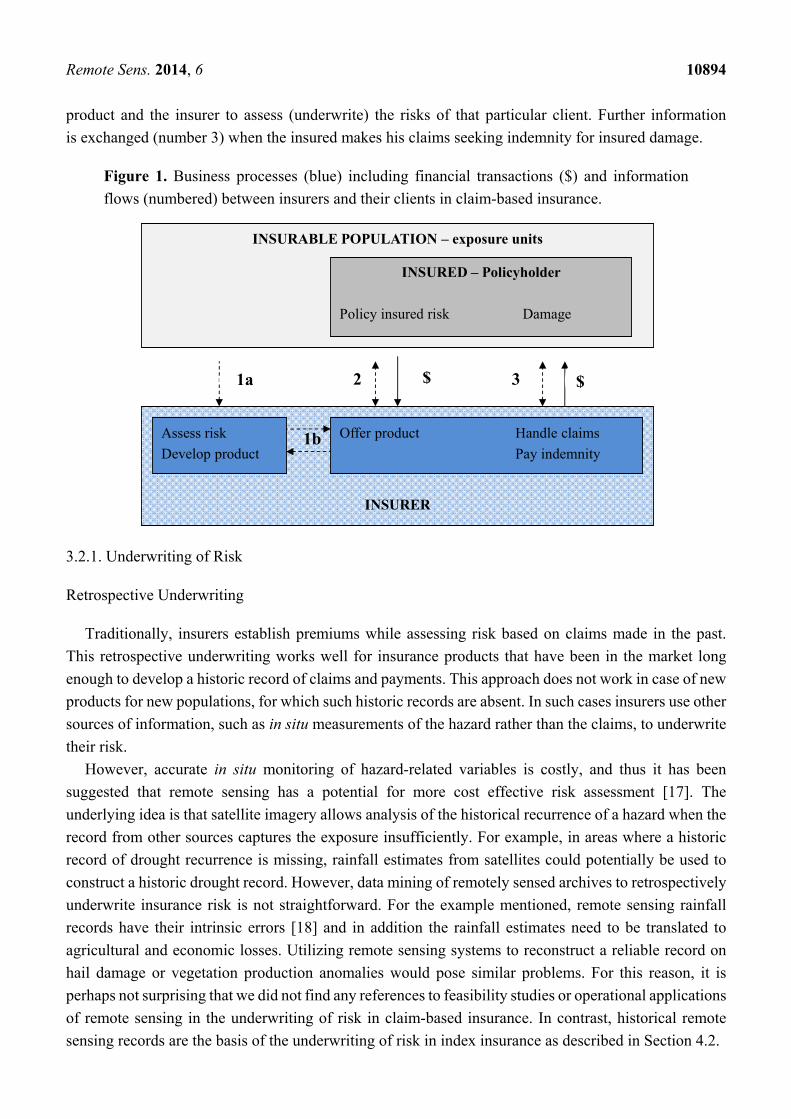
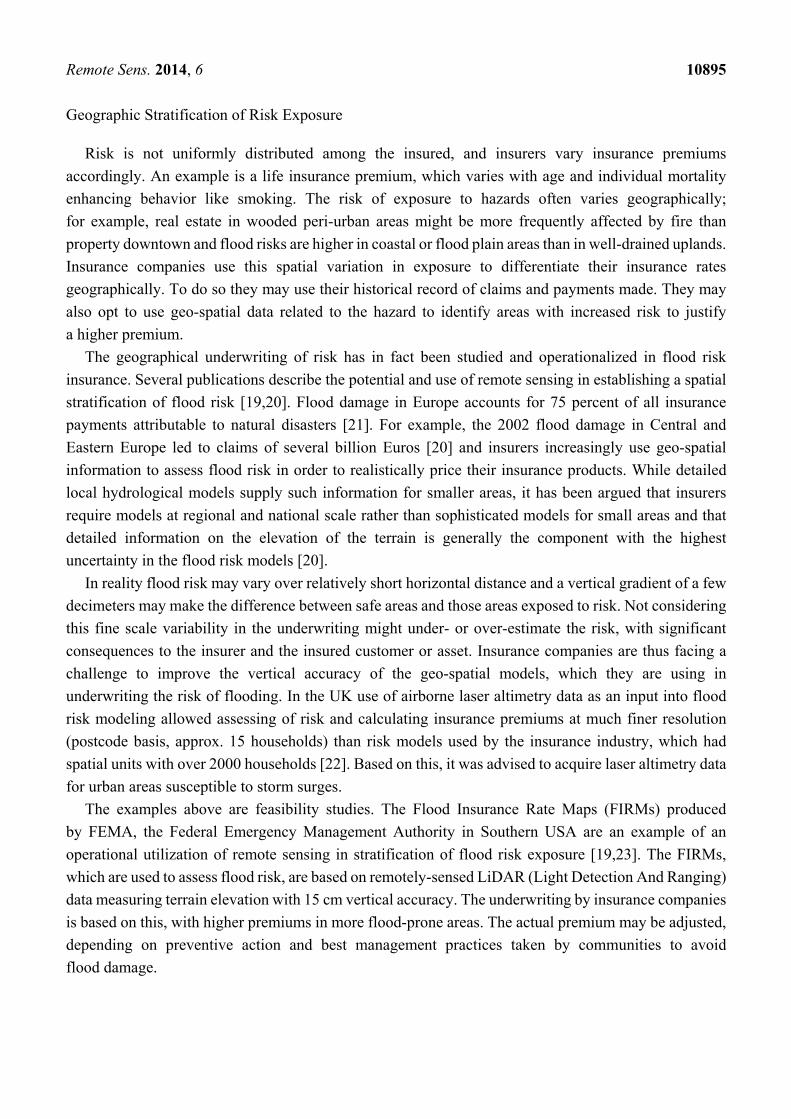
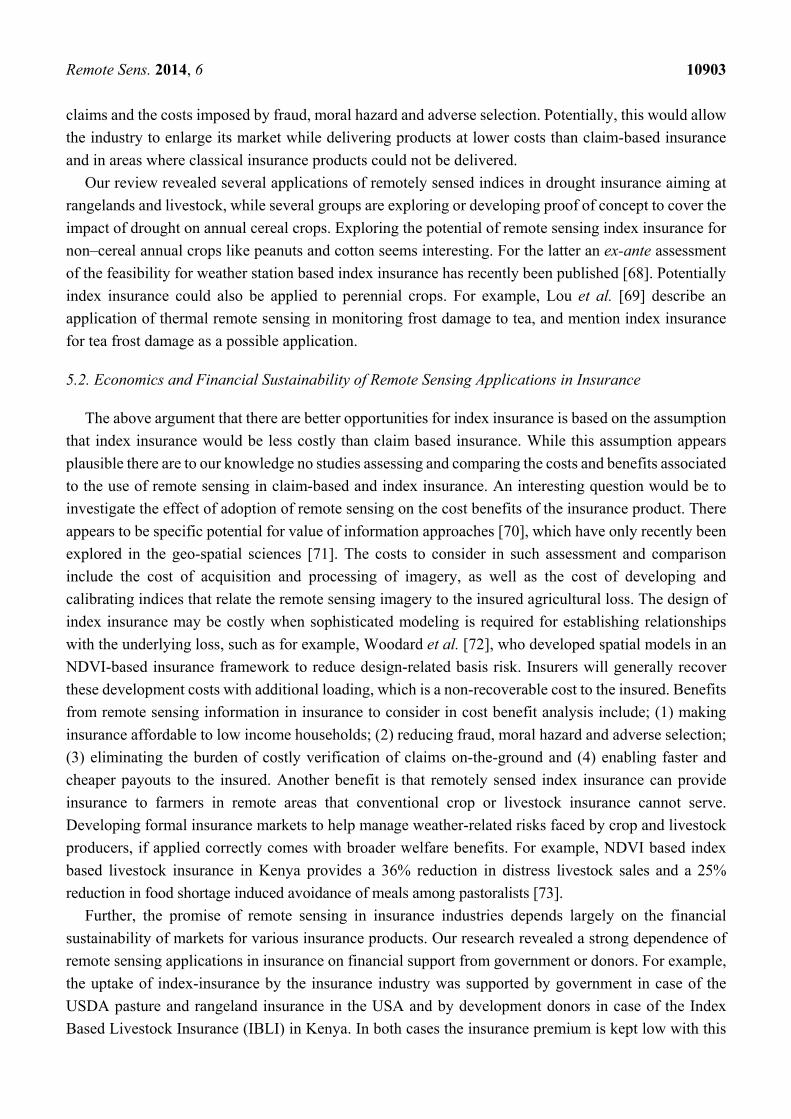
Figure 1 provides a scheme of the transactions and information flows in classical loss-based insurance
and shows distinct groups of information flows. The first information flow (number 1) is between the
insurer and the insurable population as a whole while the second and third information flows (number 2
and 3) are between the insurer and the individual client. The first information flow relates to the risks to
which the insurable population is exposed. To the insurer this is critical information because it allows
for an estimation of the risk and the probability of future claims and payouts, and to set an insurance
premium with sufficient margin. When introducing new products, an insurer develops and offers these
products, with the premium based on an assessment (1a) of the frequency and severity of the insured
risk and the expected average payout that would result from this peril. Thereafter insurance companies
continuously re-evaluate their risk and re-adjust their premium based on the information accumulated
while handling claims and making payouts (1b). This process brings their risk assessment from one
pertaining to the potentially insurable population to the risk for the exposure units insured by the insurer.
The second flow of information relates to the interaction between the insurer and the clients.
Information is exchanged (number 2) between the client and insurer, allowing the client to assess the
Remote Sens. 2014, 6 10894
product and the insurer to assess (underwrite) the risks of that particular client. Further information
is exchanged (number 3) when the insured makes his claims seeking indemnity for insured damage.
Figure 1. Business processes (blue) including financial transactions ($) and information
flows (numbered) between insurers and their clients in claim-based insurance.
3.2.1. Underwriting of Risk
Retrospective Underwriting
Traditionally, insurers establish premiums while assessing risk based on claims made in the past.
This retrospective underwriting works well for insurance products that have been in the market long
enough to develop a historic record of claims and payments. This approach does not work in case of new
products for new populations, for which such historic records are absent. In such cases insurers use other
sources of information, such as in situ measurements of the hazard rather than the claims, to underwrite
their risk.
However, accurate in situ monitoring of hazard-related variables is costly, and thus it has been
suggested that remote sensing has a potential for more cost effective risk assessment [17]. The
underlying idea is that satellite imagery allows analysis of the historical recurrence of a hazard when the
record from other sources captures the exposure insufficiently. For example, in areas where a historic
record of drought recurrence is missing, rainfall estimates from satellites could potentially be used to
construct a historic drought record. However, data mining of remotely sensed archives to retrospectively
underwrite insurance risk is not straightforward. For the example mentioned, remote sensing rainfall
records have their intrinsic errors [18] and in addition the rainfall estimates need to be translated to
agricultural and economic losses. Utilizing remote sensing systems to reconstruct a reliable record on
hail damage or vegetation production anomalies would pose similar problems. For this reason, it is
perhaps not surprising that we did not find any references to feasibility studies or operational applications
of remote sensing in the underwriting of risk in claim-based insurance. In contrast, historical remote
sensing records are the basis of the underwriting of risk in index insurance as described in Section 4.2.
INSURABLE POPULATION – exposure units
RiskINSURED – Policyholder
Policy insured risk Damage
INSURER
Assess risk
Develop product
Offer product Handle claims
Pay indemnity
1a 2 $ 3 $
1b
Remote Sens. 2014, 6 10895
Geographic Stratification of Risk Exposure
Risk is not uniformly distributed among the insured, and insurers vary insurance premiums
accordingly. An example is a life insurance premium, which varies with age and individual mortality
enhancing behavior like smoking. The risk of exposure to hazards often varies geographically;
for example, real estate in wooded peri-urban areas might be more frequently affected by fire than
property downtown and flood risks are higher in coastal or flood plain areas than in well-drained uplands.
Insurance companies use this spatial variation in exposure to differentiate their insurance rates
geographically. To do so they may use their historical record of claims and payments made. They may
also opt to use geo-spatial data related to the hazard to identify areas with increased risk to justify
a higher premium.
The geographical underwriting of risk has in fact been studied and operationalized in flood risk
insurance. Several publications describe the potential and use of remote sensing in establishing a spatial
stratification of flood risk [19,20]. Flood damage in Europe accounts for 75 percent of all insurance
payments attributable to natural disasters [21]. For example, the 2002 flood damage in Central and
Eastern Europe led to claims of several billion Euros [20] and insurers increasingly use geo-spatial
information to assess flood risk in order to realistically price their insurance products. While detailed
local hydrological models supply such information for smaller areas, it has been argued that insurers
require models at regional and national scale rather than sophisticated models for small areas and that
detailed information on the elevation of the terrain is generally the component with the highest
uncertainty in the flood risk models [20].
In reality flood risk may vary over relatively short horizontal distance and a vertical gradient of a few
decimeters may make the difference between safe areas and those areas exposed to risk. Not considering
this fine scale variability in the underwriting might under- or over-estimate the risk, with significant
consequences to the insurer and the insured customer or asset. Insurance companies are thus facing a
challenge to improve the vertical accuracy of the geo-spatial models, which they are using in
underwriting the risk of flooding. In the UK use of airborne laser altimetry data as an input into flood
risk modeling allowed assessing of risk and calculating insurance premiums at much finer resolution
(postcode basis, approx. 15 households) than risk models used by the insurance industry, which had
spatial units with over 2000 households [22]. Based on this, it was advised to acquire laser altimetry data
for urban areas susceptible to storm surges.
The examples above are feasibility studies. The Flood Insurance Rate Maps (FIRMs) produced
by FEMA, the Federal Emergency Management Authority in Southern USA are an example of an
operational utilization of remote sensing in stratification of flood risk exposure [19,23]. The FIRMs,
which are used to assess flood risk, are based on remotely-sensed LiDAR (Light Detection And Ranging)
data measuring terrain elevation with 15 cm vertical accuracy. The underwriting by insurance companies
is based on this, with higher premiums in more flood-prone areas. The actual premium may be adjusted,
depending on preventive action and best management practices taken by communities to avoid
flood damage.
Remote Sens. 2014, 6 10896
3.2.2. Handling of Claims
Damage Assessment
A second commonly proposed application of earth observation in claim-based insurance is related to
the handling of claims. Ideally, the insurer would attempt to check every claim and verify the damage
personally or obtain an independent damage assessment. In many cases, this is not possible. For example
with claims of minor monetary value, the costs of on-site damage assessment may become too high.
Insurers thus do not investigate each claim, but seek to balance customer satisfaction, handling expenses
and leakage from insurance fraud. For this, they often use automated statistical procedures, identifying
outliers from the normal pattern of claims, to identify suspicious cases for further investigation.
Earth observation imagery offers an alternative possibility to verify whether a claimant has been
affected by an insured risk and to investigate suspicious claims. This possibility emerges from the
well-established potential of remote sensing to detect damage on vegetation and crops by drought, fire,
hail, frost and pests and diseases. Similarly, there is a rich literature describing applications of remote
sensing in assessing damage to man-made objects and infrastructure.
Contrasting conclusions have been reported regarding the feasibility of remote sensing to support the
insurance industry in crop hail damage assessment. Peters et al. [24] evaluated the suitability of airborne
multispectral imagery to assess the effect of artificially induced hail damage in corn and soy-bean and
of a Landsat TM image to assess true hailstorm effects on croplands. They considered the 30 m
broadband imagery adequate for preliminary post storm hail damage assessment and 5 m resolution
imagery adequate to confirm hail damage and consequently were confident that remote sensing would
assess hail damage faster and more accurately than traditional field based verification. In contrast,
coarser resolution MERIS (MEdium Resolution Imaging Spectrometer) data did not reliably estimate
the area of crop damage, a finding which was based on imagery acquired a few days before and after a
hail storm and field-based damage assessments of the Agriculture Financial Service Cooperation in
Alberta, Canada [25]. Apan et al. [26] expressed further reservation while arguing that, although RS has
potential to delineate areas of reduced biomass, it remains difficult to attribute such losses to hail damage
as other confounding factors may have caused the biomass reduction. These two latter papers suggested
that remote sensing could at best be deployed in a supportive and cost-saving role targeting areas for
further field verification. However, the plausibility of attributing remotely-sensed evidence of crop
damage to hail could possibly be enhanced by combining the optical remote sensing with verification of
the hail event with polarimetric radar imagery [27].
The United States Department of Agriculture (USDA) Risk Management Agency (RMA) subsidizes
the US crop insurance program, with insurance policies covering a liability of USD 55 billion in 2007
being sold by 16 private insurance companies. The program initially included crop insurance that
covered risk from drought and hail, but has broadened in scope over the years and now includes a broad
array of damages and a wide variety of agricultural commodities. The system is, like any insurance
system, not free of fraud. Utilization of data mining techniques of the remote sensing record to seek for
anomalies and suspect cases resulted in a cost reduction of USD 450 million over a six-year period [28].
Remote sensing derived crop classification was used, for example, to verify whether farmers had planted
the crop for which losses were claimed [29].
Remote Sens. 2014, 6 10897
There seems to be ample scope for further use of remote sensing in crop damage assessment, as
field-based assessment is costly. However, satellites with relatively long (>20 days) revisit times that
carry optical sensors whose imaging capability is affected by clouds (e.g., Landsat) are not very suitable
if assessment is required within a few days after a peril. Several new satellite missions exist that
significantly reduce revisit times while mapping the Earth at very high spatial resolution (approx. 1 m).
For example, the German Rapid Eye AG developed a series of five satellites that can cover any area on
earth once per day, and aims with this potential for more timely delivery to service the crop insurance
industry among others [30]. Competitors like Digital Globe (WorldView-2 satellite with 8 spectral
bands) and SPOT IMAGE (Pleiades satellite) offer the same revisit frequency. Similarly, SarMap is
developing applications of radar imagery, unaffected by cloud cover and acquired at a spatial resolution
of approx. 20 m as an input in a crop damage insurance system [31]. A common problem of the
mentioned new missions relates to the fact that imagery is usually only acquired through tasking and not
regularly, such as by Landsat and other 10–30 m resolution sensors. Hence, suitable imagery depicting
the situation before the damage event may not be available. In this respect, the increase of public-domain
high resolution optical and radar imagery with short revisit times such as the European Sentinel-1 and -2
missions are highly welcome, as they will monitor the Earth surface continuously. The first Sentinel-1
satellite was launched in April 2014 and the first Sentinel-2 will be launched towards the end of 2015.
Apart from applications in crop insurance, remote sensing has also been explored for usage in forest
fire damage assessment. Canaseva and Dagorne [32] suggested in 1985 that airborne color infrared
remote sensing imagery could be used to delineate forest area affected by fire for insurance purposes.
Since that time, much development has taken place in the remote sensing based assessment of active
fires, fire intensities, and burned areas [33], and various coarse-resolution operational products
exist [34]. The suggestion of operational use of airborne multi-spectral imagery in assessment of fire
damage by the Safire Insurance Company in South Africa [35] was however not confirmed when
requesting the company for further information and confirmation of its operational use.
Verification of Conditions in Insurance Contracts
Another potential application of earth observation is in verifying whether claimants complied with
specific conditions stipulated in the insurance contract. The presence of well-maintained firebreaks,
for example, is a condition included in most forest fire insurance policies. Remote sensing might offer
insurance companies the possibility to verify whether and how well firebreaks were maintained before
the outbreak of a forest fire. The temporal resolution of the sensor and its ability to detect the condition
of the firebreak would be critical in verifying compliance in this particular case. We were however,
unable to find examples of the use of remote sensing in verifying compliance to contractual obligations.
4. Index Insurance
4.1. Development of Index Insurance
Halcrow [36] introduced the concept of index insurance in 1949 when arguing that the Federal Crop
Insurance in the United States should offer an insurance product based on the yield over a wider area to
eliminate adverse selection among insured farmers. The idea of area-yield insurance was taken up
Remote Sens. 2014, 6 10898
in India where the Indian National Agricultural Insurance Scheme (NAIS) is an area yield insurance that
is based on yield estimates made in so called insurance units covering hundreds to thousands of farmers.
With 25 million insured farmers it is the largest agricultural insurance scheme in the world offering crop
insurance to smallholder farmers that could otherwise not be insured [37]. In the United States of
America (USA), the Group Risk Plan (GRP) uses yield at county level for calculating indemnities to
insured farmers [38].
Around the same time the idea of weather-based index insurance was developed in
Australia [39,40]. Weather index insurance differs from area-yield insurance in that it uses an index
related to the yield rather than an estimate of the yield based on field measurement. Weather index
insurance avoids the cost of estimating yield, but requires the availability of a historic record of weather
and yield data to calibrate a model to design the insurance scheme. In the late 1990s the World Bank
supported the piloting of index insurance in the developing world and since then there has been an increase
of index insurance in developing countries [41]. Initially projects focused on weather-index-insurance
based on rainfall, and recently IFAD [42] published a technical guide to support the development of
weather-based index-insurance. Potentially, there is a much wider array of indicators including Richter
values used in earthquake insurance in Mexico, reservoir levels used as an indicator for insurance for
insufficient irrigation water supply in Mexico, area livestock mortality rates for livestock insurance in
Mongolia and the El Niño Southern Oscillation (ENSO) index for flood insurance in Peru [43]. A recent
publication of the EU Joint Research Centre provides a comprehensive overview of the challenges of
index insurance in developing countries [44].
Vrieling et al. [45] suggested that the information underpinning index insurance requires four criteria,
which are not always easy to meet. First, the information should be trustworthy and independently
verifiable, i.e., derived from impartial data providers who use well-described data collection and
processing methods. For weather-based index insurance that uses rain gauges the condition of impartiality
is sometimes impractical in remote areas when farmers with interest in insurance also maintain the
rainfall stations. Second, the index should correlate strongly with what is insured, such as livestock or
crop losses. The weaker the relation between the index and the loss of insured assets, the higher the
likelihood of households experiencing a loss without receiving payment or vice versa, a situation referred
to as “basis risk” [13] described in Section 2.2.1. Basis risk is inherent to index insurance. It is a genuine
problem because the strength of the correlations between the yield of agricultural commodities and
indices is variable [41]. For instance, basis risk tends to increase with increasing distance between the
location of the insured assets and where information for an index is gathered, a situation complicating
weather index-insurance based on observations from weather stations in data scarce areas. The third
condition is that the information required for the index can reliably be delivered into the future, at least
for the duration of the insurance contract, and is available in near real-time, so that payments can be
made in due time. The fourth condition is that the record of the index is sufficiently long to properly
underwrite the risk and accurately price the insurance product. This can be conceived as a major
limitation of index insurance based on remote sensing inputs, even if coarse resolution NDVI time series
exist now for more than thirty years (starting with the launch of the first AVHRR in 1979). In addition,
a number of initiatives exist to combine observations from various sensors to increase consistency
between time series [45]. From the insurer point of view one may add as a fifth condition, i.e., that
gathering of information should not be too expensive.
Remote Sens. 2014, 6 10899
4.2. Remote Sensing in Index Insurance
Remote sensing offers opportunities to address some of the above described requirements of index
insurance. If data are pre-processed properly, sensors onboard satellites provide cost-effective, reliable
and impartial information on a wide variety of vegetation and hydrological parameters at various spatial
resolutions. Moreover, operational satellites have the potential to provide a continuous flow of information
and the remote sensing community has developed image-processing routines to generate long-term
datasets with stable characteristics over time. Many efforts currently exist to create consistent long-term
records based on a variety of satellite-based input source, for example the European Space Agency’s
Climate Change Initiative [46] and NASA’s Land Long Term Data Record [47]. The continuously
extending duration of the remotely sensed record is going to increase its value as a historic record of the
variability of natural processes and hence it’s utility in index insurance.
Thanks to these advantages, it is not surprising that remote sensing indices have found their way into
index insurance. One example of the application of remote sensing indices is in insurance that covers
the risk of forage scarcity in rangelands, an application based on the well-established relation between
rainfall, NDVI and forage scarcity. Strong correlations of NDVI and rangeland productivity have been
documented for rangelands of central Australia [48], North America [49], the Middle East [50]
and Africa [51–53].
Two separate applications of remotely sensed index-insurance have been developed based on this.
The first is instigated by government in the United States where the USDA’s Risk Management Agency
(RMA) offers pasture and rangeland insurance, which are based on rainfall and NDVI time series [54].
The insurance is designed to protect farmers against a decline in forage where the indemnity payments
are determined based on deviation from normal of the combined NDVI and rainfall index.
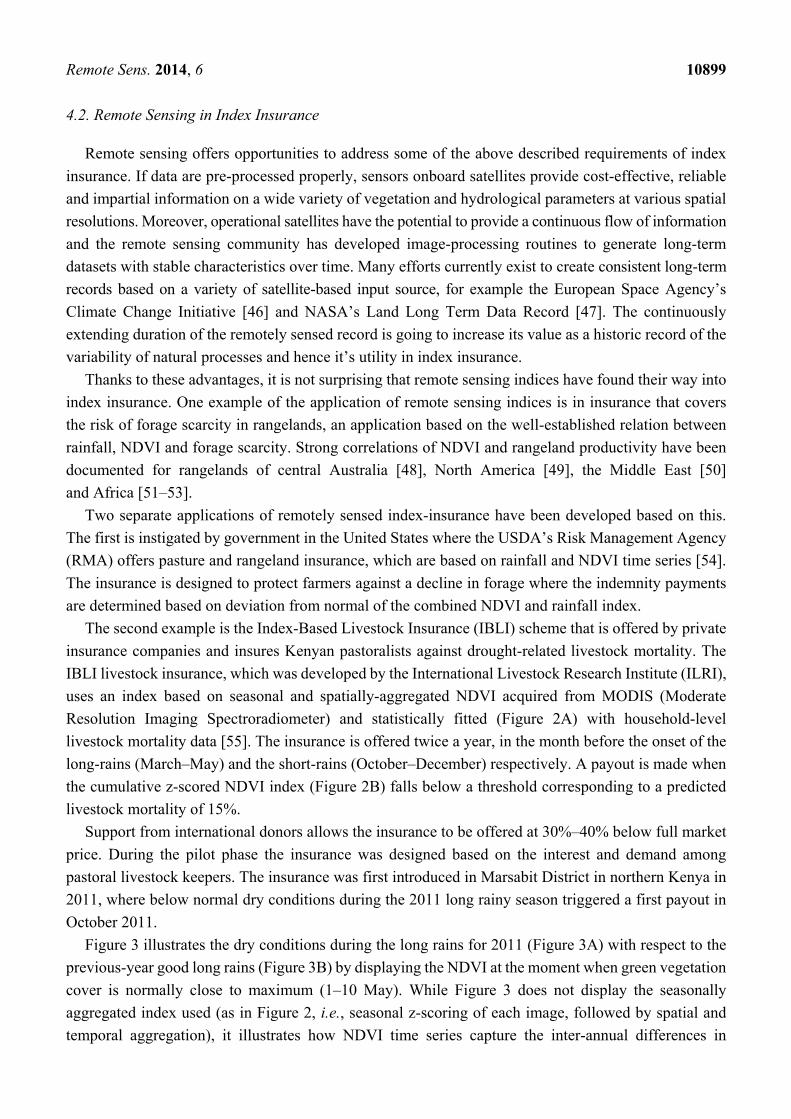
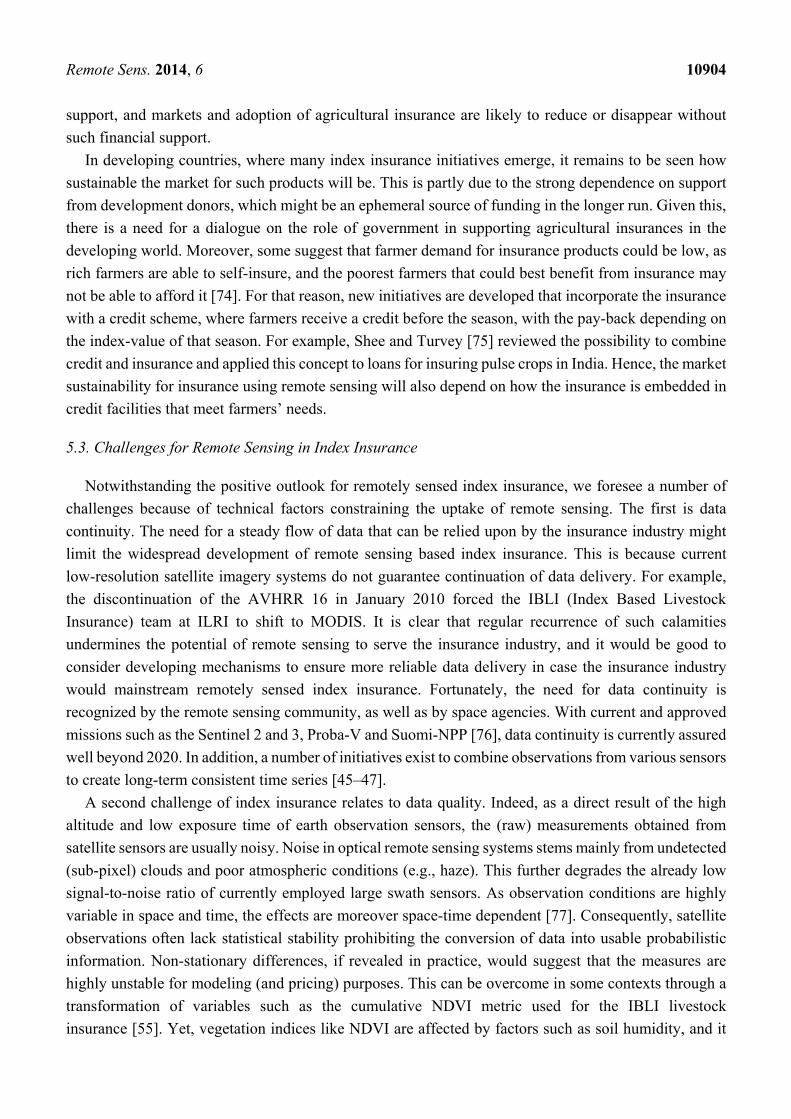
The second example is the Index-Based Livestock Insurance (IBLI) scheme that is offered by private
insurance companies and insures Kenyan pastoralists against drought-related livestock mortality. The
IBLI livestock insurance, which was developed by the International Livestock Research Institute (ILRI),
uses an index based on seasonal and spatially-aggregated NDVI acquired from MODIS (Moderate
Resolution Imaging Spectroradiometer) and statistically fitted (Figure 2A) with household-level
livestock mortality data [55]. The insurance is offered twice a year, in the month before the onset of the
long-rains (March–May) and the short-rains (October–December) respectively. A payout is made when
the cumulative z-scored NDVI index (Figure 2B) falls below a threshold corresponding to a predicted
livestock mortality of 15%.
Support from international donors allows the insurance to be offered at 30%–40% below full market
price. During the pilot phase the insurance was designed based on the interest and demand among
pastoral livestock keepers. The insurance was first introduced in Marsabit District in northern Kenya in
2011, where below normal dry conditions during the 2011 long rainy season triggered a first payout in
October 2011.
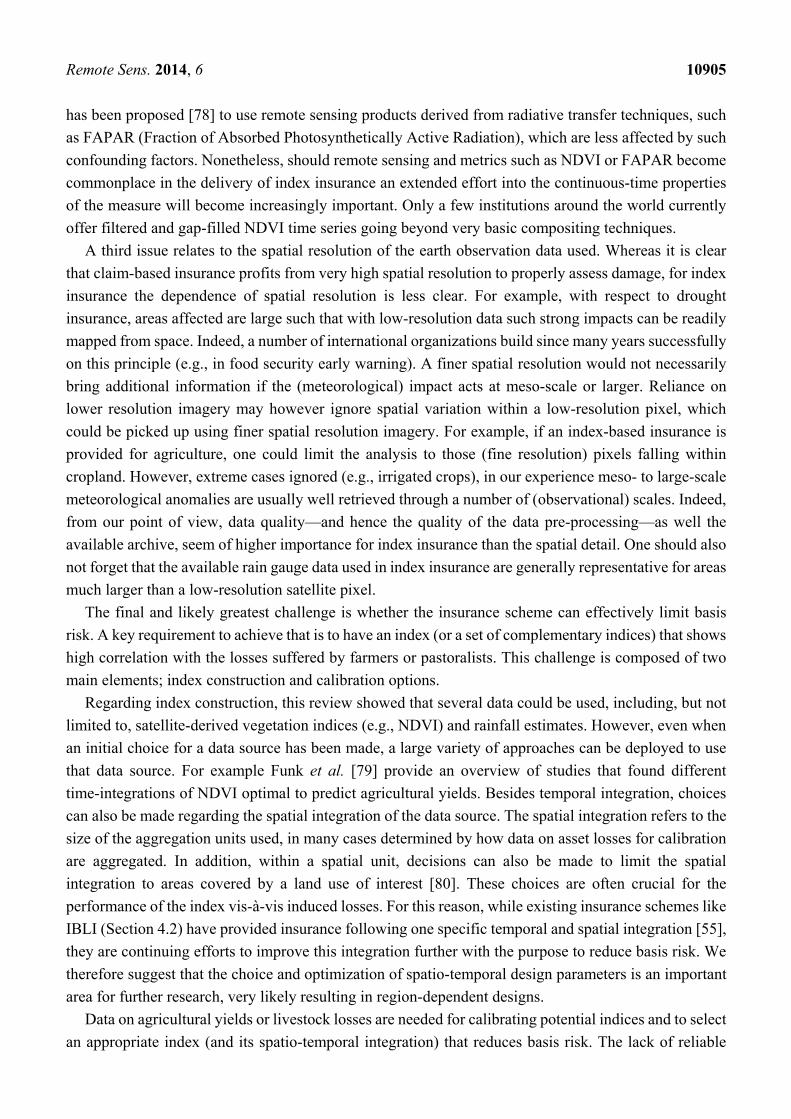
Figure 3 illustrates the dry conditions during the long rains for 2011 (Figure 3A) with respect to the
previous-year good long rains (Figure 3B) by displaying the NDVI at the moment when green vegetation
cover is normally close to maximum (1–10 May). While Figure 3 does not display the seasonally
aggregated index used (as in Figure 2, i.e., seasonal z-scoring of each image, followed by spatial and
temporal aggregation), it illustrates how NDVI time series capture the inter-annual differences in
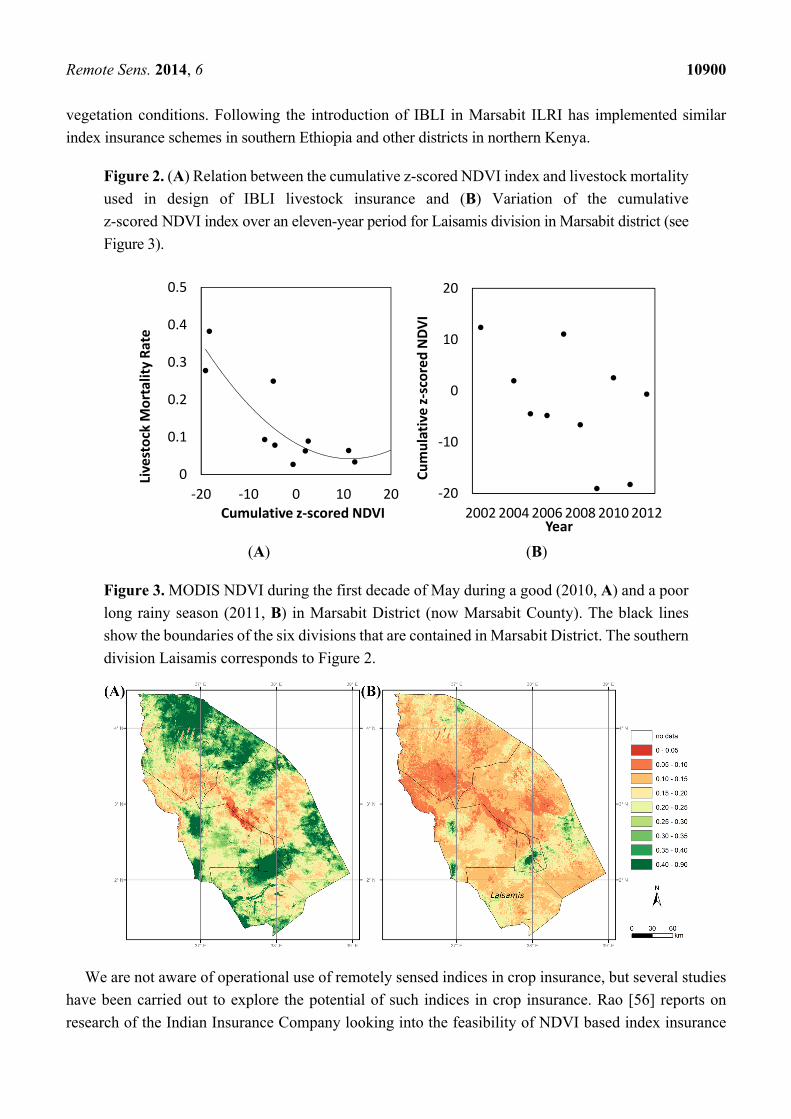
Remote Sens. 2014, 6 10900
vegetation conditions. Following the introduction of IBLI in Marsabit ILRI has implemented similar
index insurance schemes in southern Ethiopia and other districts in northern Kenya.
Figure 2. (A) Relation between the cumulative z-scored NDVI index and livestock mortality
used in design of IBLI livestock insurance and (B) Variation of the cumulative
z-scored NDVI index over an eleven-year period for Laisamis division in Marsabit district (see
Figure 3).
(A) (B)
Figure 3. MODIS NDVI during the first decade of May during a good (2010, A) and a poor
long rainy season (2011, B) in Marsabit District (now Marsabit County). The black lines
show the boundaries of the six divisions that are contained in Marsabit District. The southern
division Laisamis corresponds to Figure 2.
We are not aware of operational use of remotely sensed indices in crop insurance, but several studies
have been carried out to explore the potential of such indices in crop insurance. Rao [56] reports on
research of the Indian Insurance Company looking into the feasibility of NDVI based index insurance
0
0.1
0.2
0.3
0.4
0.5
-20 -10 0 10 20
Live
stoc
k M
orta
lity
Rate
Cumulative z-scored NDVI-20
-10
0
10
20
200220042006200820102012
Cum
ulat
ive
z-sc
ored
NDV
I
Year
Remote Sens. 2014, 6 10901
for crops, while options for remotely sensed index insurance have also been reviewed for wheat in
Kazakhstan [57] and Syria [58]. Pantakar [59] described a pilot study in Chhattisgarh and Andhra
Pradesh states in India where a composite index insurance product based on NDVI and rainfall was
designed and offered to farmers. Analysis of the relation between a rainfall index and an NDVI index
with historical maize and cotton crop yield data from nine districts in Zimbabwe [60] led to the
conclusion that NDVI was a better indicator because it exhibited higher correlations with yield than the
rainfall index. Turvey and McLaurin [61] examined the potential of NDVI as an index in crop insurance.
They reported that the relationship between NDVI, precipitation, extreme heat and crop yields is highly
variable and location-specific, and consequently concluded that application of NDVI to index insurance
product design requires site-specific calibration.
Besides index insurance based on remotely sensed vegetation productivity indices (e.g., NDVI), there
is also potential for insurance based on remote sensing rainfall indices [14]. Johnson [62] describes that
the automated weather stations, which form the backbone of the Kilimo Salama weather index insurance
offered to over 150,000 farmers in Kenya and Uganda are too expensive to maintain, and this is the
reason why research has been initiated to investigate the possibility of satellite rainfall estimates.
Because rainfall has high spatial variability, particularly for short temporal time-scales, dense station
networks are needed to generate an effective spatial representation of the rain field. When such networks
are nonexistent or do not reliably deliver data, satellite data can partly fill this gap. These data consist of
thermal infrared observations, mostly from geostationary satellites, and active and passive microwave
observations from polar-orbiting satellites. Many satellite rainfall products exist that merge rainfall
retrievals from various remote sensing sources [63]. Because quality of the rainfall products varies
depending on climatic region, local calibration with ground-based rainfall measurements may be required
to improve the estimates [64]. Nonetheless, satellite rainfall estimates provide a good alternative to
interpolated station data, and large international efforts such as the Global Precipitation Measurement
(GPM) mission will improve their accuracy further [18].
The above-mentioned remotely sensed index insurance programs deliver micro-insurance products
that target and benefit individual households. Recently, there has been increasing interest in meso- and
macro- level insurance products. Those products do not target individual farmers. They target relief
agencies and regional and national governments that have an interest in financially supporting farmers
affected by disasters. For example, in Argentina and Uruguay feasibility studies have been undertaken
for meso-insurance based on NDVI index tracking pasture productivity [65,66] designed to cover loss
of livestock. This meso-insurance would, when implemented, allow the government to make timely
payouts to support livestock owners to maintain their herds in the event of severe drought.
5. Discussion
5.1. Adoption of Remote Sensing in Insurance
This review revealed an apparent contrast between the claimed potential of remote sensing in support
of insurance, and the actual adoption of remote sensing by the insurance industry. Forty years of technical
literature describing the potential of remote sensing is not backed by evidence for significant uptake by
the insurance industry of remote sensing in classical claim-based insurance. In fact, we found reference
Remote Sens. 2014, 6 10902
in the literature of application of remote sensing in claim-based insurance by the government but not by
the insurance industry (Table 2). The adoption of remote sensing in claim-based insurance by
government, which is surprising at first sight, is understandable when one realizes that both examples
were from the United States where the government provides significant support to the insurance industry.
In the case of flood risk management, government facilitates the insurance industry with information
that allows better underwriting of flood risk. In the case of crop insurance, the application of remote
sensing stems from the concern of government to control fraud in agricultural insurances, which when
left uncontrolled inflates government expenditure on subsidies.
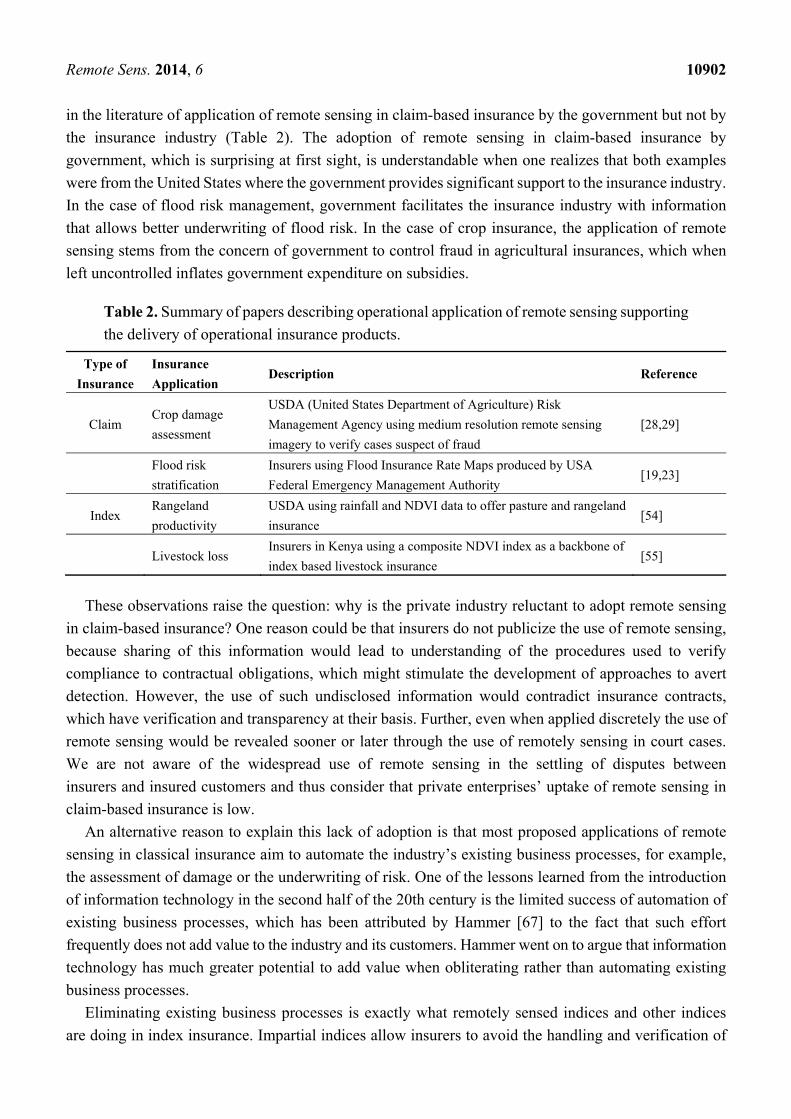
Table 2. Summary of papers describing operational application of remote sensing supporting
the delivery of operational insurance products.
Type of
Insurance
Insurance
Application Description Reference
Claim Crop damage
assessment
USDA (United States Department of Agriculture) Risk
Management Agency using medium resolution remote sensing
imagery to verify cases suspect of fraud
[28,29]
Flood risk
stratification
Insurers using Flood Insurance Rate Maps produced by USA
Federal Emergency Management Authority [19,23]
Index Rangeland
productivity
USDA using rainfall and NDVI data to offer pasture and rangeland
insurance [54]
Livestock loss Insurers in Kenya using a composite NDVI index as a backbone of
index based livestock insurance [55]
These observations raise the question: why is the private industry reluctant to adopt remote sensing
in claim-based insurance? One reason could be that insurers do not publicize the use of remote sensing,
because sharing of this information would lead to understanding of the procedures used to verify
compliance to contractual obligations, which might stimulate the development of approaches to avert
detection. However, the use of such undisclosed information would contradict insurance contracts,
which have verification and transparency at their basis. Further, even when applied discretely the use of
remote sensing would be revealed sooner or later through the use of remotely sensing in court cases.
We are not aware of the widespread use of remote sensing in the settling of disputes between
insurers and insured customers and thus consider that private enterprises’ uptake of remote sensing in
claim-based insurance is low.
An alternative reason to explain this lack of adoption is that most proposed applications of remote
sensing in classical insurance aim to automate the industry’s existing business processes, for example,
the assessment of damage or the underwriting of risk. One of the lessons learned from the introduction
of information technology in the second half of the 20th century is the limited success of automation of
existing business processes, which has been attributed by Hammer [67] to the fact that such effort
frequently does not add value to the industry and its customers. Hammer went on to argue that information
technology has much greater potential to add value when obliterating rather than automating existing
business processes.
Eliminating existing business processes is exactly what remotely sensed indices and other indices
are doing in index insurance. Impartial indices allow insurers to avoid the handling and verification of
Remote Sens. 2014, 6 10903
claims and the costs imposed by fraud, moral hazard and adverse selection. Potentially, this would allow
the industry to enlarge its market while delivering products at lower costs than claim-based insurance
and in areas where classical insurance products could not be delivered.
Our review revealed several applications of remotely sensed indices in drought insurance aiming at
rangelands and livestock, while several groups are exploring or developing proof of concept to cover the
impact of drought on annual cereal crops. Exploring the potential of remote sensing index insurance for
non–cereal annual crops like peanuts and cotton seems interesting. For the latter an ex-ante assessment
of the feasibility for weather station based index insurance has recently been published [68]. Potentially
index insurance could also be applied to perennial crops. For example, Lou et al. [69] describe an
application of thermal remote sensing in monitoring frost damage to tea, and mention index insurance
for tea frost damage as a possible application.
5.2. Economics and Financial Sustainability of Remote Sensing Applications in Insurance
The above argument that there are better opportunities for index insurance is based on the assumption
that index insurance would be less costly than claim based insurance. While this assumption appears
plausible there are to our knowledge no studies assessing and comparing the costs and benefits associated
to the use of remote sensing in claim-based and index insurance. An interesting question would be to
investigate the effect of adoption of remote sensing on the cost benefits of the insurance product. There
appears to be specific potential for value of information approaches [70], which have only recently been
explored in the geo-spatial sciences [71]. The costs to consider in such assessment and comparison
include the cost of acquisition and processing of imagery, as well as the cost of developing and
calibrating indices that relate the remote sensing imagery to the insured agricultural loss. The design of
index insurance may be costly when sophisticated modeling is required for establishing relationships
with the underlying loss, such as for example, Woodard et al. [72], who developed spatial models in an
NDVI-based insurance framework to reduce design-related basis risk. Insurers will generally recover
these development costs with additional loading, which is a non-recoverable cost to the insured. Benefits
from remote sensing information in insurance to consider in cost benefit analysis include; (1) making
insurance affordable to low income households; (2) reducing fraud, moral hazard and adverse selection;
(3) eliminating the burden of costly verification of claims on-the-ground and (4) enabling faster and
cheaper payouts to the insured. Another benefit is that remotely sensed index insurance can provide
insurance to farmers in remote areas that conventional crop or livestock insurance cannot serve.
Developing formal insurance markets to help manage weather-related risks faced by crop and livestock
producers, if applied correctly comes with broader welfare benefits. For example, NDVI based index
based livestock insurance in Kenya provides a 36% reduction in distress livestock sales and a 25%
reduction in food shortage induced avoidance of meals among pastoralists [73].
Further, the promise of remote sensing in insurance industries depends largely on the financial
sustainability of markets for various insurance products. Our research revealed a strong dependence of
remote sensing applications in insurance on financial support from government or donors. For example,
the uptake of index-insurance by the insurance industry was supported by government in case of the
USDA pasture and rangeland insurance in the USA and by development donors in case of the Index
Based Livestock Insurance (IBLI) in Kenya. In both cases the insurance premium is kept low with this
Remote Sens. 2014, 6 10904
support, and markets and adoption of agricultural insurance are likely to reduce or disappear without
such financial support.
In developing countries, where many index insurance initiatives emerge, it remains to be seen how
sustainable the market for such products will be. This is partly due to the strong dependence on support
from development donors, which might be an ephemeral source of funding in the longer run. Given this,
there is a need for a dialogue on the role of government in supporting agricultural insurances in the
developing world. Moreover, some suggest that farmer demand for insurance products could be low, as
rich farmers are able to self-insure, and the poorest farmers that could best benefit from insurance may
not be able to afford it [74]. For that reason, new initiatives are developed that incorporate the insurance
with a credit scheme, where farmers receive a credit before the season, with the pay-back depending on
the index-value of that season. For example, Shee and Turvey [75] reviewed the possibility to combine
credit and insurance and applied this concept to loans for insuring pulse crops in India. Hence, the market
sustainability for insurance using remote sensing will also depend on how the insurance is embedded in
credit facilities that meet farmers’ needs.
5.3. Challenges for Remote Sensing in Index Insurance
Notwithstanding the positive outlook for remotely sensed index insurance, we foresee a number of
challenges because of technical factors constraining the uptake of remote sensing. The first is data
continuity. The need for a steady flow of data that can be relied upon by the insurance industry might
limit the widespread development of remote sensing based index insurance. This is because current
low-resolution satellite imagery systems do not guarantee continuation of data delivery. For example,
the discontinuation of the AVHRR 16 in January 2010 forced the IBLI (Index Based Livestock
Insurance) team at ILRI to shift to MODIS. It is clear that regular recurrence of such calamities
undermines the potential of remote sensing to serve the insurance industry, and it would be good to
consider developing mechanisms to ensure more reliable data delivery in case the insurance industry
would mainstream remotely sensed index insurance. Fortunately, the need for data continuity is
recognized by the remote sensing community, as well as by space agencies. With current and approved
missions such as the Sentinel 2 and 3, Proba-V and Suomi-NPP [76], data continuity is currently assured
well beyond 2020. In addition, a number of initiatives exist to combine observations from various sensors
to create long-term consistent time series [45–47].
A second challenge of index insurance relates to data quality. Indeed, as a direct result of the high
altitude and low exposure time of earth observation sensors, the (raw) measurements obtained from
satellite sensors are usually noisy. Noise in optical remote sensing systems stems mainly from undetected
(sub-pixel) clouds and poor atmospheric conditions (e.g., haze). This further degrades the already low
signal-to-noise ratio of currently employed large swath sensors. As observation conditions are highly
variable in space and time, the effects are moreover space-time dependent [77]. Consequently, satellite
observations often lack statistical stability prohibiting the conversion of data into usable probabilistic
information. Non-stationary differences, if revealed in practice, would suggest that the measures are
highly unstable for modeling (and pricing) purposes. This can be overcome in some contexts through a
transformation of variables such as the cumulative NDVI metric used for the IBLI livestock
insurance [55]. Yet, vegetation indices like NDVI are affected by factors such as soil humidity, and it
Remote Sens. 2014, 6 10905
has been proposed [78] to use remote sensing products derived from radiative transfer techniques, such
as FAPAR (Fraction of Absorbed Photosynthetically Active Radiation), which are less affected by such
confounding factors. Nonetheless, should remote sensing and metrics such as NDVI or FAPAR become
commonplace in the delivery of index insurance an extended effort into the continuous-time properties
of the measure will become increasingly important. Only a few institutions around the world currently
offer filtered and gap-filled NDVI time series going beyond very basic compositing techniques.
A third issue relates to the spatial resolution of the earth observation data used. Whereas it is clear
that claim-based insurance profits from very high spatial resolution to properly assess damage, for index
insurance the dependence of spatial resolution is less clear. For example, with respect to drought
insurance, areas affected are large such that with low-resolution data such strong impacts can be readily
mapped from space. Indeed, a number of international organizations build since many years successfully
on this principle (e.g., in food security early warning). A finer spatial resolution would not necessarily
bring additional information if the (meteorological) impact acts at meso-scale or larger. Reliance on
lower resolution imagery may however ignore spatial variation within a low-resolution pixel, which
could be picked up using finer spatial resolution imagery. For example, if an index-based insurance is
provided for agriculture, one could limit the analysis to those (fine resolution) pixels falling within
cropland. However, extreme cases ignored (e.g., irrigated crops), in our experience meso- to large-scale
meteorological anomalies are usually well retrieved through a number of (observational) scales. Indeed,
from our point of view, data quality—and hence the quality of the data pre-processing—as well the
available archive, seem of higher importance for index insurance than the spatial detail. One should also
not forget that the available rain gauge data used in index insurance are generally representative for areas
much larger than a low-resolution satellite pixel.
The final and likely greatest challenge is whether the insurance scheme can effectively limit basis
risk. A key requirement to achieve that is to have an index (or a set of complementary indices) that shows
high correlation with the losses suffered by farmers or pastoralists. This challenge is composed of two
main elements; index construction and calibration options.
Regarding index construction, this review showed that several data could be used, including, but not
limited to, satellite-derived vegetation indices (e.g., NDVI) and rainfall estimates. However, even when
an initial choice for a data source has been made, a large variety of approaches can be deployed to use
that data source. For example Funk et al. [79] provide an overview of studies that found different
time-integrations of NDVI optimal to predict agricultural yields. Besides temporal integration, choices
can also be made regarding the spatial integration of the data source. The spatial integration refers to the
size of the aggregation units used, in many cases determined by how data on asset losses for calibration
are aggregated. In addition, within a spatial unit, decisions can also be made to limit the spatial
integration to areas covered by a land use of interest [80]. These choices are often crucial for the
performance of the index vis-à-vis induced losses. For this reason, while existing insurance schemes like
IBLI (Section 4.2) have provided insurance following one specific temporal and spatial integration [55],
they are continuing efforts to improve this integration further with the purpose to reduce basis risk. We
therefore suggest that the choice and optimization of spatio-temporal design parameters is an important
area for further research, very likely resulting in region-dependent designs.
Data on agricultural yields or livestock losses are needed for calibrating potential indices and to select
an appropriate index (and its spatio-temporal integration) that reduces basis risk. The lack of reliable
Remote Sens. 2014, 6 10906
crop statistics and long-term agricultural yield data in many developing countries is therefore a key
constraint to the uptake of remote sensing in crop insurance. Equally, the lack of livestock loss data
creates problems for livestock insurance. Although in some cases, logically relationships may be
assumed between agricultural yields and reduced levels of an index like seasonal-integrated NDVI,
the impossibility to effectively calibrate this index may result in poor performance of an insurance
scheme. Particularly if this would result in no payout to farmers/pastoralists in seasons with high losses,
this will have large negative effects on future insurance uptake.
6. Conclusions and Recommendation
The purpose of this paper was to review the state of the art in use of remote sensing in the insurance
industry. While there are examples of insurance companies using remote sensing directly or in combination
with other indices it remains a curiosity as to why remote sensing has not been adopted more widely by
the insurance industry. The adoption of the technology in claim-based insurance is poor, an observation
that we attribute to the limited impact of remote sensing techniques on the profitability of the industry.
Our analysis suggests that index based insurance has a greater potential for uptake by the industry
because the application of remote sensing in index insurance is an example of redesigning the way
business is done. It allows for the development of insurance products in areas and to customers that could
not be reached before. It thus allows the industry to develop new markets, which could not be serviced
without remote sensing. Apart from this the technique also has potential to replace traditional agricultural
insurances, because it might be provided at lower costs to the insured and subsidizing sponsors. Remote
sensing also has potential to supply information to existing index insurances that currently use other
information sources, such as rain gauges or area-averaged yield data, which could be an interesting
market because markets for index insurances not using remote sensing are much larger than the current
market for remotely sensed index insurance. For this reason—together with other advantages of index
insurance—we expect a further growth of opportunities for remote sensing in index insurance.
The discussion identified several issues that need to be addressed to promote the adoption of remote
sensing in index insurance. These include the creation or continuation of an enabling environment
willing to subsidize the insurance as well as solving several technical challenges in the field of remote
sensing. Apart from this, the slow adoption of remote sensing in insurance is also the result of a mutual
lack of understanding of the opportunities offered by the remote sensing community and the insurance
industry. During this review we realized that although there have been a number of workshops that
brought these communities together [44,81,82], there have been very few papers comprehensively
reviewing the potential of remote sensing in insurance synthesizing the perspectives in both worlds.
We anticipate that this paper assists to fill this gap and support those interested in promoting the adoption
of remote sensing in insurance. In this respect, we call for the remote sensing community to consider
collaborating more closely with economists, agro-meteorologists and insurers in order to more
effectively approach the challenge of developing successful applications of remote sensing in insurance.
Remote Sens. 2014, 6 10907
Acknowledgments
We thank the four anonymous reviewers and the editor in chief for their constructive comments that
helped to improve the article. We also wish to acknowledge the support of the CGIAR Research
Programs for Drylands Systems (CRP 1.1) and for Water, Land and Ecosystems (CRP 5).
Author Contributions
Jan De Leeuw conceptualized and led the writing, Anton Vrieling, Apurba Shee, Kiros Hadgu,
Chandrashekhar Biradar, Clement Atzberger; Calum Turvey contributed to the writing. Humphrey Keah
managed the database and organized references and citations.
Conflicts of Interest
The authors declare no conflict of interest.
References
1. Towery, N.G.; Eyton, J.R.; Changnon, S.A.; Dailey, C.L. Remote Sensing of Crop Hail Damage.
Report of Research to the Country Companies (Referred to in Towery, 1980); 1975; p. 29.
2. Towery, N.G. Some Applications of Remote Sensing of Crop-Hail Damage in the Insurance
Industry; Circular 143/80 of the Illinois State Water Survey, Illinois Institute of Natural Resources:
Urbana, IL, USA, 1980; p. 17.
3. Smith, K. Environmental Hazards Assessing Risk and Reducing Disasters, 6th ed.; Routledge:
Abingdon, UK, 2013; p. 371.
4. Young, F.; Chandler, O.; Apan, A. Crop Hail Damage: Insurance Loss Assessment using Remote
Sensing. In Proceedings of the Remote Sensing and Photogrammetry Society Conference, Aberdeen,
UK, 7–10 September 2004.
5. Rojas, O.; Vrieling, A.; Rembold, F. Assessing drought probability for agricultural areas in Africa
with coarse resolution remote sensing imagery. Remote Sens. Environ. 2011, 115, 343–352.
6. Wikipedia Insurance. Available online: http://en.wikipedia.org/wiki/Insurance (accessed on 5
November 2014).
7. Herbold, J. New approaches to agricultural insurance in developing economies. In Finance for
Food: Towards New Agricultural and Rural Finance; Kohn, D., Ed.; Available online:
http://link.springer.com/chapter/10.1007%2F978-3-642-54034-9_9#page-1 (accessed on 5
November 2014).
8. Triplet, J.E.; Bosworth, B.P. “Baumol’s disease” has been cured: IT and multifactor productivity in
US service industries. In The New Economy and Beyond, Past, Present and Future; Jansen, D.W., Ed.;
Edward Elgar Publishing: Cheltenham, UK. 2006; pp. 34–71.
9. ACIL Tasman. The value of spatial information: The impact of modern spatial information
technologies on the Australian economy. In A Report Prepared for the CRC for Spatial Information
and ANZLIC—The Spatial Information Council; ACIL Tasman: Melbourne, Australia, 2008;
pp. 1–98.
Remote Sens. 2014, 6 10908
10. Bhattamishra, R.; Barrett, C.B. Community-Based risk management arrangements: A review.
World Dev. 2010, 38, 923–932.
11. Herbold, J. Index insurance in agriculture, the (re) insurers perspective. In The Challenges of
Index-Based Insurance for Food Security in Developing Countries; Gommes, R., Kayitakire, F., Eds.;
Joint Research Centre: Ispra, Italy, 2013; pp. 47–54.
12. Alderman, H.; Haque, T. Countercyclical safety nets for the poor and vulnerable. Food Policy 2006,
31, 372–383.
13. Barnett, B.J. Agricultural index insurance products: Strengths and limitations. In Agricultural
Outlook Forum; United States Department of Agriculture: Arlington, VA, USA, 2004; p. 41.
14. World Bank. Managing Agricultural Production Risk; The World Bank, Agriculture and Rural
Development Department: Washington, DC, USA, 2005; p. 129.
15. Mahul, O.C.; Stutley, C.J. Government Support to Agricultural Insurance: Challenges and Options
for Developing Countries; World Bank: Washington, DC, USA, 2010.
16. Mahul, O. Agricultural insurance for developing countries—The role of governments.
In Proceedings of the FARM—Pluriagri Conference on Insuring Agricultural Production, Paris,
France, 18 December 2012.
17. Mathieu, P.P. Space for Insurance. Environmental Finance. Available online: http://www.eomd.esa.int/
files/document/131-176-149-30_200562910165.pdf (accessed on 5 November 2014)
18. Tapiador, F.J.; Turk, F.J.; Petersen, W.; Hou, A.Y.; Garcia-Ortega, E.; Machado, L.A.T.; Angelis, C.F.;
Salio, P.; Kidd, C.; Huffman, G.J. Global precipitation measurement: Methods, datasets and
applications. Atmos. Res. 2012, 104, 70–97.
19. Damron, J.J. Comparing Digital Flood Insurance Rate Maps (DFIRMS) to Interferometric
Synthetic Aperture Radar (IFSAR) Products; U.S. Army Engineer Research and Development
Center: Alexandria, VA, USA, 2000.
20. Sanders, R.; Shaw, F.; MacKay, H.; Galy, H.; Foote, M. National flood modelling for insurance
purposes: Using IFSAR for flood risk estimation in Europe. Hydrol. Earth Syst. Sci. 2005, 9, 449–456.
21. Bach, H.; Appel, F.; Fellah, K.; de Fraipont, P. Application of flood monitoring from satellite for
insurance. In Proceedings of the International Geoscience and Remote Sensing Symposium
(IGARSS), Seoul, Korea, 25–29 July 2005; Volume 1, pp. 63–66.
22. Murtach, J.; Cheesman, P. Laser altimetry and flood risk assessment: Practical application of laser
altimeter data in the insurance industry. Geomat. Info Mag. 1999, 13, 6–9.
23. Flood Insurance Rate Map (FIRM). Available online: http://www.fema.gov/floodplain-management/
flood-insurance-rate-map-firm (accessed on 21 April 2013).
24. Peters, A.J.; Griffin, S.C.; Vina, A.; Ji, L. Use of remotely sensed data for assessing crop hail
damage. Photogramm. Eng. Remote Sens. 2000, 66, 1349–1355.
25. Smith, A.M.; Daub, N.; Nadeau, C. Assessing hail damage in agricultural crops using MERIS data.
In Proceedings of the 26th Canadian Symposium on Remote Sensing, Wolfville, NS, Canada,
14–16 June 2005; pp. 365–371.
26. Apan, A.; Chandler, O.; Young, F.; Maraseni, T. Opportunities and limitations of remote sensing
for crop loss (hail damage) assessment in the insurance industry. In Proceedings of the Spatial
Sciences Institute Biennial Conference: Spatial Intelligence, Innovation and Praxis (SSC2005),
Melbourne, Australia, 14–16 September 2005.
Remote Sens. 2014, 6 10909
27. Felix, M.O.K.P. Correlation of polarimetric radar hail signature with MODIS satellite ground truth
data. Colorado state university’s chill radar REU program. In Proceedings of the 21st AMS
Conference on Hydrology, San Antonio, TX, USA, 14–18 January 2007.
28. Little, B.; Schucking, M.; Gartrell, B.; Chen, B.; Olson, S.; Ross, K.; Jenkerson, C.; KcKellip, R.
Remote sensing and US crop insurance program integrity: Data mining satellite and agricultural
data. WIT Trans. Inf. Commun. Technol. 2007, 30, 151–159.
29. Burnett, J. High Tech Methods Crack Farm Insurance Cheats. Available online:
http://www.npr.org/templates/story/story.php?storyId=5013871 (accessed on 5 November 2014).
30. Capellades, M.A.; Reigber, S.; Kunze, M. Storm damage assessment support service in the US Corn
belt using RapidEye satellite imagery. Proc. SPIE 2009, 7472, doi:10.1117/12.830393.
31. Radar-Based Remote Sensing Technology Revolutionizes Crop Insurance, 2011. Available online:
https://www.allianz.com/en/press/news/business/insurance/news_2011–07–27.html (accessed on
28 April 2014).
32. Canaseva, A.; Dagorne, A. Assessment of forest fire zones by airborne colour infrared remote
sensing. Photo Interpret. 1985, 85, 27–34.
33. Lentile, L.B.; Holden, Z.A.; Smith, A.M.S.; Falkowski, M.J.; Hudak, A.T.; Morgan, P.;
Lewis, S.A.; Gessler, P.E.; Benson, N.C. Remote sensing techniques to assess active fire
characteristics and post-fire effects. Int. J. Wildland Fire 2006, 15, 319–345.
34. Mouillot, F.; Schultz, M.G.; Yue, C.; Cadule, P.; Tansey, K.; Ciais, P.; Chuvieco, E. Ten years of
global burned area products from space borne remote sensing—A review: Analysis of user needs
and recommendations for future developments. Int. J. Appl. Earth Obs. Geoinf. 2014, 26, 64–79.
35. Shacklock, R. Remote sensing aids fire damage assessment: Innovative digital imagery technology
is used for speedy and effective responses to timber plantation fires in South Africa. GEO Connex.
2007, 6, 32–33.
36. Halcrow, H.G. The Theory of Crop Insurance. Ph.D. Dissertation, University of Chicago, Chicago,
IL, USA, 1948.
37. GFDRR. National agricultural insurance scheme in India. In Disaster Risk Financing and Insurance
Case Study; GFDRR: Washington, DC, USA, 2011; pp. 1–2.
38. Glauber, J.W. Crop insurance reconsidered. Am. J. Agric. Econ. 2004, 86, 1179–1195.
39. Bardsley, P.; Abey, A.; Davenport, S. The economics of insuring crops against drought. Aust. J.
Agric. Econ. 1984, 28, 1–14.
40. Quiggin, J. A note on the viability of rainfall insurance. Aust. J. Agric. Econ. 1986, 30, 63–69.
41. Smith, V.H.; Watts, M. Index Based Agricultural Insurance in Developing Countries: Feasibility,
Scalability and Sustainability; Department of Agricultural Economics and Economics, Montana
State University: Bozeman, MT, USA, 2011; p. 40. Avialable online: http://www.ibrarian.net/
navon/page.jsp?paperid=17443900 (accessed 5 November 2014).
42. International Fund for Agricultural Development. Weather Index-Based Insurance in Agricultural
Development: A Technical Guide; IFAD: Rome, Italy, 2011; p. 66.
43. Miranda, M.J.; Farrin, K. Index insurance for developing countries. Appl. Econ. Perspect. Policy
2012, 34, 391–427.
Remote Sens. 2014, 6 10910
44. Gommes, R.; Kayitakire, F. The challenges of index-based insurance for food security in developing
countries. In Proceedings of Technical Workshop Organised by the EC Joint Research Centre (JRC)
and the International Research Institute for Climate and Society (IRI, Earth Institute, Columbia
University), JRC, Ispra, Italy, 2–3 May 2012.
45. Vrieling, A.; Meroni, M.; Shee, A.; Mude, A.G.; Woodard, J.; de Bie, C.A.J.M. Historical extension
of operational NDVI products for livestock insurance in Kenya. Int. J. Appl. Earth Obs. Geoinf.
2014, 28, 238–251.
46. Hollmann, R.; Merchant, C.J.; Saunders, R.; Downy, C.; Buchwitz, M.; Cazenave, A.; Chuvieco, E.;
Defourny, P.; de Leeuw, G.; Forsberg, R. The ESA climate change initiative satellite data records
for essential climate variables. Bull. Am. Meteorol. Soc. 2013, 94, 1541–1552.
47. Pedelty, J. Generating a long-term land data record from the AVHRR and MODIS instruments.
In Proceedings of the IGARSS Conference “Sensing and Understanding our Planet”, Barcelona,
Spain, 23–27 July 2007.
48. Hobbs, T.J. The use of NOAA-AVHRR NDVI data to assess herbage production in the arid
rangelands of central Australia. Int. J. Remote Sens. 1995, 16, 1289–1302.
49. Goward, S.N.; Tucker, C.J.; Dye, D.G. North-American vegetation patterns observed with the
NOAA-7 advanced very high-resolution radiometer. Vegetatio 1985, 64, 3–14.
50. Al-Bakri, J.T.; Taylor, J.C. Application of NOAA AVHRR for monitoring vegetation conditions
and biomass in Jordan. J. Arid Environ. 2003, 54, 579–593.
51. Tucker, C.J.; Vanpraet, C.L.; Sharman, M.J.; Vanittersum, G. Satellite remote sensing of total
herbaceous biomass production in the Senegalese Sahel: 1980–1984. Remote Sens. Environ. 1985,
17, 233–249.
52. Prince, S.D. Satellite remote-sensing of primary production—Comparison of results for Sahelian
grasslands 1981–1988. Int. J. Remote Sens. 1991, 12, 1301–1311.
53. Fuller, D.O. Trends in NDVI time series and their relation to rangeland and crop production in
Senegal, 1987–1993. Int. J. Remote Sens. 1998, 19, 2013–2018.
54. Hellmuth, M.E.; Osgood, D.E.; Hess, U.; Moorhead, A.; Bhojwani, H. Index Insurance and Climate
Risk: Prospects for Development and Disaster Management; Climate and Society No 2;
International Research Institute for Climate and Society (IRI): New York, NY, USA, 2009; p. 112.
55. Chantarat, S.; Mude, A.G.; Barrett, C.B.; Carter, M.R. Designing index-based livestock insurance
for managing asset risk in northern Kenya. J. Risk Insur. 2013, 80, 205–237.
56. Rao, K.N. Index based crop insurance. Agric. Sci. Proced. 2010, 1, 193–203.
57. Bokusheva, R.; Spivak, L.; Vitkovskaya, I.; Kogan, F.; Batyrbayeva, M. Application of remote-sensing
data in the index-based insurance design. In Proceedings of the 2012 IEEE International Geoscience
and Remote Sensing Symposium (IGARSS), Munich, Germany, 22–27 July 2012.
58. Bobojonov, I.; Aw-Hassan, A.; Sommer, R. Index-based insurance for climate risk management
and rural development in Syria. Clim. Dev. 2013, 6, 166–178.
59. Pantakar, M. Comprehensive Risk Cover through Remote Sensing Techniques in Agriculture
Insurance for Developing Countries: A Pilot Project; Micro-Insurance Innovation Facility,
International Labour Organization: Geneva, Switzerland, 2011; p. 34.
Remote Sens. 2014, 6 10911
60. Makaudze, E.M.; Miranda, M.J. Catastrophic drought insurance based on the remotely sensed
normalised difference vegetation index for smallholder farmers in Zimbabwe. Agrekon 2010, 49,
418–432.
61. Turvey, C.G.; McLaurin, M.K. Applicability of the Normalized Difference Vegetation Index
(NDVI) in index-based crop insurance design. Weather Clim. Soc. 2012, 4, 271–284.
62. Johnson, L. Agricultural index insurance through remote sensing: Experiences from east Africa.
In Remote Sensing Beyond Images; 2013. Available online: http://www.slideshare.net/CIMMYT/
l-johnson-sfsa-remote-sensing-public (accessed on 5 November 2014).
63. Kidd, C.; Levizzani, V. Status of satellite precipitation retrievals. Hydrol. Earth Syst. Sci. 2011, 15,
1109–1116.
64. Dinku, T.; Ceccato, P.; Connor, S.J. Challenges of satellite rainfall estimation over mountainous
and arid parts of east Africa. Int. J. Remote Sens. 2011, 32, 5965–5979.
65. World Bank. NDVI Pasture Index-Based Insurance for Livestock Producers in South West Buenos
Aires Province; Feasibility Study: Final Report; World Bank: Washington, DC, USA, 2012.
66. World Bank. NDVI Pasture Index-Based Insurance for Livestock Producers in URUGUAY;
Feasibility Study: Final Report; World Bank: Washington, DC, USA, 2013.
67. Hammer, M. Reengineering work: Don’t automate, obliterate. Har. Bus. Rev. 1990, July/August,
104–112.
68. Leblois, A.; Quirion, P.; Sultan, B. Weather index-based insurance in a cash crop regulated sector:
Ex-ante evaluation for cotton producers in Cameroon. Research Paper 21. Micro Insurance
Innovation Facility, International Labour Office, Geneva, 2013. Available online: http://www.ilo.org/
public/english/employment/mifacility/download/repaper21.pdf (accessed on 5 November 2014).
69. Lou, W.P.; Ji, Z.W.; Sun, K.; Zhou, J.N. Application of remote sensing and GIS for assessing
economic loss caused by frost damage to tea plantations. Precis. Agric. 2013, 14, 606–620.
70. Macauley, M. The value of information: Measuring the contribution of space-derived earth science
data to resource management. Space Policy 2006, 22, 274–282
71. Bouma, J.A.; Van Der Woerd, H.J; Kuik, O.J. Assessing the value of information for water quality
management in the North Sea. J. Env. Manag. 2009, 90, 1280–1288
72. Woodard, J.; Shee, A.; Mude, A.G. A Spatial Econometric Approach to Scalable Index Insurance
against Drought Related Livestock Mortality in Kenya; International Livestock Research Institute:
Nairobi, Kenya, 2014; p. 29.
73. Janzen, S.A.; Carter, M.R. After the Drought: The Impact of Microinsurance on Consumption
Smoothing and Asset Protection; NBER Working Paper Series 19072; National Bureau of
Economic Research: Cambridge, MA, USA, 2013; p. 27.
74. Binswanger-Mkhize, H.P. Is there too much hype about index-based agricultural insurance?
J. Dev. Stud. 2012, 48, 187–200.
75. Shee, A.; Turvey, C.G. Collateral-free lending with risk-contingent credit for agricultural
development: Indemnifying loans against pulse crop price risk in India. Agric. Econ. 2012, 43,
561–574.
76. Belward, A.S.; Skøien, J.O. Who launched what, when and why; trends in global land-cover
observation capacity from civilian earth observation satellites. ISPRS J. Photogramm. Remote Sens.
2014, in press.
Remote Sens. 2014, 6 10912
77. Atzberger, C.; Eilers, P.H.C. Evaluating the effectiveness of smoothing algorithms in the absence
of ground reference measurements. Int. J. Remote Sens. 2011, 32, 3689–3709.
78. Meroni, M.; Kayitakire, F.; Brown, M. Remote sensing of vegetation: Potential applications for
index insurance. In The Challenges of Index-Based Insurance for Food Security in Developing
Countries; Gommes, R., Kayitakire, F., Eds. Joint Research Centre: Ispra, Italy, 2013; pp. 238–245.
79. Funk, C.; Budde, M.E. Phenologically-Tuned MODIS NDVI-based production anomaly estimates
for Zimbabwe. Remote Sens. Environ. 2009, 113, 115–125.
80. Genovese, G.; Vignolles, C.; Negre, T.; Passera, G. A methodology for a combined use of
normalised difference vegetation index and Corine land cover data for crop yield monitoring and
forecasting. A case study on Spain. Agronomie 2001, 21, 91–111.
81. ESA. Industry Workshop on Satellite EO for the Insurance Sector: New Technologies and
Opportunities; European Space Agency ESA/ESRIN: Frascati, Italy, 2012; p. 19.
82. Ebel, U. Requirements for EO Service in the Insurance Industry. Available online:
http://earth.eo.esa.int/workshops/Insurance/files/EO_services_report.pdf (accessed on 6
November 2014).
© 2014 by the authors; licensee MDPI, Basel, Switzerland. This article is an open access article
distributed under the terms and conditions of the Creative Commons Attribution license
(http://creativecommons.org/licenses/by/4.0/).
![Remote Sens. 2013 OPEN ACCESS remote sensing · 2017-08-18 · Remote Sens. 2013, 5 2166 datasets have emerged like Structure from Motion (SfM) [22]. Most recently, successful vineyard](https://img.pdfslide.us/doc/110x75/5f664f42bc872d2c2004934f/remote-sens-2013-open-access-remote-sensing-2017-08-18-remote-sens-2013-5-2166.jpg)


![Remote Sens. 2015 OPEN ACCESS remote sensing · 2015-10-23 · Remote Sens. 2015, 7 11018 larger area with ecosystem models [16–19]. As an important proxy of terrestrial carbon](https://img.pdfslide.us/doc/110x75/5f4fbc1257712b67c20c897b/remote-sens-2015-open-access-remote-sensing-2015-10-23-remote-sens-2015-7-11018.jpg)


![Remote Sens. OPEN ACCESS remote sensing · PDF fileRemote Sens. 2015, 7 9255 correlation and extracting principal component of the data, Lee [10] developed a generalized principal](https://img.pdfslide.us/doc/110x75/5ab813a47f8b9aa6018c3787/remote-sens-open-access-remote-sensing-sens-2015-7-9255-correlation-and-extracting.jpg)