Embed Size (px)
Citation preview

RELIGIOSITY AND FEAR OF CRIME
by
Jonathan Bolen
A thesis
submitted in partial fulfillment
of the requirements for the degree of
Master of Arts in Criminal Justice
Boise State University
December 2010

BOISE STATE UNIVERSITY GRADUATE COLLEGE
DEFENSE COMMITTEE AND FINAL READING APPROVALS
of the thesis submitted by
Jonathan Bolen
Thesis Title: Religiosity and Fear of Crime
Date of Final Oral Examination: 06 October 2010
The following individuals read and discussed the thesis submitted by student Jonathan Bolen, and they evaluated his presentation and response to questions during the final oral examination. They found that the student passed the final oral examination.
Andrew Giacomazzi, Ph.D. Chair, Supervisory Committee
Lisa Growette-Bostaph, Ph.D. Member, Supervisory Committee
Robert Marsh, Ph.D. Member, Supervisory Committee
The final reading approval of the thesis was granted by Andrew Giacomazzi, Ph.D., Chair of the Supervisory Committee. The thesis was approved for the Graduate College by John R. Pelton, Ph.D., Dean of the Graduate College.

iv
DEDICATION
For Zoe and Angela, the calm in my storm, the anchor of my ship.

v
ABSTRACT
Previous research investigating fear of crime has returned little universal agreement as to
what exacerbates and what reduces an individual’s level of fear of crime. In this thesis the
researcher seeks to add to the mountain of literature on fear of crime and to include a
novel independent variable, religiosity, in effort to better inform the fear of crime debate.
Analyzing survey data collected from students at an urban university, the researcher finds
that (1) females are far more fearful than their male counterparts; (2) religiosity is not
informative on varying levels of fear of crime in the sample. An unintended finding was
strong instruments to further investigate a possible religiosity/fear of crime relationship
that are available to future researchers. The results of this research indicate that fear of
crime is a complex phenomenon, and is in need of further research.

vi
TABLE OF CONTENTS
DEDICATION................................................................................................................... iv
ABSTRACT........................................................................................................................ v
LIST OF TABLES........................................................................................................... viii
INTRODUCTION .............................................................................................................. 1
REVIEW OF THE LITERATURE .................................................................................... 3
Gendered Differences ........................................................................................... 10
Fear of Crime ............................................................................................ 10
Religiosity ................................................................................................. 12
METHODOLOGY ........................................................................................................... 15
Research Question and Purpose............................................................................ 15
Research Design.................................................................................................... 16
Sampling Procedure .............................................................................................. 17
PRETEST OF THE INSTRUMENT................................................................................ 19
MEASURES ..................................................................................................................... 20
Independent Variable ............................................................................................ 20
Religiosity. ................................................................................................ 20
Dependent Variable .............................................................................................. 22
Fear of Crime ............................................................................................ 22
Control Variables .................................................................................................. 24
Age............................................................................................................ 24

vii
Race/Ethnicity........................................................................................... 24
Socioeconomic Status ............................................................................... 24
Gender....................................................................................................... 25
Education .................................................................................................. 26
Perceived Risk .......................................................................................... 26
RESULTS ......................................................................................................................... 28
Demographics of the Sample Population.............................................................. 28
Correlation and Analysis....................................................................................... 31
Ordinary Least Squares (OLS) & Analysis .......................................................... 34
DISCUSSIONS AND CONCLUSIONS .......................................................................... 37
REFERENCES ................................................................................................................. 44
APPENDIX A................................................................................................................... 44
Survey Instrument
APPENDIX B ................................................................................................................... 51
Pearson Correlation Matrix
APPENDIX C …….…..……………………………………………………………………….62
Pearson Correlation Matrix 2

viii
LIST OF TABLES
Table 1. Descriptive Statistics.......................................................................................... 29
Table 2. OLS Regression ................................................................................................. 35

1
INTRODUCTION
Accurately defining fear of crime has been, and continues to be, a difficult and
highly debated task attempted by many researchers (Scarborough, Like-Haislip, Novak,
Lucas, & Alarid, 2010). Though difficult to accurately define, many researchers agree
that the negative emotional states stemming from belief in the potential of crime
victimization, and related attitudes, behaviors, and cognitive risk assessment associated
with that perceived potential is an accepted definition for fear of crime (Scarborough et
al. 2010). A growing concern among policy makers and citizens alike, fear of crime can
come at a significant cost to an individual, a neighborhood and a nation. Many of these
costs are tangible or direct, such as increases in criminal justice budgets, insurance
premiums, and security measures, with a monetary price tag clearly indicated. Other costs
stem from less tangible psychological, emotional, and physical effects that can
accompany an increased and prolonged level of fear (Dolan & Peasgood, 2007).
Though at the most basic level all individuals have some fear of crime, there can
be substantial variation among individuals. In essence, it is not easy to say that one fears
crime the same way as another and further that the price paid by each individual for
his/her fear is the same. Many different variables have been established by researchers
that correlate with fear of crime, including age, neighborhood conditions, an individual’s
perceived personal risk of victimization, and even the amount of local television news
that an individual watches (Weitzer & Kubrin, 2004). Though many variables can affect
fear of crime, none can be identified as the primary cause for increased or decreased
2
levels, leading this researcher to search for new variables that may be influencing fear
levels to add to the existing body of research.
Religiosity has been largely ignored as a variable in understanding fear of crime,
and this research will serve as the first step to explore it as a variable that might affect
fear of crime. Being better able to examine religiosity’s impact on citizens’ fear levels
makes policy agents more capable of understanding the construct of fear of crime in
general and what can be done to reduce it. If it is found that an individual’s religiosity
impacts fear of crime, whether as an inhibitor or facilitator, the multitude of programs
(community-based or otherwise) aimed at reducing fear may have only minimal effect,
and more interpersonal fear reduction tactics may be appropriate. As such, the current
research attempts to establish religiosity as a salient variable in the fear of crime debate,
and to provide policy makers with an enriched view of factors impacting fear of crime.

3
REVIEW OF THE LITERATURE
Fear of crime has been ostensibly researched. The following is a selected review
of the voluminous research that best targets and illustrates the construct developed for the
current study. Many scholars have debated what factors increase and decrease an
individual’s fear of crime. Franklin, Franklin, and Fearn (2008) explain that most
theoretical paradigms regarding fear of crime fall into two camps: facilitators and
inhibitors of fear of crime. The former category encompasses elements that increase the
fear of individuals, such as personal victimization and perceived risk. The latter of the
two categories are variables that reduce levels of fear in an individual, including social
integration and neighborhood cohesion (Franklin et al., 2008). Further, the authors detail
three primary models noted in the research that explain varying levels of fear of crime:
vulnerability, disorder, and social integration models.
The vulnerability model includes two factors: personal vulnerability and social
vulnerability. The former can be summarized by an individual’s perceived ability to fend
off an attacker, the latter of the two is the increased exposure to victimization via
sociodemographic factors (e.g., impoverished high crime area) and access to social
networks and resources to resolve victimization if it occurs (Franklin et al., 2008). The
second of the two models, disorder, measures physical and social decay in a given area.
Drawing from Shaw and Mckay (1942) (as cited in Franklin et al., 2008, p. 208), this
model examines the incivilities perceived by an individual in his/her neighborhood and
the effect of perceived neighborhood disorder stemming from those incivilities. The final

4
model, social integration, is the only model among the three that examines a fear of crime
inhibitor. The social integration model includes the sense of community and belonging
that an individual has in his/her neighborhood and with social groups in general.
In effort to examine which of these three models best explains the variance in
levels of fear of crime, Franklin and colleagues (2008) reviewed data collected from
2,861 surveys spanning 21 cities in Washington State. Utilizing the three aforementioned
models, the researchers conducted hierarchical modeling to determine which model best
explained fear of crime. What the authors found was that each of the aforementioned
models had a statistically significant effect on fear of crime.
Though each of the models was able to explain levels of variance in fear of crime,
the disorder model proved to be the most accurate across all cities. The authors further
noted that there may be substantial overlap among the three models and since each of the
models was able to explain varying levels of fear of crime, researchers should be warned
against being rigid in their modeling of fear of crime (Franklin et al., 2008).
Similar results and assertions were found by McGarrell, Giacomazzi, and
Thurman (1997). Community level perceptions of disorder were discovered to be the
most significant in predicting heightened and mitigated levels of fear among Washington
State residents. Also in agreement with Franklin et al. (2008), the researchers concluded
that individual demographic variables, namely being female, were strongly correlated
with heightened levels of fear of crime.
Previously, a definition of fear of crime was offered that was all encompassing,
though it is important to note that fear of crime may not be an omniscient construct.

5
Moore and Shepherd (2007) conducted a secondary data analysis using the British Crime
Survey from 2001, questioning whether or not the umbrella term ‘fear of crime’ was
reducible to specific crimes. The researchers also explored if the long established
relationship between age and fear of crime was a result of fear of specific crimes.
What the authors uncovered was that fear of crime can be reduced and
dichotomized to fear of property loss and fear of personal harm. The authors contend that
early in life (16-25 years of age) fear of personal harm is the most salient element of
increased levels of fear of crime. However, this fear decreases significantly in an
individual’s mid-adulthood. It is at that time that fear of property loss becomes the
primary dimension of an individual’s fear of crime, the peak of which is reached at age
forty-five. Moore and Shepherd (2007) note that the least fearful of all the age groups
was sixty and above, directing the authors to assert that increased vulnerability that
accompanies age is not informative to an individual’s fear of crime within the research
population. It is important to note, however, that this finding is at odds with other fear of
crime research, the findings of which indicate increased age is strongly correlated with
increases in fear of crime (for a brief discussion see Franklin et al., 2008).
Though fear of crime has been abundantly researched by criminologists,
religiosity has not yet been established as a viable variable worth consideration within
that research. However, religiosity within the context of criminal justice issues has been
researched, especially with regards to desistance from crime and drug use among
adolescents. The following is a brief overview of this research in effort to illustrate the

6
current standing of religiosity as a variable within criminal justice research, and to serve
as a transition into the current research.
The examination of religiosity and criminality in social research is well and long
established (Baier & Wright, 2001; Heaton, 2006). Arguably, the most infamous case of
the study of religiosity and crime is that of Hirschi and Stark (1969). In their landmark
study, Hirschi and Stark (1969) found a negligible effect of religiosity (measured through
church attendance) on delinquency in a large, random, sample of students, and concluded
that an individual’s religiosity is in no way a deterrent to delinquency. This controversial
and somewhat counterintuitive finding spawned a number of researchers to look closely
at religiosity and its relationship with criminality. The results of this quest proved to
widen the debate as to whether a relationship between religiosity and criminality existed,
and furthermore, what the nature of such a relationship was (Baier and Wright, 2001).
In an effort to consolidate the findings of previous research examining religiosity
and criminality and to inform the controversy on the religiosity/crime question, Baier and
Wright (2001) conducted a meta-analysis of 60 previous research studies examining
religiosity and crime. What the authors found was that in general, religiosity has a
significant, however modest, inverse relationship with criminality over all studies, and
that variance in this relationship between studies could partially be explained by four
factors: sampling religious populations, violent versus non-violent crime as the dependent
variable, sample size, and racial diversity of the sample (Baier & Wright, 2001). Similar
findings were provided by Chitwood, Weiss, and Leukefeld (2008) in their examination
of religiosity and drug/alcohol use and abuse.

7
In a meta-analysis of 105 studies examining relationships between alcohol/drug
use and religiosity, Chitwood, et al. (2008) found that in the vast majority of studies,
religiosity was negatively correlated with drug/alcohol use and abuse. The authors
further assert that religiosity was found to be a protective factor against drug and alcohol
abuse, regardless of how religiosity was measured in a given study.
Though both Chitwood et al. (2008) and Baier and Wright (2001) have provided
informative meta-analyses suggesting an overall consensus among researchers examining
the broad religiosity/crime relationship, neither provide universal theoretical foundations
for why the relationship exists and how the two (religiosity and criminality) interact. The
fact that the above meta-analyses did not provide a concise theoretical foundation is not
uncommon. Within the literature little, if any, agreement among scholars can be found as
to how the religiosity/deviant behavior relationship operates. This lack of theoretical
agreement among scholars is briefly highlighted below.
Johnson, Jang, Larson, & DeLi (2001) sought to examine the importance of
religiosity in reducing and protecting a youth from delinquency and to further add to the
theoretical debate on the religiosity/crime relationship by incorporating social bonding
and social learning variables. Utilizing longitudinal data from the National Youth Survey
(NYS), the authors found that religiosity had a significant, direct, and consistent
dampening effect on delinquency.
In an attempt to examine the process in which religiosity reduces an individual’s
delinquency, the authors incorporated variables from two theoretic explanations: social
bonding (measured by beliefs) and social learning (measured by delinquent peer

8
association). The authors found that social bonding/social learning were somewhat
informative of the religiosity/crime relationship, in that religiosity and belief were
significantly and negatively related to delinquent peer association and thus related to
reduced delinquency. However, the authors further note that the social control and social
learning variables do not explain the relationship in its entirety and that the relationship
between religiosity and delinquency remains largely independent of the social bonding
and social learning explanations.
The relationship between religiosity and crime also has been scrutinized through
the paradigm of general strain theory (GST). This theoretical explanation posits that an
individual’s religiosity can be relied upon to cope with various stressors and strain in
one’s life, and as such religiosity will serve as an inhibitor to criminal behaviors. To
examine this theoretical relationship, Johnson and Morris (2008) utilized the National
Longitudinal Study of Adolescent Health (Add Health) to examine whether a juvenile’s
religiosity mediated increased levels of strain (as measured by exposure to violence and
school troubles) and reduced violent and property criminality.
The authors found that, as expected, increased levels of strain were highly
informative to increased levels of criminal behavior among the sample. However, the
results of Johnson and Morris’ (2008) research clearly show that religiosity was unable to
reduce or eliminate criminal behavior in response to a juvenile’s strain, leading the
authors to question whether religiosity and other strain conditioning variables are at all
informative to understanding strain coping strategies.

9
Though Johnson and Morris (2008) were unable to find any direct dampening
effect of religiosity on criminality, their findings are not universal. Jang and Johnson
(2005) examined religiosity and its effect on strain and criminality in a sample of African
Americans and found the opposite of Johnson and Morris’ (2008) findings.
Utilizing data obtained by the National Survey of Black Americans, Jang and
Johnson (2005) probed the relationships between gender, religiosity, strain, and
criminality. What the authors discovered was that females were far more likely to be
religious than were men and that their religiosity was a vital tool in their reactions to
strain and reduced their likelihood of responding to strain in criminal ways. The authors
explain that the increased level of religiosity found among females in the sample altered
their strain response by increasing their exposure to other religious individuals, who were
in turn able to assist them through their stressful times. Furthermore, the authors argue
that being female and religiosity both increase the likelihood of internalizing strain and
reducing the likelihood of responding to strain in aggressive/antisocial ways.
The theoretical debate surrounding religiosity and criminality rages on. At this
juncture in religiosity/criminality research, the only clear and universal agreement
appears to be that no one theory has yet explained how an individual’s religiosity
interacts with criminality.

10
Gendered Differences
Fear of Crime
Though many researchers have found different variables that mitigate and
aggravate levels of fear of crime, one variable remains consistent across previous studies.
Gender has been established as an important variable in predicting higher levels of fear of
crime; females have consistently shown higher rates of fear of crime than their male
counterparts (Jennings, Gover, & Pudrzynska, 2007; Schafer, Huebner, & Bynum, 2006;
McGarrell et al., 1997; Ferraro, 1996). The present research explores the relationship
between gender and fear of crime as it relates to an individual’s religiosity. Therefore, it
is important to establish what may be influencing these differing rates of fear among
females before new research is conducted.
Schafer et al. (2006) examined previously collected data that utilized 2,058
telephone interviews in a midsized urban area in an effort to explore differences between
rates of fear of crime and gender. Schafer and colleagues (2006) tested three models,
perceived safety, personal victimization, and property victimization, adhering to the
rationale that by doing so, the researchers would be better able to isolate any identified
gendered differences. The authors further controlled for other known variables that have
impacted an individual’s fear of crime, including age, race, SES, education, and
employment status.
What the authors found was that women in general were more fearful of crime
than men. However, the researchers also found that these engendered differences were
only statistically significant with regard to a limited number of variables (perceived
11
neighborhood disorder and perceptions of major crime, respectively) and were only
applicable to the fear of personal victimization and perceived safety models. The third
model (fear of property victimization) did reveal a correlation: men were found to be
more fearful than women of property victimization; however, this correlation fell short of
statistical significance.
The demographic variables that were controlled for by Schafer et al. (2006)
provided predictive validity for men’s fear of crime but not for women. These results left
the authors to question if the prevalence of fear of sexual victimization felt by women
was to blame, in so far as the fear of sexual victimization that is felt by females and not
by males results in a widening of the net for potential crimes for women to fear. This
hypothesis, posited by Schafer et al. (2006), had been previously investigated by Ferraro
(1996). Reviewing data that were collected through the Fear of Crime in America Survey,
Ferraro (1996) found that women’s fear of sexual assault substantially heightened their
fear of other victimization, especially fear of crimes that involved physical confrontation.
The author’s findings give substantial reliability to the shadow of sexual assault
hypothesis, explaining that sexual assault (a mostly female victim crime) casts a dark and
fearful shadow over women, thereby increasing their fear of crime.
The gendered differences found in rates of fear of crime also may be affected by
issues outside of readily identified demographic variables. For example, Sutton and
Farrall (2005) surveyed 1,629 Scottish residents to explore a possible explanation to
gender differences in fear of crime: do men lie about their fear? To test this hypothesis,
the authors created a survey instrument that monitored fear of crime, but that also
12
included a “lie scale” (Sutton & Farrall, 2005, p. 214), which was designed to examine a
respondent’s desire to give socially desirable answers in which men were hypothesized to
align themselves to socially acceptable gender roles and to minimize their fear of crime.
The authors’ hypothesis was supported in that men who scored high on the lie
scale were also far less likely to score high on their measured fear of crime. This led the
authors to assert that “(. . .) beneath their bravado, men may actually be more fearful than
women” (Sutton & Farrall, 2005, p. 222).
Religiosity
Gender has served as a powerful predictor of an individual’s fear of crime. But
gender also has been evidenced to play a substantial role in predicting an individual’s
religiosity level. Research has shown that females are more religious than males
(Thompson, 1991; Miller & Hoffmann, 1995). Some authors contend that it is not gender
per se that predicts higher levels of religiosity, but rather gender roles (Thompson, 1991).
In his research, Thompson (1991) investigated whether the difference in
religiosity levels between females and males was actually related to an individual’s
accepted gender role, asserting that religion has long been established as a feminine
institution that is founded on typical feminine ideals of community, togetherness, and
properness. The authors speculate that men can be as religious as females only if their
personal paradigm is more feminine than masculine and further contend that females with
a more or less feminine view of the world may impact their personal religiosity, and that
this could explain variation of religiosity levels among females.

13
To test these hypotheses, the researchers administered a survey to 358
undergraduate university students. The instrument was specifically designed to measure
individual religiosity and gender orientation. The researchers found that gender
orientation was much more predictive of an individual’s religiosity than was gender
alone. However, the authors also found that gender orientation was only able to explain
differing levels of religiosity among men and could only account for some difference in
religiosity of females.
The latter of these findings suggests that other explanations as to the varying
levels of religiosity between males and females may not be entirely explained by gender
roles. Miller and Hoffman (1995) hypothesized that gender differences in religiosity may
be influenced not only by accepted female gender roles of submissiveness, obedience,
and nurturing, but rather risk preference. The authors contend, under the philosophy that
believing in a God costs an individual nothing and could provide substantial benefit and
not believing in a God could potentially cost an individual the ultimate price (Pascal’s
wager), non-religious individuals are exhibiting higher levels of risk taking behavior.
Since women in general show far less propensity to take risks, the authors assert that it
follows that women would be substantially more religious than men.
Utilizing data obtained by the Monitoring the Future Study, Miller and Hoffman
(1995) were able to examine if an individual’s risk preference was correlated with his/her
religiosity. The authors found that risk preference was predictive of religiosity in a small,
yet statistically significant way. In light of their findings the authors contend that if
males are being socialized to masculine gender roles that include increased risk behavior,

14
they are being socialized to be less religious (Miller & Hoffman, 1995). This assumption
lends some support to the findings of Thompson (1991). Therefore, it is not the sex of an
individual that determines religiosity, but rather a constellation of traits that is typically
viewed as being feminine.
In the following sections, a review of the methods, instruments, and hypothesis
for the current research will be reviewed. After a foundation of the methods and research
design are provided, an examination of the statistical results of the current study will be
included, followed by discussions and conclusions based on those results.

15
METHODOLOGY
Research Question and Purpose
The aforementioned research was the driving force behind the current research
question: does an individual’s level of religiosity affect his/her fear of crime? The efforts
of previous researchers seeking to establish explanations for the variance in levels of fear
of crime have produced little universal agreement. However, one area that researchers do
appear to agree on is that fear of crime is an extremely complex construct and that many
variables are at play. Previous research has established both macro level reasons for the
variance in fear as well as establishing individual variables for the variance, but to date
any relationship between religiosity and fear of crime has not yet been clearly
established.
With few exceptions, previous research suggests that being female is an important
variable that affects levels of fear (Jennings et al., 2007). Further, previous research
suggests that females are more religious than males (Miller & Hoffman, 1995). If women
in general are more fearful of crime and tend to be more religious than men, speculation
is warranted as to whether the latter is correlated with the former across gender, or if the
relationship is prevalent only in women. The purpose of the current research is twofold.
First, religiosity and its association with fear of crime will be examined. Second, this
research will examine the gender role in this relationship. More specifically, the research
seeks to answer the question of whether an individual’s religiosity and fear of crime is

16
gender specific or if, as previous research suggests, the correlation may be found in both
genders.
Research Design
To investigate the impact of an individual’s religiosity on his/her fear of crime,
the current study utilized survey research. The target population for the questionnaire was
undergraduate and graduate students within the social sciences at a metropolitan
university in the northwest. The use of a questionnaire for this type of research is
particularly appropriate as survey research has been the established, preferred, and most
frequently used research design by researchers exploring fear of crime (Ferraro, 1996;
Franklin et al., 2008; McGarrell et al., 1997; Scarborough et al., 2010).
The student questionnaire was the only method used to explore the research
question. Since the unit of analysis in the research is the individual, a questionnaire
allows for the largest pool of individual subjects to be available to the researcher. Though
utilizing a questionnaire is an appropriate method for examining the research question, it
may be argued that triangulation, or use of multiple methods to examine the research
question is warranted (Farrall, Bannister, Ditton, & Gilchrist, 1997). Such a claim is
generally valid; however it was not feasible for the current research due to limitations in
resources and time that were available. Furthermore, this research is unique in that no
previous studies have been conducted to address this particular research question. As an
undeveloped research area, the current study should be construed as a foundation on
which future research may be conducted. If a relationship between religiosity and fear of

17
crime is established, and if that relationship is found to be informative in increased or
decreased levels of fear of crime, future research should implement multiple methods to
create a more multi-dimensional image of religiosity and fear of crime.
Sampling Procedure
As of the Fall Semester 2009, the metropolitan university had 18,936 students
enrolled (Office of Communications and Marketing, 2010). Due to this high number of
students, distributing a questionnaire to all students to provide a census across the
university was deemed impractical due to cost, time, and practicality. To circumvent the
improbability of obtaining a census, while also maintaining a large enough sample to
administer an array of statistical techniques to data collected, a convenience sample was
used. The convenience sample (the limitations of which will be discussed in a later
section) included students enrolled in summer school courses in the ten academic
departments housed within the social sciences college. In determining which classes
received the survey, initial contact was made via e-mail with the faculty member of a
given class to gain approval to administer the survey to his/her students. Once approval
from the professor was granted, all students for each class were surveyed by the
researcher during the regularly scheduled class period. However, given the large
availability of online courses during the summer, an online version of the questionnaire
was created and made available via the Web-based surveying company, Survey Monkey.
In these cases, potential respondents were informed not to include any personally

18
identifying information on the questionnaire, as anonymity was of central concern and
that their participation in the research was wholly voluntary.
In effort to minimize potential harm to subjects and to insure that the survey
instrument and method of delivery met the rigorous standards of compliance for testing
of human subjects, prior to the delivery of the survey a research proposal was submitted
for review, and was subsequently approved by, the Institutional Review Board.
For the complete questionnaire and the order in which questions were asked, see
Appendix A. Each of the questionnaire items is addressed individually in the following
sections.
Though relationships among femaleness, religiosity, and fear of crime were the
original catalysts for this research, males are included in the sample to better examine
whether any relationships found between religiosity and fear of crime are gender specific
or if they can be generalized to both genders. The student population at the university is
nearly a 50/50 split between males and females, with males representing the minority at
45% (Office of Communications and Marketing, 2010).
Though females are a slight majority in the overall university student population,
they represent a larger majority of survey participants (60.9% of participants are female).
Though the sample is not a mirror image of the demographic makeup of the university
population, females remain the majority and only slightly more so than their overall
percentage in the university’s population. As such, there existed no need to alter sampling
techniques to incorporate more male participants.

19
PRE-TEST OF THE INSTRUMENT
Before distribution of the survey to the targeted sampling frame, the questionnaire
was pre-tested with a small number of friends and family. The reason for doing this was
to further test the validity and reliability of the measures before launching the survey to
the larger target population. Though a largely informal process, by doing so the
researcher was able to preemptively address any issues found in the questionnaire,
thereby avoiding dealing with any problems post hoc. This, in turn, bolstered the validity
of the questionnaire and assured the reliability of the measurement tool.
20
MEASURES
Independent Variable
Religiosity
Religiosity was conceptualized as the presence of devotional religious behavior of
an individual and the importance of religion in an individual’s life. This
conceptualization is consistent with the research literature regarding individual religiosity
(Welch, Tittle, & Grasmick, 2006). Though religiosity can take on many forms and there
is no universal agreement in the field as to how to measure religiosity (Chitwood, et al.,
2008), the above conceptualization allowed for valid measurement beyond the simple
self-description of being religious or not, and allowed the researcher to establish
differences between religious and non-religious individuals, as well as variations among
individuals within those two groups.
In order to measure the devotional element of religiosity, two questionnaire items
were used that have proven to be valid by previous researchers. Using five responses
ranging from (1) never, (2) a few times a year, (3) once or twice a month, (4) once a
week, and (5) several times a week, survey participants were asked, “If ever, how often
did you attend religious services during the past year?” (Jang & Johnson, 2001). The
responses were coded to reflect higher attendance scores as indicative of being more
religious. The second question to explore the devotional element of religiosity was
operationalized as the practice of prayer (Welch et al., 2006). Respondents were asked,

21
“If ever, how often do you pray?” Possible responses were (1) never, (2) rarely, (3)
sometimes, (4) very often, and (5) daily.
Attendance at religious services and the ritual of prayer, however, are not
sufficient on their own to gauge levels of religiosity of an individual. As conceptualized
above, religiosity also means the importance of religion in one’s life. To gauge this
attribute of religiosity, respondents were asked, “How important is religion in your life?”
Participants were provided the following possible responses: (1) not important at all, (2)
not very important, (3) somewhat important, (4) important, and (5) very important (Jang
& Johnson, 2001). Higher “importance” response scores were coded as higher religiosity.
The importance of religion to the survey participants was also measured by two
Likert scale statements that were found to be valid measures by previous researchers:
“Religion influences how I live my life” and “I would describe myself as very religious”
(Welch et al., 2006, p. 1610). The possible responses to both statements were: (1)
strongly disagree, (2) disagree, (3) agree, and (4) strongly agree. Higher numbered scores
were deemed as higher levels of religiosity.
Five categories were created that were derived from the above survey items
measuring religiosity. An individual received a religiosity score determined by his/her
answers to the above religiosity items; the higher the score, the more “religious” the
individual. The answers to the five religiosity items received a numbered score and the
total of that score placed the respondent into one of five groups: Absence of religiousness
(score of 0-2), not religious (score of 3-6), somewhat religious (score of 7-10), religious
(score of 11-14), and very religious (score of 15-18). The formula for determining the
22
total numbered score was the corresponding number of the answer minus one (X-1=Y).
The corresponding number was the number attached to the questionnaire item (i.e., (1)
strongly disagree, received a score of 0, (4) strongly agree received a score of 3).
Originally, it was the intention of the researcher to categorize respondents as “Not
Religious” only if that individual’s religiosity score was zero. However, the religiosity
tool included items that may be evidence of ritual behavior that is systemic of family
pressures. The best example of this is the religious service attendance, whereas an answer
of “(2) A few times a year” would give the respondent a religiosity score of 1, pulling
them out of the originally developed “not religious” category and potentially evidencing
only the individual’s want to please family, not his/her religiosity (Jang & Johnson,
2001). In effort to eliminate this threat to the validity of the instrument, the above
categories were created. Categorization affords the researcher the ability to generalize
comparison to broader groups of people and the categories were created to ease
comparisons between groups of respondents and not just between individual respondents.
Since the majority of questions among the items addressing religiosity had five possible
response choices, five categories were created.
Dependent Variable
Fear of Crime
For the purpose of this study, fear of crime is the emotive feelings of general
danger stemming from crime and behaviors in response to those emotions. Though some
researchers have cautioned that fear of crime conceptualizations and operationalizations

23
may not be accurately describing fear, but rather perceived risk (the latter being a
cognitive reaction to crime, the former being emotional [Jennings, et al., 2007]), the
current research relied on two measurements that have been well established throughout
the literature as validly measuring the emotive feelings of fear that is a result from crime
(McGarrell et al., 1997).
The questionnaire items were originally established by the National Crime
Victimization Survey (NCVS) and consisted of two items: “How safe do you feel being
outside and alone in your own neighborhood at night?” and “How safe do you feel being
outside and alone in your own neighborhood during the day?” (McGarrell et al., 1997).
Response choices to these two questions were: (1) very unsafe, (2) unsafe, (3) neither
safe nor unsafe, (4) safe, and (5) very safe (McGarrell et al., 1997). Further, the responses
of the two questions were collapsed into one statistical measure as was done by
McGarrell et al. (1997), which in their research was capable of producing an alpha score
of .71, making the fear measurement acceptably valid. The five categories for the
collapsed fear of crime measure were: Very fearful, fearful, neither fearful nor un-fearful,
un-fearful, and very un-fearful. It is important to note that the fear of crime measure is
coded inverse to intuition in that the higher an individual’s measured fear of crime score
the less fearful they are.

24
Control Variables
Age
In the current study, some key variables needed to be controlled as they have
frequently been established as affecting an individual’s fear of crime. The first and most
common is age, which was controlled by the inclusion of a questionnaire item asking for
the respondent’s date of birth.
Race/Ethnicity
Race/Ethnicity has been shown to be inconsistent throughout the research as a
variable for predicting fear of crime on its own, (See Scarborough et al. (2010) for a
discussion). However, race/ethnicity has been shown to have a potential affect on fear of
crime levels when examined with other variables and thus was a control variable. It is
important to note, however, that in the current study race/ethnicity was considered a
dichotomous variable when coded. Due to the largely racial homogeneity of the target
population, respondents were coded as either white or non-white. This categorization for
homogeneous populations is in line with previous researchers with similar sample
limitations (see Franklin et al., 2008).
Socioeconomic Status
A third control variable was socioeconomic status (SES), which was measured
with two questionnaire items: pre-tax household income, and pre-tax family household
income (Hudson, 2010). For respondents under the age of 25, they were asked first for

25
their family’s household annual income, and secondly for their household income. For
respondents over the age of 25, they were asked to divulge only their own household
income. The rationale behind using two questionnaire items to measure socioeconomic
status stems from the unique nature of college students. Younger students at universities
may not be fully independent and may still be supported by their families. Therefore,
their personal income may not accurately describe their total access to resources that can
come from financial contributions from outside their own home. To illustrate the point
further, if a respondent acknowledged that his/her annual income was less than $9,000
dollars annually, an appropriate assessment of the individual’s SES would be that they
were from the lower class category. However, if that same respondent’s family paid for
rent, bills, food, and gave the respondent a $1,000 monthly allowance, his/her appropriate
category would change significantly. By utilizing two different measures of SES, the
researcher avoids potential pitfalls of mis-categorizing all respondents based solely on
their individual income, which circumvents a substantial risk to internal validity of the
variable.
In all, an individual’s SES was needed within the control variables of the current
study because previous fear of crime literature has established it as informative in
assessing variance in fear of crime levels (Schafer et al., 2006; McGarrell et al., 1997).
Gender
Gender has long been established as a predictor of heightened levels of fear of
crime without a definitive reason as to why; therefore, gender is another control variable

26
used in this study. Since being female has been readily established as impacting fear of
crime (Jennings et al., 2007; Schafer et al., 2006; McGarrell et al., 1997; Ferraro, 1996),
and since the question posed by this research is whether religiosity is correlated with fear
of crime, by controlling for gender, the researcher was able to compare the mean score of
personal religiosity to fear of crime over the entire sample population (both males and
females).
Education
An individual’s level of education has been shown to produce a modest, yet
statistically significant impact on levels of fear of crime (Scarborough et al., 2010) and
thus was controlled for. To monitor a respondent’s education level, the following
question was asked: “What is your highest achieved degree?” Covering the spectrum of
available education levels among this target population was somewhat problematic and
will be discussed further in a later section.
Perceived Risk
As previously noted, some researchers have questioned whether measurements of
fear of crime are unintentionally measuring an individual’s perceived risk of criminal
victimization. Also, Jennings et al. (2007) found that perceived risk was especially salient
among college students in affecting fear of crime levels. In an effort to circumvent
contamination to the validity of the fear of crime measurement in the present study,
individual perceived risk was controlled for by including eight questionnaire items

27
established by Jennings and colleagues (2007) in their survey of university students.
Since the items were originally designed to solely measure perceived risk of victimization
among college students and the Cronbach’s alpha value for perceived risk instrument was
.83, one can conclude that the various measures of perceived risk are reliable.
The eight items included scale responses asking respondents to estimate the
likelihood of victimization for the following crimes ranging from (1) being the least
likely and (10) being the most likely for: “Being approached by a beggar or panhandler”;
“Being sexually assaulted”; “Being assaulted by someone with a weapon”; “Being
mugged”; “Having someone break into your place of residence while you are there”;
“Having someone break into your place of residence while you are not there”; “Having
your car stolen”; and, “Having your property stolen” (Jennings et al., 2007, p. 199).

28
RESULTS
Demographics of the Sample Population
The number of survey participants totaled two hundred and thirty-eight (N=238),
representing 11 classes. Of the total participants, 211 respondents participated with the
paper and pencil version, while 27 took the online version. Of all professors solicited for
participation, only two refused, due mainly to issues of limited in-class time for the
summer session. The demographics of the sample population can be found below in
Table 1.

29
Table 1
Descriptive Statistics
Variable Name Code N Valid
%
Cumulative
%
Religiosity
1 = Absence of religiousness 2 = Not religious 3 = Somewhat religious 4 = Religious 5 = Very religious 99 = Missing
57 36 55 40 46 4
24.3 15.3 23.4 17.0 19.6
24.3 39.6 63.0 80.0 100.0
Fear of Crime
Collapsed
1 = Very Fearful 2 = Fearful 3 = Neither fearful or unfearful 4 = Unfearful 5 = Very unfearful
1 3 25
83 126
0.4 1.3 10.5
34.9 52.9
0.4 1.7 12.2
47.1 100.0
Gender 0 = Female 1 = Male
145 93
60.9 39.1
60.9 100.0
Age 1 = 18 and 19 2 = 20 to 24 3 = 25 to 29 4 = 30 to 39 5 = 40 and older 99 = Missing
20 72 50 59 31 6
8.6 31.0 21.6 25.4 13.4
8.6 39.7 61.2 86.6 100.0
Race 0 = White 1 = Non-White
188 50
79.0 21.0
79.0 100.0
Table 1.0 continues

30
Table 1 (continued)
Education 1 = GED 2 = High School Diploma 3 = Associates Degree 4 = Bachelors Degree 5 = Masters Degree 6 = Other
16 113 55 51 2 1
6.7 47.5 23.1 21.4 0.8 0.4
6.7 54.2 77.3 98.7 99.6 100.0
Household income 1 = Less than $15,000 2 = $15,001-30,000 3 = $30,001-60,000 4 = $90,001-120,000 5 = $60,001-90,000 6 = $120,001-above 99 = Missing
53 50 67 16 14 11 27
25.1 23.7 31.8 7.6 6.6 5.2
25.1 48.8 80.6 88.2 94.8 100.0
As shown in Table 1, the sample was over representative of women (n = 145)
accounting for 60.9% of respondents. Men (n = 93) made up the remaining 39.1%. The
age of participants varied from 18 to 60 years old with the majority of participants
between 20 and 39 years old. Respondents’ age was originally identified in the survey by
the question “What is the year you were born?” As previously noted, however, the
majority of participants ranged from 20 to 39 years of age; for statistical analysis, the
variable identifying age was collapsed into five categories (i.e., 18 and 19, 20 to 24, 25 to
29, 30 to 39, and 40 and older). The variable identifying race also was recoded for ease in
analysis as the survey sample was largely racially homogenous, with Whites representing
79.0% of participants. The vast majority of participants (80.6%) reported a household
income of $60,000 or less, and, as was expected, the majority of survey participants had
an education level of at least a high school diploma or GED (54.2%); only three
participants had an educational degree greater than that of a bachelor’s degree. The

31
religiosity categories gleaned from the five religiosity items showed nearly even
distribution. The absence of religiousness category was the largest of the five categories,
representing nearly 25% of all respondents. The dependent variable, fear of crime,
resulted in little variation, with 87.8% of respondents falling into either the un-fearful or
very un-fearful categories.
To investigate if a relationship between fear of crime and religiosity existed, a
variety of statistical methods were used, which are described below.
Correlation and Analysis
All independent variables and the dependent variable were entered into a Pearson
correlation matrix to identify if any relationships existed between variables and in which
direction those relationships were. The results of the Pearson correlation can be found in
Appendix B.
All significant relationships found in the Pearson correlation matrix at the p <.05
level are discussed below (also, see Appendix B). Age was found to be positively
correlated with household income (r = .194); not surprisingly, the older the participant
was, the larger his/her gross annual income. Age also was found to be positively
correlated with education (r = .289), indicating that the older a participant was the more
educated she/he was. Finally, a positive correlation was found between a respondent’s
age and one of the components of the fear of crime measure: “How safe do you feel being
outside and alone in your own neighborhood at night” (r = .191), meaning that the older
the respondent was, the less fearful at night he/she was in his/her own neighborhood.

32
Recall from Table 1 that fear of crime is coded inversely, whereas a lower fear of crime
score is indicative of increased levels of fear of crime
It is important to note, however, that age was not found to be correlated with the
collapsed fear of crime measure, nor was age correlated with the second component of
that measure: “How safe do you feel being outside and alone in your own neighborhood
during the day?” It is possible that the correlation between age and night fear levels is a
product of older respondents also having higher incomes; as higher income level was
found to be positively correlated with both “How safe do you feel being outside and
alone in your own neighborhood at night” (r = .170) and the collapsed fear of crime
measure (r = .156), possibly indicating that older, more affluent respondents live in more
established communities, which could alleviate fear of crime.
Though the collapsed fear of crime measure was found to be correlated with
higher household income, it was correlated with little else. The collapsed fear of crime
measure was found to correlate with all eight of the items included in the risk of personal
victimization: panhandler (r = -191), sexual assault (r = -.330), weapon assault
(r = -.347), mugged (r = -.386), break-in while there (r = -.292), break-in not there
(r = -.287), car stolen (r = -.180), and property stolen (r = -.270). Fear of crime was also
correlated with gender (r = .251); females in the sample were more likely than males to
report higher levels of fear. Additionally, fear of crime was found to be positively
correlated with only one of the religiosity factors, “I would describe myself as very
religious” (r = .138).
33
It is interesting to note that of the five items measuring religiosity, “I would
describe myself as very religious” was the only component found to be correlated with
any variable(s) other than with its other religiosity components: fear of crime (r = .138)
and “being sexually assaulted” (r = -.139).
Given the lack of variance in the dependant variable and the resulting weakening
of the fear of crime measure, and due to the limited variables found to correlate with fear
of crime, the author posited that it may be possible that the absence of variance was
possibly linked to the emotive nature of the fear of crime measure, and that the current
sample may not possess emotive fear of crime, but rather a cognitive fear. In an effort to
investigate whether a more cognitive and tangible measure of fear, such as perceived
likelihood of victimization, would better access respondents’ fear of crime and whether
this measure of fear could be linked to individual religiosity, an additional dependent
variable (post hoc) was created by collapsing the perceived victimization questions to
create a “likelihood of victimization” measure.
Before collapsing the perceived victimization questions to create this measure, a
Cronbach’s alpha was run to determine the reliability of the measure. Like Jennings et al.
(2007), the alpha coefficient for this measure was extremely high (α = .847), and as such
allowed for the eight questions to be collapsed into a single measure. The perceived
likelihood of victimization scale was coded into five potential categories: a score of 1-16
= very unlikely at risk, 17-32 = unlikely at risk, 33-48 = somewhat likely at risk, 49-64 =
likely at risk, and 65-80 = very likely at risk. The creation of five categories was chosen
to mirror the earlier five religiosity categories in an attempt to ease comparisons.

34
After the creation of the new perceived likelihood of victimization measure, a
correlation matrix was created to identify any possible relationships between the study
variables. Like the fear of crime variable, however, few significant relationships among
variables were found, with the exception of the fear of crime variable and gender (see
Appendix C).
The relationship between perceived risk and fear of crime was significant at the
p<. 05 level and was in a negative direction. The relationship between perceived risk and
fear of crime was relatively strong (r = -.386), and indicated (not surprisingly) that as
individual perceived risk for victimization increased, the more fearful of crime they were.
The correlation found between gender and perceived risk was also significant at the
p< .05 level, and, like fear of crime, was in a negative direction. The relationship is rather
strong (r = -.155) and provided evidence that females were more likely to consider
themselves at higher risk for victimization than were males. This is not surprising
however, as gender, more specifically being female, represented the only individual
variable that was correlated with any of the items included within the perceived
victimization scale, namely, “being sexually assaulted” (r = -.463), “being mugged”
(r = -.181), and “having someone break into your place of residence while you are there”
(r = -.139).
Ordinary Least Squares (OLS) & Analysis
An ordinary least squares regression was utilized to examine how robust any of
the found correlations with fear of crime were at predicting higher or lower levels of fear
35
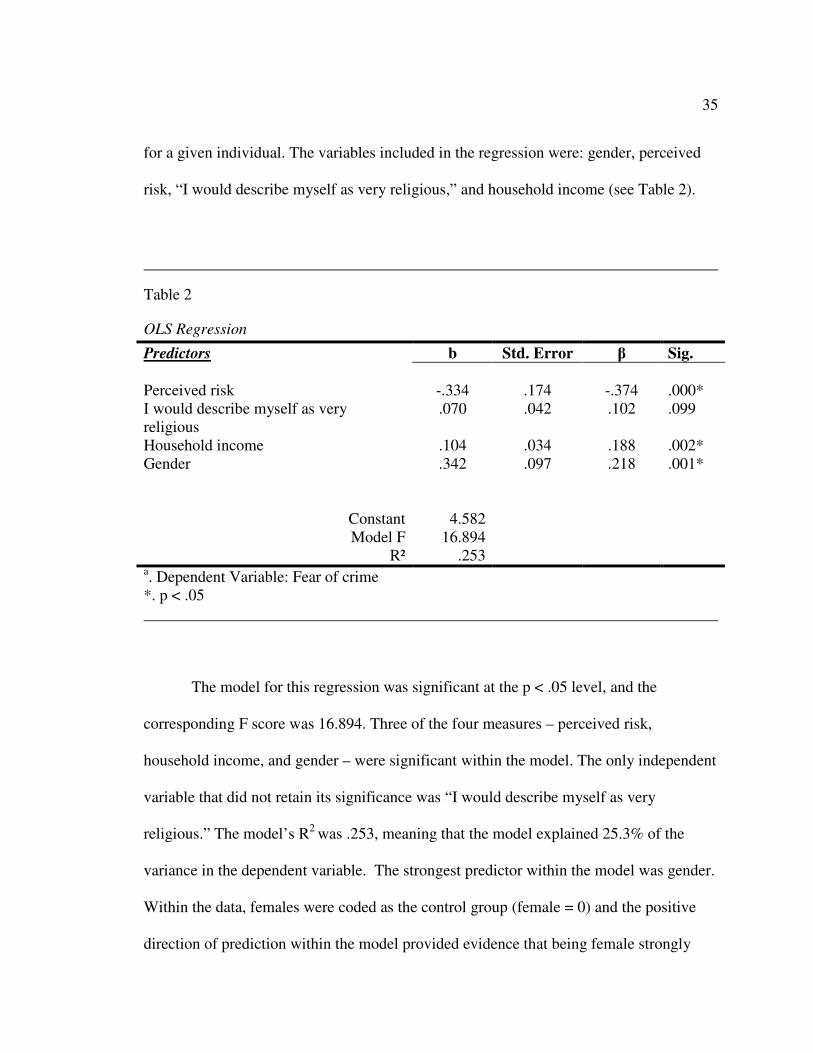
for a given individual. The variables included in the regression were: gender, perceived
risk, “I would describe myself as very religious,” and household income (see Table 2).
Table 2
OLS Regression
Predictors b Std. Error β Sig.
Perceived risk -.334 .174 -.374 .000* I would describe myself as very religious
.070 .042 .102 .099
Household income .104 .034 .188 .002* Gender .342 .097 .218 .001*
Constant 4.582 Model F 16.894
R² .253 a. Dependent Variable: Fear of crime *. p < .05
The model for this regression was significant at the p < .05 level, and the
corresponding F score was 16.894. Three of the four measures – perceived risk,
household income, and gender – were significant within the model. The only independent
variable that did not retain its significance was “I would describe myself as very
religious.” The model’s R2 was .253, meaning that the model explained 25.3% of the
variance in the dependent variable. The strongest predictor within the model was gender.
Within the data, females were coded as the control group (female = 0) and the positive
direction of prediction within the model provided evidence that being female strongly
36
predicted increased levels of fear of crime. Also predictive of heightened levels of fear of
crime is perceived risk. The direction of this prediction was negative, which illustrates
that as a respondent’s level of perceived risk of victimization increased, that heightened
level of personal victimization risk can predict the individual’s higher level of fear of
crime. Finally, household income was found to be an insulating or protective predictor of
fear of crime; stated differently, as a respondent’s gross household income increased,
his/her predicted level of fear of crime decreased.
In brief summary, the results of this research show that of all variables examined,
being female was the most robust predictor for heightened levels of fear of crime among
the sample, independent of religiosity levels. Furthermore, religiosity was found to have
no effect on fear of crime, and was not informative to increases or decreases in perceived
victimization.
37
DISCUSSIONS AND CONCLUSIONS
The intent of this study was to investigate whether an individual’s religiosity
could inform his/her level of fear of crime. The immediate answer to this question is no,
it cannot. However, a discussion must take place as to why the answer is no, and whether
future research may be better able to explore this theoretical relationship.
As shown above, an individual’s religiosity was found, with rare and insignificant
exception, not to be associated with any of the variables examined. This may have
occurred as a product of compiling two different measures of religiosity, those borrowed
from Jang and Johnson (2001), and from Welch et al. (2006), to create a single and novel
religiosity measure. To further examine this possibility, a Cronbach’s alpha was
conducted, which allowed for weighing the five religiosity items together for the purpose
of accessing the reliability of the measure. Though the initial motivation for conducting
the Cronbach’s alpha was to discover a faulty measure and to explain the lack of
association religiosity had with other variables, the opposite was found to be true. The
Cronbach’s alpha was robust (α = .929) and provided evidence that the novel religiosity
measure is a reliable one.
The strength of the religiosity measure and the wide variation found within,
however, was not enough to overcome the most significant restriction to any statistical
analysis within the current study: the lack of variation in both dependent variables and the
weakness of the fear of crime measure. Simply stated, very few respondents felt fearful,
and very few felt they were at any significant risk of victimization. Without variation in

38
the dependent variable, little could be derived, despite the robustness of the religiosity
measure.
Though religiosity was found not to be correlated with any of the variables within
the current study, one predictive variable was found to be strongly associated with fear of
crime and perceived risk of victimization: being female. Being female was the most
robust variable contributing to heightened levels of fear in the current research, and
echoed the findings of previous researchers (Jennings et al., 2007; Schafer et al., 2006;
McGarrell et al., 1997; Ferraro, 1996). Furthermore, females were most fearful of being
sexually assaulted, which lends support to the shadow of sexual assault hypothesis
referred to by Ferraro, (1996). Recall this hypothesis stated that a female’s increased
level of fear of crime in general was a product of her increased fear of sexual assault. The
results of the current study support this hypothesis, as females were far more likely to be
fearful of crime and fearful of sexual assault.
Though femaleness was found to be informative to an individual’s level of fear of
crime, it was not found to be associated with religiosity as was suggested by previous
researchers (Thompson, 1991; Miller & Hoffmann, 1995). Investigating gender’s role in
the religiosity/fear of crime relationship was an establishing force in the creation of this
research. However, since no association between gender and religiosity could be
established, examining gender as a variable to understand the interplay between the
theoretical relationship between religiosity and fear of crime was rendered ineffective.
Though the current research is limited in its statistical findings, the
methodological results are important to discuss for potential future research. Fear of

39
crime (or rather the lack of fear of crime) was the driving force behind the limitations of
the current research. Future researchers should identify more racially, financially, and
otherwise diversified populations than university students when studying fear of crime. It
is not to say that university populations cannot be used for analysis; however, the current
research demonstrates that the limitations of this demographic may possibly be crippling
to analysis.
The design of this research has followed a long line of similar research conducted
to explore fear of crime and religiosity independently. Reliability and validity were
largely ensured by relying on well-established measures, circumventing any issues that
may arise from theorizing a new design for a well-established.
Though the design and methods of this research were appropriate for the pursuit
of answering the research question, the study is not without its shortcomings. The
findings of this research are extremely constrained in their generalizability in so far as a
convenience sample of social science university students may not be representative of the
aggregate population (university students or otherwise). This may be especially true of
aggregate education levels because the education levels of the current sample population
can only be superficially controlled for. As a requirement of admittance to the university,
all university students had at minimum a General Equivalency Degree (GED). This
characteristic of the target population does not provide insight into the variance of fear of
crime levels that has been found among individuals along the broad spectrum of
education levels. Though the current research attempts to control for different levels of
education among the sample population, it fails to include those from lower (or higher)

40
levels of educational achievement, which the largest variations in fear of crime levels are
suspected to be found. Future researchers would be well instructed to control for this
variable in a larger, more representative population, as it has been shown to impact levels
of fear of crime (Scarborough et al., 2010).
Potential issues also arise from the sampling technique being used. Convenience
sampling is a non-probability sampling technique and as such aggregate population
comparisons cannot be made. Though this is a substantial limitation, there is room to
contend that, due to the nature of this research, convenience sampling is appropriate.
Furthermore, convenience sampling allows the researcher to circumvent the limitations in
time, resources, and feasibility of other sampling methods. Still, it is important to note
that to aggregate findings to the larger university population, a probability sampling
technique would have been necessary.
The brevity of the survey may draw concerns as to its validity, and those concerns
are addressed here. The questionnaire was bound in its length with respect to the
environment in which individuals were questioned: the classroom. Since surveying
commenced during regularly scheduled class periods, including those to be administered
online, approval from professors was intrinsically tied to the length of the interruption:
the shorter, the quicker, the better. Though little resistance was observed by university
professors, the fact remains that a brief survey was far more likely an acceptable
interruption than a time consuming one. Further, the short length of the survey
encouraged thoughtful answers by respondents and limited the threat of hasty responses

41
and/or non-participation. As such, the brevity of the survey likely increased the validity
of respondent’s answers.
Though there are great benefits to a shortened survey, minimizing its length also
posed the risk of not being as exhaustive as it could have been, which raises the concern
of the overall validity of the findings. Perceived risk was controlled for in the current
research because it was found to especially impact college students’ fear of crime.
However, many other theories and variables that have been shown to impact fear levels
were not included in the current research as a result of considerations of survey length.
Future researchers would be well advised to add additions to the current instrument to
more thoroughly explore relationships, and control for these other known variables.
Though the sample population showed little variation in fear of crime, the
measure borrowed from McGarrell et al. (1997) accurately captures the emotive feeling
of fear as was originally reported in their study. However, the collapsed measurement of
fear of crime for this sample did not have nearly the same alpha level as that reported by
McGarrell, et al., (1997). The Cronbach’s alpha level for fear of crime in the present
study was α = .549. Though this is a reasonable level of reliability for the measure, it is
nowhere near as strong as the α = .71 reported by McGarrell, et al., (1997). In further
investigation as to why the alpha level for this variable was at such a departure from the
levels reported by McGarrell, et al., (1997) the author came to two conclusions. First, the
level of variance in the dependant variable within the current sample was almost non-
existent, with only 29 cases reporting being less than un-fearful. Secondly, the size of the
current sample population is miniscule compared to the 998 in the study in which the

42
scale was borrowed. When compounded, these issues make any analysis of fear of crime
in the present study difficult at best.
The current research also validated another measure as being reliable and created
another. The perceived risk of victimization measure created by Jennings et al. (2007)
was strong in their study and retained its strength in the current study. Both Jennings et
al. (2007) and the current research used the risk of victimization scale with university
survey populations and it is possible that the eight item measure is only reliable in this
given demographic. However, if future researchers attempting to access the perceived
risk of victimization are using university students as test populations, they need not go
any further than the measure created by Jennings et al. (2007).
The unique and novel measure used in the current study to measure an
individual’s religiosity was extremely strong. Though the items used in constructing this
measure were few in number, the five items seemed to have reached face validity for the
construct of religiosity: devotional behavior and individual importance of religion in
one’s life (Welch et al., 2006). Future researchers investigating religiosity should
consider using this valid and reliable measure.
Even in light of the methodological issues presented above and the resulting
limitations of this research, the initial motivation underlying this research remains
important and must be reiterated. Fear of crime has carved a niche deep within
criminological research, and as a social phenomenon has been studied extensively.
However, even in its celebrity as a topic, fear of crime researchers are unable to come to
a concise and universal agreement as to what causes increases and reductions in fear

43
levels. This research sought to add a dimension to this debate that had to date been over
looked. By increasing the amount of valid elements and variables used to assess fear of
crime, a far more enriched understanding can be developed.
The theoretical connection between fear of crime and religiosity was not found to
be supported in the current research. However, the theoretical foundations for that
relationship still exist, and may simply not have been appropriately accessed in the
current study. For example, if a person’s religiosity can alter the way an individual
responds to stress and strain as Jang and Johnson (2005) suggest, it can be argued that it
should also have some influence on the strain a person feels in response to his/her fear of
crime.
Future researchers who are better positioned to overcome the limitations of the
current study should incorporate religiosity measures to accomplish two goals: first,
establish whether a connection between religiosity and fear of crime does exist, and,
secondly, if a relationship does exist, determine how it informs the fear of crime debate.
Further research is certainly warranted.
44
REFERENCES
Baier, C.J., & Wright, B.R.E. (2001). “If you love me, keep my commandments: A
meta-analysis of the effect of religion on crime. Journal of Research in Crime and
Delinquency, 38(1), 3-21.
Chitwood, D. D., Weiss, M. L., & Leukefeld, C. G. (2008). A systematic review of
recent literature on religiosity and substance abuse. Journal of Drug Issues, 38(3),
653-688.
Dolan, P., & Peasgood, T. (2007). Estimating the economic and social costs of the fear
of crime. British Journal of Criminology, 47, 121-132.
Farrall, S., Bannister, J., Ditton, J., & Gilchrist, E. (1997). Questioning the measurement
of the fear of crime: Findings from a major methodological study. British Journal
of Criminology, 37(4), 658-679.
Ferraro, K. (1996). Women's fear of victimization: Shadow of sexual assault? Social
Forces, 75(2), 667-690.
Franklin, T., Franklin, C.A., & Fearn, N.E. (2008). A multilevel analysis of the
vulnerability, disorder, and social integration models of fear of crime. Social
Justice Research, 21, 204–227.
Heaton, P. (2006). Does religion really reduce crime? Journal of Law and Economics,
49, 147-172.
Hirschi, T., & Stark, R. (1969). Hellfire and delinquency. Social Problems, 17(2),
202-213.

45
Hudson, M. (2010). Crime is not just a man's world: Perceptions of female offenders
through a feminist lens" (2010). Boise State University Theses and Dissertations:
Paper 84. Retrieved from http://scholarworks.boisestate.edu/td/84
Jang, S.J., & Johnson, B.R. (2001). Neighborhood disorder, individual religiosity, and
adolescent use of illicit drugs: A test of multilevel hypotheses. Criminology,
39(1), 109-143.
Jang, S. J., & Johnson, B. R. (2005). Gender, religiosity, and reactions to strain by
African Americans. Sociological Quarterly, 46, 323-357.
Jennings, W.G., Gover, A.R.,& Pudrzynska, D. (2007). Are institutions of higher
learning safe? A descriptive study of campus safety issues and self-reported
campus victimization among male and female college students. Journal of
Criminal Justice Education, 18(2), 191-208.
Johnson, B. R., Jang, S. J., Larson, D. B., & De Li, S. (2001). Does adolescent religious
commitment matter? A reexamination of the effects of religiosity on delinquency.
Journal of Research in Crime and Delinquency, 38, 22-44.
Johnson, M. C., & Morris, R. G. (2008). The moderating effects of religiosity on the
Relationship between stressful life events and delinquent behavior. Journal of
Criminal Justice, 36, 486-493.
McGarrell, E.F., Giacomazzi, A.L., & Thurman, Q.C. (1997). Neighborhood disorder,
integration, and fear of crime. Justice Quarterly, 14(3), 479-499.

46
Miller, A.S., & Hoffmann, J.P. (1995). Risk and religion: An explanation of gender
differences in religiosity. Journal for the Scientific Study of Religion, 34(1),
63-75.
Moore, S., & Shepherd, J. (2007). The elements and prevalence of fear. British Journal
of Criminology, 47, 154-162.
Office of Communications and Marketing, Boise State University (2010). Web facts.
Retrieved from http://news.boisestate.edu/files/2009/10/facts-and-figures09-
10.pdf
Scarborough, B.K., Like-Haislip, T. Z., Novak , K. J., Lucas , W. L., & Alarid, L.
F. (2010). Assessing the relationship between individual characteristics,
neighborhood context, and fear of crime. Journal of Criminal Justice, 38, 819-
826.
Schafer, J.A., Huebner, B.M., & Bynum, T.S. (2006). Fear of crime and criminal
victimization: Gender-based contrasts. Journal of Criminal Justice, 34, 285-301.
Sutton, R.M., & Farrall, S. (2005). Gender, socially desirable responding, and fear of
crime. British Journal of Criminology, 45, 212-224
Thompson, Edward H. (1991). Beneath the status characteristic: Gender variations in
religiousness. Journal for the Scientific Study of Religion 30(4):381–94.
Weitzer, R., & Kubrin, C. E. (2004). Breaking news: How local TV news and real-world
conditions affect fear of crime. Justice Quarterly, 21(3), 497-520.
Welch, M.R., Tittle, C.R, & Grasmick, H.G. (2006). Christian religiosity, self-control
and social conformity, Social Forces, 84(3), 1605-1623.

47
APPENDIX A
Survey Instrument

48
1) What is the year you were born? __________
2) Please Indicate your Race/Ethnicity.
a. White b. Hispanic c. African American d. Asian American e. Native American f. Other
3) Please indicate your self-identified gender.
a. Male b. Female
(IF YOU ARE UNDER 25, SKIP TO QUESTION 4; IF YOU ARE OVER 25, SKIP TO QUESTION 5)
4) Estimate which of the following categories your annual pre-tax family household income falls into?
a. Less than $15,000 b. $15,001-30,000 c. $30,001-60,000 d. $60,001-90,000 e. $90,001-120,000 f. $120,001-above
5) Estimate which of the following categories your annual pre-tax household income falls into?
a. Less than $15,000 b. $15,001-30,000 c. $30,001-60,000 d. $60,001-90,000 e. $90,001-120,000 f. $120,001-above
6) Please indicate the highest degree you have obtained.
a. GED b. High school diploma c. Associates Degree d. Bachelors Degree e. Masters Degree f. Other, please specify

49
7) If ever, how often did you attend religious services during the past year? 1) Never 2) A few times a year 3) Once or twice a month 4) Once a week 5) Several times a week
8) How important is religion in your life?
1) Not important at all 2) Not very important 3) Somewhat important 4) Important 5) Very important
9) How safe do you feel being outside and alone in your own neighborhood during the day?
1) Very unsafe 2) Unsafe 3) Neither safe or unsafe 4) Safe 5) Very safe
10) On a scale from 1 to 10 (1 being least likely and 10 being most likely), please indicate your potential for being a victim of the following crimes: a) Being approached by a beggar or panhandler ___ b) Being sexually assaulted ___ c) Being assaulted by someone with a weapon ___ d) Being mugged ___ e) Having someone break into your place of residence while you are there f) Having someone break into your place of residence while you are not
there___ g) Having your car stolen ___ h) Having your property stolen ___ 11) If ever, how often do you pray?
1) Never 2) Rarely 3) Sometimes 4) Very often 5) Daily

50
12) Please indicate your level of agreement or disagreement with the following statement: Religion influences how I live my life.
1) Strongly disagree 2) Disagree 3) Agree 4) Strongly agree
13) Please indicate your level of agreement or disagreement with the following statement: I would describe myself as very religious.
1) Strongly disagree 2) Disagree 3) Agree 4) Strongly agree
14) How safe do you feel being outside and alone in your own neighborhood during the night?
1) Very unsafe 2) Unsafe 3) Neither safe nor unsafe 4) Safe 5) Very safe

51
APPENDIX B
Pearson Correlation Matrix

Pearson Correlation Matrix
Household Income Education
How often did you attend religious
services during the past year?
How important is religion in
your life?
How safe do you feel being outside and alone in your own
neighborhood during the day?
Being approached by a panhandler
Being sexually assaulted
Pearson 1 .256** -.068 -.012 .108 .074 -.039
Sig. (2-tailed) .000 .323 .867 .119 .282 .576
Household Income
N 211 211 211 211 211 211 211
Pearson .256** 1 .049 .084 .008 .063 .016
Sig. (2-tailed) .000 .453 .194 .901 .336 .808
Education
N 211 238 238 238 238 238 238
Pearson -.068 .049 1 .705** -.025 .014 -.108
Sig. (2-tailed) .323 .453 .000 .706 .824 .097
How often did you attend religious services during the past year? N 211 238 238 238 238 238 238
Pearson -.012 .084 .705** 1 .034 .000 -.086
Sig. (2-tailed) .867 .194 .000 .606 .999 .185
How important is religion in your life?
N 211 238 238 238 238 238 238
Pearson .108 .008 -.025 .034 1 -.150* -.190**
Sig. (2-tailed) .119 .901 .706 .606 .020 .003
How safe do you feel being outside and alone in your own neighborhood during the day?
N
211 238 238 238 238 238 238
Pearson .074 .063 .014 .000 -.150* 1 .254**
Sig. (2-tailed) .282 .336 .824 .999 .020 .000
Being approached by a panhandler
N 211 238 238 238 238 238 238
Pearson -.039 .016 -.108 -.086 -.190** .254** 1
Sig. (2-tailed) .576 .808 .097 .185 .003 .000
Being sexually assaulted
N 211 238 238 238 238 238 238
52

Household Income Education
How often did you attend religious
services during the past year?
How important is religion in
your life?
How safe do you feel being outside and alone in your own
neighborhood during the day?
Being approached by a panhandler
Being sexually assaulted
Pearson -.035 .017 -.090 -.035 -.288** .217** .553**
Sig. (2-tailed) .616 .797 .169 .593 .000 .001 .000
Being assaulted by someone with a weapon
N 210 237 237 237 237 237 237
Pearson -.027 -.010 -.046 -.009 -.306** .347** .570**
Sig. (2-tailed) .698 .876 .476 .885 .000 .000 .000
Being mugged
N 211 238 238 238 238 238 238
Pearson Correlation
.069 .109 -.047 .017 -.251** .205** .393**
Sig. (2-tailed) .322 .095 .475 .798 .000 .002 .000
Having someone break into your place of residence while you are there
N 210 237 237 237 237 237 237
Pearson .038 .012 -.031 -.002 -.232** .249** .317**
Sig. (2-tailed) .587 .849 .634 .979 .000 .000 .000
Having someone break into your place of residence while you are not there N
209 236 236 236 236 236 236
Pearson .095 .028 .010 .027 -.154* .285** .319**
Sig. (2-tailed) .169 .665 .882 .684 .017 .000 .000
Having your car stolen
N 211 238 238 238 238 238 238
Pearson .092 .066 -.025 -.014 -.206** .349** .302**
Sig. (2-tailed) .183 .311 .701 .835 .001 .000 .000
Having your property stolen
N 211 238 238 238 238 238 238
Pearson .052 .088 .656** .811** .011 .008 -.061
Sig. (2-tailed) .455 .174 .000 .000 .867 .900 .351
How often do you pray?
N 211 238 238 238 238 238 238
Pearson -.012 .118 .630** .816** .064 -.011 -.080
Sig. (2-tailed) .866 .069 .000 .000 .322 .867 .218
Religion influences how I live my life
N 211 238 238 238 238 238 238
53
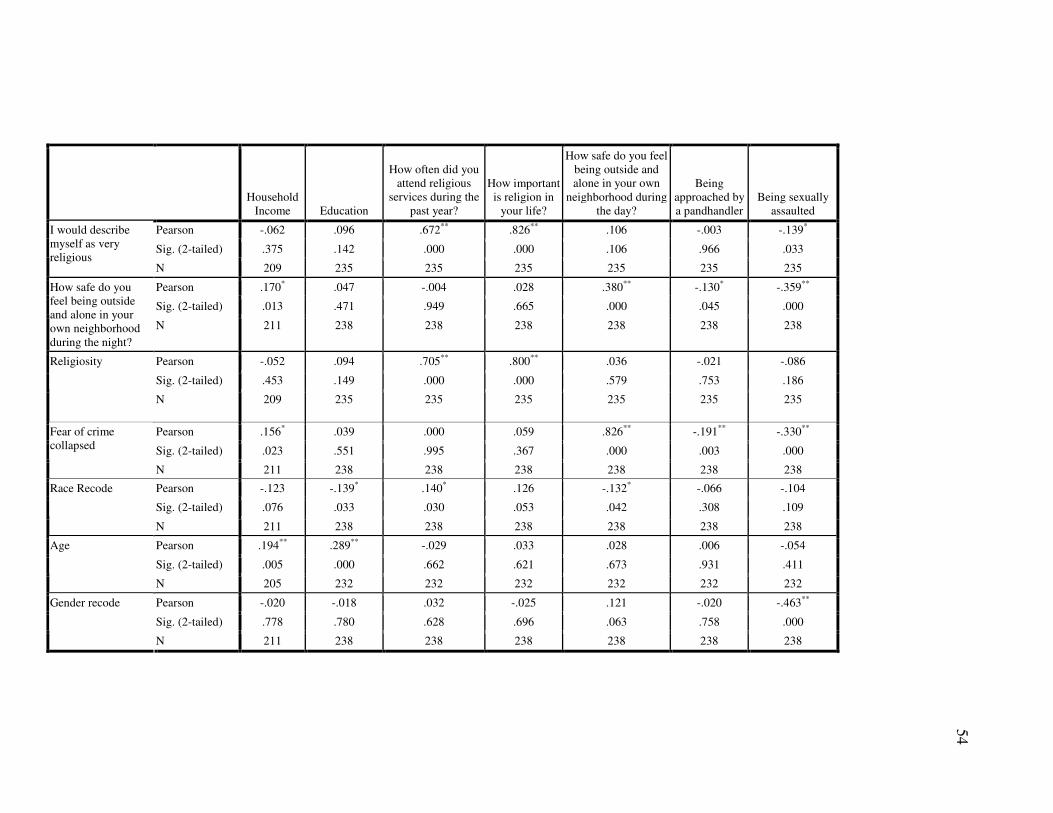
Household Income Education
How often did you attend religious
services during the past year?
How important is religion in
your life?
How safe do you feel being outside and alone in your own
neighborhood during the day?
Being approached by a pandhandler
Being sexually assaulted
Pearson -.062 .096 .672** .826** .106 -.003 -.139*
Sig. (2-tailed) .375 .142 .000 .000 .106 .966 .033
I would describe myself as very religious
N 209 235 235 235 235 235 235
Pearson .170* .047 -.004 .028 .380** -.130* -.359**
Sig. (2-tailed) .013 .471 .949 .665 .000 .045 .000
How safe do you feel being outside and alone in your own neighborhood during the night?
N 211 238 238 238 238 238 238
Pearson -.052 .094 .705** .800** .036 -.021 -.086
Sig. (2-tailed) .453 .149 .000 .000 .579 .753 .186
Religiosity
N
209 235 235 235 235 235 235
Pearson .156* .039 .000 .059 .826** -.191** -.330**
Sig. (2-tailed) .023 .551 .995 .367 .000 .003 .000
Fear of crime collapsed
N 211 238 238 238 238 238 238
Pearson -.123 -.139* .140* .126 -.132* -.066 -.104
Sig. (2-tailed) .076 .033 .030 .053 .042 .308 .109
Race Recode
N 211 238 238 238 238 238 238
Pearson .194** .289** -.029 .033 .028 .006 -.054
Sig. (2-tailed) .005 .000 .662 .621 .673 .931 .411
Age
N 205 232 232 232 232 232 232
Pearson -.020 -.018 .032 -.025 .121 -.020 -.463**
Sig. (2-tailed) .778 .780 .628 .696 .063 .758 .000
Gender recode
N 211 238 238 238 238 238 238
54

Being assaulted by someone
with a weapon Being
mugged
Having someone break into your
place of residence while
you are there
Having someone break into your
place of residence while you are not
there Having your
car stolen Having your
property stolen How often do
you pray?
Pearson -.035 -.027 .069 .038 .095 .092 .052
Sig. (2-tailed) .616 .698 .322 .587 .169 .183 .455
Household Income
N 210 211 210 209 211 211 211
Pearson .017 -.010 .109 .012 .028 .066 .088
Sig. (2-tailed) .797 .876 .095 .849 .665 .311 .174
Education
N 237 238 237 236 238 238 238
Pearson -.090 -.046 -.047 -.031 .010 -.025 .656**
Sig. (2-tailed) .169 .476 .475 .634 .882 .701 .000
How often did you attend religious services during the past year? N 237 238 237 236 238 238 238
Pearson -.035 -.009 .017 -.002 .027 -.014 .811**
Sig. (2-tailed) .593 .885 .798 .979 .684 .835 .000
How important is religion in your life?
N 237 238 237 236 238 238 238
Pearson -.288** -.306** -.251** -.232** -.154* -.206** .011
Sig. (2-tailed) .000 .000 .000 .000 .017 .001 .867
How safe do you feel being outside and alone in your own neighborhood during the day?
N 237 238 237 236 238 238 238
Pearson .217** .347** .205** .249** .285** .349** .008
Sig. (2-tailed) .001 .000 .002 .000 .000 .000 .900
Being approached by a pandhandler
N 237 238 237 236 238 238 238
Pearson .553** .570** .393** .317** .319** .302** -.061
Sig. (2-tailed) .000 .000 .000 .000 .000 .000 .351
Being sexually assaulted
N 237 238 237 236 238 238 238
Pearson 1 .790** .589** .498** .426** .409** -.011
Sig. (2-tailed) .000 .000 .000 .000 .000 .862
Being assaulted by someone with a weapon
N 237 237 236 235 237 237 237
55

Being assaulted by someone
with a weapon Being
mugged
Having someone break into your
place of residence while
you are there
Having someone break into your
place of residence while you are not
there Having your
car stolen Having your
property stolen How often do
you pray?
Pearson .790** 1 .520** .426** .449** .368** .009
Sig. (2-tailed) .000 .000 .000 .000 .000 .886
Being mugged
N 237 238 237 236 238 238 238
Pearson .589** .520** 1 .712** .517** .464** .031
Sig. (2-tailed) .000 .000 .000 .000 .000 .635
Having someone break into your place of residence while you are there N 236 237 237 235 237 237 237
Pearson .498** .426** .712** 1 .561** .589** -.009
Sig. (2-tailed) .000 .000 .000 .000 .000 .890
Having someone break into your place of residence while you are not there
N 235 236 235 236 236 236 236
Pearson .426** .449** .517** .561** 1 .627** -.054
Sig. (2-tailed) .000 .000 .000 .000 .000 .404
Having your car stolen
N 237 238 237 236 238 238 238
Pearson .409** .368** .464** .589** .627** 1 .000
Sig. (2-tailed) .000 .000 .000 .000 .000 .997
Having your property stolen
N 237 238 237 236 238 238 238
Pearson -.011 .009 .031 -.009 -.054 .000 1
Sig. (2-tailed) .862 .886 .635 .890 .404 .997
How often do you pray?
N 237 238 237 236 238 238 238
Pearson -.012 -.026 -.009 -.051 -.031 -.019 .787**
Sig. (2-tailed) .849 .692 .887 .433 .633 .775 .000
Religion influences how I live my life
N 237 238 237 236 238 238 238
Pearson -.071 -.052 -.035 -.070 -.084 -.080 .706**
Sig. (2-tailed) .280 .427 .595 .285 .199 .219 .000
I would describe myself as very religious
N
234 235 234 233 235 235 235
56

Being assaulted by someone
with a weapon Being
mugged
Having someone break into your
place of residence while
you are there
Having someone break into your
place of residence while you are not
there Having your
car stolen Having your
property stolen How often do
you pray?
Pearson -.295** -.340** -.231** -.235** -.193** -.245** -.014
Sig. (2-tailed) .000 .000 .000 .000 .003 .000 .826
How safe do you feel being outside and alone in your own neighborhood during the night?
N 237 238 237 236 238 238 238
Pearson -.040 -.003 -.021 -.073 -.055 -.066 .759**
Sig. (2-tailed) .543 .962 .753 .265 .400 .310 .000
Religiosity
N 234 235 234 233 235 235 235
Fear of crime collapsed
Pearson -.347** -.386** -.292** -.287** -.180** -.270** .011
Sig. (2-tailed) .000 .000 .000 .000 .005 .000 .869
N 237 238 237 236 238 238 238
Pearson -.032 -.010 -.005 -.048 .024 -.050 .098
Sig. (2-tailed) .626 .876 .934 .464 .718 .439 .131
RaceRecode
N 237 238 237 236 238 238 238
Pearson -.071 -.101 .007 .061 -.026 -.002 .064
Sig. (2-tailed) .281 .125 .915 .360 .698 .973 .334
Age
N 231 232 231 230 232 232 232
Pearson -.097 -.181** -.139* -.043 -.045 .010 -.052
Sig. (2-tailed) .138 .005 .032 .507 .492 .880 .422
Genderrecode
N 237 238 237 236 238 238 238
57

58
Religion influences how I live my life
I would describe myself as very
religious
How safe do you feel being outside and alone
in your own neighborhood during
the night? Religiosity Fear of crime
collapsed RaceRecode Age Genderrecode
Pearson -.012 -.062 .170* -.052 .156* -.123 .194** -.020
Sig. (2-tailed) .866 .375 .013 .453 .023 .076 .005 .778
Household Income
N 211 209 211 209 211 211 205 211
Pearson .118 .096 .047 .094 .039 -.139* .289** -.018
Sig. (2-tailed) .069 .142 .471 .149 .551 .033 .000 .780
Education
N 238 235 238 235 238 238 232 238
Pearson .630** .672** -.004 .705** .000 .140* -.029 .032
Sig. (2-tailed) .000 .000 .949 .000 .995 .030 .662 .628
How often did you attend religious services during the past year? N 238 235 238 235 238 238 232 238
Pearson .816** .826** .028 .800** .059 .126 .033 -.025
Sig. (2-tailed) .000 .000 .665 .000 .367 .053 .621 .696
How important is religion in your life?
N 238 235 238 235 238 238 232 238
Pearson .064 .106 .380** .036 .826** -.132* .028 .121
Sig. (2-tailed) .322 .106 .000 .579 .000 .042 .673 .063
How safe do you feel being outside and alone in your own neighborhood during the day?
N 238 235 238 235 238 238 232 238
Pearson -.011 -.003 -.130* -.021 -.191** -.066 .006 -.020
Sig. (2-tailed) .867 .966 .045 .753 .003 .308 .931 .758
Being approached by a pandhandler
N 238 235 238 235 238 238 232 238
Pearson -.080 -.139* -.359** -.086 -.330** -.104 -.054 -.463**
Sig. (2-tailed) .218 .033 .000 .186 .000 .109 .411 .000
Being sexually assaulted
N 238 235 238 235 238 238 232 238
Pearson -.012 -.071 -.295** -.040 -.347** -.032 -.071 -.097
Sig. (2-tailed) .849 .280 .000 .543 .000 .626 .281 .138
Being assaulted by someone with a weapon
N 237 234 237 234 237 237 231 237

59
Religion
influences how I live my life
I would describe myself as very
religious
How safe do you feel being outside and alone in your own neighborhood
during the night? Religiosity Fear of crime
collapsed RaceRecode Age Genderrecode
Being mugged Pearson -.026 -.052 -.340** -.003 -.386** -.010 -.101 -.181**
Sig. (2-tailed) .692 .427 .000 .962 .000 .876 .125 .005
N 238 235 238 235 238 238 232 238
Having someone break into your place of residence while you are there
Pearson
-.009 -.035 -.231** -.021 -.292** -.005 .007 -.139*
Sig. (2-tailed) .887 .595 .000 .753 .000 .934 .915 .032
N 237 234 237 234 237 237 231 237
Having someone break into your place of residence while you are not there
Pearson
-.051 -.070 -.235** -.073 -.287** -.048 .061 -.043
Sig. (2-tailed) .433 .285 .000 .265 .000 .464 .360 .507
N 236 233 236 233 236 236 230 236
Having your car stolen
Pearson -.031 -.084 -.193** -.055 -.180** .024 -.026 -.045
Sig. (2-tailed) .633 .199 .003 .400 .005 .718 .698 .492
N 238 235 238 235 238 238 232 238
Having your property stolen
Pearson -.019 -.080 -.245** -.066 -.270** -.050 -.002 .010
Sig. (2-tailed) .775 .219 .000 .310 .000 .439 .973 .880
N 238 235 238 235 238 238 232 238
How often do you pray?
Pearson .787** .706** -.014 .759** .011 .098 .064
-.052
Sig. (2-tailed) .000 .000 .826 .000 .869 .131 .334 .422
N 238 235 238 235 238 238 232 238

Religion
influences how I live my life
I would describe myself as very
religious
How safe do you feel being outside and alone in your own neighborhood
during the night? Religiosity Fear of crime
collapsed RaceRecode Age Genderrecode
Religion influences how I live my life
Pearson 1 .760** .017 .755** .073 .111 -.015 -.027
Sig. (2-tailed) .000 .798 .000 .262 .087 .816 .678
N 238 235 238 235 238 238 232 238
I would describe myself as very religious
Pearson .760** 1 .100 .815** .138* .119 .065 .059
Sig. (2-tailed) .000 .125 .000 .035 .068 .326 .371
N 235 235 235 235 235 235 229 235
How safe do you feel being outside and alone in your own neighborhood during the night?
Pearson .017 .100 1 .054 .762** -.076 .191** .357**
Sig. (2-tailed) .798 .125 .414 .000 .244 .003 .000
N 238 235 238 235 238 238 232 238
Religiosity Pearson .755** .815** .054 1 .065 .108 .066 -.030
Sig. (2-tailed) .000 .000 .414 .318 .100 .324 .643
N 235 235 235 235 235 235 229 235
Fear of crime collapsed
Pearson .073 .138* .762** .065 1 -.086 .107 .251**
Sig. (2-tailed) .262 .035 .000 .318 .185 .104 .000
N 238 235 238 235 238 238 232 238
RaceRecode Pearson .111 .119 -.076 .108 -.086 1 -.175** -.033
Sig. (2-tailed) .087 .068 .244 .100 .185 .008 .618
N 238 235 238 235 238 238 232 238
60

Religion
influences how I live my life
I would describe myself as very
religious
How safe do you feel being outside and alone in your own neighborhood
during the night? Religiosity Fear of crime
collapsed RaceRecode Age Genderrecode
Pearson -.015 .065 .191** .066 .107 -.175** 1 -.003
Sig. (2-tailed) .816 .326 .003 .324 .104 .008 .960
Age
N
232 229 232 229 232 232 232 232
Pearson Correlation
-.027 .059 .357** -.030 .251** -.033 -.003 1
Sig. (2-tailed) .678 .371 .000 .643 .000 .618 .960
Genderrecode
N 238 235 238 235 238 238 232 238
**. Correlation is significant at the 0.01 level (2-tailed).
*. Correlation is significant at the 0.05 level (2-tailed).
61

62
APPENDIX C
Pearson Correlation Matrix: 2

63
Household
Income Education
How often did you attend religious
services during the past year?
How important is religion in
your life?
How safe do you feel being outside and alone in your own
neighborhood during the day?
Being approached
by a pandhandler
Being sexually assaulted
Being assaulted by someone with
a weapon
Pearson 1 .256** -.068 -.012 .108 .074 -.039 -.035
Sig. (2-tailed) .000 .323 .867 .119 .282 .576 .616
Household Income
N 211 211 211 211 211 211 211 210
Pearson .256** 1 .049 .084 .008 .063 .016 .017
Sig. (2-tailed) .000 .453 .194 .901 .336 .808 .797
Education
N 211 238 238 238 238 238 238 237
Pearson -.068 .049 1 .705** -.025 .014 -.108 -.090
Sig. (2-tailed) .323 .453 .000 .706 .824 .097 .169
How often did you attend religious services during the past year? N 211 238 238 238 238 238 238 237
Pearson -.012 .084 .705** 1 .034 .000 -.086 -.035
Sig. (2-tailed) .867 .194 .000 .606 .999 .185 .593
How important is religion in your life?
N 211 238 238 238 238 238 238 237
Pearson .108 .008 -.025 .034 1 -.150* -.190** -.288**
Sig. (2-tailed) .119 .901 .706 .606 .020 .003 .000
How safe do you feel being outside and alone in your own neighborhood during the day?
N 211 238 238 238 238 238 238 237
Pearson .074 .063 .014 .000 -.150* 1 .254** .217**
Sig. (2-tailed) .282 .336 .824 .999 .020 .000 .001
Being approached by a pandhandler
N 211 238 238 238 238 238 238 237
Pearson -.039 .016 -.108 -.086 -.190** .254** 1 .553**
Sig. (2-tailed) .576 .808 .097 .185 .003 .000 .000
Being sexually assaulted
N 211 238 238 238 238 238 238 237
Pearson Correlation Matrix 2
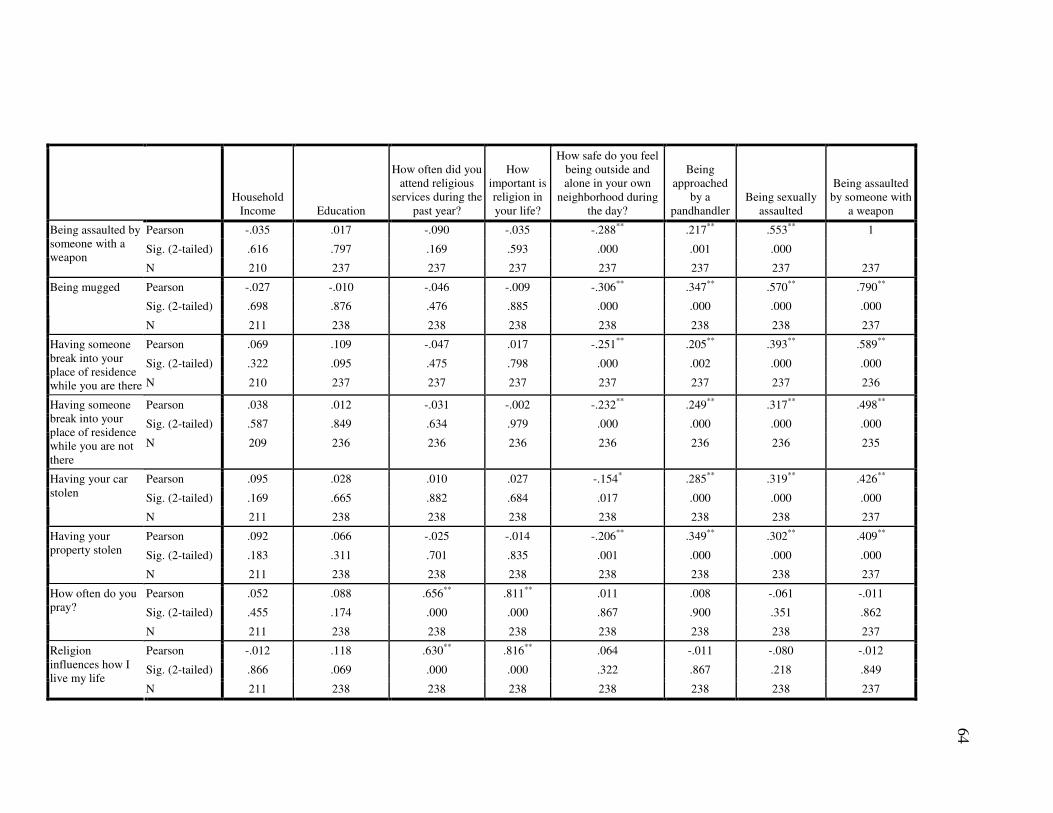
64
Household Income Education
How often did you attend religious
services during the past year?
How important is religion in your life?
How safe do you feel being outside and alone in your own
neighborhood during the day?
Being approached
by a pandhandler
Being sexually assaulted
Being assaulted by someone with
a weapon
Pearson -.035 .017 -.090 -.035 -.288** .217** .553** 1
Sig. (2-tailed) .616 .797 .169 .593 .000 .001 .000
Being assaulted by someone with a weapon
N 210 237 237 237 237 237 237 237
Pearson -.027 -.010 -.046 -.009 -.306** .347** .570** .790**
Sig. (2-tailed) .698 .876 .476 .885 .000 .000 .000 .000
Being mugged
N 211 238 238 238 238 238 238 237
Pearson .069 .109 -.047 .017 -.251** .205** .393** .589**
Sig. (2-tailed) .322 .095 .475 .798 .000 .002 .000 .000
Having someone break into your place of residence while you are there N 210 237 237 237 237 237 237 236
Pearson .038 .012 -.031 -.002 -.232** .249** .317** .498**
Sig. (2-tailed) .587 .849 .634 .979 .000 .000 .000 .000
Having someone break into your place of residence while you are not there
N 209 236 236 236 236 236 236 235
Pearson .095 .028 .010 .027 -.154* .285** .319** .426**
Sig. (2-tailed) .169 .665 .882 .684 .017 .000 .000 .000
Having your car stolen
N 211 238 238 238 238 238 238 237
Pearson .092 .066 -.025 -.014 -.206** .349** .302** .409**
Sig. (2-tailed) .183 .311 .701 .835 .001 .000 .000 .000
Having your property stolen
N 211 238 238 238 238 238 238 237
Pearson .052 .088 .656** .811** .011 .008 -.061 -.011
Sig. (2-tailed) .455 .174 .000 .000 .867 .900 .351 .862
How often do you pray?
N 211 238 238 238 238 238 238 237
Pearson -.012 .118 .630** .816** .064 -.011 -.080 -.012
Sig. (2-tailed) .866 .069 .000 .000 .322 .867 .218 .849
Religion influences how I live my life
N 211 238 238 238 238 238 238 237

65
Household Income Education
How often did you attend religious
services during the past year?
How important is religion in your life?
How safe do you feel being outside and alone in your own
neighborhood during the day?
Being approached
by a pandhandler
Being sexually assaulted
Being assaulted by someone with
a weapon
Pearson -.062 .096 .672** .826** .106 -.003 -.139* -.071
Sig. (2-tailed) .375 .142 .000 .000 .106 .966 .033 .280
I would describe myself as very religious
N 209 235 235 235 235 235 235 234
Pearson .170* .047 -.004 .028 .380** -.130* -.359** -.295**
Sig. (2-tailed) .013 .471 .949 .665 .000 .045 .000 .000
How safe do you feel being outside and alone in your own neighborhood during the night?
N 211 238 238 238 238 238 238 237
Pearson -.052 .094 .705** .800** .036 -.021 -.086 -.040
Sig. (2-tailed) .453 .149 .000 .000 .579 .753 .186 .543
Religiosity
N 209 235 235 235 235 235 235 234
Pearson .156* .039 .000 .059 .826** -.191** -.330** -.347**
Sig. (2-tailed) .023 .551 .995 .367 .000 .003 .000 .000
Fear of crime collapsed
N 211 238 238 238 238 238 238 237
Pearson -.123 -.139* .140* .126 -.132* -.066 -.104 -.032
Sig. (2-tailed) .076 .033 .030 .053 .042 .308 .109 .626
RaceRecode
N 211 238 238 238 238 238 238 237
Pearson .194** .289** -.029 .033 .028 .006 -.054 -.071
Sig. (2-tailed) .005 .000 .662 .621 .673 .931 .411 .281
Age
N 205 232 232 232 232 232 232 231
Pearson -.020 -.018 .032 -.025 .121 -.020 -.463** -.097
Sig. (2-tailed) .778 .780 .628 .696 .063 .758 .000 .138
Genderrecode
N 211 238 238 238 238 238 238 237
Pearson .057 .034 -.055 -.015 -.293** .558** .617** .689**
Sig. (2-tailed) .416 .601 .402 .823 .000 .000 .000 .000
Perceived Risk
N 207 234 234 234 234 234 234 234

Being mugged
Having someone break into your
place of residence while you are
there
Having someone break into your
place of residence while you are not
there Having your
car stolen Having your property
stolen How often do
you pray?
Religion influences how I
live my life
I would describe myself as very
religious
Pearson -.027 .069 .038 .095 .092 .052 -.012 -.062
Sig. (2-tailed) .698 .322 .587 .169 .183 .455 .866 .375
Household Income
N 211 210 209 211 211 211 211 209
Pearson -.010 .109 .012 .028 .066 .088 .118 .096
Sig. (2-tailed) .876 .095 .849 .665 .311 .174 .069 .142
Education
N 238 237 236 238 238 238 238 235
Pearson -.046 -.047 -.031 .010 -.025 .656** .630** .672**
Sig. (2-tailed) .476 .475 .634 .882 .701 .000 .000 .000
How often did you attend religious services during the past year? N 238 237 236 238 238 238 238 235
Pearson -.009 .017 -.002 .027 -.014 .811** .816** .826**
Sig. (2-tailed) .885 .798 .979 .684 .835 .000 .000 .000
How important is religion in your life?
N 238 237 236 238 238 238 238 235
Pearson -.306** -.251** -.232** -.154* -.206** .011 .064 .106
Sig. (2-tailed) .000 .000 .000 .017 .001 .867 .322 .106
How safe do you feel being outside and alone in your own neighborhood during the day?
N 238 237 236 238 238 238 238 235
Pearson .347** .205** .249** .285** .349** .008 -.011 -.003
Sig. (2-tailed) .000 .002 .000 .000 .000 .900 .867 .966
Being approached by a pandhandler
N 238 237 236 238 238 238 238 235
Pearson .570** .393** .317** .319** .302** -.061 -.080 -.139*
Sig. (2-tailed) .000 .000 .000 .000 .000 .351 .218 .033
Being sexually assaulted
N 238 237 236 238 238 238 238 235
66

67
Being mugged
Having someone break into your
place of residence while you are
there
Having someone break into your
place of residence while you are not
there Having your
car stolen Having your property
stolen How often do
you pray?
Religion influences how I
live my life
I would describe myself as very
religious
Pearson .790** .589** .498** .426** .409** -.011 -.012 -.071
Sig. (2-tailed) .000 .000 .000 .000 .000 .862 .849 .280
Being assaulted by someone with a weapon
N 237 236 235 237 237 237 237 234
Pearson 1 .520** .426** .449** .368** .009 -.026 -.052
Sig. (2-tailed) .000 .000 .000 .000 .886 .692 .427
Being mugged
N 238 237 236 238 238 238 238 235
Pearson .520** 1 .712** .517** .464** .031 -.009 -.035
Sig. (2-tailed) .000 .000 .000 .000 .635 .887 .595
Having someone break into your place of residence while you are there
N 237 237 235 237 237 237 237 234
Pearson .426** .712** 1 .561** .589** -.009 -.051 -.070
Sig. (2-tailed) .000 .000 .000 .000 .890 .433 .285
Having someone break into your place of residence while you are not there
N 236 235 236 236 236 236 236 233
Pearson .449** .517** .561** 1 .627** -.054 -.031 -.084
Sig. (2-tailed) .000 .000 .000 .000 .404 .633 .199
Having your car stolen
N 238 237 236 238 238 238 238 235
Pearson .368** .464** .589** .627** 1 .000 -.019 -.080
Sig. (2-tailed) .000 .000 .000 .000 .997 .775 .219
Having your property stolen
N 238 237 236 238 238 238 238 235
Pearson .009 .031 -.009 -.054 .000 1 .787** .706**
Sig. (2-tailed) .886 .635 .890 .404 .997 .000 .000
How often do you pray?
N 238 237 236 238 238 238 238 235
Pearson -.026 -.009 -.051 -.031 -.019 .787** 1 .760**
Sig. (2-tailed) .692 .887 .433 .633 .775 .000 .000
Religion influences how I live my life
N 238 237 236 238 238 238 238 235

68
Being mugged
Having someone break into your
place of residence while you are
there
Having someone break into your
place of residence while you are not
there Having your
car stolen Having your property
stolen How often do
you pray?
Religion influences how I
live my life
I would describe myself as very
religious
Pearson -.052 -.035 -.070 -.084 -.080 .706** .760** 1
Sig. (2-tailed) .427 .595 .285 .199 .219 .000 .000
I would describe myself as very religious
N 235 234 233 235 235 235 235 235
Pearson -.340** -.231** -.235** -.193** -.245** -.014 .017 .100
Sig. (2-tailed) .000 .000 .000 .003 .000 .826 .798 .125
How safe do you feel being outside and alone in your own neighborhood during the night?
N 238 237 236 238 238 238 238 235
Pearson -.003 -.021 -.073 -.055 -.066 .759** .755** .815**
Sig. (2-tailed) .962 .753 .265 .400 .310 .000 .000 .000
Religiosity
N 235 234 233 235 235 235 235 235
Pearson -.386** -.292** -.287** -.180** -.270** .011 .073 .138*
Sig. (2-tailed) .000 .000 .000 .005 .000 .869 .262 .035
Fear of crime collapsed
N 238 237 236 238 238 238 238 235
Pearson -.010 -.005 -.048 .024 -.050 .098 .111 .119
Sig. (2-tailed) .876 .934 .464 .718 .439 .131 .087 .068
RaceRecode
N 238 237 236 238 238 238 238 235
Pearson -.101 .007 .061 -.026 -.002 .064 -.015 .065
Sig. (2-tailed) .125 .915 .360 .698 .973 .334 .816 .326
Age
N 232 231 230 232 232 232 232 229
Pearson -.181** -.139* -.043 -.045 .010 -.052 -.027 .059
Sig. (2-tailed) .005 .032 .507 .492 .880 .422 .678 .371
Genderrecode
N 238 237 236 238 238 238 238 235
Pearson .721** .701** .703** .682** .714** -.006 -.028 -.105
Sig. (2-tailed) .000 .000 .000 .000 .000 .927 .671 .112
Perceived Risk
N 234 234 234 234 234 234 234 231

69
How safe do you feel being outside and alone in your own
neighborhood during the night? Religiosity
Fear of crime collapsed RaceRecode Age Genderrecode Perceived Risk
Pearson .170* -.052 .156* -.123 .194** -.020 .057
Sig. (2-tailed) .013 .453 .023 .076 .005 .778 .416
Household Income
N 211 209 211 211 205 211 207
Pearson .047 .094 .039 -.139* .289** -.018 .034
Sig. (2-tailed) .471 .149 .551 .033 .000 .780 .601
Education
N 238 235 238 238 232 238 234
Pearson -.004 .705** .000 .140* -.029 .032 -.055
Sig. (2-tailed) .949 .000 .995 .030 .662 .628 .402
How often did you attend religious services during the past year? N 238 235 238 238 232 238 234
Pearson .028 .800** .059 .126 .033 -.025 -.015
Sig. (2-tailed) .665 .000 .367 .053 .621 .696 .823
How important is religion in your life?
N 238 235 238 238 232 238 234
Pearson .380** .036 .826** -.132* .028 .121 -.293**
Sig. (2-tailed) .000 .579 .000 .042 .673 .063 .000
How safe do you feel being outside and alone in your own neighborhood during the day?
N 238 235 238 238 232 238 234
Pearson -.130* -.021 -.191** -.066 .006 -.020 .558**
Sig. (2-tailed) .045 .753 .003 .308 .931 .758 .000
Being approached by a pandhandler
N 238 235 238 238 232 238 234
Pearson -.359** -.086 -.330** -.104 -.054 -.463** .617**
Sig. (2-tailed) .000 .186 .000 .109 .411 .000 .000
Being sexually assaulted
N 238 235 238 238 232 238 234
Pearson -.295** -.040 -.347** -.032 -.071 -.097 .689**
Sig. (2-tailed) .000 .543 .000 .626 .281 .138 .000
Being assaulted by someone with a weapon
N 237 234 237 237 231 237 234

70
How safe do you feel being outside and alone in your own
neighborhood during the night? Religiosity
Fear of crime collapsed RaceRecode Age Genderrecode Perceived Risk
Pearson -.340** -.003 -.386** -.010 -.101 -.181** .721**
Sig. (2-tailed) .000 .962 .000 .876 .125 .005 .000
Being mugged
N 238 235 238 238 232 238 234
Pearson -.231** -.021 -.292** -.005 .007 -.139* .701**
Sig. (2-tailed) .000 .753 .000 .934 .915 .032 .000
Having someone break into your place of residence while you are there N 237 234 237 237 231 237 234
Pearson -.235** -.073 -.287** -.048 .061 -.043 .703**
Sig. (2-tailed) .000 .265 .000 .464 .360 .507 .000
Having someone break into your place of residence while you are not there N 236 233 236 236 230 236 234
Pearson -.193** -.055 -.180** .024 -.026 -.045 .682**
Sig. (2-tailed) .003 .400 .005 .718 .698 .492 .000
Having your car stolen
N 238 235 238 238 232 238 234
Pearson -.245** -.066 -.270** -.050 -.002 .010 .714**
Sig. (2-tailed) .000 .310 .000 .439 .973 .880 .000
Having your property stolen
N 238 235 238 238 232 238 234
Pearson -.014 .759** .011 .098 .064 -.052 -.006
Sig. (2-tailed) .826 .000 .869 .131 .334 .422 .927
How often do you pray?
N 238 235 238 238 232 238 234
Pearson .017 .755** .073 .111 -.015 -.027 -.028
Sig. (2-tailed) .798 .000 .262 .087 .816 .678 .671
Religion influences how I live my life
N 238 235 238 238 232 238 234
Pearson .100 .815** .138* .119 .065 .059 -.105
Sig. (2-tailed) .125 .000 .035 .068 .326 .371 .112
I would describe myself as very religious
N 235 235 235 235 229 235 231

71
How safe do you feel being outside and alone in your own
neighborhood during the night? Religiosity
Fear of crime collapsed RaceRecode Age Genderrecode Perceived Risk
Pearson 1 .054 .762** -.076 .191** .357** -.344**
Sig. (2-tailed) .414 .000 .244 .003 .000 .000
How safe do you feel being outside and alone in your own neighborhood during the night?
N 238 235 238 238 232 238 234
Pearson .054 1 .065 .108 .066 -.030 -.077
Sig. (2-tailed) .414 .318 .100 .324 .643 .244
Religiosity
N 235 235 235 235 229 235 231
Pearson .762** .065 1 -.086 .107 .251** -.386**
Sig. (2-tailed) .000 .318 .185 .104 .000 .000
Fear of crime collapsed
N 238 235 238 238 232 238 234
Pearson -.076 .108 -.086 1 -.175** -.033 -.051
Sig. (2-tailed) .244 .100 .185 .008 .618 .441
RaceRecode
N 238 235 238 238 232 238 234
Pearson .191** .066 .107 -.175** 1 -.003 -.039
Sig. (2-tailed) .003 .324 .104 .008 .960 .562
Age
N 232 229 232 232 232 232 228
Pearson .357** -.030 .251** -.033 -.003 1 -.155*
Sig. (2-tailed) .000 .643 .000 .618 .960 .018
Genderrecode
N 238 235 238 238 232 238 234
Pearson -.344** -.077 -.386** -.051 -.039 -.155* 1
Sig. (2-tailed) .000 .244 .000 .441 .562 .018
Perceived Risk
N 234 231 234 234 228 234 234
**. Correlation is significant at the 0.01 level (2-tailed). *. Correlation is significant at the 0.05 level (2-tailed).