Embed Size (px)
Citation preview
RELIGIOSITY AND PARENTAL EDUCATIONAL
ASPIRATIONS FOR CHILDREN IN KENYA
Martin Paul Jr Tabe-Ojong* Emmanuel Nshakira-Rukundo†
April 2021
Abstract
Poor households do not make productive investments in human capital, despite the potential bene-fits and gains. One way for poor parents in rural communities to alter their poverty is to invest intheir children’s education as such investments reflect hopes and aspirations, given that increasingaspirations is key to breaking the intergenerational poverty chain. In this study, we examine therelationship between religiosity and parental educational aspirations for their children. We studyreligiosity from both an extensive (membership in religious institutions) and an intensive perspec-tive (extent of personal spiritual practice such as engaging in worship, meditating and prayer). Weemploy inverse probability weighting with regression adjustment and multivalued treatment effectsestimators on cross-sectional data from rural households in Kenya to estimate the relationship be-tween participation in religious institutions and religiosity on aspirations. We observe a positiveassociation between participation in religious institutions and religiosity on parental aspirations forchildren. The effect was stronger for girls. Our findings are robust to the use of alternative matchingand weighting estimators as well as various sensitivity tests. Overall, our findings provide empiricalsupport that religiosity may be a pathway in the promotion of educational aspirations, especially inthe light of cultural and societal norms prevalent in many rural settings.
Keywords: Religious institution; Religioisty; Educational aspirations; KenyaJEL Classification: Z12, Z13, D83 C83
*Institute for Food and Resource Economics (ILR), University of Bonn, Nussallee 19 53115 Bonn. Email:[email protected]
†ILR, University of Bonn and Apata Insights, Kampala Uganda. Email: Email: [email protected] [email protected]
1
1 Introduction
To improve development outcomes, the concept of aspirations has gained increased attention.This is because of the evidence that poor households generally have marginal involvementin human capital investments such as education, possibly due to overall low aspirations andexpectations (La Ferrara, 2019). Low aspirations partly emanate from constrained economicopportunities and lack of material resources (Appadurai, 2004). Furthermore, poor householdsmight be psychologically stressed owing to their liquidity and financial constraints, have higherinformation asymmetry, primarily on educational returns, and are more likely to be sociallydisadvantaged in terms of exposure and narrow social environments (for instance lacking rolemodels) to build their aspirations1 (García, Harker, & Cuartas, 2019).
A key question is then, how can aspirations be nudged to improve development outcomes?What are some of the inputs into one’s psychological and physical aspirations window that caninfluence the formation of aspirations? This question has gained increased attention. In re-sponse, we consider the possible contribution of a rather salient though generally understudiedfactor, the role of religious institutions and the extent of religiosity. We use cross-sectionaldata from the rural Baringo County in Kenya in which we incorporate gender-separated vi-gnette questions about parental educational aspirations for children. We measure the influenceof religiosity both from an extensive (membership in a religious institution) and an intensive di-mension (extent of participation in religious activities and more personal religiosity attributes).Applying inverse probability weighting with regression adjustment on both the binary and mul-tivalued treatment effects estimator, we find that religiosity increases parental educational as-pirations for children in general and girls in particular. Educational aspirations are crucialpredictors of educational attainment (Basler & Kriesi, 2019), and parental aspirations are vitalin predicting children’s educational attainment (Serneels & Dercon, 2021). Moreover, higherparental aspirations provide a baseline to invest in children as they signal a desire to break theintergenerational cycle of poverty (Genicot & Ray, 2017, 2020).
This work links to the emerging literature on the role of religion as a psychological input inthe achievement of development interventions. Several studies are related to our work and yetdifferent. Valdes, Wydick, and Lybbert (2020) studied the effect of nudging aspirations througha positive-messaging documentary coupled with a 12-months faith-based curriculum amongfemale borrowers of microfinance in Mexico. They found that the intervention increased indi-vidual aspirational hope and microfinance outcomes. Ross, Glewwe, Prudencio, and Wydick(2021) and Glewwe, Ross, and Wydick (2018) examined the effect of a Christian-centric childsponsorship programme on hope, self-efficacy, optimism and aspirations. They found that theprogram had strong positive effects on hope, educational and occupational aspirations as well
1In aspiration terms, low aspiration usually implies low aspiration windows, that is the group of individualsaround one’s cognitive window that shapes his/her aspirations.
1
as self-esteem. Bryan, Choi, and Karlan (2020)studied the effect of another Christian-centriceducational intervention in the Philippines on various economic outcomes and found that par-ticipants had higher consumption and perceived relative economic status.
While our work is related to these studies, there are two key distinctions that our study adds.The first is the measure of religion and religiosity. While these studies use robust experimen-tal and quasi-experimental identification strategies that expose individuals to some measure ofreligious training, randomizing intrinsic values such as beliefs or religiosity is an intricate mat-ter. We use an alternative assessment of religiosity that exploits the extent of religiosity fromthe current stock of religious practice. As opposed to exposing some individuals to a certainmeasure of religiosity and others not, we assume that all individuals have a particular stockof religious beliefs, but the intensity may vary. We, therefore, assess individuals along thisintensity continuum by generating a religiosity index from several questions that measure theextent of beliefs and religious practice. This helps us evaluate the role of religion both froman extensive and an intensive dimension. Secondly, our study assesses parental aspirations us-ing vignettes. This prevents parental favouritism and biases in parents’ evaluation of their realchildren. This is the case since vignettes are used in eliciting complicated household dynam-ics such as intra-household decision making (Bernard, Doss, Hidrobo, Hoel, & Kieran, 2020).Since we ask each household their rating of educational aspirations for both boys and girls, wecan observe differences across genders without conditioning households/parents to having bothgenders of children.
In a broader view, we contribute to research on drivers of aspirations, including those as-sessing the effects of conventional instruments such as cash transfers. Participation in cashtransfer programs increased parental aspirations for children’s education and children’s edu-cational aspirations (Chiapa, Garrido, & Prina, 2012; García et al., 2019; Kosec & Mo, 2017;Macours & Vakis, 2014; Whetten, Fontenla, & Villa, 2019), though this was not always thecase as Suarez and Cameron (2020) found in Colombia. Zou, Lybbert, Vosti, and Abbeddou(2020) explored the possible pathway of nudging aspirations through an early childhood nu-trition intervention and reported positive effects. Testing the hypothesis that relaxing externalconstraints can change internal psychological constraints, Garcia, Lensink, and Voors (2020)found the provision of microcredit to lessen some of the external limitations to aspire, increas-ing participating women’s life aspirations, hopes and economic welfare.
2 Aspirations and development
The role of behavioural biases and internal constraints in explaining poverty and economic out-comes is increasingly becoming central to poverty-reduction interventions (Besley, 2017). Onespecific form of this behavioural bias stems from aspirations (Appadurai, 2004; Ray, 2006).Aspirations are essential predictors of human capital achievement and economic outcomesthrough their influence on economic behaviour (Genicot & Ray, 2020). However, aspirations
2
vary in a population and are strongly linked to one’s poverty status and material endowments(Camfield, Masae, McGregor, & Promphaking, 2013; Chivers, 2017; T. Lybbert & Wydick,2018; Pasquier-Doumer & Brandon, 2015; Serneels & Dercon, 2021; Wuepper & Lybbert,2017). Recent development interventions have therefore incorporated aspirational modules intheir intervention continuum as a pathway to nudge aspirations building as a channel to povertyreduction (Bernard, Dercon, Orkin, & Taffesse, 2019; Bryan et al., 2020; Janzen, Magnan,Sharma, & Thompson, 2017; Mckenzie, Mohpal, & Yang, 2021; Riley, 2018).
The critical point to start in understanding aspirations is the concept of ’the capacity toaspire’ (Appadurai, 2004)2. Given the limitations to aspirations (such as shocks, poverty andgeneral material endowments), the capacity to aspire is determined by an individual’s capacityto fully explore the possibilities around them by repeatedly interacting with members in theirsocial network. As such, “aspirations are never simply individual. . . they are always formedin interaction and the thick of social life” (Appadurai, 2004, p.68). Through observation andpersonal experiences, individuals broaden their aspiration windows within specific referencegroups (Genicot & Ray, 2020; Ray, 2006, 2016).
Research on the determinants of aspirations can be divided into two groups. The first groupconsiders the role of conventional development interventions such as cash transfers (Chiapa etal., 2012; García et al., 2019; Kosec & Mo, 2017; Macours & Vakis, 2014; Suarez & Cameron,2020; Whetten et al., 2019), early childhood feeding (Zou et al., 2020) or microfinance inter-ventions (Garcia et al., 2020). The second set of studies considers soft, psychological factorssuch as beliefs (Boneva & Rauh, 2018), role models (Beaman, Duflo, Pande, & Topalova, 2012;Bernard et al., 2019; Golan & You, 2020; Riley, 2018), internalised reflexive thinking in formof self-portraits (Glewwe et al., 2018) or even goal-setting (Mckenzie et al., 2021). This isin view that aspirations are driven by both physical, budget relaxing, and soft psychologicalinterventions that nudge beliefs and values. From this second set of studies lies the more recentinterest on the role of religion in aspirations and general development outcomes.
2.1 The role of religion in the development of aspirations
There has been a growth in the literature assessing the influence of religion in the context of in-trinsic values that drive aspirations. The interest in religion as a driver of aspirations and overalldevelopment reconnects with Max Weber’s 19th Century thesis that Protestantism’s intrinsic re-ligious values promoted a desire for aspirational capital accumulation through frugal lifestylesand higher work ethic, which became pivotal in the growth of capitalism (Weber, 2001). Theevidence testing this theory suggests that, indeed, communities with a higher level of protes-tants had higher literacy and economic prosperity (Becker, 2008; Becker & Woessmann, 2009).
2This concept implies that the aspiration window must be opened to internalize some efforts for any welfareimprovement to occur. But again, the window should not be binding or very wide so as not to induce frustrationand resentment. High aspirations with limited achievement are likely to generate frustration (Mckenzie et al.,2021)
3
The expansion of Christian missionary work further exported these effects leading to increasedurbanization (Bai & Kung, 2015), higher women’s labour market participation (Meier zu Sel-hausen, 2014), delayed early entry into marriages (Kudo, 2017), and the associated innovationssuch as printing press increased literacy, trust and political participation (Cagé & Rueda, 2016).
More recently, charismatic, often Pentecostal Christianity has emerged as the new fron-tier for Weber’s thesis in developing countries (Frahm-Arp, 2018; Freeman, 2015; Gifford &Nogueira-Godsey, 2011; Kirby, 2019). This has been followed by research assessing the ef-fects of religion and religiosity on development outcomes. Recent studies have evaluated theimpact of Christian-centric child sponsorship programmes on long term economic outcomes(Glewwe et al., 2018; Lockhart, 2003; Neubert, Bradley, Ardianti, & Simiyu, 2017; Ross etal., 2021; Wydick, Glewwe, & Rutledge, 2013, 2017) or other Christian-oriented interventions(Bryan et al., 2020; T. J. Lybbert & Wydick, 2016; Valdes et al., 2020; Wydick, Dowd, &Lybbert, 2020). The key thesis in these studies is that exposure to religious teaching unlocksindividuals’ internal psychological limitations and empowers them with the potential for socio-economic progress, akin to the protestant ethic thesis. Indeed, these studies report positive andsignificant effects of religion on most of the outcomes measured.
There are a couple of pathways through which increased exposure to religious teaching andpractice can raise aspirations. First, the recent growth of Pentecostal theology of prosperity,building on Weber’s thesis, enables individuals to partly challenge the adverse circumstancesof their poverty (Conradie & Robeyns, 2013). Individuals of this persuasion tend to believethat they can live a “glorious life” (Fantini, 2016; Gifford & Nogueira-Godsey, 2011)( andthat earthly material accumulation such as houses are an indication of such blessings (Adu-Gyamfi, 2020). Individuals receive more empowering messages that positively influence theiresteem and self-efficacy (Mariz, 1992; Ross et al., 2021), thereby increasing their economicand civic participation (McClendon & Riedl, 2015). Secondly, religious practices also providean additional capital – the faith/ spiritual capital, defined as a “fund of beliefs, examples andcommitments transmitted through religious practice and which attach people to transcendentalsources of happiness” (Malloch, 2014). Spiritual capital is associated with how religious prac-tice influences economic behaviour through networks and associations (DeAngelis & Ellison,2018; Dumangane, 2017; Holland, 2016; Strhan, 2017; Yuen & Leung, 2019).
Thirdly, through religious social networks, individuals are exposed to clerics and elders whoact as role models in influencing their actions, including goal setting (Anquandah Arthur, 2021;Bhatasara, Shamuyedova, Choguya, & Chiweshe, 2017) and information sharing (Murphy,Nourani, & Lee, 2020). In these groups, members are usually exposed to reference leaders androle models, which improves their aspirations.3 Social exposure further improves informationflow, allowing individuals to more fully engage in a diverse set of investment options to meet
3Social exposure triggers social interaction, which increases the navigational capacity of individuals necessaryto form aspirations. Since individuals usually have bounded rationality, exposure enlarges the set of alternativeoptions that they consider (Chiapa et al., 2012)
4
stated goals. Previous literature (Beaman et al., 2012; Bernard et al., 2019; Bernard & Taffesse,2014; Golan & You, 2020; T. Lybbert & Wydick, 2018; Macours & Vakis, 2014)holds it thatexposure to role models or leaders in a community can build aspiration of rural households. Ofcourse, this is through increasing the feasible set of people (aspiration window) to whom thesehouseholds can look up to. If the role models are better-off, households would look up to themand even try to mimic all they do.
3 Data and empirical strategy
3.1 Data
We use household survey data from Baringo county of Northern Kenya, conducted betweenJuly and August 2019. Multistage sampling was employed to select four wards (Marigat,Ilchamus, Mochongoi and Ewale/Chapchap) and 35 enumeration areas (villages) using theProbability Proportional to Size (PPS) framework. Complete household lists were obtainedfrom village leaders, and 15 households were randomly selected from each village. The totalsample was 530 households. Interviews were conducted with the household heads or their part-ners. To leverage the respondents’ language abilities, interviews were conducted in the area’slocal languages (Ilchamus, Tugen and Pokot languages). We trained research assistants andtested the survey instrument several rounds before survey implementation.
The comprehensive survey included information on households’ socio-economic and bi-ographic profiles, wealth and asset profiles, institutional characteristics, internal behaviouralcharacteristics like hopes, aspirations, trust, locus of control, and self-efficacy. Information onthe membership of households in religious institutions was also obtained and their proximityto these institutions. Under aspirations, we captured the parental aspirations of parents towardstheir children using two vignettes. We distinguish our outcome variable into two: parentalaspiration for girls and parental aspiration for boys. We discuss how these are measured below.
3.2 Measurement of aspirations
Educational aspirations are defined as the goals, or plans parents have for their children. Theycan either be realistic or idealistic (Widlund, Tuominen, Tapola, & Korhonen, 2020), depend-ing on the perceived constraints and range of attainment. While idealistic aspirations reflectan individual’s desired achievement, realistic aspirations refer to the perceived likelihood ofattaining the aspired educational level considering the various constraints involved. For ouranalysis, we rely on the idealistic aspiration as it fits our definition of aspirations.
We use a variation of Bernard and Taffesse (2014) aspiration framework developed andtested in Ethiopia. We frame aspiration questions as vignettes that use fictional children insteadof the actual children a respondent/ parent has. We formulate the vignettes as follows: "James
5
is a son in this household. He is five years old. If there were no limitations to the household’s
capacity to educate him, how many years of schooling would you wish James to achieve?" Theenumerators were allowed to vary the name of the child to any locally recognizable name andalso vary the age of the child to an age that was less or equal to 10 years. The vignette was thenrepeated for daughters such that for every household, two observations were recorded.
3.3 Descriptive results
Table 1 offers a descriptive summary of the outcome variables, the variable of interest, andthe households’ socio-economic profiles. The aspired mean years of schooling for girls was18.12 years, slightly greater than for boys, at 18.10. Both aspiration levels are almost 2.2 timesthe current mean level of education of household heads, implying that parents aspire to greatereducation for their children. Given the educational curriculum in Kenya, which consists of 8years of primary level education, four years of secondary education and four years of highereducation, 18 years of schooling represents at least postgraduate education level. Parents thusaspire that their children reach the pinnacle of education. Irrespective of gender, parents havevery high aspirations for children.
About 70% of households participate in religious institutions in the Baringo county. Thoughreligion is widespread in Kenya, the Pokot people that inhabit a large part of Baringo countyhave maintained a substantial composition of traditional religious practices (Ngeiywo, 2018).Therefore, about 30% of the sample were not affiliated with any Christian or Islamic denomina-tion. Under the Christian canopy, there is the plurality of religious institutions like the Catholicchurch and others that record the highest number of members. Recently, there has been anupsurge of religious entrepreneurism, which takes the form of many Pentecostal and charis-matic denominations. While they are the smallest in absolute numbers, they are the fastestgrowing and their focus on material accumulation through the "prosperity gospel" brings themcloser to the religion-aspirations spectrum. However, we do not observe religious belongingat its most minute level. We categorize all Christian denominations into one group. Christiandenominations together comprise 67%.
Turning our focus to households’ knowledge and attendance in RIs in our sample, we findthat households know an average of 5 RIs in the various locations4 around their villages. Mostof the RIs are located close to households, with a mean distance of 2.58km to their most pre-ferred places of worship. It takes a median time of about 23 minutes to get to their respectiveRIs. As mentioned above, daily but mostly weekend attendance (Saturdays and Sundays) forma large part of household participation in RIs. Weekly average attendance was approximatelyone. As households participate in RIs, there is also some interaction with religious leaders. Amean interaction level of about 17% is reported.
4A location refers to an administrative unit in Kenya larger than a village and smaller than a ward
6
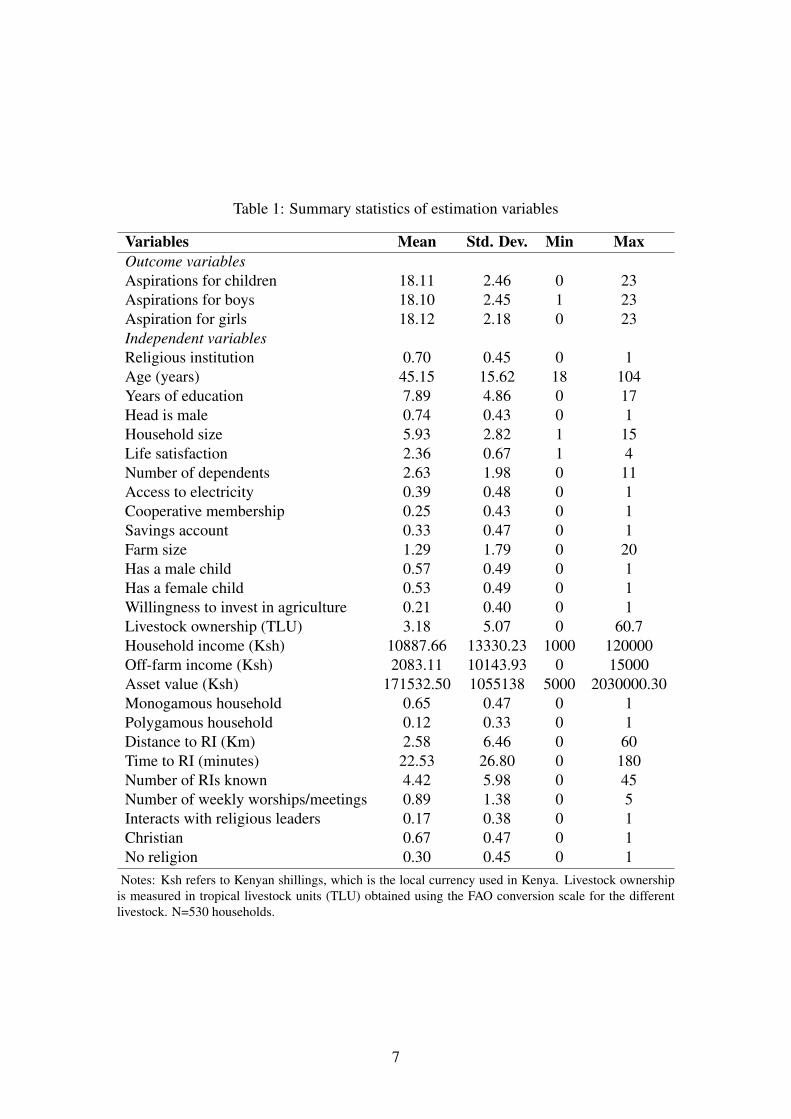
Table 1: Summary statistics of estimation variables
Variables Mean Std. Dev. Min MaxOutcome variablesAspirations for children 18.11 2.46 0 23Aspirations for boys 18.10 2.45 1 23Aspiration for girls 18.12 2.18 0 23Independent variablesReligious institution 0.70 0.45 0 1Age (years) 45.15 15.62 18 104Years of education 7.89 4.86 0 17Head is male 0.74 0.43 0 1Household size 5.93 2.82 1 15Life satisfaction 2.36 0.67 1 4Number of dependents 2.63 1.98 0 11Access to electricity 0.39 0.48 0 1Cooperative membership 0.25 0.43 0 1Savings account 0.33 0.47 0 1Farm size 1.29 1.79 0 20Has a male child 0.57 0.49 0 1Has a female child 0.53 0.49 0 1Willingness to invest in agriculture 0.21 0.40 0 1Livestock ownership (TLU) 3.18 5.07 0 60.7Household income (Ksh) 10887.66 13330.23 1000 120000Off-farm income (Ksh) 2083.11 10143.93 0 15000Asset value (Ksh) 171532.50 1055138 5000 2030000.30Monogamous household 0.65 0.47 0 1Polygamous household 0.12 0.33 0 1Distance to RI (Km) 2.58 6.46 0 60Time to RI (minutes) 22.53 26.80 0 180Number of RIs known 4.42 5.98 0 45Number of weekly worships/meetings 0.89 1.38 0 5Interacts with religious leaders 0.17 0.38 0 1Christian 0.67 0.47 0 1No religion 0.30 0.45 0 1
Notes: Ksh refers to Kenyan shillings, which is the local currency used in Kenya. Livestock ownershipis measured in tropical livestock units (TLU) obtained using the FAO conversion scale for the differentlivestock. N=530 households.
7
Regarding other contextual and other socio-economic characteristics, household heads havean average education level of about 8years. Most households (74%) are male-headed house-holds with a mean age of 45 years for household heads. Households have a mean size of aboutsix members. About 65% of the households are married monogamously, while 12% are intoa polygamous form of matrimony. As the study area is a pastoral community, livestock keep-ing is very common, with households having a mean tropical livestock unit.5 (TLU) of 3.18.They also report an average income of about 10887.66Ksh and an accompanying asset level of171532.50Ksh.
3.4 Empirical specification
To examine the relationship between religious institutions and parental aspirations for chil-dren, we need a counterfactual to enable credible comparisons. However, in the absence ofexperimental data, counterfactuals are not possible due to the self-selection of individuals inreligious institutions. Participants/ members of RIs might be systematically different fromnon-members. Matching on the propensity score provides a credible avenue of deriving casualassociations when cross-sectional data is at hand. Matching helps us compare households thatparticipate in RIs and those that do not but with a similar probability of participation derivedfrom observable covariates. We apply a variation of matching – inverse probability weightingwith regression adjustment (IPWRA), which is both doubly robust and imposes fewer restric-tions on the functional form of the treatment reduction model. Our outcome model is thusestimated as:
Yi = f (RIi,β )+ui (1)
The treatment model is then represented as:
Pr(Ti = 1,0) = h(X i,α)+ vi (2)
RI is the binary measure of participation in religious institutions, X is a vector of explana-tory variables determining/constraining households’ participation in RI. β and α are parameterestimates of the impact of RI on parental aspirations for children and the correlates of member-ship in RIs. Our main parameter of interest is β , where we hypothesize a positive relationshipwith aspirations, additionally differential impacts.
To calculate the doubly robust estimates of aspirations for household members and non-members in RIs, we estimate the following expected aspiration equations.
5This is the Food and Agriculture Organization scale for measuring livestock ownership based on their liveweight.
8
For members in RIs (RI=1),
YRI=1
PS− Y1
PS(1−PS) (3)
For non-members in RIs (RI=0),
YRI=0
1−PS− Y0
1−PS(PS) (4)
Where PS refers to the propensity score, YRI=1 is the observed parental aspirations formembers of RIs while YRI=0 is the observed parental aspirations for non-members of RIs. Y1
and Y0 are the predicted parental aspirations given membership stats in RIs E(Y | RI = 1,X)
and E(Y | RI = 0,X), respectively.The advantages of the IPWRA doubly robust estimator lie in its ability to produce consistent
estimates of the treatment parameters in cases where either the treatment or the outcome modeland not necessarily both are correctly specified. Inverse probability weighting, akin to match-ing generates a pseudo-population where there are no confoundings, such that the weightedaverages are a mirror reflection of the actual population average. By incorporating regres-sion adjustment, IPWRA fits separate linear models for households that participate in RIs andthose that do not and then predicts the covariate-specific outcomes under the different RI status.Further and even more important is the fact that IPWRA enables us to model both aspirationoutcomes when the treatment is a dummy (RIs) and also when multivalued (religiosity).
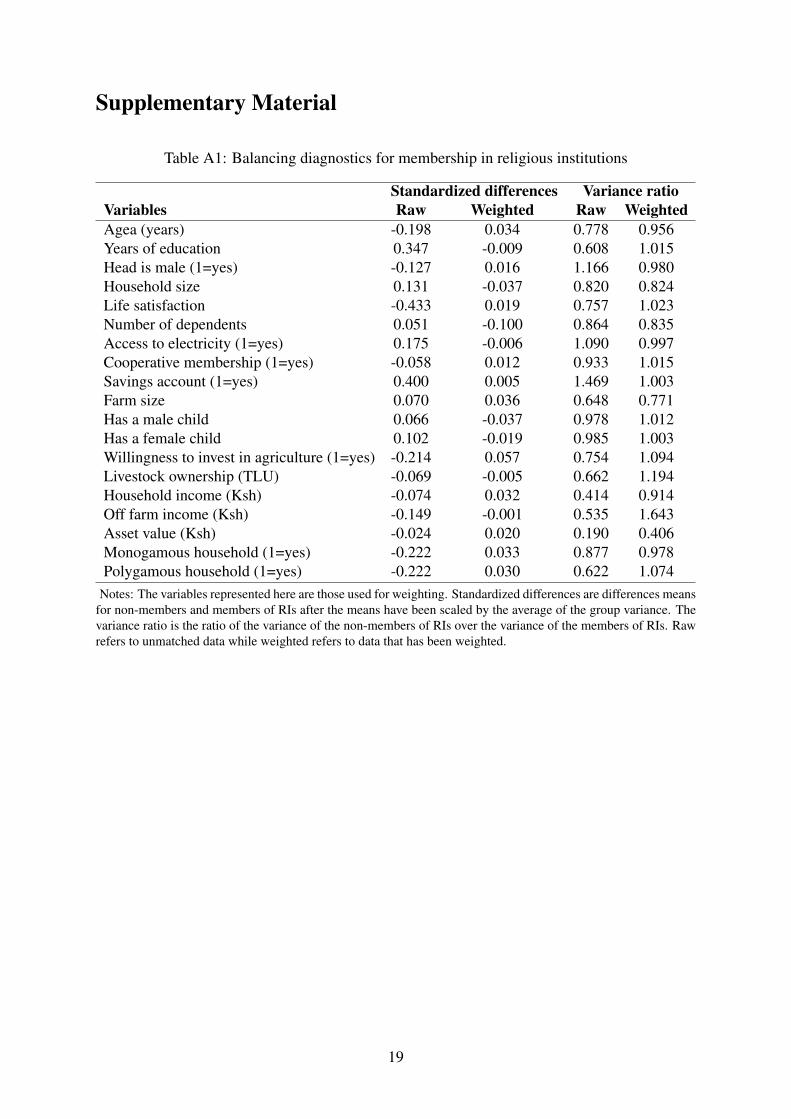
To ensure validity, we examine the common support condition and find evidence of commonsupport, as shown in Figure A1 in the supplementary material. Regarding the overlap conditionfor weighting regressions, we observe sufficient overlap after plotting the kernel densities ofthe probability of participating in a RI. We also perform different balance checks to assess pre-estimation balancing between treated and control units. As shown in Supplementary Table A1,none of the weighting variables has a standardized difference greater than 0.11, which is withinthe conventional thresholds (Imbens & Wooldridge, 2009) without reducing our sample size.We perform a couple of sensitivity tests, introducing non-linearity, unconfoundedness, andalternative weighting and doubly robust estimators to confirm the robustness of the treatmenteffects.
9
4 Results and discussion
4.1 Effect of religious institutions on parental educational aspirations forchildren
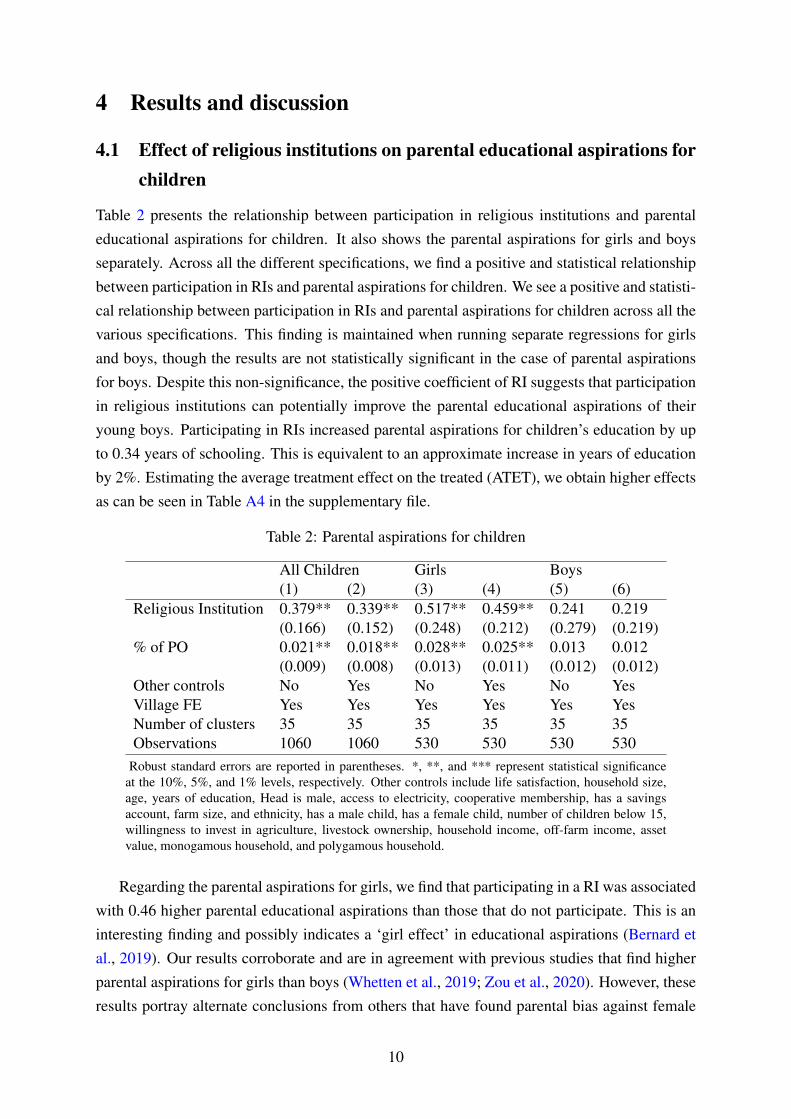
Table 2 presents the relationship between participation in religious institutions and parentaleducational aspirations for children. It also shows the parental aspirations for girls and boysseparately. Across all the different specifications, we find a positive and statistical relationshipbetween participation in RIs and parental aspirations for children. We see a positive and statisti-cal relationship between participation in RIs and parental aspirations for children across all thevarious specifications. This finding is maintained when running separate regressions for girlsand boys, though the results are not statistically significant in the case of parental aspirationsfor boys. Despite this non-significance, the positive coefficient of RI suggests that participationin religious institutions can potentially improve the parental educational aspirations of theiryoung boys. Participating in RIs increased parental aspirations for children’s education by upto 0.34 years of schooling. This is equivalent to an approximate increase in years of educationby 2%. Estimating the average treatment effect on the treated (ATET), we obtain higher effectsas can be seen in Table A4 in the supplementary file.
Table 2: Parental aspirations for children
All Children Girls Boys(1) (2) (3) (4) (5) (6)
Religious Institution 0.379** 0.339** 0.517** 0.459** 0.241 0.219(0.166) (0.152) (0.248) (0.212) (0.279) (0.219)
% of PO 0.021** 0.018** 0.028** 0.025** 0.013 0.012(0.009) (0.008) (0.013) (0.011) (0.012) (0.012)
Other controls No Yes No Yes No YesVillage FE Yes Yes Yes Yes Yes YesNumber of clusters 35 35 35 35 35 35Observations 1060 1060 530 530 530 530
Robust standard errors are reported in parentheses. *, **, and *** represent statistical significanceat the 10%, 5%, and 1% levels, respectively. Other controls include life satisfaction, household size,age, years of education, Head is male, access to electricity, cooperative membership, has a savingsaccount, farm size, and ethnicity, has a male child, has a female child, number of children below 15,willingness to invest in agriculture, livestock ownership, household income, off-farm income, assetvalue, monogamous household, and polygamous household.
Regarding the parental aspirations for girls, we find that participating in a RI was associatedwith 0.46 higher parental educational aspirations than those that do not participate. This is aninteresting finding and possibly indicates a ‘girl effect’ in educational aspirations (Bernard etal., 2019). Our results corroborate and are in agreement with previous studies that find higherparental aspirations for girls than boys (Whetten et al., 2019; Zou et al., 2020). However, theseresults portray alternate conclusions from others that have found parental bias against female
10
education aspirations (Bernard et al., 2019; Dercon & Singh, 2013; Favara & Sanchez, 2017).A key difference seems to be the possible proximity to potential role models in religious en-vironments even when there is male domination (Bamberger, 2014; Bhatasara et al., 2017).Another possible dimension of our results is the social nature of religious institutions in up-lifting the rights and positions of less privileged people, including women and girls. From theearlier days of Lutheran protestant expansion in medieval Europe, girls’ education was highlyencouraged (Becker, 2008), and this seemed to spread as Christianity extended into Africa(Kudo, 2017; Meier zu Selhausen, 2014). Our results are therefore consistent with religion’sinfluence on girls’ education and empowerment. Favara and Sanchez (2017) shows that genderbias in girls’ education aspirations is associated with parental expectations in labour and mar-riage markets. Therefore, parents might believe that an educated daughter might have betterchances in adulthood and aim to invest in both their educational attainment. There is, there-fore, some suggestive evidence that participating in religious institutions might be a pathwayof narrowing gender biases, especially towards better outcomes for girls.
4.2 Effect of intensive religiosity on aspirations
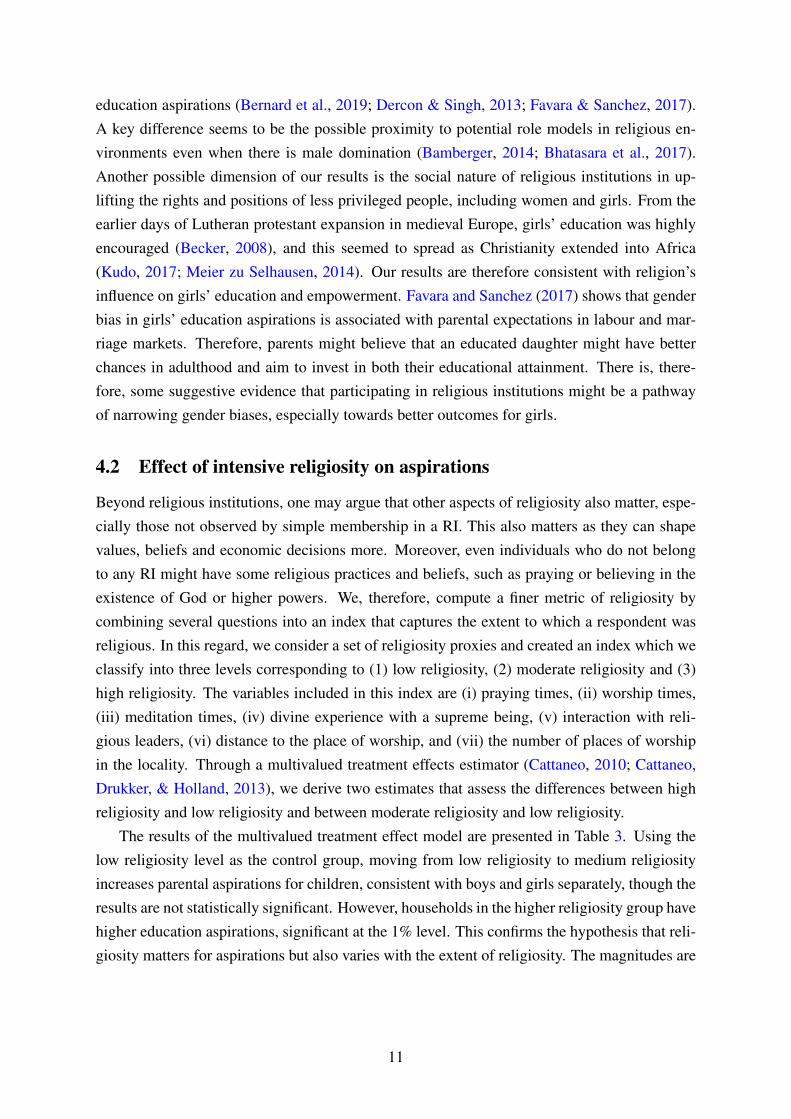
Beyond religious institutions, one may argue that other aspects of religiosity also matter, espe-cially those not observed by simple membership in a RI. This also matters as they can shapevalues, beliefs and economic decisions more. Moreover, even individuals who do not belongto any RI might have some religious practices and beliefs, such as praying or believing in theexistence of God or higher powers. We, therefore, compute a finer metric of religiosity bycombining several questions into an index that captures the extent to which a respondent wasreligious. In this regard, we consider a set of religiosity proxies and created an index which weclassify into three levels corresponding to (1) low religiosity, (2) moderate religiosity and (3)high religiosity. The variables included in this index are (i) praying times, (ii) worship times,(iii) meditation times, (iv) divine experience with a supreme being, (v) interaction with reli-gious leaders, (vi) distance to the place of worship, and (vii) the number of places of worshipin the locality. Through a multivalued treatment effects estimator (Cattaneo, 2010; Cattaneo,Drukker, & Holland, 2013), we derive two estimates that assess the differences between highreligiosity and low religiosity and between moderate religiosity and low religiosity.
The results of the multivalued treatment effect model are presented in Table 3. Using thelow religiosity level as the control group, moving from low religiosity to medium religiosityincreases parental aspirations for children, consistent with boys and girls separately, though theresults are not statistically significant. However, households in the higher religiosity group havehigher education aspirations, significant at the 1% level. This confirms the hypothesis that reli-giosity matters for aspirations but also varies with the extent of religiosity. The magnitudes are
11
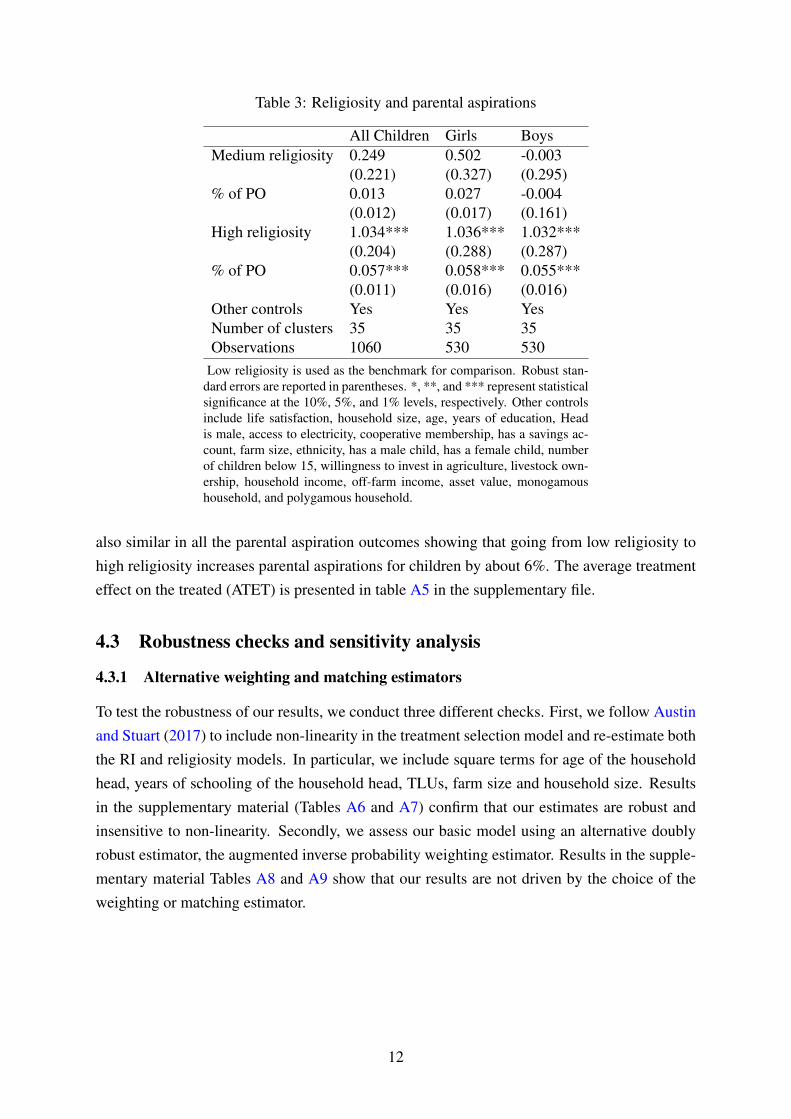
Table 3: Religiosity and parental aspirations
All Children Girls BoysMedium religiosity 0.249 0.502 -0.003
(0.221) (0.327) (0.295)% of PO 0.013 0.027 -0.004
(0.012) (0.017) (0.161)High religiosity 1.034*** 1.036*** 1.032***
(0.204) (0.288) (0.287)% of PO 0.057*** 0.058*** 0.055***
(0.011) (0.016) (0.016)Other controls Yes Yes YesNumber of clusters 35 35 35Observations 1060 530 530
Low religiosity is used as the benchmark for comparison. Robust stan-dard errors are reported in parentheses. *, **, and *** represent statisticalsignificance at the 10%, 5%, and 1% levels, respectively. Other controlsinclude life satisfaction, household size, age, years of education, Headis male, access to electricity, cooperative membership, has a savings ac-count, farm size, ethnicity, has a male child, has a female child, numberof children below 15, willingness to invest in agriculture, livestock own-ership, household income, off-farm income, asset value, monogamoushousehold, and polygamous household.
also similar in all the parental aspiration outcomes showing that going from low religiosity tohigh religiosity increases parental aspirations for children by about 6%. The average treatmenteffect on the treated (ATET) is presented in table A5 in the supplementary file.
4.3 Robustness checks and sensitivity analysis
4.3.1 Alternative weighting and matching estimators
To test the robustness of our results, we conduct three different checks. First, we follow Austinand Stuart (2017) to include non-linearity in the treatment selection model and re-estimate boththe RI and religiosity models. In particular, we include square terms for age of the householdhead, years of schooling of the household head, TLUs, farm size and household size. Resultsin the supplementary material (Tables A6 and A7) confirm that our estimates are robust andinsensitive to non-linearity. Secondly, we assess our basic model using an alternative doublyrobust estimator, the augmented inverse probability weighting estimator. Results in the supple-mentary material Tables A8 and A9 show that our results are not driven by the choice of theweighting or matching estimator.
12
4.3.2 Sensitivity analysis
To further ensure the robustness of our estimates, we also performed some sensitivity checks toconfirm the validity of the treatment effects estimated using the unconfoundedness assumption.This assumption states that after conditioning on a set of covariates, treatment outcome, in ourcase religiosity, is independent of potential outcomes. To render the credibility of our treat-ment effect estimates under this assumption, we follow Masten, Poirier, and Zhang (2020) toperform sensitivity inference on the treatment effect. This procedure relaxes the unconfound-edness assumption indexed by a conditional c-dependence scalar parameter c ∈ [0,1] usingnon-parametric techniques. When c = 0, this is equivalent to the unconfoundedness assump-tion, and for c > 0, this assumption only partially holds, making it hard to learn the value of thetreatment effect. In this case, only bounds which are usually a function of c can be gotten.
To estimate these bounds for different values of c, we use the tesensitivity package in Stata(Masten et al., 2020). This command estimates bounds on the treatment effect for a range of c-values. It also calculates a breakdown point: the maximum value of c under which the findingsare maintained. This is analogous to r bounds in propensity score matching. We observebreakdown points at 0.012 for parental aspirations for children. This further confirms that thetreatment effect is non-negative, as supported by our point estimates. The results are reportedgraphically in the supplementary file (Figures A3 and A4). Looking at the shape of the bounds,we see that our data depict substantial robustness to relaxations of the baseline assumptions.Our estimated bounds are also small, showing strong data support of the robustness of ourresults to relaxations of unconfoundedness.
Furthermore, we perform some leave-out analysis where we estimate the 50th, 75th and90th percentiles. Inspecting the leave-out-variable-k propensity scores, we further observe thatmost variations are smaller than the treatment effect breakdown points hence confirming therobustness of our results. These results are shown in Supplementary Table A10.
5 Conclusion
This paper has examined the relationship between participation in religious institutions andreligiosity in general on parental educational aspirations for boys and girls in Kenya. We im-plement a doubly robust IPWRA estimator on both binary (RIs) and multivalued (religiosity)indicators to reduce selection bias. Overall, we find participation in religious institutions todepict a positive and statistically significant effect on parental aspirations for children. Dis-aggregating by gender, we observe no significant relationship with the parental aspirations ofboys but find a large and statistically significant impact for girls. Suggestively, we believe thatthis effect might be driven by religious role models and the potential of religious institutions tolook out for the least privileged. The role model postulation is in line with previous studies thatreport a positive effect of role models on girls’ aspirations (Beaman et al., 2012; Riley, 2018).
13
The possible girl effect is further elevated by the historical evidence of the impact of religionon female education and economic outcomes (Becker, 2008; Kudo, 2017; Meier zu Selhausen,2014). We then consider a more subtle measurement of religious values and beliefs througha religiosity index. Comparing lower and higher religiosity households, we find that higherreligiosity was associated with higher educational aspirations for all children. Our results arerobust to changes in the choice of matching estimator used and introducing non-linearity inthe treatment selection model. Further sensitivity tests show that our models are insensitive toconfounding.
In general, we make two key contributions which are relevant for development policy. First,we add to the emerging literature on the economics of religion, especially in development out-comes. We use previously unstudied measures of religiosity to show that religion and socio-economic outcomes are strongly related. Outcomes such as aspirations can be nudged throughindividuals’ values and practices such as religion. Secondly, we contribute to recent studieson aspirations. While other studies have established that aspirations matter in developmentoutcomes, we partly respond to the question of what drives aspirations. By moving beyond abinary measure of religious membership, we show that more intrinsic religious values, univer-sally held with different intensities, can predict aspirations. Therefore, interventions seeking toimprove people’s aspirations might strongly consider incorporating religion as a key input inindividual decision-making regarding economic choices.
One limitation of our work, however, is that with cross-sectional data, we are unable to de-rive precise causal results due to selection biases, especially from possible unobserved differ-ences in the distribution of religious practices. Though we employ various tests of robustnessand sensitivity, we can only control for observable differences. This leaves room for futureresearch to build on this formative evidence to test more robust causal pathways.
ReferencesAdu-Gyamfi, A. (2020). Connecting religion to homeownership : exploring local perspectives
in Ghana. Cities, 96(January 2019), 102441.Anquandah Arthur, J. (2021). The gospel of prosperity and its concept of development: A
Ghanaian Pentecostal-Charismatic experience. Religion, 51(1), 90–104.Appadurai, A. (2004). The Capacity to Aspire: Culture and the Terms of Recognition. In
V. Rao & M. Walton (Eds.), Culture and public action (pp. 59–84). Stanford California:Stanford University Press.
Austin, P. C., & Stuart, E. A. (2017). The performance of inverse probability of treatmentweighting and full matching on the propensity score in the presence of model misspecifi-cation when estimating the effect of treatment on survival outcomes. Statistical Methodsin Medical Research, 26(4), 1654–1670.
Bai, Y., & Kung, J. K. S. (2015). Diffusing knowledge while spreading god’s message: Protes-tantism and economic prosperity in China, 1840-1920. Journal of the European Eco-nomic Association, 13(4), 669–698.
14
Bamberger, Y. M. (2014). Encouraging girls into science and technology with feminine rolemodel: Does this work? Journal of Science Education and Technology, 23(4), 549–561.
Basler, A., & Kriesi, I. (2019). Adolescents’ development of occupational aspirations ina tracked and vocation-oriented educational system. Journal of Vocational Behavior,115(December 2018), 103330.
Beaman, L., Duflo, E., Pande, R., & Topalova, P. (2012). Female leadership raises aspirationsand educational attainment for girls: A policy experiment in India. Science, 335(6068),582–586.
Becker, S. O. (2008). Luther and the Girls : Religious Denomination and the Female EducationGap in Nineteenth-century Prussia. Scandinavian Journal of Economicsof Economics,110(4), 777–805.
Becker, S. O., & Woessmann, L. (2009). Was Weber Wrong? A Human Capital Theory ofProtestant Economic History. The Quarterly Journal of Economics, 124(2), 531–596.
Bernard, T., Dercon, S., Orkin, K., & Taffesse, A. S. (2019). Parental Aspirations for Children’sEducation: Is There a “Girl Effect”? Experimental Evidence from Rural Ethiopia. AEAPapers and Proceedings, 109, 127–132.
Bernard, T., Doss, C., Hidrobo, M., Hoel, J., & Kieran, C. (2020). Ask me why: Patterns ofintrahousehold decision-making. World Development, 125, 104671.
Bernard, T., & Taffesse, A. S. (2014). Aspirations: An approach to measurement with valida-tion using ethiopian data. Journal of African Economies, 23(2), 189–224.
Besley, T. (2017). Aspirations and the political economy of inequality. Oxford EconomicPapers, 69(1), 1–35.
Bhatasara, S., Shamuyedova, R., Choguya, N. Z., & Chiweshe, M. K. (2017). Women andPentecostalism in Zimbabwe: Negotiating Leadership in the Zimbabwe Assemblies ofGod ‘Forward in Faith’ (zaoga fif) Ministry, Harare. Annual Review of the Sociology ofReligion, 291–306.
Boneva, T., & Rauh, C. (2018). Parental Beliefs About Returns to Educational Investments -The Later the Better? Journal ofthe European Economic Association, 00(May), 1–10.
Bryan, G., Choi, J. J., & Karlan, D. (2020). Randomizing Religion: The Impact of ProtestantEvangelism on Economic Outcomes. Quarterly Journal of Economics.
Cagé, J., & Rueda, V. (2016). The Long-Term Effects of the Printing Press in Sub-SaharanAfrica. American Economic Journal: Applied Economics, 8(3), 69–99.
Camfield, L., Masae, A., McGregor, J. A., & Promphaking, B. (2013). Cultures of Aspira-tion and Poverty? Aspirational Inequalities in Northeast and Southern Thailand. SocialIndicators Research, 114(3), 1049–1072.
Cattaneo, M. D. (2010). Efficient semiparametric estimation of multi-valued treatment effectsunder ignorability. Journal of Econometrics, 155(2), 138–154.
Cattaneo, M. D., Drukker, D. M., & Holland, A. D. (2013). Estimation of multivalued treatmenteffects under conditional independence. Stata Journal, 13(3), 407–450.
Chiapa, C., Garrido, J. L., & Prina, S. (2012). The effect of social programs and exposure toprofessionals on the educational aspirations of the poor. Economics of Education Review,31(5), 778–798.
Chivers, D. (2017). Success, survive or escape? Aspirations and poverty traps. Journal ofEconomic Behavior and Organization, 143, 116–132.
Conradie, I., & Robeyns, I. (2013). Aspirations and Human Development Interventions. Jour-nal of Human Development and Capabilities, 14(4), 559–580.
15
DeAngelis, R. T., & Ellison, C. G. (2018). Aspiration Strain and Mental Health: TheEducation-Contingent Role of Religion. Journal for the Scientific Study of Religion,57(2), 341–364.
Dercon, S., & Singh, A. (2013). From Nutrition to Aspirations and Self-Efficacy: Gender Biasover Time among Children in Four Countries. World Development, 45, 31–50.
Dumangane, C. (2017). The significance of faith for Black men’s educational aspirations.British Educational Research Journal, 43(5), 875–903.
Fantini, E. (2016). Crafting Ethiopia’ s Glorious Destiny Pentecostalism and Economic Trans-formation under a Developmental State. ARCHIVES DE SCIENCES SOCIALES DESRELIGIONS, 175(January 2020), 67–86.
Favara, M., & Sanchez, A. (2017). Psychosocial competencies and risky behaviours in Peru.IZA Journal of Labor and Development, 6(1).
Frahm-Arp, M. (2018). Pentecostalism, Politics, and Prosperity in South Africa. Religions, 9,298.
Freeman, D. (2015). Pentecostalism and economic development in sub-Saharan Africa. InE. Tomalin (Ed.), The routledge handbook of religions and global development (pp. 114–126). Abingdon, Oxon, UK: Routledge.
Garcia, A., Lensink, R., & Voors, M. (2020). Does microcredit increase aspirational hope? Evi-dence from a group lending scheme in Sierra Leone. World Development, 128, 104861.
García, S., Harker, A., & Cuartas, J. (2019). Building dreams: The short-term impacts ofa conditional cash transfer program on aspirations for higher education. InternationalJournal of Educational Development, 64(December 2018), 48–57.
Genicot, G., & Ray, D. (2017). Aspirations and Inequality. Econometrica, 85(2), 489–519.Genicot, G., & Ray, D. (2020). Aspirations and Economic Behavior. Annual Review of
Economics, 12, 715–746.Gifford, P., & Nogueira-Godsey, T. (2011). The Protestant Ethic and African Pentecostalism :
A Case Study. Journal for the Study of Religion, 24(1), 5–22.Glewwe, P., Ross, P. H., & Wydick, B. (2018). Developing Hope Among Impoverished
Children: Using Child Self-Portraits to Measure Poverty Program Impacts. Journal ofHuman Resources, 53(3), 330–355.
Golan, J., & You, J. (2020). Raising Aspirations of Boys and Girls through Role Models:Evidence from a Field Experiment. Journal of Development Studies, 00(00), 1–31.
Holland, N. E. (2016). Partnering With a Higher Power: Academic Engagement, Religiosity,and Spirituality of African American Urban Youth. Education and Urban Society, 48(4),299–323.
Imbens, G. W., & Wooldridge, J. M. (2009). Recent developments in the econometrics ofprogram evaluation. Journal of Economic Literature, 47(1), 5–86.
Janzen, S. A., Magnan, N. P., Sharma, S., & Thompson, W. M. (2017). Aspirations failure andformation in rural Nepal. Journal of Economic Behavior and Organization, 139, 1–25.
Kirby, B. (2019). Pentecostalism , economics , capitalism : putting the Protestant Ethic towork. Religion, 1151(4), 571–591.
Kosec, K., & Mo, C. H. (2017). Aspirations and the Role of Social Protection: Evidence fromEconomic Shocks in Rural Pakistan. World Development, 97, 49–66.
Kudo, Y. (2017). Missionary Influence on Marriage Practices : Evidence from the LivingstoniaMission. Journal of African Economies, 26(3), 372–431.
La Ferrara, E. (2019). Presidential address: Aspirations, social norms, and development.Journal of the European Economic Association, 17(6), 1687–1722.
16
Lockhart, W. (2003). The Added Value of Religion in Poverty-to-Work Programs: A Frame-work for Analysis. Journal of Markets and Morality, 6(2), 497–524.
Lybbert, T., & Wydick, B. (2018). Poverty, Aspirations, and the Economics of Hope. EconomicDevelopment and Cultural Change, 696968.
Lybbert, T. J., & Wydick, B. (2016). Hope As Aspirations, Agency and Pathways: PovertyDynamics and Microfinance in Oaxaca, Mexico.
Macours, K., & Vakis, R. (2014). Changing households’ investment behaviour through so-cial interactions with local leaders: Evidence from a randomised transfer programme.Economic Journal, 124(576), 607–633.
Malloch, T. R. (2014). Spiritual Capital. In P. Oslington (Ed.), The oxford handbook forchristianity and economics (pp. 462–471). Oxford University Press.
Mariz, C. (1992). Religion and Poverty in Brazil: A Comparison of Catholic and PentecostalCommunities. Sociological Analysis, 53(1992), S63.
Masten, M. A., Poirier, A., & Zhang, L. (2020). Assessing Sensitivity to Unconfoundedness :Estimation and Inference. Unpublished working paper, 1–78.
McClendon, G., & Riedl, R. B. (2015). Religion as a Stimulant of Political Participation:Experimental Evidence from Nairobi, Kenya. The Journal of Politics, 77(4), 1045–1057.
Mckenzie, D., Mohpal, A., & Yang, D. (2021). Aspirations and Financial Decisions : Experi-mental Evidence from the Philippines (No. 9586). Washington DC.
Meier zu Selhausen, F. (2014). Missionaries and female empowerment in colonial Uganda: New evidence from Protestant marriage registers ,. Economic History of DevelopingRegions, 29(1), 74–112.
Murphy, D. M. A., Nourani, V., & Lee, D. R. (2020). Chatting at Church: Information Diffusionthrough Religious Networks. Review of Economics and Statistics(Forthcoming).
Neubert, M. J., Bradley, S. W., Ardianti, R., & Simiyu, E. M. (2017). The Role of Spir-itual Capital in Innovation and Performance : Evidence from Developing Economies.Entrepreneurship Theory and Practice, 41(4), 621–640.
Ngeiywo, T. K. (2018). Effect of Traditional Pokot Worldview on Spread of Christianity amongthe Pokot (Doctoral Thesis). Masinde Muliro University of Science and Technology.
Pasquier-Doumer, L., & Brandon, F. R. (2015). Aspiration Failure: A Poverty Trap for Indige-nous Children in Peru? World Development, 72(July 2013), 208–223.
Ray, D. (2006). Aspirations, poverty, and economic change. In A. V. Banerjee, R. Bénabou, &D. Mookherjee (Eds.), Understanding poverty. Oxford University Press.
Ray, D. (2016). Aspirations and the Development Treadmill. Journal of Human Developmentand Capabilities, 17(3), 309–323.
Riley, E. (2018). Role models in movies: the impact of Queen of Katwe on students’ educa-tional attainment. CSAE Working Paper WPS/2017-13, 44(February 2017).
Ross, P. H., Glewwe, P., Prudencio, D., & Wydick, B. (2021). Developing educational andvocational aspirations through international child sponsorship: Evidence from Kenya,Indonesia, and Mexico. World Development, 140, 105336.
Serneels, P., & Dercon, S. (2021). Aspirations, Poverty, and Education. Evidence from India.Journal of Development Studies, 57(1), 163–183.
Strhan, A. (2017). ’ I Want There to Be No Glass Ceiling :’ Evangelicals ’ Engagements withClass , Education , and Urban Childhoods. Sociological Research Online, 22(1), 14.
Suarez, D. C., & Cameron, L. (2020). Conditional cash transfers: Do they result in more patientchoices and increased educational aspirations? Economic Development and CulturalChange, 68(3), 729–761.
17
Valdes, R. I. R., Wydick, B., & Lybbert, T. J. (2020). Can Hope Elevate Microfinance?Evidence from Oaxaca, Mexico. Oxford Economic Papers, Forthcomin.
Weber, M. (2001). The Protestant Ethic and the Spirit of Capitalism (Second ed.). London andNew York: Routledge.
Whetten, J., Fontenla, M., & Villa, K. (2019). Opportunities for higher education: the ten-yeareffects of conditional cash transfers on upper-secondary and tertiary enrollments. OxfordDevelopment Studies, 47(2), 222–237.
Widlund, A., Tuominen, H., Tapola, A., & Korhonen, J. (2020). Gendered pathways from aca-demic performance, motivational beliefs, and school burnout to adolescents’ educationaland occupational aspirations. Learning and Instruction, 66(December 2019), 101299.
Wuepper, D., & Lybbert, T. J. (2017). Perceived Self-Efficacy , Poverty , and EconomicDevelopment. Annual Review of Economics, 11(May), 1–22.
Wydick, B., Dowd, R., & Lybbert, T. J. (2020). Hope and Human Dignity: Exploring Re-ligious Belief, Hope, and Transition out of Poverty in Oaxaca, Mexico. In P. Carozza& C. Sedmak (Eds.), The practice of human development and dignity (chap. 8). NotreDame Press.
Wydick, B., Glewwe, P., & Rutledge, L. (2013). Does international child sponsorship work?A six-country study of impacts on adult life outcomes. Journal of Political Economy,121(2), 393–436.
Wydick, B., Glewwe, P., & Rutledge, L. (2017). Does child sponsorship pay off in adulthood?An international study of impacts on income and wealth. World Bank Economic Review,31(2), 434–458.
Yuen, C. Y., & Leung, C. S. S. (2019). Belonging and connectedness: identity, religiosity andaspiration of immigrant Muslim youth in Hong Kong. Asia Pacific Journal of Education,39(4), 423–435.
Zou, W., Lybbert, T., Vosti, S., & Abbeddou, S. (2020). Early Childhood Nutrition, ParentalGrowth Perceptions and Educational Aspirations in Rural Burkina Faso. Journal of De-velopment Studies, 56(4), 798–816.
18
Supplementary Material
Table A1: Balancing diagnostics for membership in religious institutions
Standardized differences Variance ratioVariables Raw Weighted Raw WeightedAgea (years) -0.198 0.034 0.778 0.956Years of education 0.347 -0.009 0.608 1.015Head is male (1=yes) -0.127 0.016 1.166 0.980Household size 0.131 -0.037 0.820 0.824Life satisfaction -0.433 0.019 0.757 1.023Number of dependents 0.051 -0.100 0.864 0.835Access to electricity (1=yes) 0.175 -0.006 1.090 0.997Cooperative membership (1=yes) -0.058 0.012 0.933 1.015Savings account (1=yes) 0.400 0.005 1.469 1.003Farm size 0.070 0.036 0.648 0.771Has a male child 0.066 -0.037 0.978 1.012Has a female child 0.102 -0.019 0.985 1.003Willingness to invest in agriculture (1=yes) -0.214 0.057 0.754 1.094Livestock ownership (TLU) -0.069 -0.005 0.662 1.194Household income (Ksh) -0.074 0.032 0.414 0.914Off farm income (Ksh) -0.149 -0.001 0.535 1.643Asset value (Ksh) -0.024 0.020 0.190 0.406Monogamous household (1=yes) -0.222 0.033 0.877 0.978Polygamous household (1=yes) -0.222 0.030 0.622 1.074
Notes: The variables represented here are those used for weighting. Standardized differences are differences meansfor non-members and members of RIs after the means have been scaled by the average of the group variance. Thevariance ratio is the ratio of the variance of the non-members of RIs over the variance of the members of RIs. Rawrefers to unmatched data while weighted refers to data that has been weighted.
19
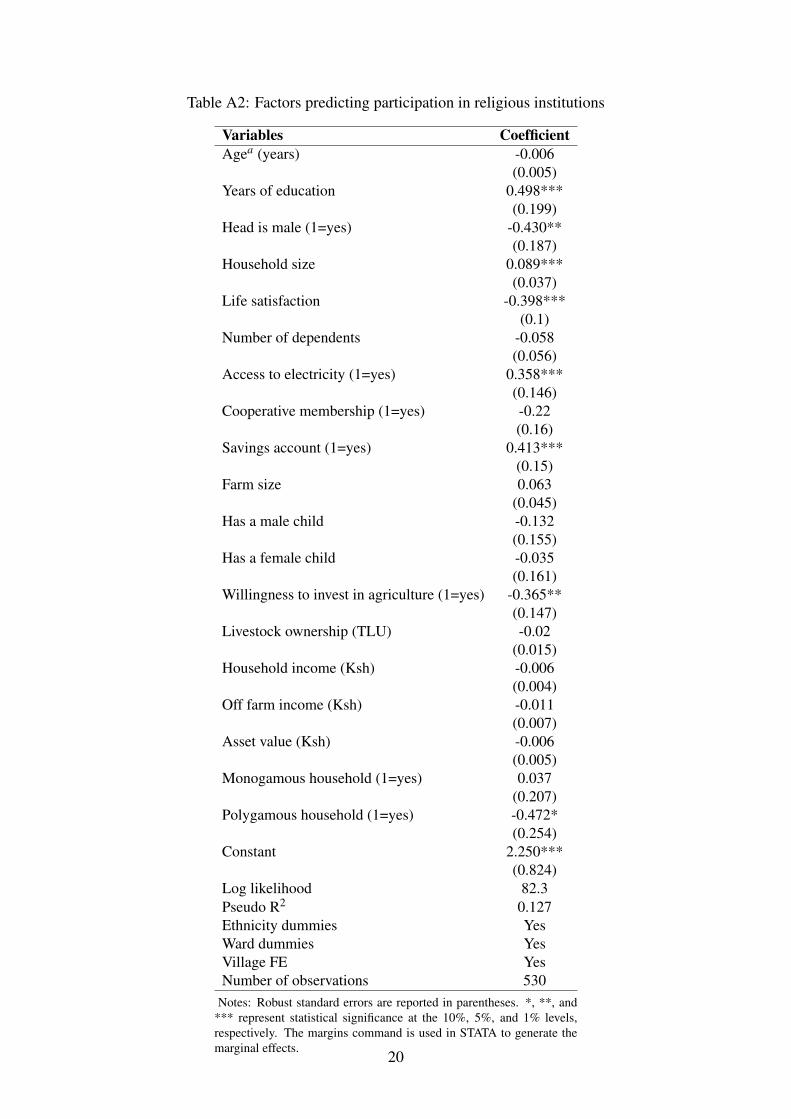
Table A2: Factors predicting participation in religious institutions
Variables CoefficientAgea (years) -0.006
(0.005)Years of education 0.498***
(0.199)Head is male (1=yes) -0.430**
(0.187)Household size 0.089***
(0.037)Life satisfaction -0.398***
(0.1)Number of dependents -0.058
(0.056)Access to electricity (1=yes) 0.358***
(0.146)Cooperative membership (1=yes) -0.22
(0.16)Savings account (1=yes) 0.413***
(0.15)Farm size 0.063
(0.045)Has a male child -0.132
(0.155)Has a female child -0.035
(0.161)Willingness to invest in agriculture (1=yes) -0.365**
(0.147)Livestock ownership (TLU) -0.02
(0.015)Household income (Ksh) -0.006
(0.004)Off farm income (Ksh) -0.011
(0.007)Asset value (Ksh) -0.006
(0.005)Monogamous household (1=yes) 0.037
(0.207)Polygamous household (1=yes) -0.472*
(0.254)Constant 2.250***
(0.824)Log likelihood 82.3Pseudo R2 0.127Ethnicity dummies YesWard dummies YesVillage FE YesNumber of observations 530
Notes: Robust standard errors are reported in parentheses. *, **, and*** represent statistical significance at the 10%, 5%, and 1% levels,respectively. The margins command is used in STATA to generate themarginal effects.
20
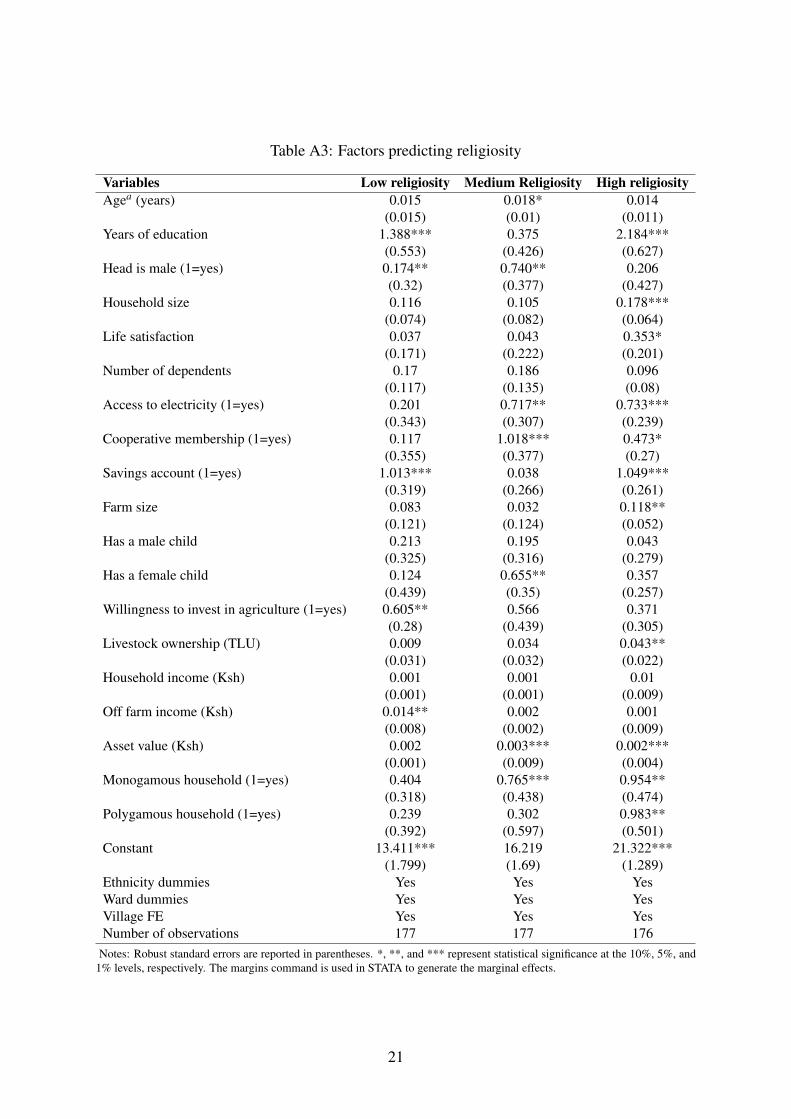
Table A3: Factors predicting religiosity
Variables Low religiosity Medium Religiosity High religiosityAgea (years) 0.015 0.018* 0.014
(0.015) (0.01) (0.011)Years of education 1.388*** 0.375 2.184***
(0.553) (0.426) (0.627)Head is male (1=yes) 0.174** 0.740** 0.206
(0.32) (0.377) (0.427)Household size 0.116 0.105 0.178***
(0.074) (0.082) (0.064)Life satisfaction 0.037 0.043 0.353*
(0.171) (0.222) (0.201)Number of dependents 0.17 0.186 0.096
(0.117) (0.135) (0.08)Access to electricity (1=yes) 0.201 0.717** 0.733***
(0.343) (0.307) (0.239)Cooperative membership (1=yes) 0.117 1.018*** 0.473*
(0.355) (0.377) (0.27)Savings account (1=yes) 1.013*** 0.038 1.049***
(0.319) (0.266) (0.261)Farm size 0.083 0.032 0.118**
(0.121) (0.124) (0.052)Has a male child 0.213 0.195 0.043
(0.325) (0.316) (0.279)Has a female child 0.124 0.655** 0.357
(0.439) (0.35) (0.257)Willingness to invest in agriculture (1=yes) 0.605** 0.566 0.371
(0.28) (0.439) (0.305)Livestock ownership (TLU) 0.009 0.034 0.043**
(0.031) (0.032) (0.022)Household income (Ksh) 0.001 0.001 0.01
(0.001) (0.001) (0.009)Off farm income (Ksh) 0.014** 0.002 0.001
(0.008) (0.002) (0.009)Asset value (Ksh) 0.002 0.003*** 0.002***
(0.001) (0.009) (0.004)Monogamous household (1=yes) 0.404 0.765*** 0.954**
(0.318) (0.438) (0.474)Polygamous household (1=yes) 0.239 0.302 0.983**
(0.392) (0.597) (0.501)Constant 13.411*** 16.219 21.322***
(1.799) (1.69) (1.289)Ethnicity dummies Yes Yes YesWard dummies Yes Yes YesVillage FE Yes Yes YesNumber of observations 177 177 176
Notes: Robust standard errors are reported in parentheses. *, **, and *** represent statistical significance at the 10%, 5%, and1% levels, respectively. The margins command is used in STATA to generate the marginal effects.
21
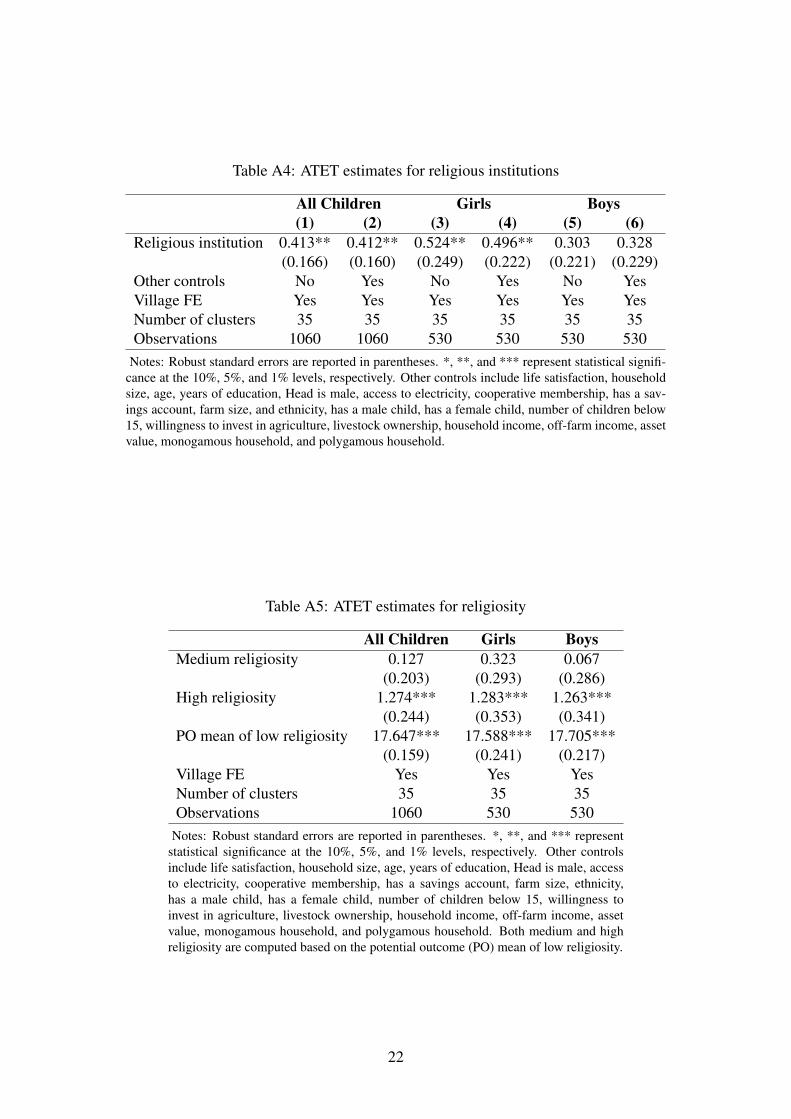
Table A4: ATET estimates for religious institutions
All Children Girls Boys(1) (2) (3) (4) (5) (6)
Religious institution 0.413** 0.412** 0.524** 0.496** 0.303 0.328(0.166) (0.160) (0.249) (0.222) (0.221) (0.229)
Other controls No Yes No Yes No YesVillage FE Yes Yes Yes Yes Yes YesNumber of clusters 35 35 35 35 35 35Observations 1060 1060 530 530 530 530
Notes: Robust standard errors are reported in parentheses. *, **, and *** represent statistical signifi-cance at the 10%, 5%, and 1% levels, respectively. Other controls include life satisfaction, householdsize, age, years of education, Head is male, access to electricity, cooperative membership, has a sav-ings account, farm size, and ethnicity, has a male child, has a female child, number of children below15, willingness to invest in agriculture, livestock ownership, household income, off-farm income, assetvalue, monogamous household, and polygamous household.
Table A5: ATET estimates for religiosity
All Children Girls BoysMedium religiosity 0.127 0.323 0.067
(0.203) (0.293) (0.286)High religiosity 1.274*** 1.283*** 1.263***
(0.244) (0.353) (0.341)PO mean of low religiosity 17.647*** 17.588*** 17.705***
(0.159) (0.241) (0.217)Village FE Yes Yes YesNumber of clusters 35 35 35Observations 1060 530 530
Notes: Robust standard errors are reported in parentheses. *, **, and *** representstatistical significance at the 10%, 5%, and 1% levels, respectively. Other controlsinclude life satisfaction, household size, age, years of education, Head is male, accessto electricity, cooperative membership, has a savings account, farm size, ethnicity,has a male child, has a female child, number of children below 15, willingness toinvest in agriculture, livestock ownership, household income, off-farm income, assetvalue, monogamous household, and polygamous household. Both medium and highreligiosity are computed based on the potential outcome (PO) mean of low religiosity.
22
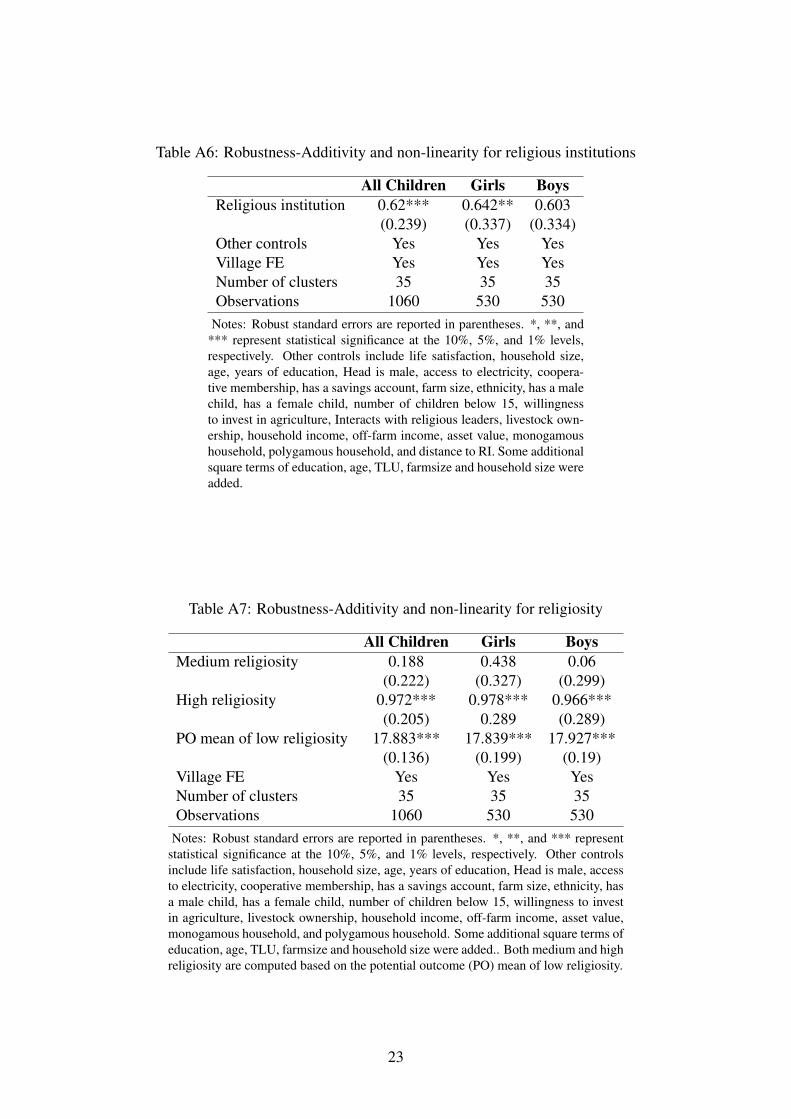
Table A6: Robustness-Additivity and non-linearity for religious institutions
All Children Girls BoysReligious institution 0.62*** 0.642** 0.603
(0.239) (0.337) (0.334)Other controls Yes Yes YesVillage FE Yes Yes YesNumber of clusters 35 35 35Observations 1060 530 530
Notes: Robust standard errors are reported in parentheses. *, **, and*** represent statistical significance at the 10%, 5%, and 1% levels,respectively. Other controls include life satisfaction, household size,age, years of education, Head is male, access to electricity, coopera-tive membership, has a savings account, farm size, ethnicity, has a malechild, has a female child, number of children below 15, willingnessto invest in agriculture, Interacts with religious leaders, livestock own-ership, household income, off-farm income, asset value, monogamoushousehold, polygamous household, and distance to RI. Some additionalsquare terms of education, age, TLU, farmsize and household size wereadded.
Table A7: Robustness-Additivity and non-linearity for religiosity
All Children Girls BoysMedium religiosity 0.188 0.438 0.06
(0.222) (0.327) (0.299)High religiosity 0.972*** 0.978*** 0.966***
(0.205) 0.289 (0.289)PO mean of low religiosity 17.883*** 17.839*** 17.927***
(0.136) (0.199) (0.19)Village FE Yes Yes YesNumber of clusters 35 35 35Observations 1060 530 530
Notes: Robust standard errors are reported in parentheses. *, **, and *** representstatistical significance at the 10%, 5%, and 1% levels, respectively. Other controlsinclude life satisfaction, household size, age, years of education, Head is male, accessto electricity, cooperative membership, has a savings account, farm size, ethnicity, hasa male child, has a female child, number of children below 15, willingness to investin agriculture, livestock ownership, household income, off-farm income, asset value,monogamous household, and polygamous household. Some additional square terms ofeducation, age, TLU, farmsize and household size were added.. Both medium and highreligiosity are computed based on the potential outcome (PO) mean of low religiosity.
23

Table A8: AIPW Estimates for religious institution
All Children Girls Boys(1) (2) (3) (4) (5) (6)
Religious institution 0.379** 0.344** 0.513** 0.466** 0.241 0.223(0.166) (0.152) (0.248) (0.210) (0.223) (0.216)
Other controls No Yes No Yes No YesVillage FE Yes Yes Yes Yes Yes YesNumber of clusters 35 35 35 35 35 35Observations 1060 1060 530 530 530 530
Notes: Robust standard errors are reported in parentheses. *, **, and *** represent statistical signifi-cance at the 10%, 5%, and 1% levels, respectively. Other controls include life satisfaction, householdsize, age, years of education, Head is male, access to electricity, cooperative membership, has a savingsaccount, farm size, ethnicity, has a male child, has a female child, number of children below 15, will-ingness to invest in agriculture, livestock ownership, household income, off-farm income, asset value,monogamous household, and polygamous household.
Table A9: AIPW estimates for religiosity
All Children Girls BoysMedium religiosity 0.259 0.515 0.003
(0.214) (0.312) (0.286)High religiosity 1.021*** 1.035*** 1.007***
(0.201) (0.285) (0.283)PO mean of low religiosity 17.819*** 17.765*** 17.872***
(0.133) (0.196) (0.217)Village FE Yes Yes YesNumber of clusters 35 35 35Observations 1060 530 530
Notes: Robust standard errors are reported in parentheses. *, **, and *** representstatistical significance at the 10%, 5%, and 1% levels, respectively. Other controlsinclude life satisfaction, household size, age, years of education, Head is male, accessto electricity, cooperative membership, has a savings account, farm size, ethnicity,has a male child, has a female child, number of children below 15, willingness toinvest in agriculture, livestock ownership, household income, off-farm income, assetvalue, monogamous household, and polygamous household. Both medium and highreligiosity are computed based on the potential outcome (PO) mean of low religiosity.
24
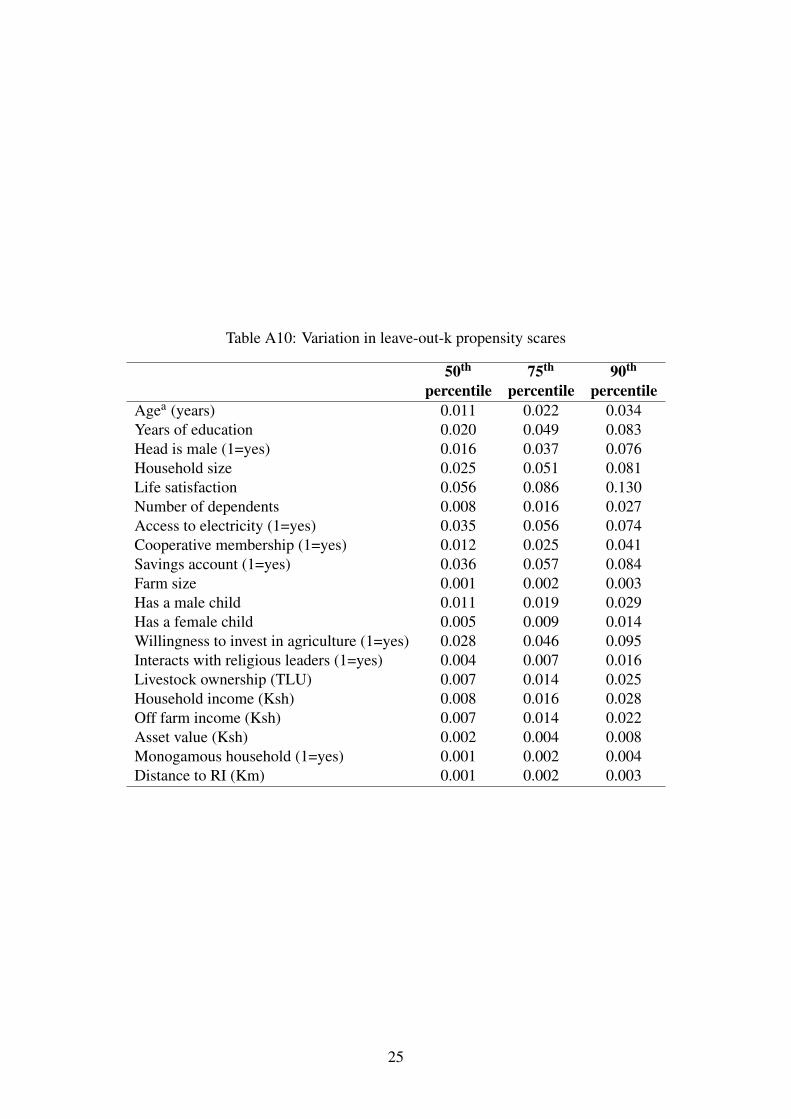
Table A10: Variation in leave-out-k propensity scares
50th
percentile75th
percentile90th
percentileAgea (years) 0.011 0.022 0.034Years of education 0.020 0.049 0.083Head is male (1=yes) 0.016 0.037 0.076Household size 0.025 0.051 0.081Life satisfaction 0.056 0.086 0.130Number of dependents 0.008 0.016 0.027Access to electricity (1=yes) 0.035 0.056 0.074Cooperative membership (1=yes) 0.012 0.025 0.041Savings account (1=yes) 0.036 0.057 0.084Farm size 0.001 0.002 0.003Has a male child 0.011 0.019 0.029Has a female child 0.005 0.009 0.014Willingness to invest in agriculture (1=yes) 0.028 0.046 0.095Interacts with religious leaders (1=yes) 0.004 0.007 0.016Livestock ownership (TLU) 0.007 0.014 0.025Household income (Ksh) 0.008 0.016 0.028Off farm income (Ksh) 0.007 0.014 0.022Asset value (Ksh) 0.002 0.004 0.008Monogamous household (1=yes) 0.001 0.002 0.004Distance to RI (Km) 0.001 0.002 0.003
25
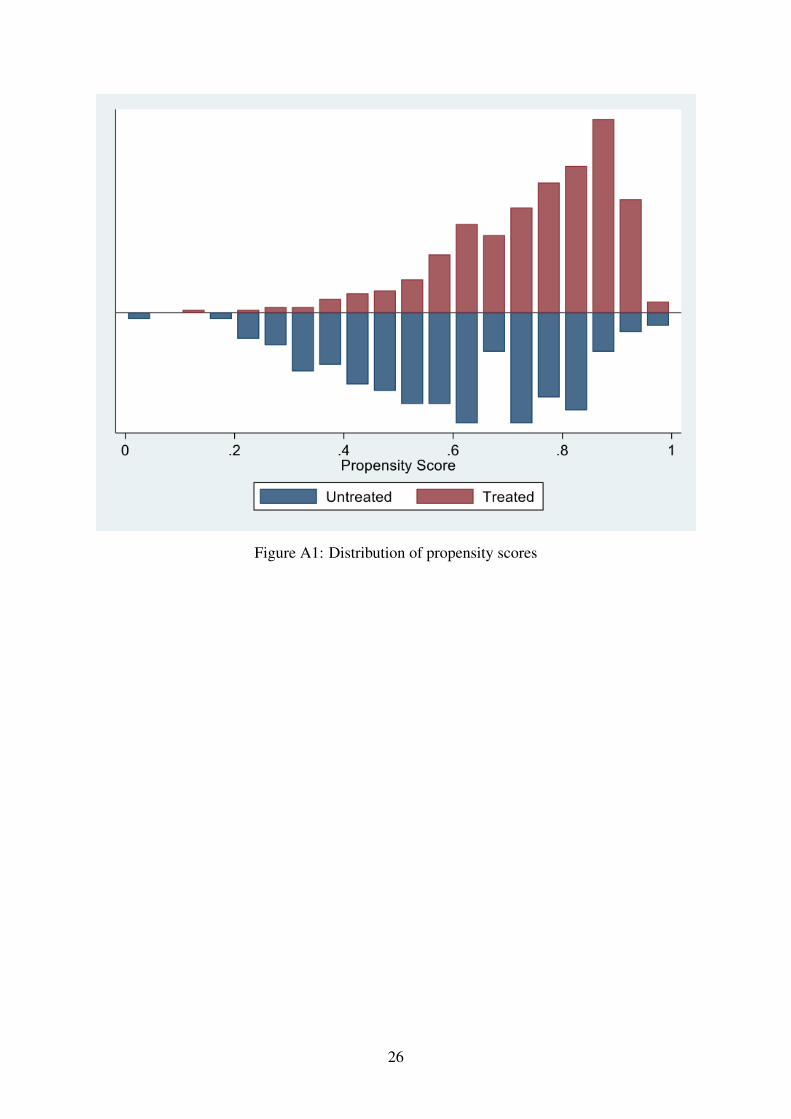
Figure A1: Distribution of propensity scores
26
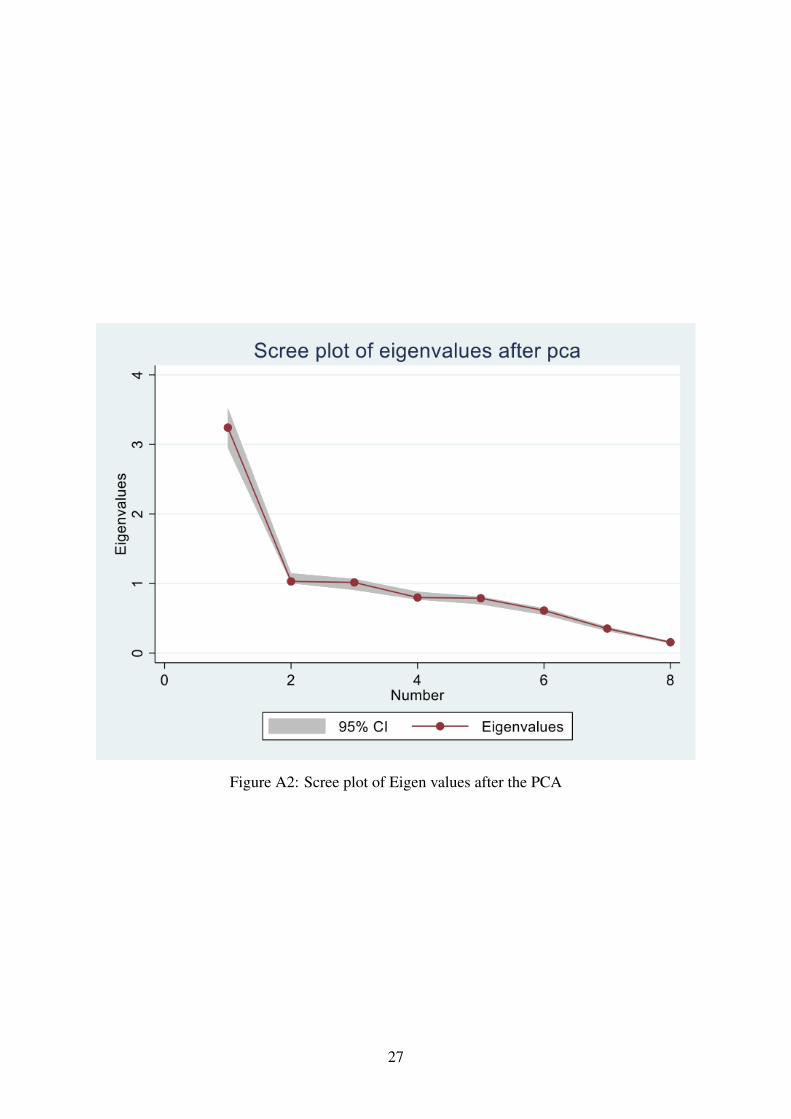
Figure A2: Scree plot of Eigen values after the PCA
27
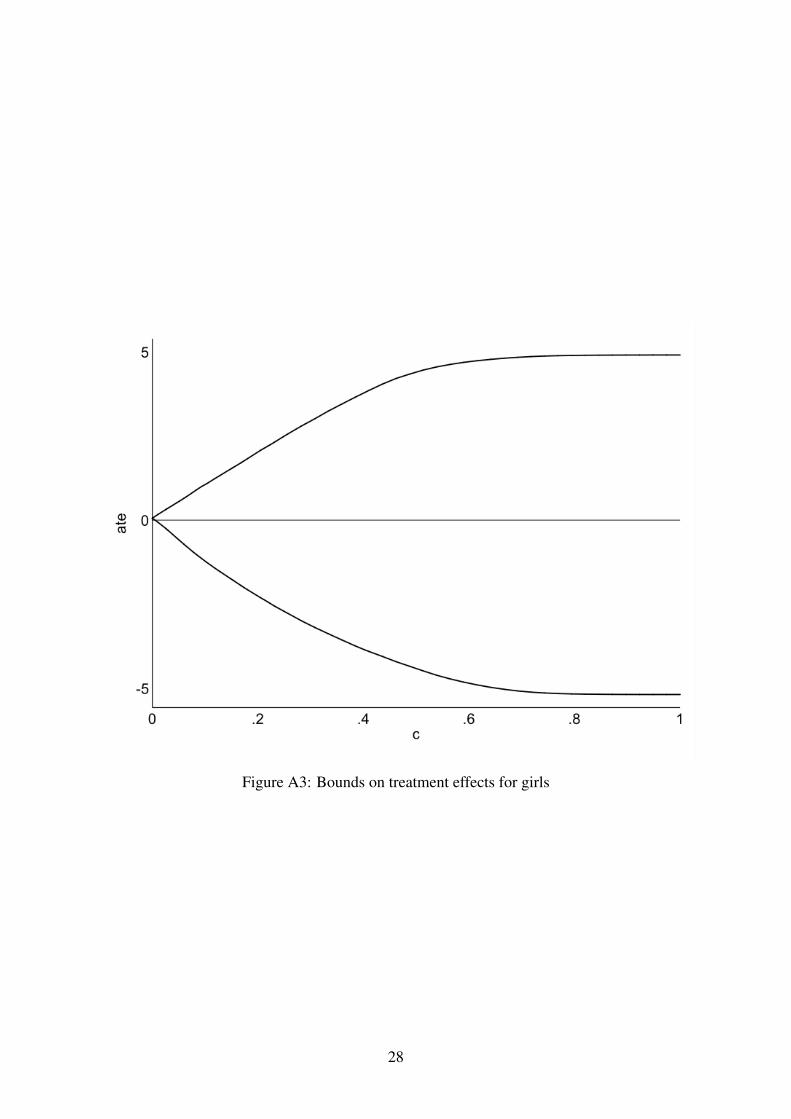
Figure A3: Bounds on treatment effects for girls
28
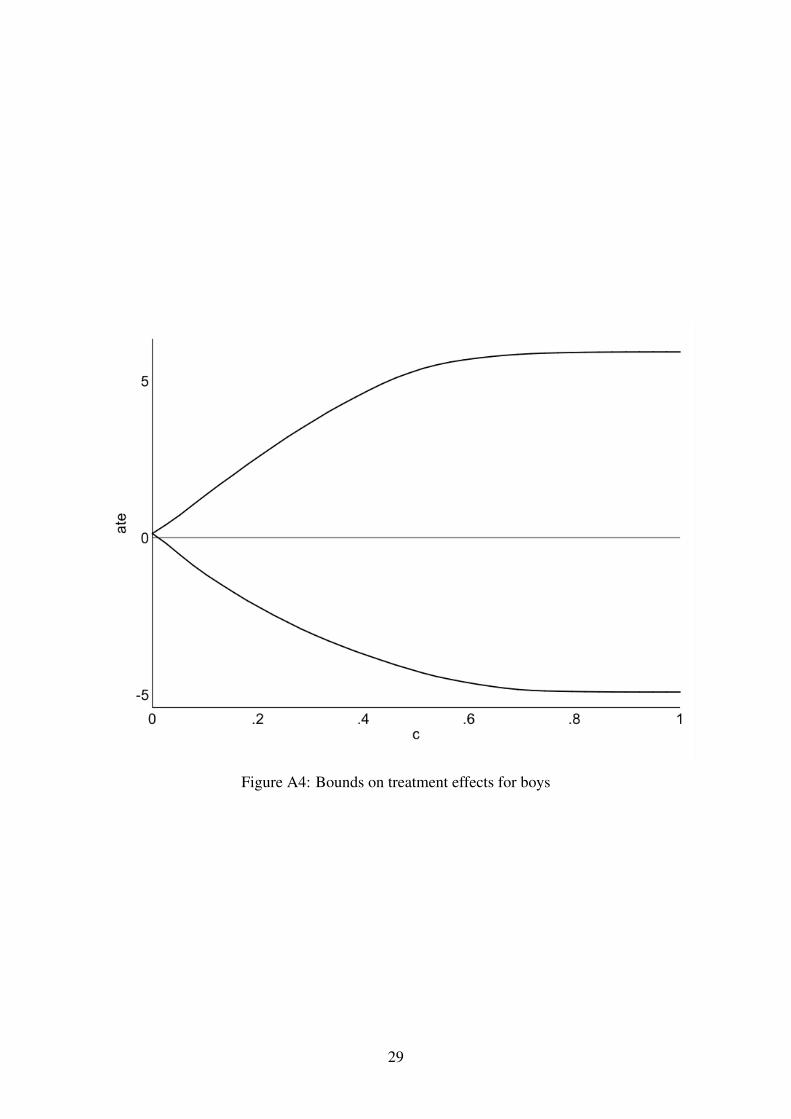
Figure A4: Bounds on treatment effects for boys
29