Embed Size (px)
Citation preview
Religion and Health in Early Childhood:
Evidence from the Indian Subcontinent
Elizabeth Brainerd
Nidhiya Menon
Version: January 4, 2015
Abstract: This paper studies early childhood health in India, Bangladesh and Nepal, focusing on
inequalities in anthropometric outcomes by religious adherence. India and Nepal have Hindu
majorities, while Bangladesh is predominantly Muslim. The results indicate that Muslim infants
have an advantage over Hindu infants in height-for-age in India (for boys and girls) and in
Bangladesh (for boys). However this advantage disappears beyond 12 months of age, at which
point Hindu children in all three countries are found to have significantly better anthropometric
outcomes than Muslim children. We report tests that rule out mortality selection and undertake
falsification and robustness exercises that confirm these findings. Further results suggest that
exposure to Ramadan fasting in utero may lead to positive selection of Muslim male infants,
partially explaining the Muslim infant health advantage, but this does not fully explain the shift
from Muslim advantage in infancy to Hindu advantage in childhood across all three countries.
J.E.L. Classification Codes: O12, I12, Z12
Key words: Child Health, Religion, Hindu, Muslim, India, Bangladesh, Nepal
Thanks to participants at the “Child Health in Developing Countries” session at AEA 2013, especially
Andrew Foster, Sonia Bhalotra and our discussant, Chih-Ming Tan. Thanks to seminar participants at
Boston College, Clark, Northeastern, Rutgers, and the University of Connecticut. We are grateful to
Bhaskar Mazumder for sharing the Ramadan calendar observance dates, and express our thanks to Albert
Park, Grace Lordan and Abhijeet Singh for assistance with the Young Lives data for Andhra Pradesh,
India. We thank Alessandro Tarozzi for assistance with the Health Survey for England data set and,
along with Monica Dasgupta, for providing valuable comments on an earlier draft of this paper. Abdullah
Al Mahmud Shawon provided excellent research assistance with the Bangladesh data. The usual
disclaimer applies. Address for correspondence: Elizabeth Brainerd, Susan and Barton Winokur
Professor in Economics and Women’s and Gender Studies, Department of Economics, MS 021, Brandeis
University, Waltham, MA 02454. Tel.781.736.4816. Email: [email protected]. Nidhiya Menon,
Associate Professor of Economics, Department of Economics, MS 021, Brandeis University, Waltham,
MA 02454. Tel. 781.736.2230. Email: [email protected].
1
I. Introduction
Children in the Indian subcontinent are among the most undernourished in the world. In
Bangladesh and Nepal, for example, over half of the children under five years of age suffer from
chronic malnutrition. In India, nearly 48 percent of all children were stunted in 2007 according
to World Bank data.1 The rates of stunting and undernourishment (low weight-for-age) in all
three countries are higher than in many countries of sub-Saharan Africa with lower levels of per
capita income and higher rates of infant and child mortality (Deaton and Dreze 2009;
Jayachandran and Pande 2014). There is some evidence, albeit inconsistent, that this trend has
continued during the 1990s and early 2000s, a period of time when both India and Bangladesh
experienced significant economic growth and made rapid progress in reducing poverty. Even
among affluent Indian households, a substantial proportion of children are undernourished by
most anthropometric indicators (Deaton and Dreze 2009).
This paper investigates the puzzle of child undernourishment in India, Bangladesh and
Nepal by comparing differences in child health outcomes by religious affiliation. As discussed
below, the religious affiliation of a child's family provides information on the likely dietary
restrictions encountered by a child in his or her early growing years, on the child's exposure to
fasting in utero during the Muslim holy month of Ramadan, and on possible differences in
women's autonomy and control over household resources arising from differences in son
preference across religions. All of these are factors that may contribute to the high rate of
stunting and wasting among the children in these countries. Since one is born into one’s
1 This is the share of children under age 5 whose height-for-age z-scores are at least 2 standard deviations
below the mean for the reference population. Source: World Development Indicators, accessed Nov. 29,
2012.
2
religious identity and marriage is restricted to one’s caste and faith in these regions,2 these three
countries provide an especially pertinent context in which to analyze the causes of inequality in
child health status by religious identity.
We focus on children from birth to five years of age. The health of children at these
young ages is critically important, as a wealth of recent evidence demonstrates that negative
health shocks in this period can have large, long-lasting effects extending well into adulthood
(Currie and Vogl 2013). While most of this literature has focused on children in the developed
world, children in developing countries are likely to be even more vulnerable given the
prevalence of insults to health (nutritional, environmental and toxic) and widespread adherence
to behavior that may have harmful effects on children's health, such as fasting during pregnancy.
Negative health shocks to children in developing countries have only recently begun to receive
attention in the economics literature (Jayachandran 2009; Maccini and Yang 2009; Almond and
Mazumder 2011; Currie and Vogl 2013; Brainerd and Menon 2014).
This paper uses a number of datasets to assess inequalities in child health by religion.
Our main analysis uses several recent rounds of the Demographic and Health Surveys (DHS) for
India, Bangladesh and Nepal to examine differences in child anthropometric measures by
religion, age and gender within each country. The DHS surveys provide a rich source of data on
child, mother, and father characteristics, including detailed fertility histories of women aged 15
to 49. The period we analyze is approximately 1999–2011 (depending on the country), a time
span in which all three countries experienced strong economic growth and declining poverty
rates. Our results indicate that Muslim infants (age less than 12 months) have a significant
advantage in height-for-age and weight-for-age z-scores over Hindu infants in India, as well as in
2 There has been some rise in interfaith marriages in India, but this is localized to the upper-class
socioeconomic group.
3
Bangladesh for male infants (for height-for-age) and for female infants (for weight-for-age).
This advantage does not persist past infancy, however: the Muslim advantage is reversed in
children age one to five years, and Hindu children are significantly taller and heavier than
Muslim children in all three countries at these ages. Falsification checks and robustness tests
confirm these patterns, as do two additional data sets for South Asian children described in
greater detail below. These data sets allow us to rule out mortality selection as a cause of the
reversal, and further suggest that the early Muslim advantage is likely to be cultural – and
possibly linked to religious practices – rather than country-specific.
While a Muslim advantage in child survival in India is well-known (Bhalotra et al. 2010),
the pattern of Muslim advantage in infancy, its reversal after 12 months to a Muslim
disadvantage, and its consistency across these three countries has (to the best of our knowledge)
not been previously documented. As we demonstrate below, the reversal in Muslim health
advantage is not explained by static differences in family background or living conditions
between Muslim and Hindu children (such as mother’s education, mother’s height, age at
marriage, access to sanitary facilities, or household assets), nor is it explained by differences in
child characteristics such as birth order, breastfeeding, prenatal care, or disease incidence. The
Muslim advantage in height for male infants is especially surprising for India, in which the
preferential treatment of boys (thought to be greater among Hindus) begins even in utero
(Bharadwaj and Lakdawal 2012) and extends after-birth to lengthier breastfeeding and greater
vitamin supplementation (Jayachandran and Kuziembo 2011; Barcellos et al. 2014). We test for
possible explanations for the reversal of the Muslim health advantage and find that for boys in
India, the most likely explanation is the observance of fasting during Ramadan by Muslim
women, which appears to lead to positive selection of male infants in India but still has long-
4
lasting negative health effects on all surviving children. However this does not explain the
patterns among girls, nor does it explain the reversal of the health advantage for Muslim infants
in Bangladesh. In this sense, the Muslim health advantage in infancy and its later reversal in
these three countries remain a puzzle.
II. Background and related literature
The three countries we study in this paper were selected because they share many
features -- historical, economic as well as social. In addition to being neighbors geographically,
the basic stock of people on the Indian subcontinent is composed of two genetically diverse
populations with different autosomal markers that assimilated approximately three to six
thousand years ago (from 1200 to 3500 BC as per Reich et al. 2009). Further, the Muslim
conquests of parts of the northern Indian subcontinent (parts of North India and modern day
Pakistan and Bangladesh) from the thirteenth to the sixteenth centuries mostly resulted in
conversion of the original inhabitants to Islam, rather than the settlement of a separate
heterogeneous population (Durant and Durant 1935). Hence today’s Muslims in India, Pakistan,
Nepal and Bangladesh originated from a similar genetic make-up to Hindus in the region,
indicating that documented dissimilarities in child health outcomes among these religious groups
are most probably due to behavior and not genetic composition.3
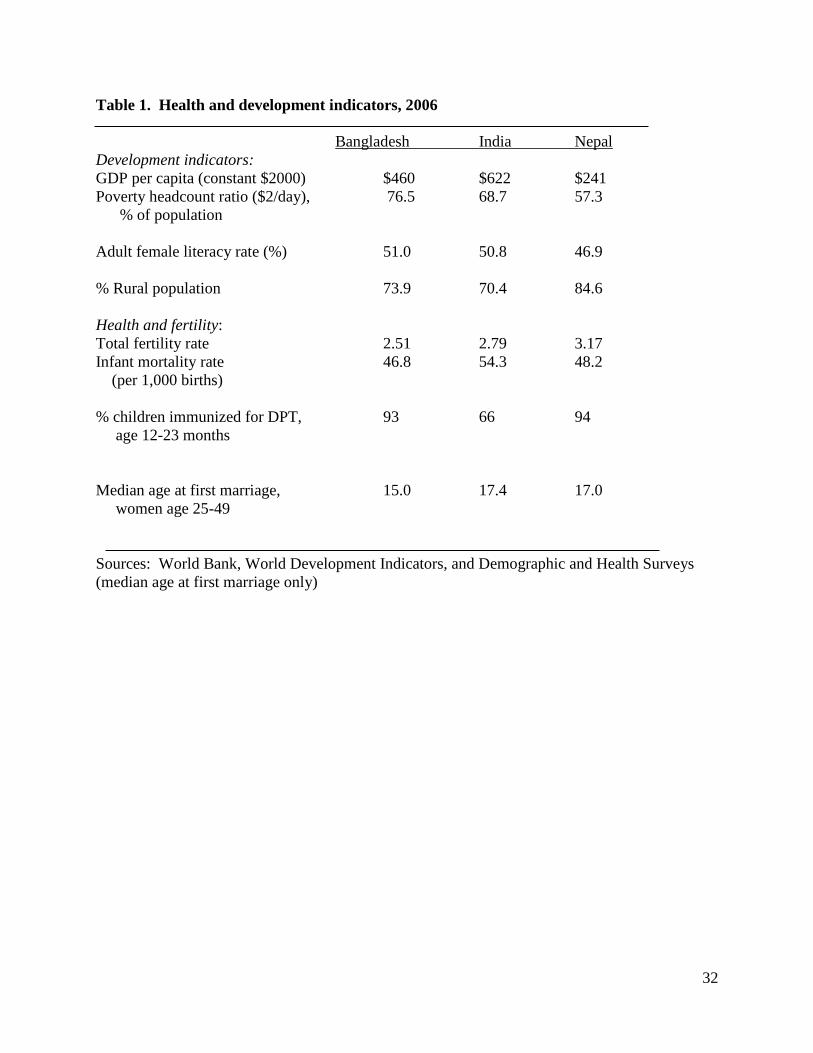
In addition to the same historical antecedents, the three countries are similar along several
socio-economic and cultural dimensions. Some of these similarities are illustrated in Table 1:
despite recent growth, the three countries remain poor with GDP per capita ranging from $241 in
Nepal to $622 in India in 2006, and high poverty rates in the range of 57 to 77 percent of the
3 It is possible that culture itself is part of biology as in the broad gene-culture discussion espoused in
Richerson and Boyd (2005) which notes that aspects such as lactose-intolerance may have developed as
early as six thousand years ago. However, we have no empirical evidence that indicates that such
intolerance differentially affects very young Hindu and Muslim children in these countries.
5
population. Only half of the adult female population in the region is literate and populations are
largely rural, ranging from 74 percent of the population in India to 85 percent in Nepal. The total
fertility rates and infant mortality rates are similar across countries, as is the median age at first
marriage for women (15 to 17 years). India and Bangladesh were part of the same country until
1947, when partition of India divided the country along religious lines (Bangladesh was referred
to as “East Pakistan” from 1947 to 1971; it gained independence in 1971).4
Religion plays a central role in the lives of much of the population in the region. The two
main religious communities in these countries are Hindus and Muslims; India and Nepal have
Hindu majorities whereas Bangladesh has a Muslim majority.5 Religious practices differ in a
number of ways between Muslims and Hindus: in addition to the strict adherence to a vegetarian
diet practiced by the majority of upper-caste Hindus, Muslims do not consume pork and fast
during daylight hours in the holy month of Ramadan (including pregnant Muslim women). In
addition, Muslims are not allowed to consume alcohol of any kind. Moreover, it is widely
acknowledged that there are significant differences in women’s education and health status,
practices involving personal health and hygiene, and access to medical care and diet among
Hindus and Muslims. In particular, while Muslim women tend to be taller, they are less
educated, marry at a younger age, are less likely to work and less likely to seek prenatal or
antenatal care from a doctor compared to Hindu women (in our DHS data). Differences in
seeking medical care by religion may filter through to child outcomes as Muslim children are
more likely to have had diarrhea or a fever in the last two weeks compared to Hindu children.
4 We would have liked to use data from Pakistan as well. However, religious adherence is not included in
the DHS questionnaires for Pakistan. 5 Restricting the sample to only Hindus and Muslims, 82 percent of households in India and 95 percent of
households in Nepal in the DHS surveys are Hindu, followed by 18 percent and 5 percent Muslim,
respectively. In Bangladesh, about 91 percent of households are Muslim versus 9 percent Hindu.
6
There is clear evidence that maternal nutrition linked to religious practices affects the
health outcomes of infants and children. In particular, two recent papers demonstrate that fasting
during Ramadan by pregnant Muslim women is linked with worse health outcomes on a variety
of measures for individuals who were in utero during Ramadan: birth weights are lower and the
proportion of male births is lower (Almond and Mazumder 2011), and long-term health
outcomes are also affected, with adults who were in utero during Ramadan having a higher
incidence of symptoms associated with chronic diseases such as type 2 diabetes and coronary
heart disease (van Ewijk 2011). This is consistent with the large body of evidence surveyed in
Almond and Currie (2010) demonstrating the long-term effects of negative health shocks to
infants and young children in developed countries. Further, Bhalotra et al. (2010) demonstrate
that within India, Muslim children have a significantly higher probability of survival in infancy
than do Hindu children, despite their lower socioeconomic status (the reversal in child health
outcomes beyond infancy is not addressed in this paper). Beyond these three papers, however,
few papers have investigated the impact of religion-based practices on child health.
Religious beliefs may also affect child health through their impact on female
empowerment and autonomy within the household. Among Hindus, for example, male children
are favored relative to female children as they are a source of old-age support and for a variety of
other socio-cultural reasons. Son preference translates directly into more attentive care
(immunizations, breastfeeding) and better health outcomes for male children relative to female
children (Barcellos et al., 2014), but may also reduce the status of women in the family and
society more generally. Some analysts argue (Menon 2012), in fact, that the underlying cause of
child undernutrition in South Asia is the relatively low status of women in the region. Women's
empowerment affects child nutrition both directly and indirectly: young age at marriage, for
7
example, directly affects child health because adolescent births have a high risk of poor infant
health outcomes; in addition young age at marriage may indicate low status of the woman within
the household. Low female autonomy and decision-making power can reduce resources directed
toward children within the household and thereby worsen child outcomes. We control for the
woman's age at first marriage, age at birth, and literacy as proxies for female empowerment and
child access to resources. Although these factors do appear to contribute to low height-for-age
and weight-for-age z-scores among children, they do not explain the changes in child health
outcomes by religious adherence that we observe.
III. Methodology
We use linear regression models to investigate the impact of religion on children’s
anthropometric outcomes. Our basic empirical specification takes the following form:
𝐻𝑖𝑗𝑡 = 𝛽0 + 𝛽1𝐻𝑖𝑛𝑑𝑢𝑖𝑗𝑡 + 𝛽2𝑋𝑖𝑗𝑡𝑐 + 𝛽3𝑋𝑖𝑗𝑡
𝑤 + 𝛽4𝑋𝑖𝑗𝑡ℎ + 𝛽5𝑋𝑖𝑗𝑡
𝐻𝐻 + 𝛽6𝑋𝑗𝑡
𝛽7𝑀 + 𝛽8𝑇𝑏 + 𝛽9𝑇 + 𝛽10𝑆𝑗 + 𝛽11(𝑇 𝑥 𝑆𝑗) + 𝜀𝑖𝑗𝑡 (1)
where 𝐻𝑖𝑗𝑡 denotes a health outcome (discussed below) for child i in state (or region) j in year t,
𝐻𝑖𝑛𝑑𝑢𝑖𝑗𝑡 is a dummy variable for the religious affiliation of the child’s household, 𝑋𝑖𝑗𝑡𝑐 are child-
specific indicators (order of birth, gender, whether child was nursed, whether child had diarrhea,
fever or cough in the previous two weeks), 𝑋𝑖𝑗𝑡𝑤 are woman (mother)-specific indicators
(measures of maternal risk factors such as tobacco use in India and Nepal, education and work
characteristics, prenatal or antenatal check-ups with a doctor, and mother’s demographic
characteristics including age at birth, age at first marriage, and general health as measured by
height and hemoglobin levels in India and Nepal), 𝑋𝑖𝑗𝑡ℎ are husband (father)-specific indicators
(age, education, and work characteristics), 𝑋𝑖𝑗𝑡𝐻𝐻are household-specific indicators (rural/urban
indicator, age and gender of household head, indicators for access to electricity and ownership of
8
assets such as radios, refrigerators, televisions, motorcycles, and cars, as well as information on
sources of drinking water, toilet facilities and years lived in place of residence), and 𝑋𝑗𝑡 is a
state(region)-specific indicator (per capita net/gross state/region domestic product for India and
Nepal). In order to control for time trends and regional-level heterogeneity, equation (1)
includes month of conception dummies (𝑀), year of birth dummies (𝑇𝑏), a time indicator for the
round of DHS data in each of the three countries (T), region dummies (𝑆𝑗), and interactions of
time dummy T and region dummies 𝑆𝑗. 𝜀𝑖𝑗𝑡 is the standard idiosyncratic error term, and standard
errors are clustered by state or region. The coefficient of interest is 𝛽1: the relative impact of
adherence to Hindu practices on child health. For India, two categorical variables for religion
are included in the regression: whether the household is lower-caste Hindu (both Hindu and a
member of a scheduled caste or scheduled tribe) or upper-caste Hindu. The omitted category is
Muslim. For Nepal and Bangladesh, a single categorical variable is used (Hindu/Muslim). We
restrict the analysis to Hindu and Muslim households only (the data also contain information on
Christian and Buddhist children), as these households form the largest religious groups in these
countries. With this restriction, we drop about 5 percent of the Indian sample, 10 percent of the
Nepal sample, and less than 1 percent of the Bangladesh sample.
IV. Data and summary statistics
We use several recent rounds of the Demographic and Health Surveys for each country:
India 1998-99 and 2005-06, Bangladesh 1999-2000, 2004, 2007 and 2011, and Nepal 2001 and
2006, and keep children aged five years and below since anthropometrics are reported
consistently for this age-group.6 These data include maternal risk factors and demographic
6We do not use the 2011 DHS for Nepal because child anthropometric measurements were taken only in
households eligible for the ‘male’ subsample in this year (about one-third of the ‘female’ sample).
Because domestic and international work-related migration is substantial in Nepal and largely comprised
9
characteristics that are asked of all women between the ages of 15-49, as well as detailed
reproductive histories on year and month of delivery of every child born, gender of the child, and
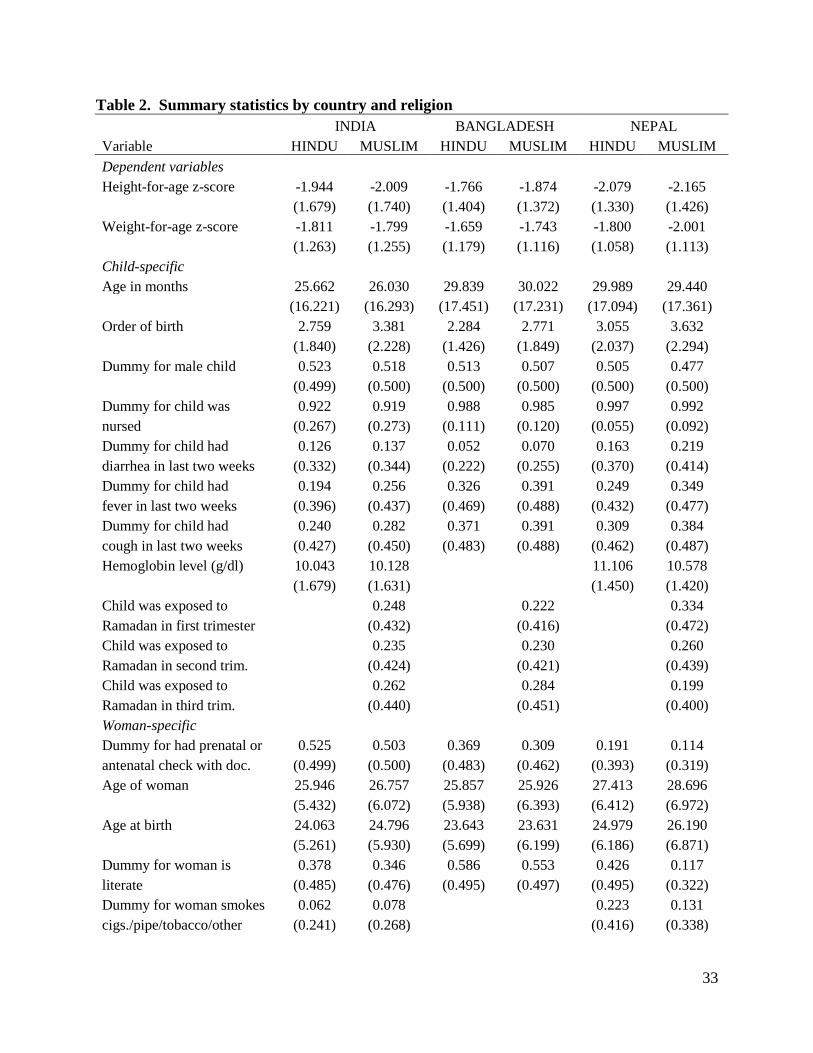
information on height-for-age and weight-for-age z-scores for children less than age five.7 Table
2 presents summary statistics of child-specific, woman-specific, husband-specific, and
household-specific characteristics in our sample for each country (pooling the data for all survey
rounds for each country), separated by religion. Table 3 reports summary statistics for state-
specific characteristics for both survey rounds in India. At each level (child-specific, women-
specific, household-specific, and state-specific), results are reported for unique observations.
Hence for example, while the child-specific variables are reported at the child-level (for children
less than or equal to five years of age), women-specific variables are reported for each woman so
that the number of births a woman has had does not weight her importance in these statistics.
The summary statistics for the child outcomes we study are shown in the top panel of
Table 2. We use two anthropometric measures of child health: height-for-age z-score and
weight-for-age z-score. Height-for-age z-score measures stunting, and is considered an indicator
of long-term health status that fluctuates little in response to short-term changes in diet. Weight-
for-age is a marker of underweight and reflects both stunting and wasting (low weight-for-
height).8 The data in Table 2 indicate that across religious groups, children in all three countries
are malnourished by these measures: among Hindu children, the average height-for-age z-score
is -1.9 in India, -1.8 in Bangladesh and is slightly worse in Nepal at -2.1; two standard deviations
below the mean of zero is considered to be stunted. Among Muslim children in these countries,
of prime-age men, this sample of children may be unrepresentative (see Lokshin et al. 2010 for an
analysis of the significant effect of work-related migration and remittances on poverty in Nepal). 7 The 1998-99 DHS for India only includes anthropometric data for children aged three and younger.
8 Deaton and Dreze (2009) note that for Indian children, the weight-for-age z-score is the preferred
measure of child nutritional status, encompassing both chronic and acute malnutrition (as opposed to
weight-for-height which reflects current, short-term nutritional status). For all rounds of the DHS data,
we use the z-scores based on the revised (2006) WHO growth charts.

10
height-for-age varies along similar thresholds and is notably worse than Hindu children within
each country. Similarly, the average weight-for-age z-score is roughly -1.8 in all three countries,
indicating that the average child in the region is well below conventionally accepted thresholds
for adequate nutrition (also centered at zero) by this measure.
Other measures summarized in Table 2 indicate few notable differences across the three
samples by religious affiliation. Breastfeeding rates are high in all three countries.9 Muslims
tend to have larger families as evident from the summary statistics for the order of birth variable,
and children with this denomination are also more likely to have had diarrhea, fever and cough in
the last two weeks compared to Hindu children in the same country. Lower incidence of anemia
is evident from the relatively higher level of hemoglobin among Muslim children in India,
possibly reflecting their non-vegetarian diet. However, Muslim children in Nepal do not show
an advantage in terms of this variable compared to Hindu children in that country (there is no
information on hemoglobin levels in the Bangladesh DHS). A sizeable proportion of Muslim
children were in utero during Ramadan in all three countries.
In terms of woman-specific characteristics, Muslim women are less likely to seek
prenatal or antennal care, are marginally taller, have somewhat higher hemoglobin levels and
report smoking or chewing tobacco more (in India), in comparison to Hindu women. Average
age at first marriage is very young (about 17 years) and even younger among Muslims. Women
are more likely to be literate in Bangladesh than in India or Nepal, but in the latter countries,
Muslim women are comparatively less educated. Relatively more Hindu women are likely to
report they are working, and rates of female work are particularly high in Nepal compared with
the other two countries, possibly reflecting the consequences of the 1996-2006 civil-war that
9 The results (discussed below) remain the same when the indicator for whether the child was breastfed is
replaced with a duration variable that measures months of breastfeeding.
11
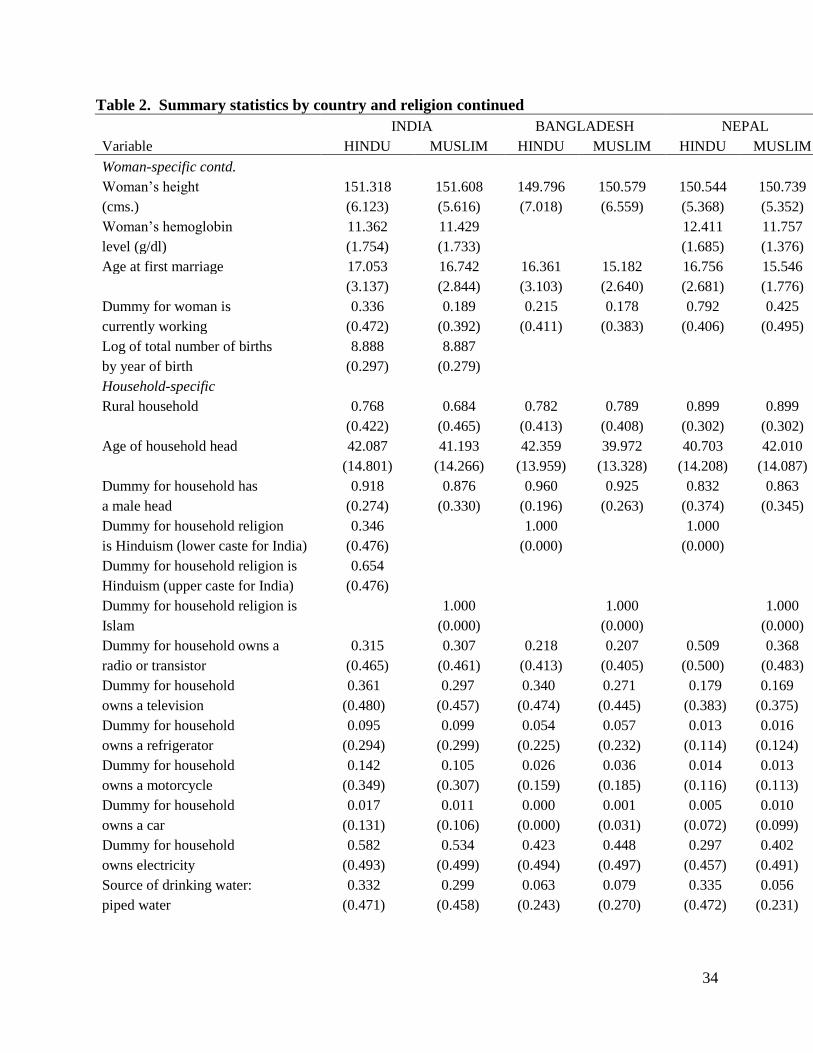
resulted in widespread displacement of men. Women’s average age ranges from 26 to 29 years
and the average husband’s age ranges from 32 to 36 years across the three countries (summary
statistics for men are reported in Appendix Table 1). Although women in Bangladesh report
relatively high rates of literacy, among Hindus, the proportion of uneducated husbands is highest
for that country. Moreover, within each country, Muslim men are more likely to be uneducated
as compared to Hindu men. Most males report working outside the home in these data. Further,
populations are overwhelmingly rural in all three countries.
Summary statistics for other variables indicate that in India and Bangladesh, over 90
percent of households are male-headed. For Nepal, this proportion is lower at about 84 percent.
In terms of the religion variable, among Hindus, 35 percent are lower caste Hindus and 65
percent are upper caste Hindus in the Indian sample. Reflecting their minority status, only 18
percent of the population in India is Muslim. In contrast, 91 percent of the sample is Muslim in
Bangladesh, with those reporting Hinduism as their religion comprising a minority at about 9
percent. Similar to India, Hindus are a majority in Nepal at 95 percent. Other indicators of
ownership of consumer durables (refrigerator, motorcycle, car) suggest that on average, the
status of Indian households is relatively high compared to Bangladesh and Nepal. However,
within India, Muslims fare worse. This fact is underscored when access to electricity and piped
water for drinking (a relatively clean source) is taken into account. Muslims fare relatively better
in terms of access to electricity and clean drinking water in Bangladesh.
Table 3 reports descriptive statistics for variables at the state level in India. Information
on per capita GDP for India is collected from the Economic Organization and Public Policy
Program (EOPP) database at the London School of Economics. Information on external deaths
(described below), malaria and TB deaths and deaths from fever are used in the robustness
12
checks of the main results and are collected from different editions of India’s Statistical
Yearbooks, Agricultural Statistics, and Vital Statistics of India. The time-varying consumer
price index (CPI) for India is for agricultural laborers (base: 1986-87=100) and is collected from
the Statistical Yearbook of India 2013 and the Statistical Pocketbook of India 2002.
V. Results
OLS Regressions
Results from equation (1) for the full sample and various subsets for each country are
shown in Table 4 (height-for-age z-scores) and Table 5 (weight-for-age z-scores). Focusing first
on height-for-age, in all three countries, Hindu children have higher z-scores than do Muslim
children for the sample as a whole (for upper caste Hindus in India) and for the rural population
(in India and Nepal). In India the coefficient is .076 for upper caste Hindus, indicating that the
height-for-age z-score for upper caste Hindu children is .076 standard deviations higher than for
Muslim children, holding constant many characteristics of the child, mother, father, household,
and state. In Bangladesh the coefficient on Hindu is .080 (p-value = .086) while in Nepal the
coefficient is .156 which is statistically significant at the 1.6 percent level.
Disaggregating by age, these better outcomes for Hindu children are apparent only for
children aged 13 to 59 months; the coefficient on Hindu becomes larger in magnitude and is
more precisely estimated for children aged more than twelve months in all three countries. The
coefficient ranges from .113 for upper caste Hindus in India to .158 in Nepal. Notably, the sign
on the Hindu coefficient flips and becomes negative for children under one year of age in India
and Bangladesh (although it is not statistically significant for Bangladesh): Muslim children in
this age group are characterized by less prevalence of stunting than Hindu children (for lower
caste Hindus in India); the coefficient on Hindu becomes statistically insignificant in Nepal for
13
children of this age-group. As noted above, these results for infants in India and Bangladesh
echo findings of a Muslim advantage in infant survival that has been documented in previous
studies (Bhalotra et al. 2010).10
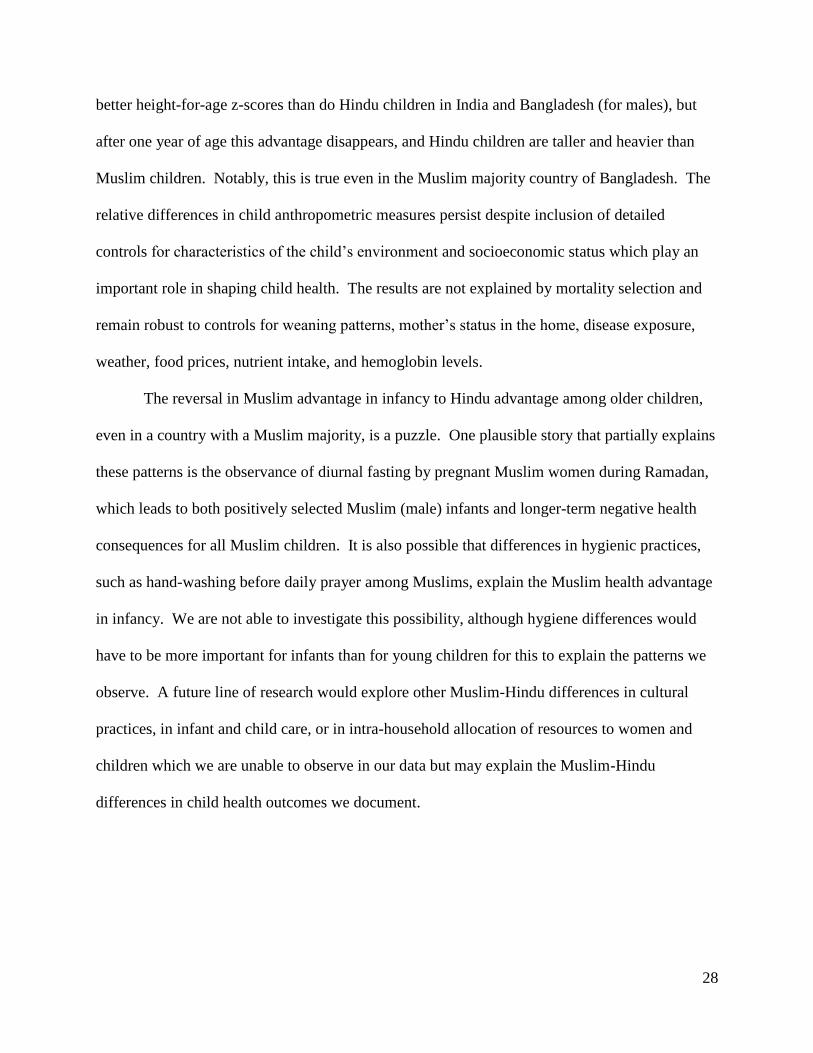
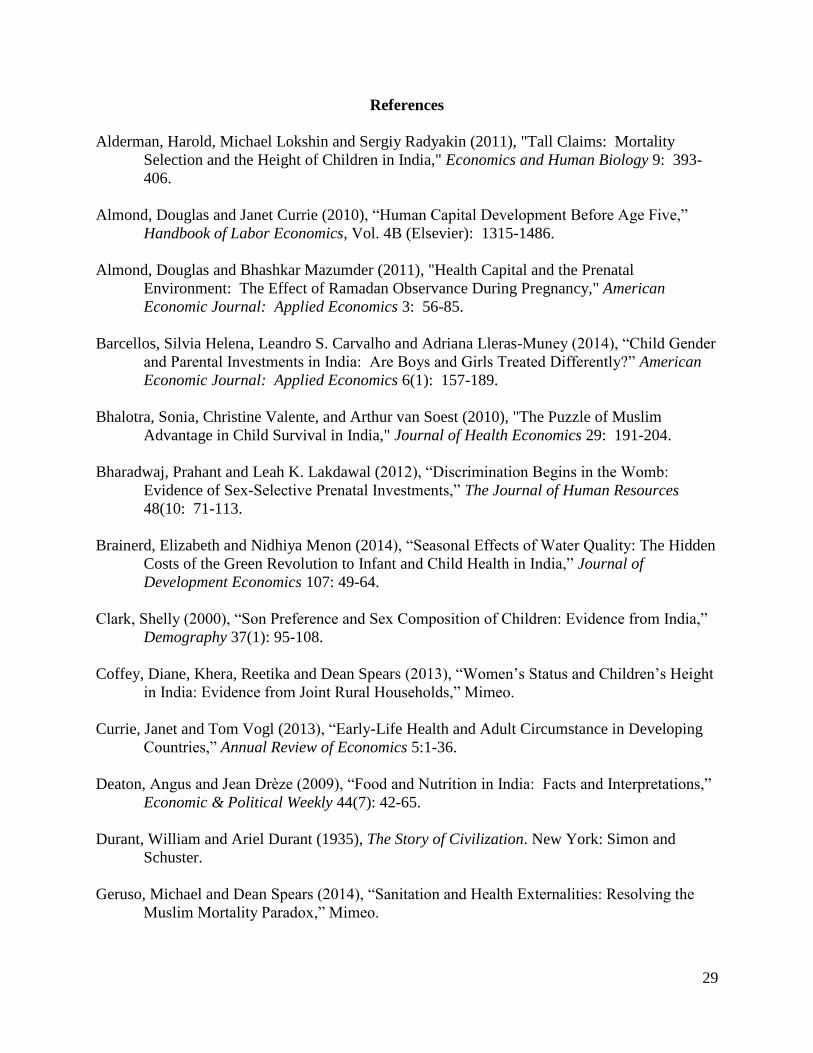
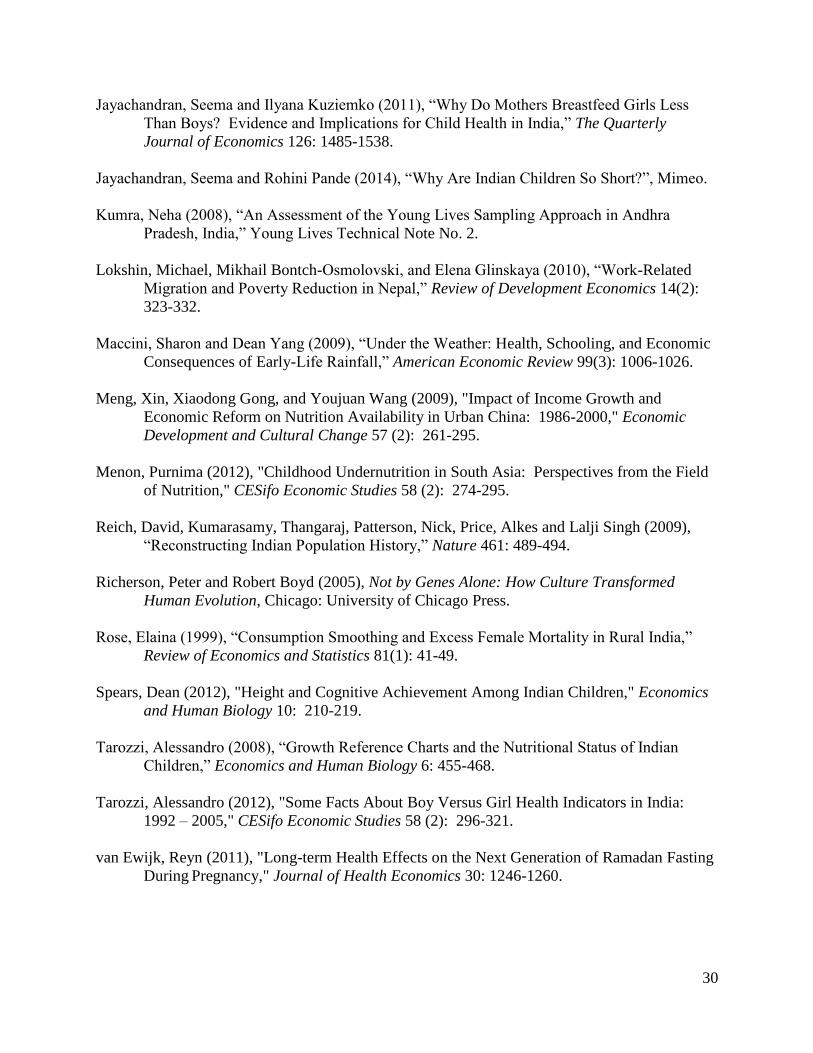
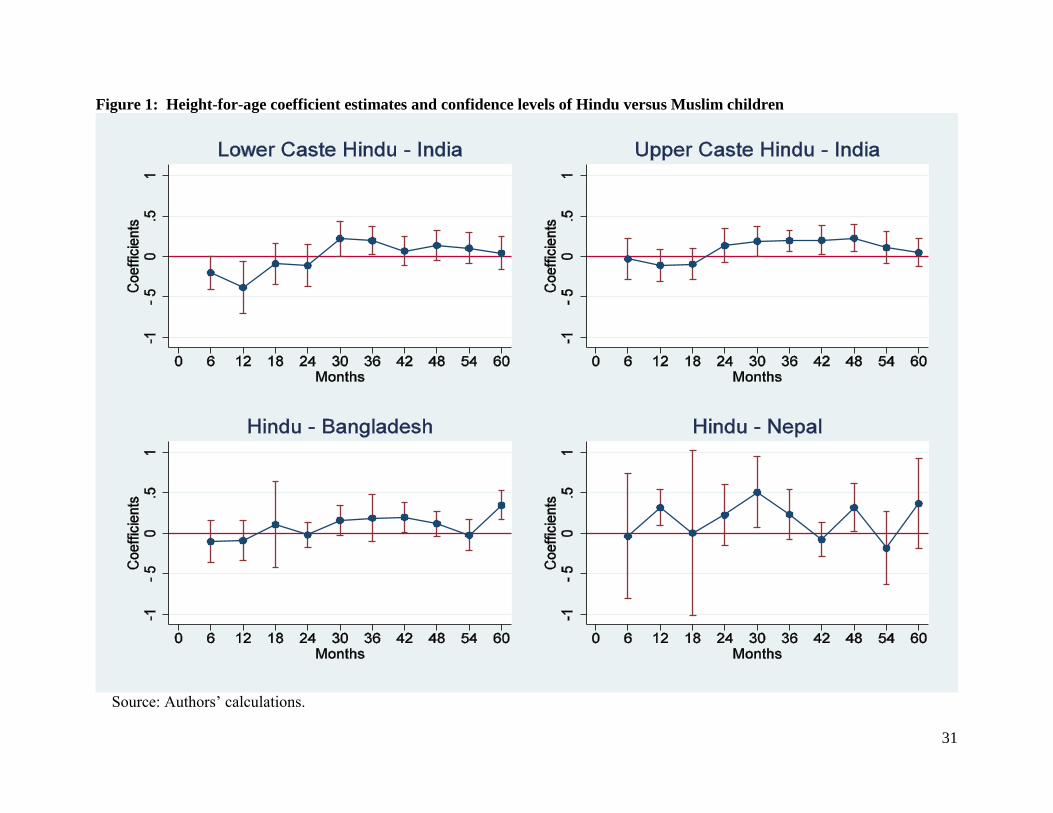
Figure 1 plots coefficient estimates on the Hindu variable (with
confidence levels) for children in the three countries disaggregated by six month age groups.
This illustrates that the Muslim advantage in infancy in India and Bangladesh transitions to a
Hindu advantage (denoted by the point at which coefficient estimates cross the solid line at zero
on the y-axis) shortly after 24 months for lower caste Hindu children and before 24 months for
upper caste Hindu children in India. The transition to Hindu advantage in the Muslim majority
country of Bangladesh occurs before 18 months of age; Hindu disadvantage is mostly absent in
Nepal except for a manifestation among older children around 48 to 54 months.
Table 4 also reports results disaggregated by gender and age of child. These show that
for older children, the comparatively better outcomes for Hindus are apparent for boys in India,
for both boys and girls in Bangladesh, and for girls in Nepal. Son preference is a possible
explanation for better male child outcomes for Hindus in India, particularly for first-born sons
who receive preferential treatment over higher-order sons and daughters.11
However, the results
remain the same when we include a ratio of sons to all children in the family or an indicator (for
each child) of whether the previous child in the family was a girl (and recall that birth order is
included as a control in all regressions).12
Among infants, Hindu boys have significantly lower
height-for-age z-scores than Muslim boys in India (for lower caste Hindus) and in Bangladesh,
10
These age disaggregated patterns remain evident for older children in Bangladesh and younger children
in Nepal when children’s BMI is used as the dependent variable (with mother’s BMI as a control).
Results for India are not estimated with precision in these alternate runs that check robustness. 11
See Jayachandran and Pande (2014); this study analyzes the difference in height-for-age between
Indian and African children and concludes that much of the difference is accounted for by preferential
treatment of first-born sons by Indian parents. 12
The results remain the same even when we consider only the subsample of first-borns; however we lose
some significance because of reduced sample size.
14
while Hindu infant girls are significantly disadvantaged among both upper and lower castes in
India relative to Muslim infant girls. In contrast to India and Bangladesh, Hindu infant boys are
significantly taller than Muslim infant boys in Nepal. In summary, long-term health status as
reflected in height-for-age z-scores indicates that Hindu children have an advantage over Muslim
children in India, Bangladesh and Nepal, with most of this advantage appearing after 12 months
in age.
The results for weight-for-age z-scores presented in Table 5 are more mixed but follow a
similar pattern to those in Table 4. For the population as a whole and for the rural population,
there is no systematic difference in weight-for-age z-scores among children in India, Bangladesh
and Nepal. However, when the sample is disaggregated by age, a Muslim advantage in infancy
in India and a Hindu advantage for older children in all three countries are both evident. Muslim
infants are .262 standard deviations heavier than lower caste infants in India, with this advantage
appearing mainly among girls. There is also a Muslim advantage for girl infants in Bangladesh,
who are .191 standard deviations heavier than Hindu girls. The gender differences in health
status by religion among girl infants again may reflect son preference in the region (Rose 1999,
Clark 2000). Among older children, the coefficient on Hindu ranges from .055 (for lower caste
Hindus in India) to .098 in Bangladesh; all coefficients for the 13-59 (“all”) age group are
statistically significant although they are smaller in magnitude and less precisely estimated than
those for height-for-age z-scores in Table 4 for this age group. By gender, the Hindu advantage
is apparent for upper caste Hindu boys in India, for Hindu boys in Bangladesh, and for Hindu
girls in Nepal. In summary, there is some evidence of a Muslim advantage in infancy and
stronger evidence of a Hindu advantage in weight-for-age z-scores for older children.
15
Tables 4 and 5 show the results only for the main coefficient of interest (Hindu);
however, several of the additional controls merit discussion.13
First, all of the regressions
include a control for mother's height. This is because there is a biological link between maternal
height and a child's size at birth (Alderman 2012, Menon 2012) which in turn affects a child's
growth potential. This also captures the likely intergenerational transmission of undernutrition,
in which women who themselves failed to achieve their growth potential are less healthy and
have children who start out at a disadvantage at birth. Appendix Table 2 shows that the
coefficient on mother's height is positive and highly statistically significant in all regressions.
However, the size of the coefficient is relatively small, and excluding this control from the
regressions does not change the results regarding Hindu and Muslim differences.
The regressions also include controls for mother's age when the child was born, as well as
the mother's age at first marriage. Both control for the worse health outcomes that characterize
children born of adolescent mothers, and are intended as a proxy for the woman's bargaining
position within the household; as discussed above women who are very young at marriage likely
have lower status and less control over resources within the household.14
The coefficient on
mother's age at birth is positive and statistically significant only in Nepal (for weight-for-age),
while the coefficient on mother's age at marriage is small in magnitude and generally statistically
insignificant. (The results for our coefficient of interest, Hindu, are similar if these controls are
omitted from the regression.) The indicator for whether child was nursed is insignificant in most
13
The full set of results for the complete sample in each country is presented in Appendix Table 2. 14
Recent evidence in Coffey et al. (2013) supports this idea by documenting that in rural Indian joint
families, younger daughters-in-law have shorter children. To explain our patterns, daughter-in-law status
must matter differentially by religion and by age of child, in particular, Hindu mothers should be affected
relatively more than Muslim mothers especially when the child is young. Since we find some evidence
that this is the case in India and Nepal, we included a variable measuring daughter-in-law status for
mothers in the models as an additional control for rank in the household and possibly stress experienced
during and after pregnancy. Since our results remain the same, these estimates are not separately reported
but are available on request.
16
of these models, possibly because rates of nursing are uniformly high with little variation.15
Incidence of recent illness such as diarrhea and fever has strong negative effects on standardized
measures of height and weight, whereas access to prenatal and antenatal care has significant
beneficial impacts. Children of literate mothers fare better in all countries whereas maternal
smoking has a harmful effect mainly in terms of height-for-age z-scores in Nepal. Working
mothers have children who score lower on height and weight measures, but only in India, and
children of more educated fathers in households with assets and access to electricity, with
relatively clean septic facilities residing in rich regions, have comparatively high anthropometric
measures in these countries. The Hindu advantage in height-for-age is evident in the full sample
for all three countries, even with inclusion of controls for mother’s education, mother’s
economic and work status, mother’s health and habits, recent illness for children, and the
household’s access to clean drinking water and septic facilities. It appears that while these
factors have some explanatory power for the health outcomes of children in this region, they
cannot fully account for the comparative Hindu advantage beyond age one in these countries.
VI. Mortality Selection
One reason for the reversal in Muslim advantage beyond age one may be that the weakest
Hindu children do not survive beyond that age. As a result, anthropometric measures for Hindu
children may appear comparatively high for children who are no longer infants because of
sample selection; stronger Hindu children are now being compared to the average Muslim child.
We present several tests to show that this is not the case.
15
Although there is little variation in rates across countries, we find some evidence that weaning patterns
in India (only) differ by religion and by age of the child. In particular, low caste Hindu infant boys appear
to be weaned relatively earlier than Muslim infant boys and among older children, Hindu girls are weaned
relatively later than Muslim girls. Since this may contribute to the age patterns we document, controlling
for breastfeeding is important in our models. However, as noted above, including a nursing indicator or a
variable measuring actual months that the child was breastfed does not change our results.
17
The first evidence against mortality selection is that the Hindu advantage in height-for-
age z-scores, the preferred measure of long-term health, is apparent in all three countries even
without conditioning on age. The first two columns of Table 4 show that in the full sample and
in rural areas of India and Nepal, Hindu children have an advantage compared to Muslim
children. Since there is no delineation by age in these samples, these results cannot be a
consequence of selective mortality by religion. Further, in the case of height-for-age in India, the
Muslim advantage in infancy is with respect to lower caste Hindus who constitute a different and
smaller proportion of the Hindu population (35 percent from Table 2) as compared to upper caste
Hindus. Yet the Hindu advantage beyond age one is evident among upper-caste Hindus. This
pattern is inconsistent with mortality selection in infancy that should affect lower-caste Hindu
children, and consequently be reflected in the older group of surviving children as a lower-caste
Hindu advantage.
Second, we analyze whether there are systematic differences in observable characteristics
in the population of Hindu children, conditioning on age. Table 6 reports differences in means of
characteristics between Hindu children 0-12 months and 13-59 months in the three countries. If
it is indeed the case that older Hindu children are distinct compared to the younger group, then
most of the coefficients in Table 6 should be statistically significant and have a sign that
indicates an advantage for the older cohort. Consider India first. The first two rows show that in
terms of the standardized height and weight dependent variables, Hindu children 0-12 months
have relatively high scores as compared to the older cohort. That is, infants do relatively better.
As expected, infants are somewhat more likely to have had diarrhea and fever in the last two
weeks and perhaps consequently, to have had more frequent check-ups with a doctor. Although
the higher incidence of sickness among younger children may give older children an advantage,
18
more frequent access to medical care works in favor of the younger Hindu child cohort. Older
children also appear to have higher levels of hemoglobin (an advantage), mothers with lower age
at first marriage (a disadvantage), higher proportion of mothers who smoke (a disadvantage),
mothers who are taller (an advantage), mothers who work (a disadvantage) and fathers who are
uneducated (a disadvantage). In terms of household characteristics, older children are slightly
more likely to live in areas with hygienic septic facilities (an advantage). All of the variables
that favor older children (mother’s height which is a proxy for unobserved child health
endowment, clean environment) are included in the models of Tables 4 and 5, yet Hindu
advantage beyond age one remains evident. Results reported below discuss inclusion of
hemoglobin levels for child and mother; again, the reversion from Muslim advantage to Hindu
advantage beyond the 12 month threshold remains apparent.
Table 6 also reports differences in means for Bangladesh and Nepal. In comparison to
India, there are fewer coefficients that are statistically different across child age-groups. Those
that favor older children in Bangladesh include only recent incidence of fever and diarrhea; as in
the case of India, these variables are included in the main model and do not eliminate the Hindu
advantage beyond age one. Several variables favor the older cohort of children in Nepal
(diarrhea, fever, hemoglobin), but again these variables are included as controls in the main
model where the reversion in advantage beyond age one remains apparent.
Third, we use Young Lives data that tracks children over time to check for mortality
selection. The Young Lives data set follows about 2000 children who are aged 6-18 months in
the state of Andhra Pradesh, India, from 2002 onwards. These children are surveyed again in
19
2006 (now aged 54-65) months with an attrition rate of less than 2 percent.16
The Young Lives
data are broadly comparable to the larger DHS data for India and are representative of the
population of Andhra Pradesh; the only difference is that the Young Lives households have
marginally better access to public amenities and are slightly wealthier (Kumra 2008). Given
these similarities, this alternate data is a good source in which to look for comparable patterns
which may be attributed to religious affiliation alone. Summary statistics for the Young Lives
data from rounds 2002 and 2006 in India are shown in Appendix Table 3 (as before, we keep
only Hindu and Muslim children; less than 5 percent of children belong to other religious
groups). We use mostly the same variables as in the DHS regressions reported for India in Table
4 (for brevity, we focus on the long-term measure of child health, height-for-age) and report
descriptive statistics differentiated by religion. Many of the patterns evident in Table 2 for India
are seen here – in particular, the average YL child scores well below conventionally accepted
standards for adequate nourishment, the probability that the child was nursed is high, mothers are
likely to seek prenatal or antenatal care with a doctor, age of mother at birth is low, and the
proportion of lower-caste Hindus is smaller than the proportion of upper-caste Hindus (Hindus
are 92 percent of the population and Muslims are 8 percent). Some differences include that in
comparison to Hindus, Muslim children compare more favorably in terms of height-for-age
(which should work against a Hindu advantage beyond age one), weight and access to medical
care. Muslim children are also less likely to have an uneducated father, to live in households that
own more assets such as radios, refrigerators and cars, and to have access to electricity and piped
water. These are all reasons why Muslim advantage in infancy should persist beyond the 12
month age threshold, but as shown in Table 7, this is not the case.
16
A third survey round was conducted in 2009, but given our focus on very young children, we do not use
information from the latest round in which children are now between 90-101 months in age (some of the
questions in the last round are also asked in a different format as compared to before).
20
Table 7 reports comparable regressions to the DHS India sample in Table 4 for the YL
data, including all controls outlined in Appendix Table 3.17
From the first two columns, it is
clear that an upper-caste Hindu advantage is still evident among children in the older age cohort
(but Muslim advantage in infancy is absent). The last two columns of Table 7 address mortality
selection directly by restricting the sample to only those children who are between the ages of 6-
11 months in 2002, and hence fall in the 54-59 month age group when they are surveyed again
48 months later in 2006. There are 230 children who are 6-11 months (consistent with our 0-12
month cut-off for younger children) in 2002 and 54-59 months (consistent with our 13-59 month
cut-off for older children) in 2006. The last column of Table 7 shows that even within this small
group, a Hindu advantage in height-for-age is apparent beyond age one. Since these are the same
children at two points in time, selective mortality by religion cannot be an explanatory factor.18
VII. Hindu and Muslim children in England
Does the Hindu advantage after age one exist in other countries? As an additional check
on whether these patterns are apparent in other contexts, we use the 2004 Health Survey for
England data set which surveys individuals in England on their health status and behaviors; in
2004 the survey over-sampled large minority ethnic groups in England including Indians,
Pakistanis, and Bangladeshis.19
The survey contains information on the weight of infants and
17
We did not implement a child fixed effects model for several reasons. Most importantly, there is no
variation in religious identity over time. Further, given the age-cutoffs for younger and older children, the
sample size was too small to identify close to 2000 fixed effect parameters. Finally, we wanted
comparable estimates to the empirical methods used in the study of the DHS data in Tables 4 and 5. 18
Alderman et al. (2011) also investigate the role of mortality selection in India's child height measures.
Using three rounds of DHS data, this study conducts a simulation exercise that imputes values to answer a
counterfactual question: what would height-for-age be if young Indian children who had died were alive
at the time of the surveys? They find that the extent of the bias due to selective mortality is small;
differences in anthropometric measures between children who died and those who survived would have to
be unjustifiably large for mortality selection to have had more than a moderate (5 percent) impact. 19
See http://www.hscic.gov.uk/article/3741/Health-Survey-for-England-Health-social-care-and-lifestyles
for further information on the survey and for data access.
21
children, which we use to calculate weight-for-age z-scores and compare these by the child’s
religion for children of Indian, Pakistani, and Bangladeshi parents.20
When we regress weight-
for-age z-score on a dummy variable for Hindu and include controls for the child’s gender and
ethnicity, the coefficient on Hindu is -0.896 for children age 0 to 12 months, with a p-value of
.072 (n=56). For children age 13 to 59 months, the coefficient on Hindu is 0.622 with a p-value
of 0.220 (n=338). While these sample sizes are very small and likely biased by sample selection
(among other problems), we nevertheless view this as suggestive evidence that the Hindu-
Muslim differences in child health status are real, likely to be cultural (and/or religion-based),
and are not due to country-specific explanations.
VIII. Robustness checks
Assets, number of births and external deaths
In this section, we examine other causes that may underlie the reversal in Muslim
advantage beyond infancy. It is possible that some of the differences in child health outcomes
are due to differences in wealth or family size by religion, with effects that become evident only
past infancy. This is especially true in India where Muslims are, on average, of lower socio-
economic status and have larger households. Table 8 presents several falsification tests for India
(for which we have complete data) to examine these explanations. The first two columns test
whether wealth, as measured by assets owned by the household (since ownership of bicycles and
motorcycles is fairly widespread, asset ownership is proxied by whether the household owns a
car or a refrigerator), differs systematically between Hindu and Muslim across the two child age-
groups we analyze. As indicated in Table 8, there are no statistically significant differences in
20
We assign religion (which is not asked of children) based on the reported religion of the oldest member
of the household. When this information is not available, we assume that Indian children are Hindu, and
Pakistani and Bangladeshi children are Muslim. All results for the Health Survey for England data are
available on request.
22
ownership of these consumer durables between religious groups across the child age-groups we
study. Since this was a period of rapid economic growth in India, it is notable that Hindus and
Muslims did not differ in ownership of assets (which are thought to increase in times of
prosperity) yet differed in terms of child health outcomes in infancy and beyond. This finding
also plausibly rules out other omitted variables that may be systematically correlated with
religious identity and child anthropometric measures in India in consistent ways.
Another explanation for the results in Tables 4 and 5 is that family size varies
consistently by religion. Average family size among Muslims is relatively large as compared to
Hindus (birth order of the average child is higher among Muslims compared to Hindus from
Table 2), so median child “quality” may differ across these groups especially beyond 12 months
of age when the child’s environment and living circumstances play a more crucial role in
determining human capital outcomes. To assess whether this is a valid concern in our samples,
the third and fourth columns in Table 8 regress log number of births by year on the religion
dummy variables and our full set of control variables (including child’s order of birth). There is
no evidence that the number of births varies systematically by religious affiliation, plausibly
ruling out family size effects in India.
Table 8 also reports results for accidental deaths as a falsification check. In India these
are defined as the state-wise number of deaths from bites/stings, accidental burns, falls,
drowning, accidental poisoning, transport and other accidents, and suicides and homicides,
normalized by total state population. There is no reason to expect a consistent association
between such deaths and religious affiliation, and estimates in the fourth columns of Table 8
confirm that this is indeed the case.
23
IX. Other possible explanations
Disease environment, public investments, rainfall, prices
Table 9 presents results for another set of specification checks for omitted variables that
include incidence of diseases (malaria and tuberculosis), weather (rainfall), prices, and nutrient
intake.21,22
Region and time-varying malaria and tuberculosis (TB) information is available for
India as the number of deaths from malaria and TB normalized by state population. Controlling
for disease is important since it may directly impact child health, or have indirect effects by
affecting mother’s health.23
Rainfall may have long-lasting implications for child’s human
capital as in Maccini and Yang (2009). For both height-for-age and weight-for-age, controlling
for malaria and TB and average rainfall does not change the child health results (Table 9). The
21
In results not reported, we controlled for region-wise air temperature and the total infant mortality rate
(IMR) in year of birth for children in the three countries (total infant mortality rate is available only for
India and Bangladesh); this did not change any of the results. Air temperature data for India were
obtained from the Indian Meteorological Department, for Bangladesh from the Handbook of Environment
Statistics and the Yearbook of Agricultural Statistics of Bangladesh, various years, and for Nepal from the
Handbook of Environment Statistics, various years. IMR data for India was obtained from the Sample
Registration System Bulletin; for Bangladesh from the Report on the Sample Vital Registration System. 22
We also controlled for inequality in India using the Gini coefficient of distribution of consumption by
state and year of birth of children obtained from the Planning Commission of India website at
http://planningcommission.nic.in/data/datatable/index.php?data=datatab (no comparable data is available
for Bangladesh or Nepal). These results are not reported since previously documented patterns by child
age do not change when the inequality measure is included in the regressions, or when the regressions are
run including the Gini at the upper and lower halves of the inequality distribution. Further, in order to
understand whether inequality within religions is important, we interacted the Gini coefficient with the
dummy for low-caste and upper-caste Hindus and included these interactions (along with the Gini
independently) in the basic models of Table 4 for India. Results indicate that patterns for older children
remain the same as before. However in the sample of infants, the Muslim advantage with respect to low-
caste Hindus disappears suggesting that higher inequality among Hindus may be an explanatory factor for
why very young Muslim children fare relatively better. These results are available on request. 23
Geruso and Spears (2014) argue that the “puzzle” of Muslim advantage in infancy may be wholly
explained by the fact that sanitation is an important health externality that impacts the disease
environment, and Hindus are significantly less likely than Muslims to use toilets or latrines. Since we
control for sanitation and toilet facilities in the regressions (they use the same DHS data sets as us for
India), we should not see the reversal in health outcomes beyond age one if that was the sole explanation.
24
Muslim advantage in infancy remains in both measures, and this advantage still reverts beyond
the first year.24
25
We also examine the impact of food prices on child health outcomes as measured by
the CPI for agricultural laborers and indicators of nutrient intake in India.26
Previous research
has shown (Meng et al. 2009) that nutrient availability can decline during periods of economic
growth due to increased food prices. The positive effect of income growth on nutrient
availability may thus be more than offset by changing relative prices during a period of
liberalization, as occurred in China in the mid-1990s. After controlling for food prices and
nutrient intake in the regressions, the coefficients on Hindu are virtually unchanged for India as
shown in the last four columns of Table 9.
Vegetarian diet (anemia) and in utero exposure to Ramadan fasting
Nutritional deficiencies from dietary restrictions may be another source of differences in
the health of children in India, Nepal, and Bangladesh. As noted above, India and Nepal are
predominantly Hindu where conservative adherents mostly follow a vegetarian diet, while
Bangladesh is predominantly Muslim and non-vegetarian.27
There are also variations within
countries; northern Indian states such as Gujarat and Uttar Pradesh are mainly Hindu and
vegetarian whereas the southern state of Kerala, while still mainly Hindu, has a relatively large
24
Since the dependent variables are z-scores, differences across religious populations in mean should not
matter. However within-variation may be a factor, for example, some groups may take longer to catch-up
in height. To test for this, we re-defined child height to be a binary measure of stunting using the
conventionally accepted threshold of 2 standard deviations below the mean. Results (not reported in the
paper) with this non-linear formulation are similar to those in Table 4 indicating that differences in
within-variance are not a factor. 25
We also controlled for state-level public subsidies (measured by national central assistance) from 2000-
2006 in India; this does not change the patterns even though such assistance has significant positive
effects on height-for-age in both age groups. The national central assistance data are obtained from
http://planningcommission.nic.in/data/central/index.php?data=centab, accessed on June 10, 2013. 26
Specifically, we add region and time-varying controls for calories (in Kcal by rural/urban), protein
intake (in g. by rural/urban) and fat intake (in g. by rural/urban) per capita per day. 27
The proportion of India that is strictly vegetarian (no meat or eggs) ranges from 20-31 percent.
25
proportion of Muslims and Christians who follow a non-vegetarian diet. Given the absence of
detailed dietary information in the DHS data, we include measures of hemoglobin (Hb) levels for
children and mothers in India. Tarozzi (2012) notes that low Hb levels (anemia) may lead to
reduced child development and increased disease incidence, and that India as a whole is
characterized by low Hb levels (up to 80 percent) due to low consumption of meat and fish.
The first two columns of Table 10 present these results for height-for-age and weight-for-
age z-scores. It is clear that controlling for Hb levels does not eliminate the Hindu advantage
among older children in terms of height-for-age; even lower caste Hindu children appear to fare
better compared to Muslim children in India after inclusion of this control. There is some loss in
significance for the older group of Indian children in the weight-for-age regressions. These
results underscore that differences in diet tied to religious affiliation do not explain the reversion
from Muslim to Hindu advantage beyond age one.
The final explanation we consider is in utero exposure of Muslim children to diurnal
fasting by their mothers during Ramadan. If such exposure has negative consequences for child
health and long-term well-being (Almond and Mazumder 2011; van Ewijk 2011), then this might
explain why the Muslim advantage in infancy dissipates beyond the first year. The DHS data
contains information on month and year of birth of each child. Using a nine-month gestation
cycle, we create month and year of conception variables for Muslim children in India, and then
based on retrospective information for the months in which Ramadan was observed from 1993 to
2006 (the earliest and most recent year of conception for children in our sample), create three
indicator variables for whether Ramadan overlapped with pregnancy in the first, second or third
trimesters. The third and fourth columns of Table 10 report results from the model that includes
these trimester exposure variables. There is evidence in India that including the Ramadan
26
exposure measures eliminates the Hindu advantage beyond age one in both height-for age and
weight-for-age. 28
Although not reported in Table 10, the same is true in Nepal when the Nepal
regressions are re-estimated including the Ramadan trimester exposure variables: the
coefficients on Hindu for children age 13-59 months become statistically insignificant for both
height-for-age and weight-for-age. For Bangladesh, however, the Hindu advantage for older
children remains for both health outcomes (all results available on request). In India (and
Bangladesh), the Muslim advantage in infancy remains with the control for Ramadan exposure.
The final two columns of Table 10 report results when all variables are considered together
(disease, rainfall and Ramadan exposure); in these regressions the Hindu advantage in height-
for-age returns for older children in India, although the sample size is much smaller and the
effect is more imprecisely estimated than before.
While this evidence is suggestive that – at least in India and Nepal – exposure to fasting
in utero during Ramadan is detrimental to the health of Muslim children age one and over, it still
does not explain the Muslim health advantage for infants. As a final test for this group, we
examine the possibility that positive selection of Muslim infants caused by fasting explains the
Muslim infant health advantage: exposure to fasting in utero may cause less viable fetuses to
die, leading to positive selection of the Muslim infants who are born and are therefore healthier
infants relative to Hindu infants who were not exposed to fasting in utero. To test this
hypothesis, we estimate the same regressions as in Table 4, but restrict the sample to infants age
28
To understand whether the impact of fasting differs by poverty status of the household, we included
interactions of Ramadan trimester exposures and a “poor” indicator which denotes households in which
husbands are illiterate. The patterns in height-for-age remain the same across countries with inclusion of
these additional interaction terms in the models. We also interacted fasting with the nursing indicator to
control for possible effects of dehydration that may impact child health. Again, our results remain the
same. Finally, fasting measures were created for Hindu children as well to control for possible spillover
effects from Ramadan. This too did not change previously documented patterns. All results are available
on request.
27
0 to 12 months who were not exposed to Ramadan fasting. If Ramadan fasting leads to positive
selection of Muslim infants, we should not observe the Muslim advantage in infancy for this not-
exposed group.
The results of these regressions indicate, as before, a negative and statistically significant
coefficient on ‘Hindu’ in both India (for low caste Hindus) and Bangladesh, and an insignificant
coefficient in Nepal (as before). However, when we estimate these regressions separately by
gender, the coefficient on Hindu for male infants in India becomes statistically insignificant
(coefficient = -.169, SE=.141 for low caste Hindus; coefficient = .060, SE=.142 for high caste
Hindus), while remaining negative and statistically significant for girls in India (and for boys in
Bangladesh). Since male infants are more vulnerable to health shocks than are girls, if there is a
positive selection effect of Ramadan it would be more likely to be apparent for boys as it is here.
This suggests that positive selection of Muslim boys in India may underlie the health advantage
of Muslim boys in infancy in India. However, positive selection does not explain the health
advantage of Muslim girl infants in India or boy infants in Bangladesh.
X. Conclusion
The widespread malnutrition of children on the Indian subcontinent is persistent,
troubling, and poorly understood. Given that religion dictates many of the rituals of daily life for
much of this population – from dietary restrictions and fasting, to hand-washing and daily prayer
– this paper investigates differences in child health by religion to better understand the high rates
of stunting and wasting among children in these countries. The detailed data and comparative
research design we use allows us to control for many socioeconomic characteristics of children
and families, and to establish that remarkably similar patterns of child malnutrition by religious
affiliation occur across all three countries we study: Muslim children less than a year old have
28
better height-for-age z-scores than do Hindu children in India and Bangladesh (for males), but
after one year of age this advantage disappears, and Hindu children are taller and heavier than
Muslim children. Notably, this is true even in the Muslim majority country of Bangladesh. The
relative differences in child anthropometric measures persist despite inclusion of detailed
controls for characteristics of the child’s environment and socioeconomic status which play an
important role in shaping child health. The results are not explained by mortality selection and
remain robust to controls for weaning patterns, mother’s status in the home, disease exposure,
weather, food prices, nutrient intake, and hemoglobin levels.
The reversal in Muslim advantage in infancy to Hindu advantage among older children,
even in a country with a Muslim majority, is a puzzle. One plausible story that partially explains
these patterns is the observance of diurnal fasting by pregnant Muslim women during Ramadan,
which leads to both positively selected Muslim (male) infants and longer-term negative health
consequences for all Muslim children. It is also possible that differences in hygienic practices,
such as hand-washing before daily prayer among Muslims, explain the Muslim health advantage
in infancy. We are not able to investigate this possibility, although hygiene differences would
have to be more important for infants than for young children for this to explain the patterns we
observe. A future line of research would explore other Muslim-Hindu differences in cultural
practices, in infant and child care, or in intra-household allocation of resources to women and
children which we are unable to observe in our data but may explain the Muslim-Hindu
differences in child health outcomes we document.
29
References
Alderman, Harold, Michael Lokshin and Sergiy Radyakin (2011), "Tall Claims: Mortality
Selection and the Height of Children in India," Economics and Human Biology 9: 393-
406.
Almond, Douglas and Janet Currie (2010), “Human Capital Development Before Age Five,”
Handbook of Labor Economics, Vol. 4B (Elsevier): 1315-1486.
Almond, Douglas and Bhashkar Mazumder (2011), "Health Capital and the Prenatal
Environment: The Effect of Ramadan Observance During Pregnancy," American
Economic Journal: Applied Economics 3: 56-85.
Barcellos, Silvia Helena, Leandro S. Carvalho and Adriana Lleras-Muney (2014), “Child Gender
and Parental Investments in India: Are Boys and Girls Treated Differently?” American
Economic Journal: Applied Economics 6(1): 157-189.
Bhalotra, Sonia, Christine Valente, and Arthur van Soest (2010), "The Puzzle of Muslim
Advantage in Child Survival in India," Journal of Health Economics 29: 191-204.
Bharadwaj, Prahant and Leah K. Lakdawal (2012), “Discrimination Begins in the Womb:
Evidence of Sex-Selective Prenatal Investments,” The Journal of Human Resources
48(10: 71-113.
Brainerd, Elizabeth and Nidhiya Menon (2014), “Seasonal Effects of Water Quality: The Hidden
Costs of the Green Revolution to Infant and Child Health in India,” Journal of
Development Economics 107: 49-64.
Clark, Shelly (2000), “Son Preference and Sex Composition of Children: Evidence from India,”
Demography 37(1): 95-108.
Coffey, Diane, Khera, Reetika and Dean Spears (2013), “Women’s Status and Children’s Height
in India: Evidence from Joint Rural Households,” Mimeo.
Currie, Janet and Tom Vogl (2013), “Early-Life Health and Adult Circumstance in Developing
Countries,” Annual Review of Economics 5:1-36.
Deaton, Angus and Jean Drèze (2009), “Food and Nutrition in India: Facts and Interpretations,”
Economic & Political Weekly 44(7): 42-65.
Durant, William and Ariel Durant (1935), The Story of Civilization. New York: Simon and
Schuster.
Geruso, Michael and Dean Spears (2014), “Sanitation and Health Externalities: Resolving the
Muslim Mortality Paradox,” Mimeo.
30
Jayachandran, Seema and Ilyana Kuziemko (2011), “Why Do Mothers Breastfeed Girls Less
Than Boys? Evidence and Implications for Child Health in India,” The Quarterly
Journal of Economics 126: 1485-1538.
Jayachandran, Seema and Rohini Pande (2014), “Why Are Indian Children So Short?”, Mimeo.
Kumra, Neha (2008), “An Assessment of the Young Lives Sampling Approach in Andhra
Pradesh, India,” Young Lives Technical Note No. 2.
Lokshin, Michael, Mikhail Bontch-Osmolovski, and Elena Glinskaya (2010), “Work-Related
Migration and Poverty Reduction in Nepal,” Review of Development Economics 14(2):
323-332.
Maccini, Sharon and Dean Yang (2009), “Under the Weather: Health, Schooling, and Economic
Consequences of Early-Life Rainfall,” American Economic Review 99(3): 1006-1026.
Meng, Xin, Xiaodong Gong, and Youjuan Wang (2009), "Impact of Income Growth and
Economic Reform on Nutrition Availability in Urban China: 1986-2000," Economic
Development and Cultural Change 57 (2): 261-295.
Menon, Purnima (2012), "Childhood Undernutrition in South Asia: Perspectives from the Field
of Nutrition," CESifo Economic Studies 58 (2): 274-295.
Reich, David, Kumarasamy, Thangaraj, Patterson, Nick, Price, Alkes and Lalji Singh (2009),
“Reconstructing Indian Population History,” Nature 461: 489-494.
Richerson, Peter and Robert Boyd (2005), Not by Genes Alone: How Culture Transformed
Human Evolution, Chicago: University of Chicago Press.
Rose, Elaina (1999), “Consumption Smoothing and Excess Female Mortality in Rural India,”
Review of Economics and Statistics 81(1): 41-49.
Spears, Dean (2012), "Height and Cognitive Achievement Among Indian Children," Economics
and Human Biology 10: 210-219.
Tarozzi, Alessandro (2008), “Growth Reference Charts and the Nutritional Status of Indian
Children,” Economics and Human Biology 6: 455-468.
Tarozzi, Alessandro (2012), "Some Facts About Boy Versus Girl Health Indicators in India:
1992 – 2005," CESifo Economic Studies 58 (2): 296-321.
van Ewijk, Reyn (2011), "Long-term Health Effects on the Next Generation of Ramadan Fasting
During Pregnancy," Journal of Health Economics 30: 1246-1260.
31
Figure 1: Height-for-age coefficient estimates and confidence levels of Hindu versus Muslim children
Source: Authors’ calculations.
32
Table 1. Health and development indicators, 2006
Bangladesh India Nepal
Development indicators:
GDP per capita (constant $2000) $460 $622 $241
Poverty headcount ratio ($2/day), 76.5 68.7 57.3
% of population
Adult female literacy rate (%) 51.0 50.8 46.9
% Rural population 73.9 70.4 84.6
Health and fertility:
Total fertility rate 2.51 2.79 3.17
Infant mortality rate 46.8 54.3 48.2
(per 1,000 births)
% children immunized for DPT, 93 66 94
age 12-23 months
Median age at first marriage, 15.0 17.4 17.0
women age 25-49
Sources: World Bank, World Development Indicators, and Demographic and Health Surveys
(median age at first marriage only)
33
Table 2. Summary statistics by country and religion
INDIA BANGLADESH NEPAL
Variable HINDU MUSLIM HINDU MUSLIM HINDU MUSLIM
Dependent variables
Height-for-age z-score -1.944 -2.009 -1.766 -1.874 -2.079 -2.165
(1.679) (1.740) (1.404) (1.372) (1.330) (1.426)
Weight-for-age z-score -1.811 -1.799 -1.659 -1.743 -1.800 -2.001
(1.263) (1.255) (1.179) (1.116) (1.058) (1.113)
Child-specific
Age in months 25.662 26.030 29.839 30.022 29.989 29.440
(16.221) (16.293) (17.451) (17.231) (17.094) (17.361)
Order of birth 2.759 3.381 2.284 2.771 3.055 3.632
(1.840) (2.228) (1.426) (1.849) (2.037) (2.294)
Dummy for male child 0.523 0.518 0.513 0.507 0.505 0.477
(0.499) (0.500) (0.500) (0.500) (0.500) (0.500)
Dummy for child was 0.922 0.919 0.988 0.985 0.997 0.992
nursed (0.267) (0.273) (0.111) (0.120) (0.055) (0.092)
Dummy for child had 0.126 0.137 0.052 0.070 0.163 0.219
diarrhea in last two weeks (0.332) (0.344) (0.222) (0.255) (0.370) (0.414)
Dummy for child had 0.194 0.256 0.326 0.391 0.249 0.349
fever in last two weeks (0.396) (0.437) (0.469) (0.488) (0.432) (0.477)
Dummy for child had 0.240 0.282 0.371 0.391 0.309 0.384
cough in last two weeks (0.427) (0.450) (0.483) (0.488) (0.462) (0.487)
Hemoglobin level (g/dl) 10.043 10.128
11.106 10.578
(1.679) (1.631)
(1.450) (1.420)
Child was exposed to 0.248 0.222 0.334
Ramadan in first trimester (0.432) (0.416) (0.472)
Child was exposed to 0.235 0.230 0.260
Ramadan in second trim. (0.424) (0.421) (0.439)
Child was exposed to 0.262 0.284 0.199
Ramadan in third trim. (0.440) (0.451) (0.400)
Woman-specific
Dummy for had prenatal or 0.525 0.503 0.369 0.309 0.191 0.114
antenatal check with doc. (0.499) (0.500) (0.483) (0.462) (0.393) (0.319)
Age of woman 25.946 26.757 25.857 25.926 27.413 28.696
(5.432) (6.072) (5.938) (6.393) (6.412) (6.972)
Age at birth 24.063 24.796 23.643 23.631 24.979 26.190
(5.261) (5.930) (5.699) (6.199) (6.186) (6.871)
Dummy for woman is 0.378 0.346 0.586 0.553 0.426 0.117
literate (0.485) (0.476) (0.495) (0.497) (0.495) (0.322)
Dummy for woman smokes 0.062 0.078
0.223 0.131
cigs./pipe/tobacco/other (0.241) (0.268)
(0.416) (0.338)
34
Table 2. Summary statistics by country and religion continued
INDIA BANGLADESH NEPAL
Variable HINDU MUSLIM HINDU MUSLIM HINDU MUSLIM
Woman-specific contd.
Woman’s height 151.318 151.608 149.796 150.579 150.544 150.739
(cms.) (6.123) (5.616) (7.018) (6.559) (5.368) (5.352)
Woman’s hemoglobin 11.362 11.429
12.411 11.757
level (g/dl) (1.754) (1.733)
(1.685) (1.376)
Age at first marriage 17.053 16.742 16.361 15.182 16.756 15.546
(3.137) (2.844) (3.103) (2.640) (2.681) (1.776)
Dummy for woman is 0.336 0.189 0.215 0.178 0.792 0.425
currently working (0.472) (0.392) (0.411) (0.383) (0.406) (0.495)
Log of total number of births 8.888 8.887
by year of birth (0.297) (0.279)
Household-specific
Rural household 0.768 0.684 0.782 0.789 0.899 0.899
(0.422) (0.465) (0.413) (0.408) (0.302) (0.302)
Age of household head 42.087 41.193 42.359 39.972 40.703 42.010
(14.801) (14.266) (13.959) (13.328) (14.208) (14.087)
Dummy for household has 0.918 0.876 0.960 0.925 0.832 0.863
a male head (0.274) (0.330) (0.196) (0.263) (0.374) (0.345)
Dummy for household religion 0.346 1.000 1.000
is Hinduism (lower caste for India) (0.476) (0.000) (0.000)
Dummy for household religion is 0.654
Hinduism (upper caste for India) (0.476)
Dummy for household religion is 1.000 1.000 1.000
Islam (0.000) (0.000) (0.000)
Dummy for household owns a 0.315 0.307 0.218 0.207 0.509 0.368
radio or transistor (0.465) (0.461) (0.413) (0.405) (0.500) (0.483)
Dummy for household 0.361 0.297 0.340 0.271 0.179 0.169
owns a television (0.480) (0.457) (0.474) (0.445) (0.383) (0.375)
Dummy for household 0.095 0.099 0.054 0.057 0.013 0.016
owns a refrigerator (0.294) (0.299) (0.225) (0.232) (0.114) (0.124)
Dummy for household 0.142 0.105 0.026 0.036 0.014 0.013
owns a motorcycle (0.349) (0.307) (0.159) (0.185) (0.116) (0.113)
Dummy for household 0.017 0.011 0.000 0.001 0.005 0.010
owns a car (0.131) (0.106) (0.000) (0.031) (0.072) (0.099)
Dummy for household 0.582 0.534 0.423 0.448 0.297 0.402
owns electricity (0.493) (0.499) (0.494) (0.497) (0.457) (0.491)
Source of drinking water: 0.332 0.299 0.063 0.079 0.335 0.056
piped water (0.471) (0.458) (0.243) (0.270) (0.472) (0.231)
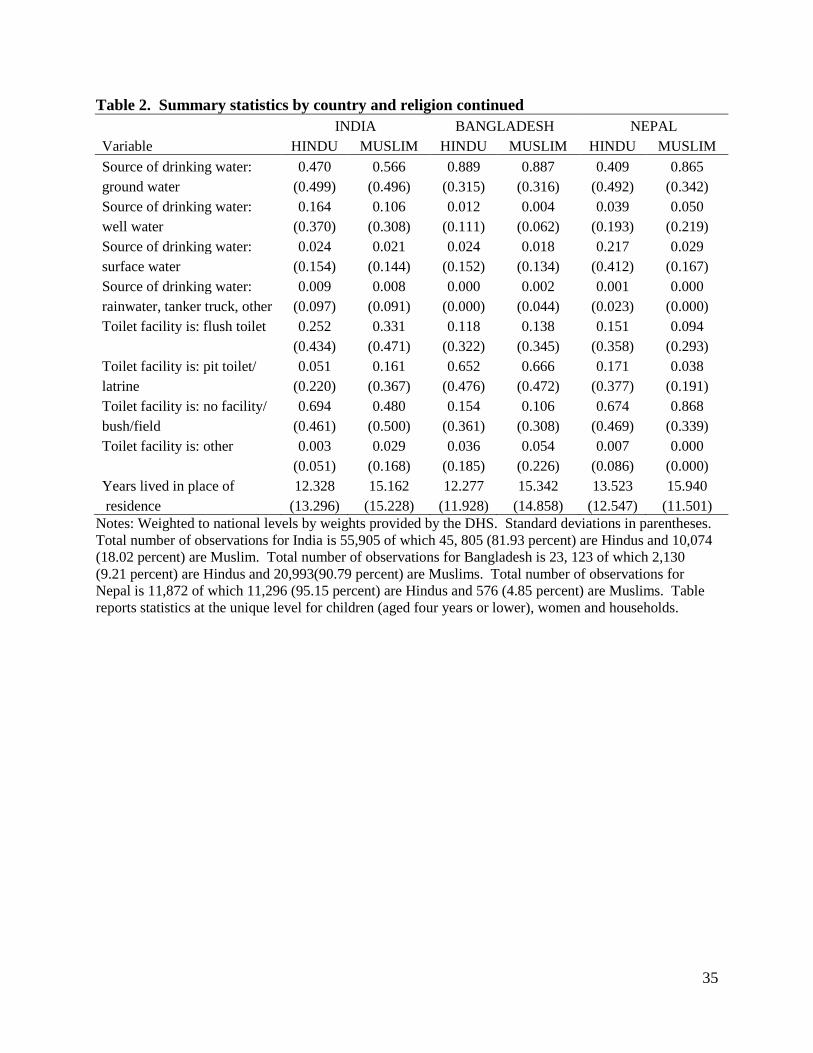
35
Table 2. Summary statistics by country and religion continued
INDIA BANGLADESH NEPAL
Variable HINDU MUSLIM HINDU MUSLIM HINDU MUSLIM
Source of drinking water: 0.470 0.566 0.889 0.887 0.409 0.865
ground water (0.499) (0.496) (0.315) (0.316) (0.492) (0.342)
Source of drinking water: 0.164 0.106 0.012 0.004 0.039 0.050
well water (0.370) (0.308) (0.111) (0.062) (0.193) (0.219)
Source of drinking water: 0.024 0.021 0.024 0.018 0.217 0.029
surface water (0.154) (0.144) (0.152) (0.134) (0.412) (0.167)
Source of drinking water: 0.009 0.008 0.000 0.002 0.001 0.000
rainwater, tanker truck, other (0.097) (0.091) (0.000) (0.044) (0.023) (0.000)
Toilet facility is: flush toilet 0.252 0.331 0.118 0.138 0.151 0.094
(0.434) (0.471) (0.322) (0.345) (0.358) (0.293)
Toilet facility is: pit toilet/ 0.051 0.161 0.652 0.666 0.171 0.038
latrine (0.220) (0.367) (0.476) (0.472) (0.377) (0.191)
Toilet facility is: no facility/ 0.694 0.480 0.154 0.106 0.674 0.868
bush/field (0.461) (0.500) (0.361) (0.308) (0.469) (0.339)
Toilet facility is: other 0.003 0.029 0.036 0.054 0.007 0.000
(0.051) (0.168) (0.185) (0.226) (0.086) (0.000)
Years lived in place of 12.328 15.162 12.277 15.342 13.523 15.940
residence (13.296) (15.228) (11.928) (14.858) (12.547) (11.501)
Notes: Weighted to national levels by weights provided by the DHS. Standard deviations in parentheses.
Total number of observations for India is 55,905 of which 45, 805 (81.93 percent) are Hindus and 10,074
(18.02 percent) are Muslim. Total number of observations for Bangladesh is 23, 123 of which 2,130
(9.21 percent) are Hindus and 20,993(90.79 percent) are Muslims. Total number of observations for
Nepal is 11,872 of which 11,296 (95.15 percent) are Hindus and 576 (4.85 percent) are Muslims. Table
reports statistics at the unique level for children (aged four years or lower), women and households.
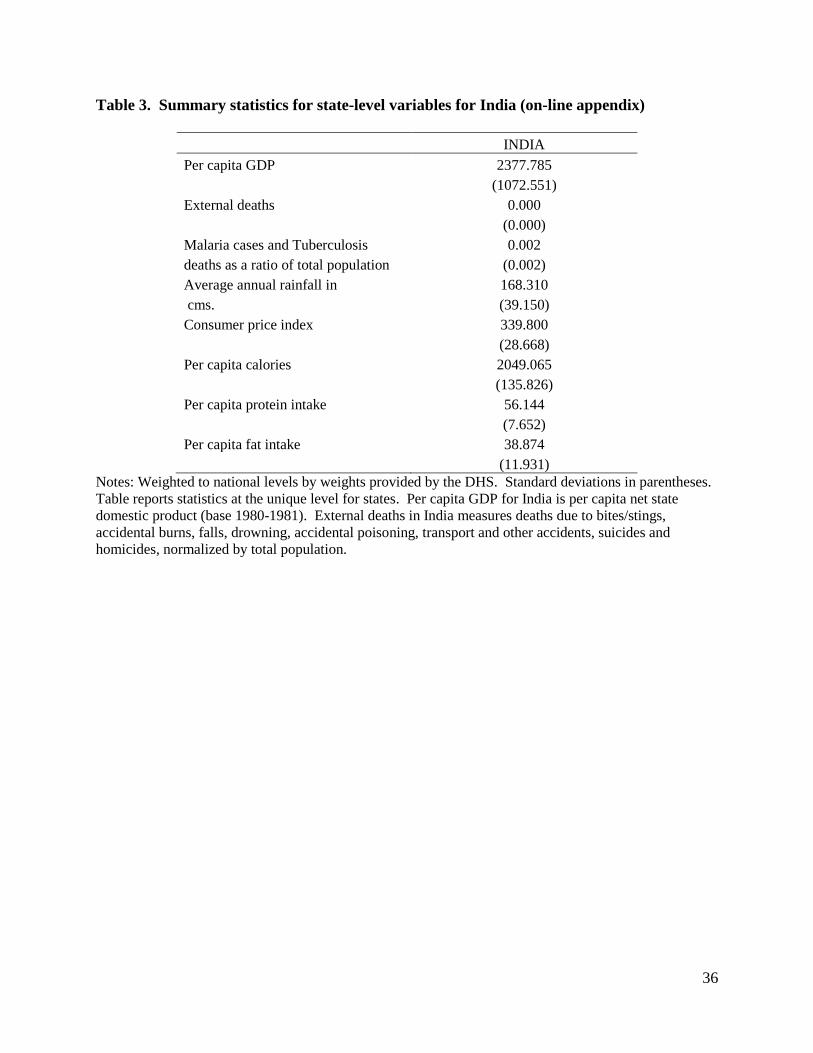
36
Table 3. Summary statistics for state-level variables for India (on-line appendix)
INDIA
Per capita GDP 2377.785
(1072.551)
External deaths 0.000
(0.000)
Malaria cases and Tuberculosis 0.002
deaths as a ratio of total population (0.002)
Average annual rainfall in 168.310
cms. (39.150)
Consumer price index 339.800
(28.668)
Per capita calories 2049.065
(135.826)
Per capita protein intake 56.144
(7.652)
Per capita fat intake 38.874
(11.931)
Notes: Weighted to national levels by weights provided by the DHS. Standard deviations in parentheses.
Table reports statistics at the unique level for states. Per capita GDP for India is per capita net state
domestic product (base 1980-1981). External deaths in India measures deaths due to bites/stings,
accidental burns, falls, drowning, accidental poisoning, transport and other accidents, suicides and
homicides, normalized by total population.
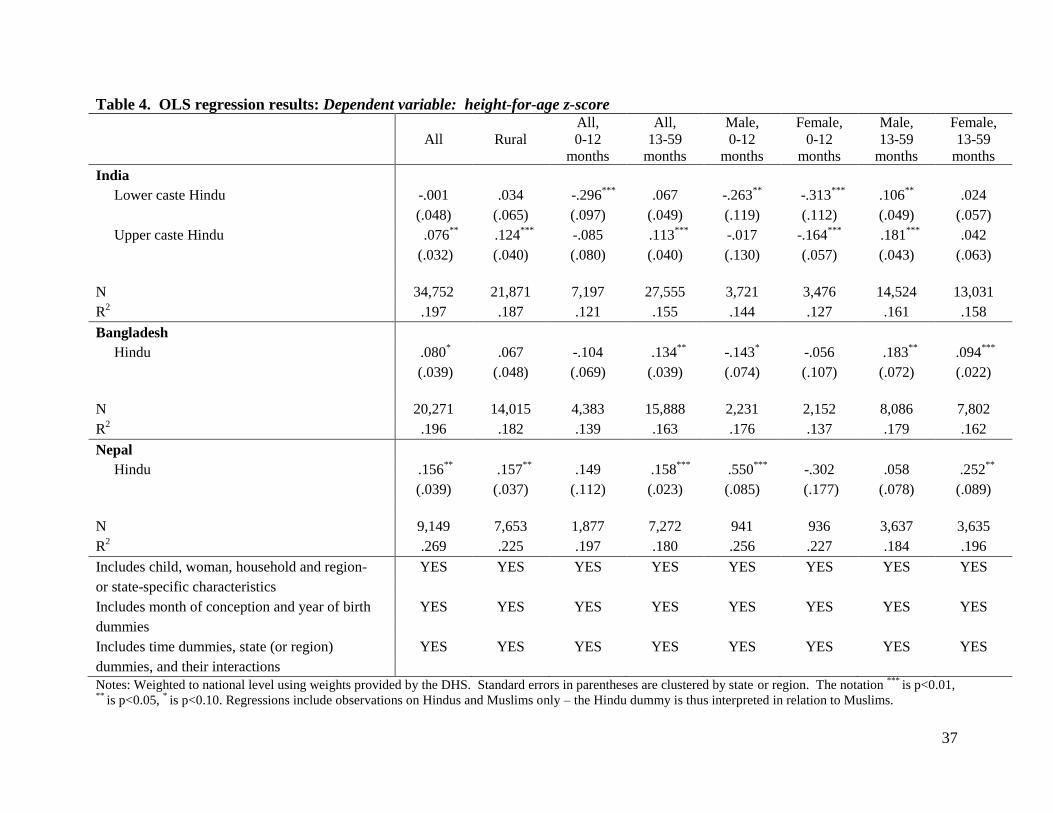
37
Table 4. OLS regression results: Dependent variable: height-for-age z-score
All Rural
All,
0-12
months
All,
13-59
months
Male,
0-12
months
Female,
0-12
months
Male,
13-59
months
Female,
13-59
months
India
Lower caste Hindu -.001 .034 -.296***
.067 -.263**
-.313***
.106**
.024
(.048) (.065) (.097) (.049) (.119) (.112) (.049) (.057)
Upper caste Hindu .076**
.124***
-.085 .113***
-.017 -.164***
.181***
.042
(.032) (.040) (.080) (.040) (.130) (.057) (.043) (.063)
N 34,752 21,871 7,197 27,555 3,721 3,476 14,524 13,031
R2 .197 .187 .121 .155 .144 .127 .161 .158
Bangladesh
Hindu .080*
.067 -.104 .134
** -.143
* -.056 .183
** .094
***
(.039) (.048) (.069) (.039) (.074) (.107) (.072) (.022)
N 20,271 14,015 4,383 15,888 2,231 2,152 8,086 7,802
R2 .196 .182 .139 .163 .176 .137 .179 .162
Nepal
Hindu .156**
.157
** .149 .158
*** .550
*** -.302 .058 .252
**
(.039) (.037) (.112) (.023) (.085) (.177) (.078) (.089)
N 9,149 7,653 1,877 7,272 941 936 3,637 3,635
R2 .269 .225 .197 .180 .256 .227 .184 .196
Includes child, woman, household and region- YES YES YES YES YES YES YES YES
or state-specific characteristics
Includes month of conception and year of birth YES YES YES YES YES YES YES YES
dummies
Includes time dummies, state (or region) YES YES YES YES YES YES YES YES
dummies, and their interactions
Notes: Weighted to national level using weights provided by the DHS. Standard errors in parentheses are clustered by state or region. The notation ***
is p<0.01, **
is p<0.05, * is p<0.10. Regressions include observations on Hindus and Muslims only – the Hindu dummy is thus interpreted in relation to Muslims.
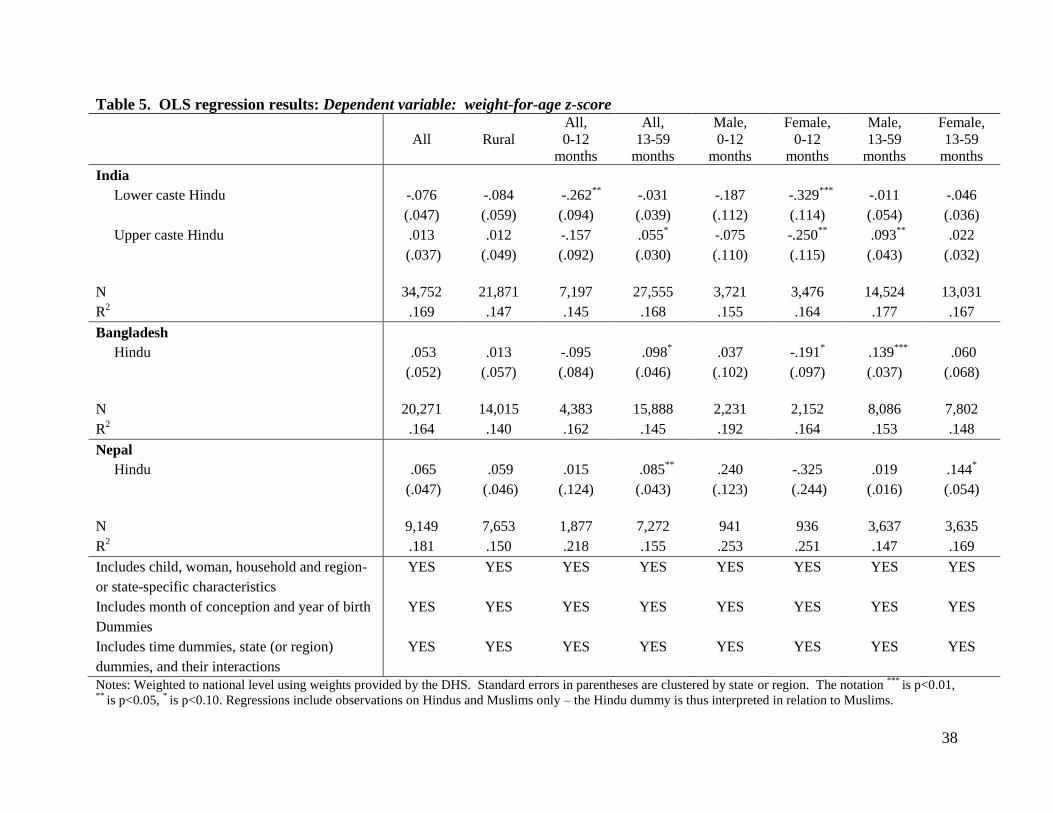
38
Table 5. OLS regression results: Dependent variable: weight-for-age z-score
All Rural
All,
0-12
months
All,
13-59
months
Male,
0-12
months
Female,
0-12
months
Male,
13-59
months
Female,
13-59
months
India
Lower caste Hindu -.076 -.084 -.262**
-.031 -.187 -.329***
-.011 -.046
(.047) (.059) (.094) (.039) (.112) (.114) (.054) (.036)
Upper caste Hindu .013 .012 -.157 .055
* -.075 -.250
** .093
** .022
(.037) (.049) (.092) (.030) (.110) (.115) (.043) (.032)
N 34,752 21,871 7,197 27,555 3,721 3,476 14,524 13,031
R2 .169 .147 .145 .168 .155 .164 .177 .167
Bangladesh
Hindu .053 .013 -.095 .098
* .037 -.191
* .139
*** .060
(.052) (.057) (.084) (.046) (.102) (.097) (.037) (.068)
N 20,271 14,015 4,383 15,888 2,231 2,152 8,086 7,802
R2 .164 .140 .162 .145 .192 .164 .153 .148
Nepal
Hindu .065 .059 .015 .085
** .240 -.325 .019 .144
*
(.047) (.046) (.124) (.043) (.123) (.244) (.016) (.054)
N 9,149 7,653 1,877 7,272 941 936 3,637 3,635
R2 .181 .150 .218 .155 .253 .251 .147 .169
Includes child, woman, household and region- YES YES YES YES YES YES YES YES
or state-specific characteristics
Includes month of conception and year of birth YES YES YES YES YES YES YES YES
Dummies
Includes time dummies, state (or region) YES YES YES YES YES YES YES YES
dummies, and their interactions
Notes: Weighted to national level using weights provided by the DHS. Standard errors in parentheses are clustered by state or region. The notation ***
is p<0.01, **
is p<0.05, * is p<0.10. Regressions include observations on Hindus and Muslims only – the Hindu dummy is thus interpreted in relation to Muslims.
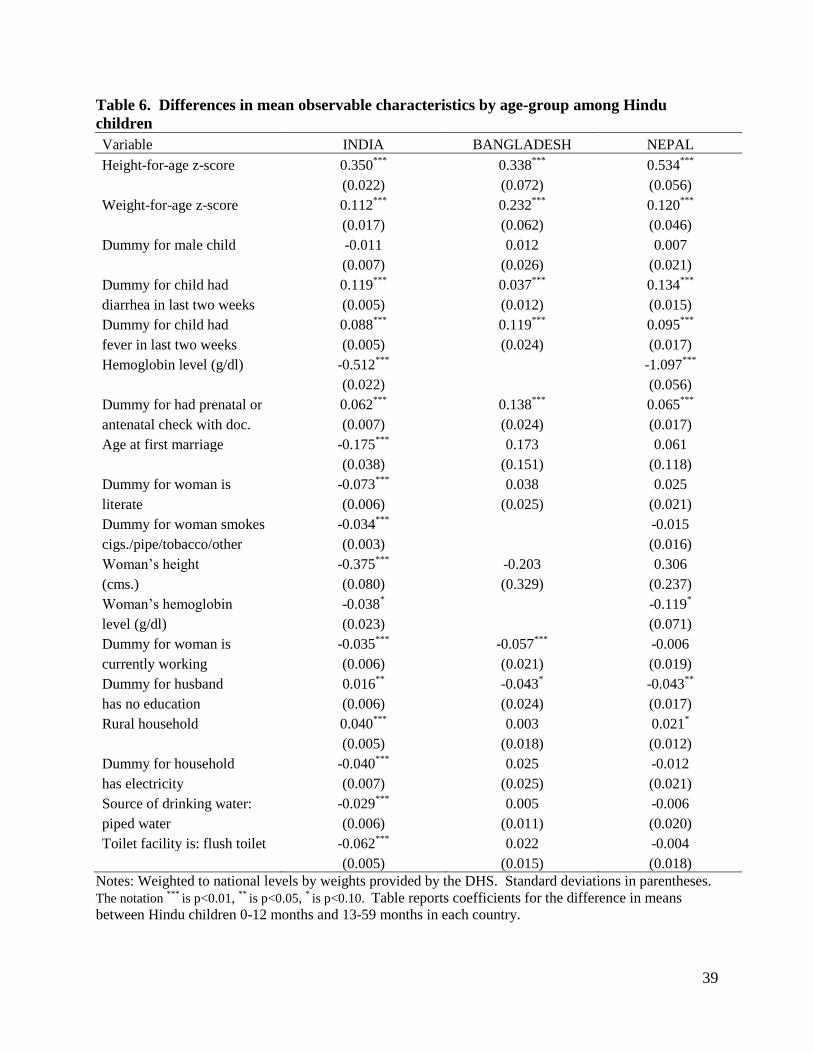
39
Table 6. Differences in mean observable characteristics by age-group among Hindu
children
Variable INDIA BANGLADESH NEPAL
Height-for-age z-score 0.350***
0.338***
0.534***
(0.022) (0.072) (0.056)
Weight-for-age z-score 0.112***
0.232***
0.120***
(0.017) (0.062) (0.046)
Dummy for male child -0.011 0.012 0.007
(0.007) (0.026) (0.021)
Dummy for child had 0.119***
0.037***
0.134***
diarrhea in last two weeks (0.005) (0.012) (0.015)
Dummy for child had 0.088***
0.119***
0.095***
fever in last two weeks (0.005) (0.024) (0.017)
Hemoglobin level (g/dl) -0.512***
-1.097***
(0.022)
(0.056)
Dummy for had prenatal or 0.062***
0.138***
0.065***
antenatal check with doc. (0.007) (0.024) (0.017)
Age at first marriage -0.175***
0.173 0.061
(0.038) (0.151) (0.118)
Dummy for woman is -0.073***
0.038 0.025
literate (0.006) (0.025) (0.021)
Dummy for woman smokes -0.034***
-0.015
cigs./pipe/tobacco/other (0.003)
(0.016)
Woman’s height -0.375***
-0.203 0.306
(cms.) (0.080) (0.329) (0.237)
Woman’s hemoglobin -0.038*
-0.119*
level (g/dl) (0.023)
(0.071)
Dummy for woman is -0.035***
-0.057***
-0.006
currently working (0.006) (0.021) (0.019)
Dummy for husband 0.016**
-0.043* -0.043
**
has no education (0.006) (0.024) (0.017)
Rural household 0.040***
0.003 0.021*
(0.005) (0.018) (0.012)
Dummy for household -0.040***
0.025 -0.012
has electricity (0.007) (0.025) (0.021)
Source of drinking water: -0.029***
0.005 -0.006
piped water (0.006) (0.011) (0.020)
Toilet facility is: flush toilet -0.062***
0.022 -0.004
(0.005) (0.015) (0.018)
Notes: Weighted to national levels by weights provided by the DHS. Standard deviations in parentheses.
The notation ***
is p<0.01, **
is p<0.05, * is p<0.10. Table reports coefficients for the difference in means
between Hindu children 0-12 months and 13-59 months in each country.
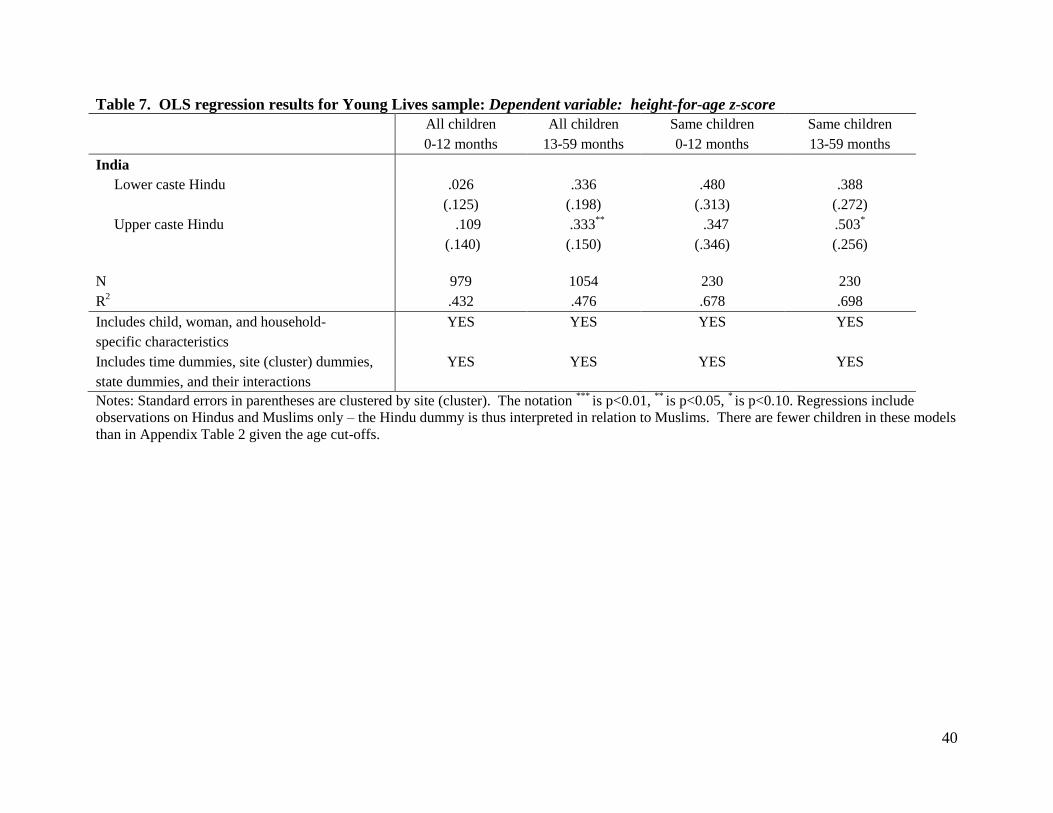
40
Table 7. OLS regression results for Young Lives sample: Dependent variable: height-for-age z-score
All children All children Same children Same children
0-12 months 13-59 months 0-12 months 13-59 months
India
Lower caste Hindu .026 .336 .480 .388
(.125) (.198) (.313) (.272)
Upper caste Hindu .109 .333
** .347 .503
*
(.140) (.150) (.346) (.256)
N 979 1054 230 230
R2 .432 .476 .678 .698
Includes child, woman, and household- YES YES YES YES
specific characteristics
Includes time dummies, site (cluster) dummies, YES YES YES YES
state dummies, and their interactions
Notes: Standard errors in parentheses are clustered by site (cluster). The notation ***
is p<0.01, **
is p<0.05, * is p<0.10. Regressions include
observations on Hindus and Muslims only – the Hindu dummy is thus interpreted in relation to Muslims. There are fewer children in these models
than in Appendix Table 2 given the age cut-offs.
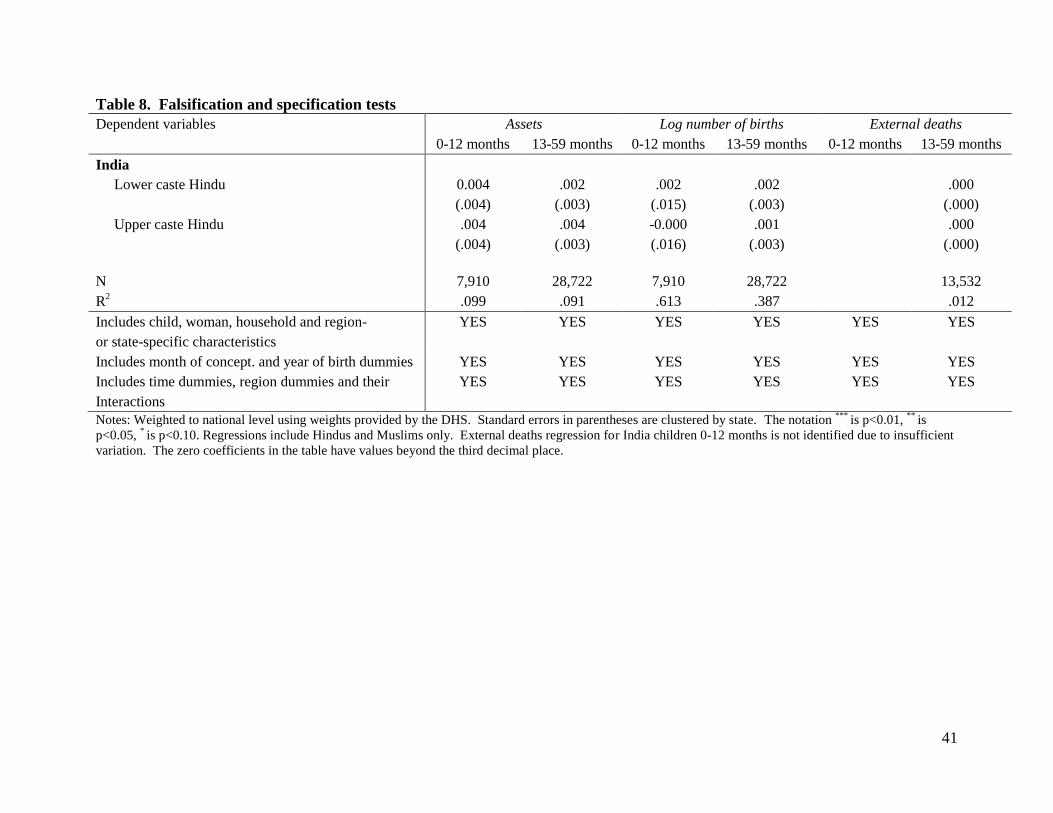
41
Table 8. Falsification and specification tests
Dependent variables Assets Log number of births External deaths
0-12 months 13-59 months 0-12 months 13-59 months 0-12 months 13-59 months
India
Lower caste Hindu 0.004 .002 .002 .002 .000
(.004) (.003) (.015) (.003) (.000)
Upper caste Hindu .004 .004 -0.000 .001 .000
(.004) (.003) (.016) (.003) (.000)
N 7,910 28,722 7,910 28,722 13,532
R2 .099 .091 .613 .387 .012
Includes child, woman, household and region- YES YES YES YES YES YES
or state-specific characteristics
Includes month of concept. and year of birth dummies YES YES YES YES YES YES
Includes time dummies, region dummies and their YES YES YES YES YES YES
Interactions
Notes: Weighted to national level using weights provided by the DHS. Standard errors in parentheses are clustered by state. The notation ***
is p<0.01, **
is
p<0.05, * is p<0.10. Regressions include Hindus and Muslims only. External deaths regression for India children 0-12 months is not identified due to insufficient
variation. The zero coefficients in the table have values beyond the third decimal place.
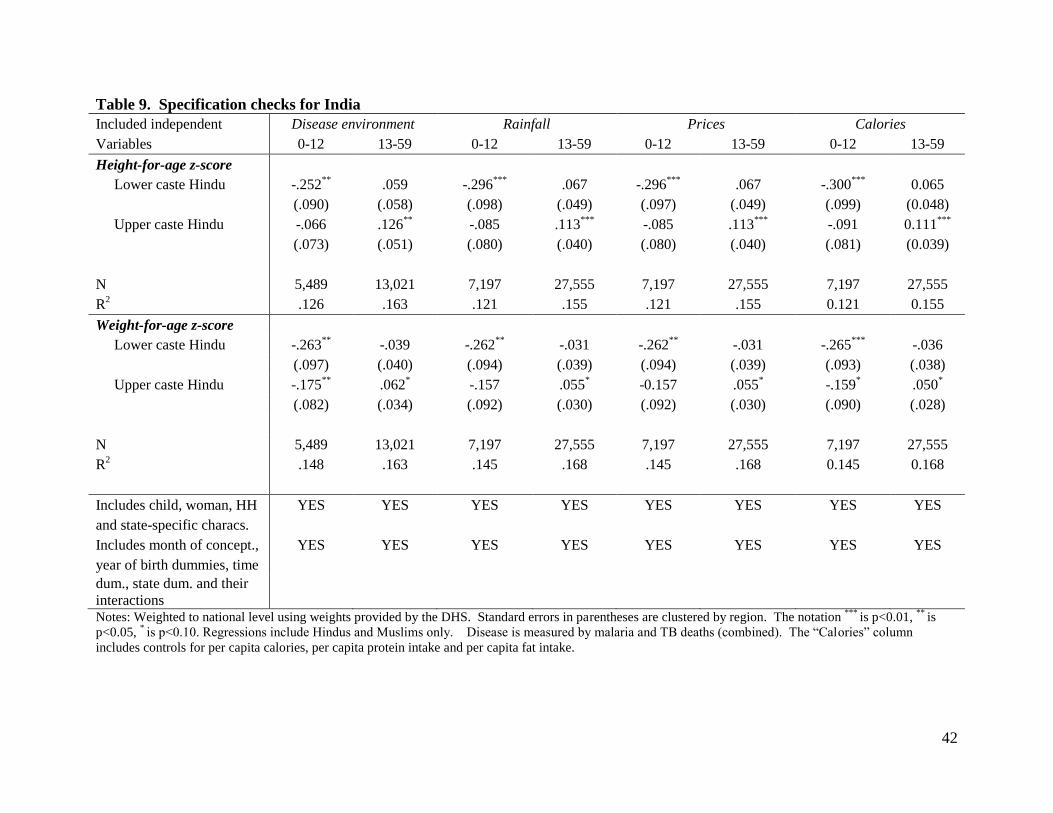
42
Table 9. Specification checks for India
Included independent Disease environment Rainfall Prices Calories
Variables 0-12 13-59 0-12 13-59 0-12 13-59 0-12 13-59
Height-for-age z-score
Lower caste Hindu -.252**
.059 -.296***
.067 -.296***
.067 -.300***
0.065
(.090) (.058) (.098) (.049) (.097) (.049) (.099) (0.048)
Upper caste Hindu -.066 .126**
-.085 .113***
-.085 .113***
-.091 0.111***
(.073) (.051) (.080) (.040) (.080) (.040) (.081) (0.039)
N 5,489 13,021 7,197 27,555 7,197 27,555 7,197 27,555
R2 .126 .163 .121 .155 .121 .155 0.121 0.155
Weight-for-age z-score
Lower caste Hindu -.263**
-.039 -.262**
-.031 -.262**
-.031 -.265***
-.036
(.097) (.040) (.094) (.039) (.094) (.039) (.093) (.038)
Upper caste Hindu -.175**
.062* -.157 .055
* -0.157 .055
* -.159
* .050
*
(.082) (.034) (.092) (.030) (.092) (.030) (.090) (.028)
N 5,489 13,021 7,197 27,555 7,197 27,555 7,197 27,555
R2 .148 .163 .145 .168 .145 .168 0.145 0.168
Includes child, woman, HH YES YES YES YES YES YES YES YES
and state-specific characs.
Includes month of concept., YES YES YES YES YES YES YES YES
year of birth dummies, time
dum., state dum. and their
interactions
Notes: Weighted to national level using weights provided by the DHS. Standard errors in parentheses are clustered by region. The notation ***
is p<0.01, **
is
p<0.05, * is p<0.10. Regressions include Hindus and Muslims only. Disease is measured by malaria and TB deaths (combined). The “Calories” column
includes controls for per capita calories, per capita protein intake and per capita fat intake.
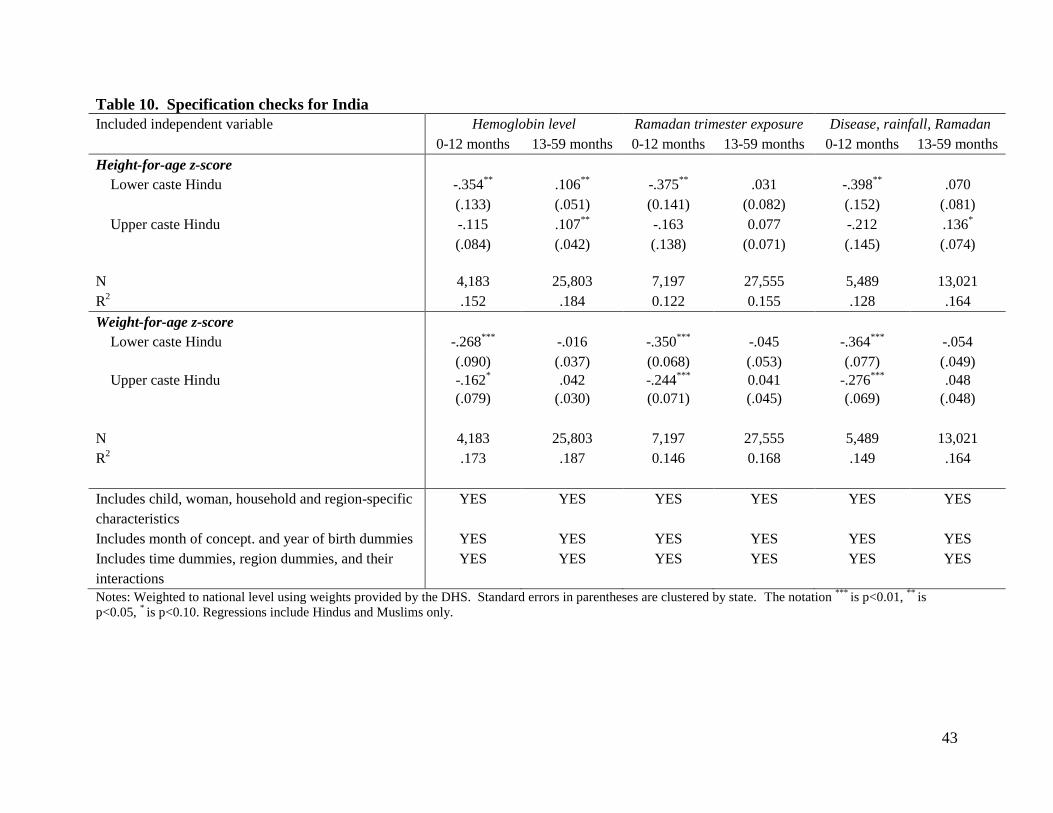
43
Table 10. Specification checks for India
Included independent variable Hemoglobin level Ramadan trimester exposure Disease, rainfall, Ramadan
0-12 months 13-59 months 0-12 months 13-59 months 0-12 months 13-59 months
Height-for-age z-score
Lower caste Hindu -.354**
.106**
-.375**
.031 -.398**
.070
(.133) (.051) (0.141) (0.082) (.152) (.081)
Upper caste Hindu -.115 .107**
-.163 0.077 -.212 .136*
(.084) (.042) (.138) (0.071) (.145) (.074)
N 4,183 25,803 7,197 27,555 5,489 13,021
R2 .152 .184 0.122 0.155 .128 .164
Weight-for-age z-score
Lower caste Hindu -.268***
-.016 -.350***
-.045 -.364***
-.054
(.090) (.037) (0.068) (.053) (.077) (.049)
Upper caste Hindu -.162* .042 -.244
*** 0.041 -.276
*** .048
(.079) (.030) (0.071) (.045) (.069) (.048)
N 4,183 25,803 7,197 27,555 5,489 13,021
R2 .173 .187 0.146 0.168 .149 .164
Includes child, woman, household and region-specific YES YES YES YES YES YES
characteristics
Includes month of concept. and year of birth dummies YES YES YES YES YES YES
Includes time dummies, region dummies, and their YES YES YES YES YES YES
interactions
Notes: Weighted to national level using weights provided by the DHS. Standard errors in parentheses are clustered by state. The notation ***
is p<0.01, **
is
p<0.05, * is p<0.10. Regressions include Hindus and Muslims only.
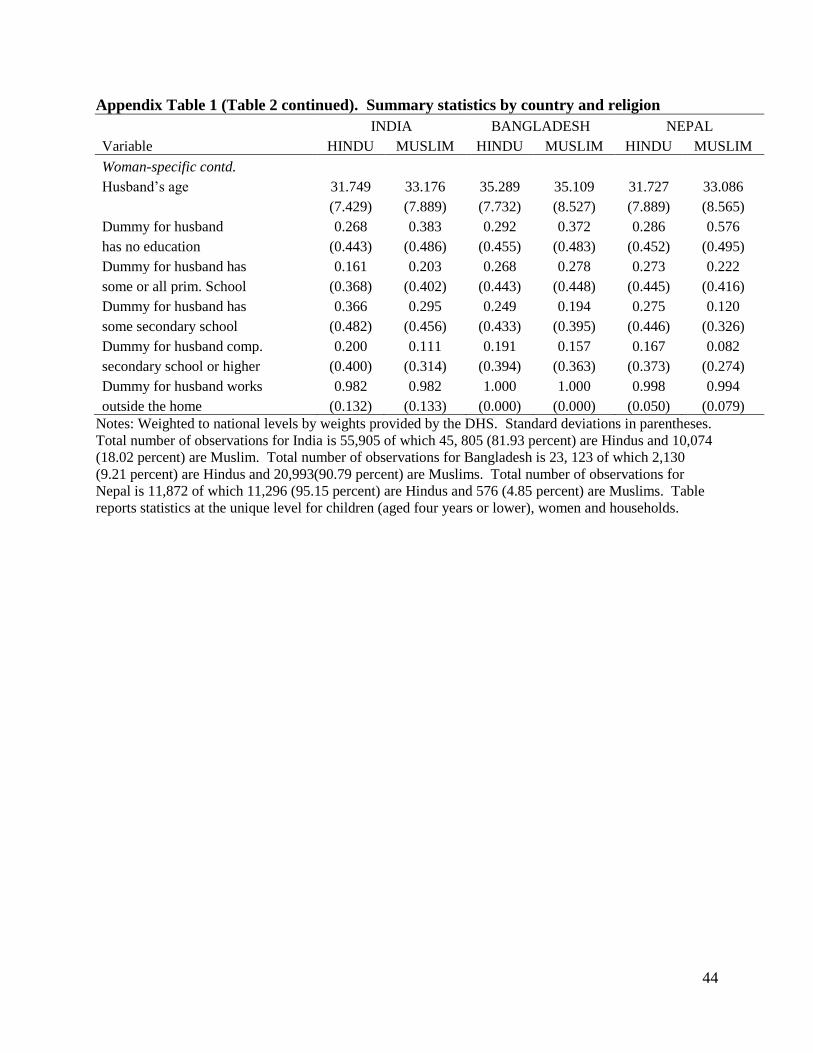
44
Appendix Table 1 (Table 2 continued). Summary statistics by country and religion
INDIA BANGLADESH NEPAL
Variable HINDU MUSLIM HINDU MUSLIM HINDU MUSLIM
Woman-specific contd.
Husband’s age 31.749 33.176 35.289 35.109 31.727 33.086
(7.429) (7.889) (7.732) (8.527) (7.889) (8.565)
Dummy for husband 0.268 0.383 0.292 0.372 0.286 0.576
has no education (0.443) (0.486) (0.455) (0.483) (0.452) (0.495)
Dummy for husband has 0.161 0.203 0.268 0.278 0.273 0.222
some or all prim. School (0.368) (0.402) (0.443) (0.448) (0.445) (0.416)
Dummy for husband has 0.366 0.295 0.249 0.194 0.275 0.120
some secondary school (0.482) (0.456) (0.433) (0.395) (0.446) (0.326)
Dummy for husband comp. 0.200 0.111 0.191 0.157 0.167 0.082
secondary school or higher (0.400) (0.314) (0.394) (0.363) (0.373) (0.274)
Dummy for husband works 0.982 0.982 1.000 1.000 0.998 0.994
outside the home (0.132) (0.133) (0.000) (0.000) (0.050) (0.079)
Notes: Weighted to national levels by weights provided by the DHS. Standard deviations in parentheses.
Total number of observations for India is 55,905 of which 45, 805 (81.93 percent) are Hindus and 10,074
(18.02 percent) are Muslim. Total number of observations for Bangladesh is 23, 123 of which 2,130
(9.21 percent) are Hindus and 20,993(90.79 percent) are Muslims. Total number of observations for
Nepal is 11,872 of which 11,296 (95.15 percent) are Hindus and 576 (4.85 percent) are Muslims. Table
reports statistics at the unique level for children (aged four years or lower), women and households.
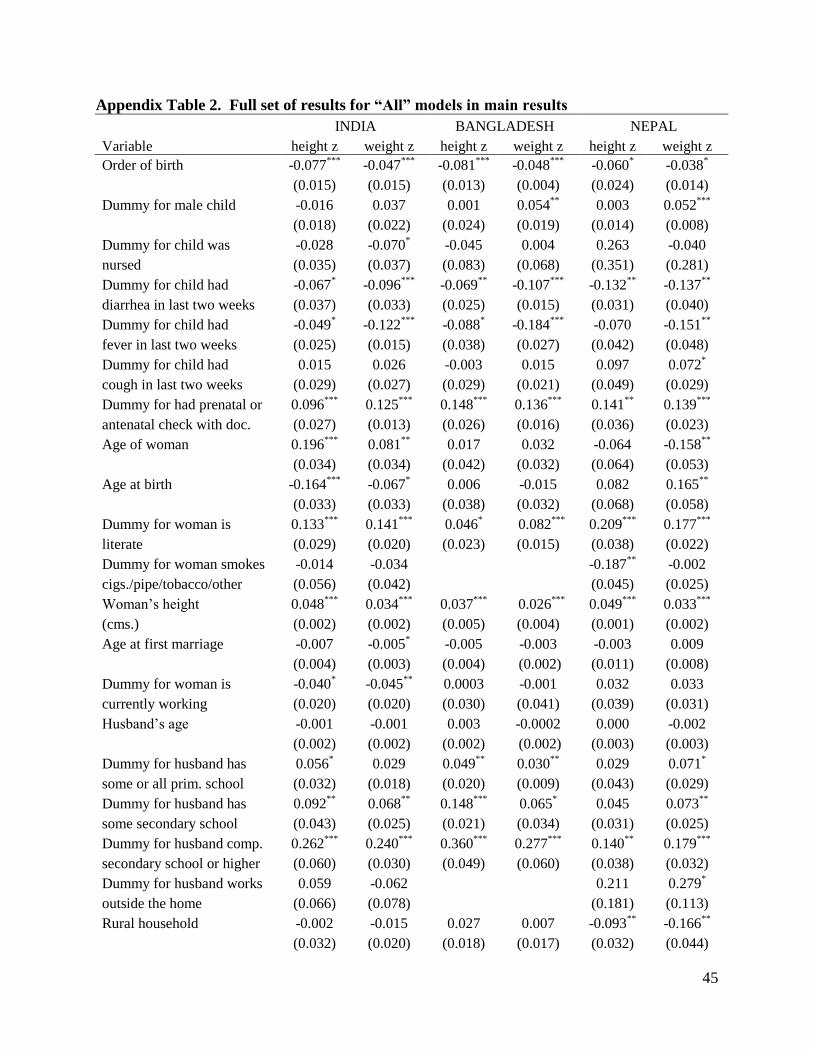
45
Appendix Table 2. Full set of results for “All” models in main results
INDIA BANGLADESH NEPAL
Variable height z weight z height z weight z height z weight z
Order of birth -0.077***
-0.047***
-0.081***
-0.048***
-0.060* -0.038
*
(0.015) (0.015) (0.013) (0.004) (0.024) (0.014)
Dummy for male child -0.016 0.037 0.001 0.054**
0.003 0.052***
(0.018) (0.022) (0.024) (0.019) (0.014) (0.008)
Dummy for child was -0.028 -0.070* -0.045 0.004 0.263 -0.040
nursed (0.035) (0.037) (0.083) (0.068) (0.351) (0.281)
Dummy for child had -0.067* -0.096
*** -0.069
** -0.107
*** -0.132
** -0.137
**
diarrhea in last two weeks (0.037) (0.033) (0.025) (0.015) (0.031) (0.040)
Dummy for child had -0.049* -0.122
*** -0.088
* -0.184
*** -0.070 -0.151
**
fever in last two weeks (0.025) (0.015) (0.038) (0.027) (0.042) (0.048)
Dummy for child had 0.015 0.026 -0.003 0.015 0.097 0.072*
cough in last two weeks (0.029) (0.027) (0.029) (0.021) (0.049) (0.029)
Dummy for had prenatal or 0.096***
0.125***
0.148***
0.136***
0.141**
0.139***
antenatal check with doc. (0.027) (0.013) (0.026) (0.016) (0.036) (0.023)
Age of woman 0.196***
0.081**
0.017 0.032 -0.064 -0.158**
(0.034) (0.034) (0.042) (0.032) (0.064) (0.053)
Age at birth -0.164***
-0.067* 0.006 -0.015 0.082 0.165
**
(0.033) (0.033) (0.038) (0.032) (0.068) (0.058)
Dummy for woman is 0.133***
0.141***
0.046* 0.082
*** 0.209
*** 0.177
***
literate (0.029) (0.020) (0.023) (0.015) (0.038) (0.022)
Dummy for woman smokes -0.014 -0.034
-0.187**
-0.002
cigs./pipe/tobacco/other (0.056) (0.042)
(0.045) (0.025)
Woman’s height 0.048***
0.034***
0.037***
0.026***
0.049***
0.033***
(cms.) (0.002) (0.002) (0.005) (0.004) (0.001) (0.002)
Age at first marriage -0.007 -0.005* -0.005 -0.003 -0.003 0.009
(0.004) (0.003) (0.004) (0.002) (0.011) (0.008)
Dummy for woman is -0.040* -0.045
** 0.0003 -0.001 0.032 0.033
currently working (0.020) (0.020) (0.030) (0.041) (0.039) (0.031)
Husband’s age -0.001 -0.001 0.003 -0.0002 0.000 -0.002
(0.002) (0.002) (0.002) (0.002) (0.003) (0.003)
Dummy for husband has 0.056* 0.029 0.049
** 0.030
** 0.029 0.071
*
some or all prim. school (0.032) (0.018) (0.020) (0.009) (0.043) (0.029)
Dummy for husband has 0.092**
0.068**
0.148***
0.065* 0.045 0.073
**
some secondary school (0.043) (0.025) (0.021) (0.034) (0.031) (0.025)
Dummy for husband comp. 0.262***
0.240***
0.360***
0.277***
0.140**
0.179***
secondary school or higher (0.060) (0.030) (0.049) (0.060) (0.038) (0.032)
Dummy for husband works 0.059 -0.062
0.211 0.279*
outside the home (0.066) (0.078)
(0.181) (0.113)
Rural household -0.002 -0.015 0.027 0.007 -0.093**
-0.166**
(0.032) (0.020) (0.018) (0.017) (0.032) (0.044)
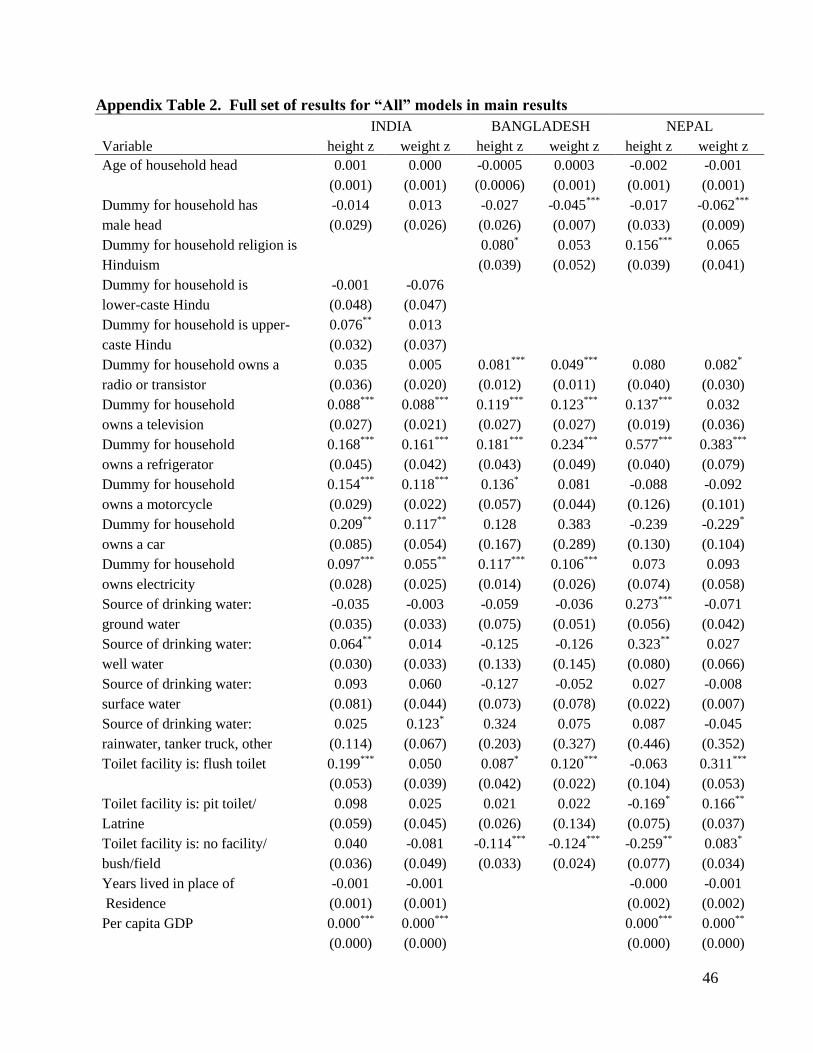
46
Appendix Table 2. Full set of results for “All” models in main results
INDIA BANGLADESH NEPAL
Variable height z weight z height z weight z height z weight z
Age of household head 0.001 0.000 -0.0005 0.0003 -0.002 -0.001
(0.001) (0.001) (0.0006) (0.001) (0.001) (0.001)
Dummy for household has -0.014 0.013 -0.027 -0.045***
-0.017 -0.062***
male head (0.029) (0.026) (0.026) (0.007) (0.033) (0.009)
Dummy for household religion is 0.080* 0.053 0.156
*** 0.065
Hinduism (0.039) (0.052) (0.039) (0.041)
Dummy for household is -0.001 -0.076
lower-caste Hindu (0.048) (0.047)
Dummy for household is upper- 0.076**
0.013
caste Hindu (0.032) (0.037)
Dummy for household owns a 0.035 0.005 0.081***
0.049***
0.080 0.082*
radio or transistor (0.036) (0.020) (0.012) (0.011) (0.040) (0.030)
Dummy for household 0.088***
0.088***
0.119***
0.123***
0.137***
0.032
owns a television (0.027) (0.021) (0.027) (0.027) (0.019) (0.036)
Dummy for household 0.168***
0.161***
0.181***
0.234***
0.577***
0.383***
owns a refrigerator (0.045) (0.042) (0.043) (0.049) (0.040) (0.079)
Dummy for household 0.154***
0.118***
0.136* 0.081 -0.088 -0.092
owns a motorcycle (0.029) (0.022) (0.057) (0.044) (0.126) (0.101)
Dummy for household 0.209**
0.117**
0.128 0.383 -0.239 -0.229*
owns a car (0.085) (0.054) (0.167) (0.289) (0.130) (0.104)
Dummy for household 0.097***
0.055**
0.117***
0.106***
0.073 0.093
owns electricity (0.028) (0.025) (0.014) (0.026) (0.074) (0.058)
Source of drinking water: -0.035 -0.003 -0.059 -0.036 0.273***
-0.071
ground water (0.035) (0.033) (0.075) (0.051) (0.056) (0.042)
Source of drinking water: 0.064**
0.014 -0.125 -0.126 0.323**
0.027
well water (0.030) (0.033) (0.133) (0.145) (0.080) (0.066)
Source of drinking water: 0.093 0.060 -0.127 -0.052 0.027 -0.008
surface water (0.081) (0.044) (0.073) (0.078) (0.022) (0.007)
Source of drinking water: 0.025 0.123* 0.324 0.075 0.087 -0.045
rainwater, tanker truck, other (0.114) (0.067) (0.203) (0.327) (0.446) (0.352)
Toilet facility is: flush toilet 0.199***
0.050 0.087* 0.120
*** -0.063 0.311
***
(0.053) (0.039) (0.042) (0.022) (0.104) (0.053)
Toilet facility is: pit toilet/ 0.098 0.025 0.021 0.022 -0.169* 0.166
**
Latrine (0.059) (0.045) (0.026) (0.134) (0.075) (0.037)
Toilet facility is: no facility/ 0.040 -0.081 -0.114***
-0.124***
-0.259**
0.083*
bush/field (0.036) (0.049) (0.033) (0.024) (0.077) (0.034)
Years lived in place of -0.001 -0.001 -0.000 -0.001
Residence (0.001) (0.001) (0.002) (0.002)
Per capita GDP 0.000***
0.000***
0.000***
0.000**
(0.000) (0.000) (0.000) (0.000)
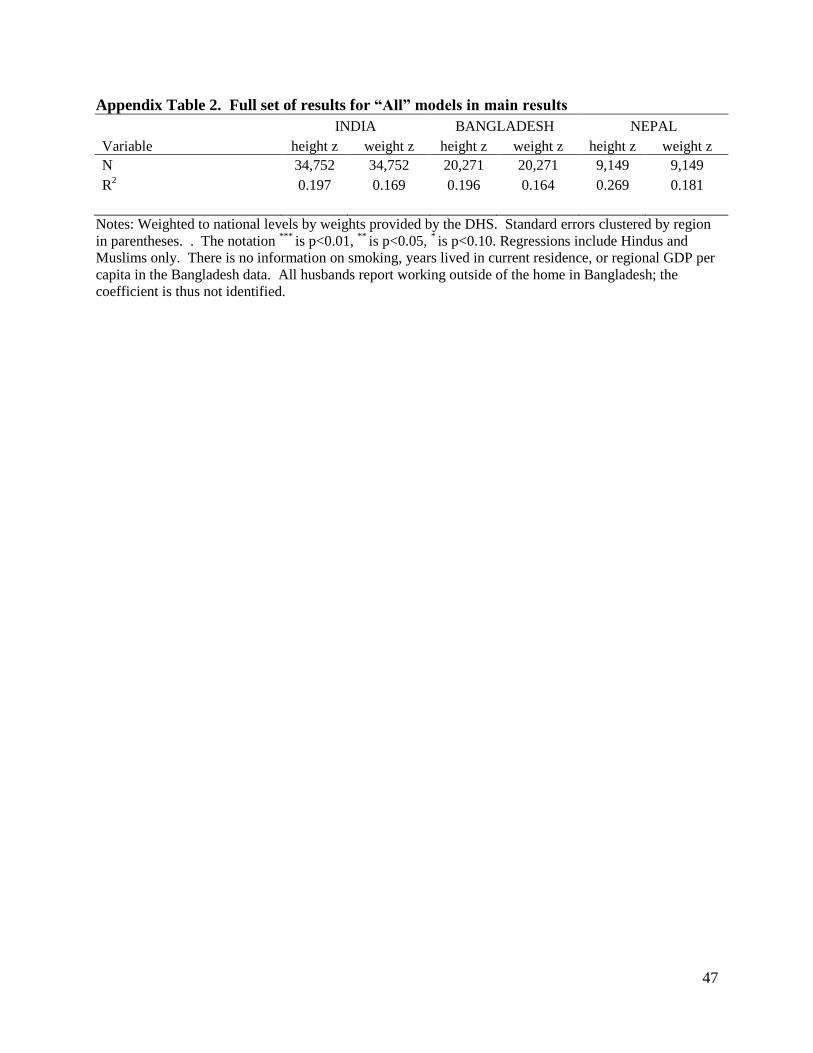
47
Appendix Table 2. Full set of results for “All” models in main results
INDIA BANGLADESH NEPAL
Variable height z weight z height z weight z height z weight z
N 34,752 34,752 20,271 20,271 9,149 9,149
R2 0.197 0.169 0.196 0.164 0.269 0.181
Notes: Weighted to national levels by weights provided by the DHS. Standard errors clustered by region
in parentheses. . The notation ***
is p<0.01, **
is p<0.05, * is p<0.10. Regressions include Hindus and
Muslims only. There is no information on smoking, years lived in current residence, or regional GDP per
capita in the Bangladesh data. All husbands report working outside of the home in Bangladesh; the
coefficient is thus not identified.
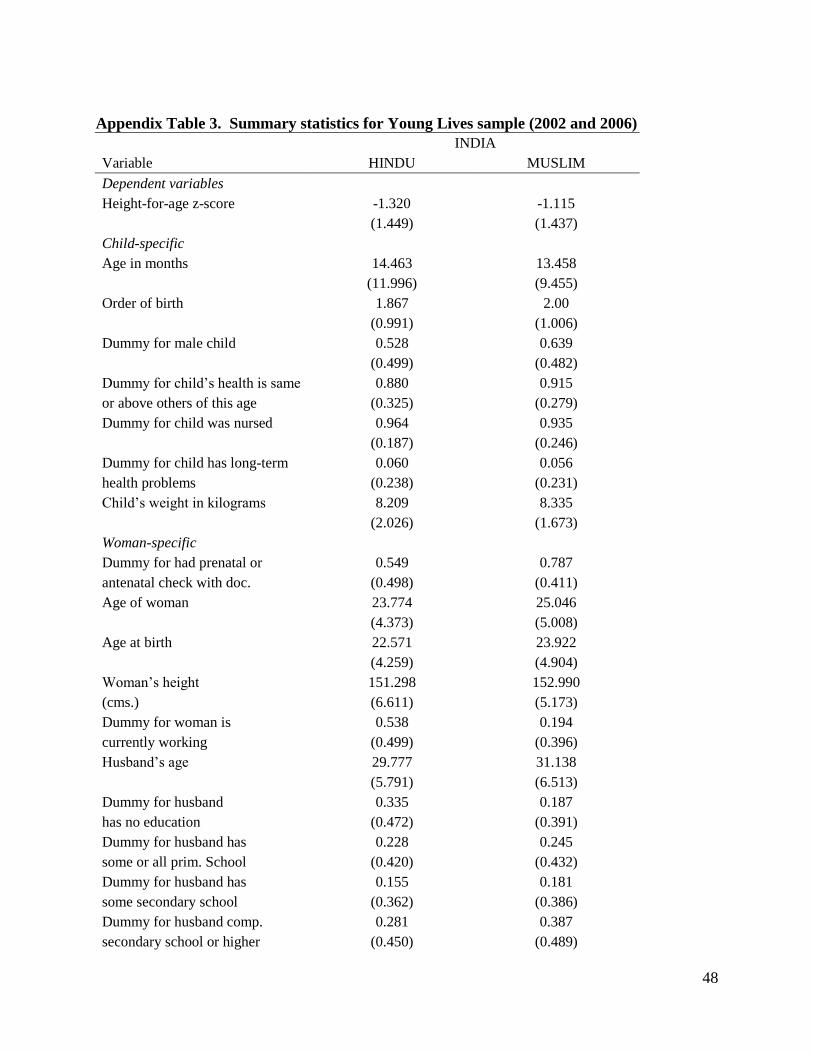
48
Appendix Table 3. Summary statistics for Young Lives sample (2002 and 2006)
INDIA
Variable HINDU MUSLIM
Dependent variables
Height-for-age z-score -1.320 -1.115
(1.449) (1.437)
Child-specific
Age in months 14.463 13.458
(11.996) (9.455)
Order of birth 1.867 2.00
(0.991) (1.006)
Dummy for male child 0.528 0.639
(0.499) (0.482)
Dummy for child’s health is same 0.880 0.915
or above others of this age (0.325) (0.279)
Dummy for child was nursed 0.964 0.935
(0.187) (0.246)
Dummy for child has long-term 0.060 0.056
health problems (0.238) (0.231)
Child’s weight in kilograms 8.209 8.335
(2.026) (1.673)
Woman-specific
Dummy for had prenatal or 0.549 0.787
antenatal check with doc. (0.498) (0.411)
Age of woman 23.774 25.046
(4.373) (5.008)
Age at birth 22.571 23.922
(4.259) (4.904)
Woman’s height 151.298 152.990
(cms.) (6.611) (5.173)
Dummy for woman is 0.538 0.194
currently working (0.499) (0.396)
Husband’s age 29.777 31.138
(5.791) (6.513)
Dummy for husband 0.335 0.187
has no education (0.472) (0.391)
Dummy for husband has 0.228 0.245
some or all prim. School (0.420) (0.432)
Dummy for husband has 0.155 0.181
some secondary school (0.362) (0.386)
Dummy for husband comp. 0.281 0.387
secondary school or higher (0.450) (0.489)
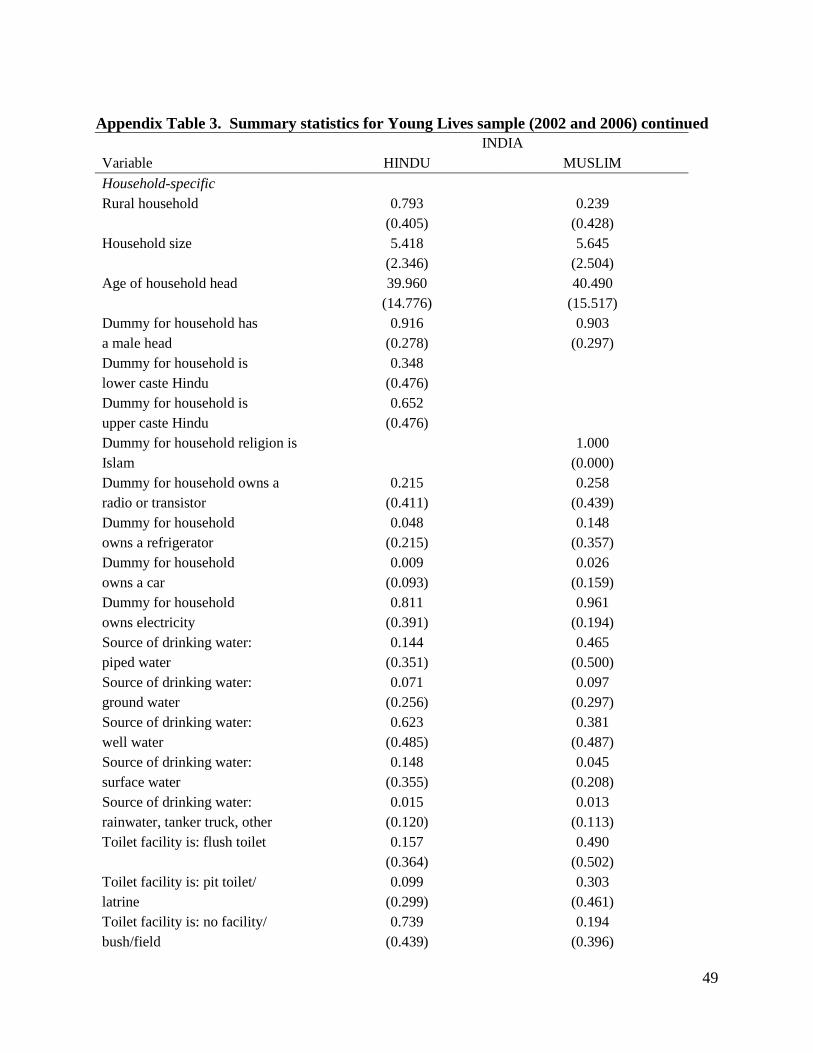
49
Appendix Table 3. Summary statistics for Young Lives sample (2002 and 2006) continued
INDIA
Variable HINDU MUSLIM
Household-specific
Rural household 0.793 0.239
(0.405) (0.428)
Household size 5.418 5.645
(2.346) (2.504)
Age of household head 39.960 40.490
(14.776) (15.517)
Dummy for household has 0.916 0.903
a male head (0.278) (0.297)
Dummy for household is 0.348
lower caste Hindu (0.476)
Dummy for household is 0.652
upper caste Hindu (0.476)
Dummy for household religion is 1.000
Islam (0.000)
Dummy for household owns a 0.215 0.258
radio or transistor (0.411) (0.439)
Dummy for household 0.048 0.148
owns a refrigerator (0.215) (0.357)
Dummy for household 0.009 0.026
owns a car (0.093) (0.159)
Dummy for household 0.811 0.961
owns electricity (0.391) (0.194)
Source of drinking water: 0.144 0.465
piped water (0.351) (0.500)
Source of drinking water: 0.071 0.097
ground water (0.256) (0.297)
Source of drinking water: 0.623 0.381
well water (0.485) (0.487)
Source of drinking water: 0.148 0.045
surface water (0.355) (0.208)
Source of drinking water: 0.015 0.013
rainwater, tanker truck, other (0.120) (0.113)
Toilet facility is: flush toilet 0.157 0.490
(0.364) (0.502)
Toilet facility is: pit toilet/ 0.099 0.303
latrine (0.299) (0.461)
Toilet facility is: no facility/ 0.739 0.194
bush/field (0.439) (0.396)
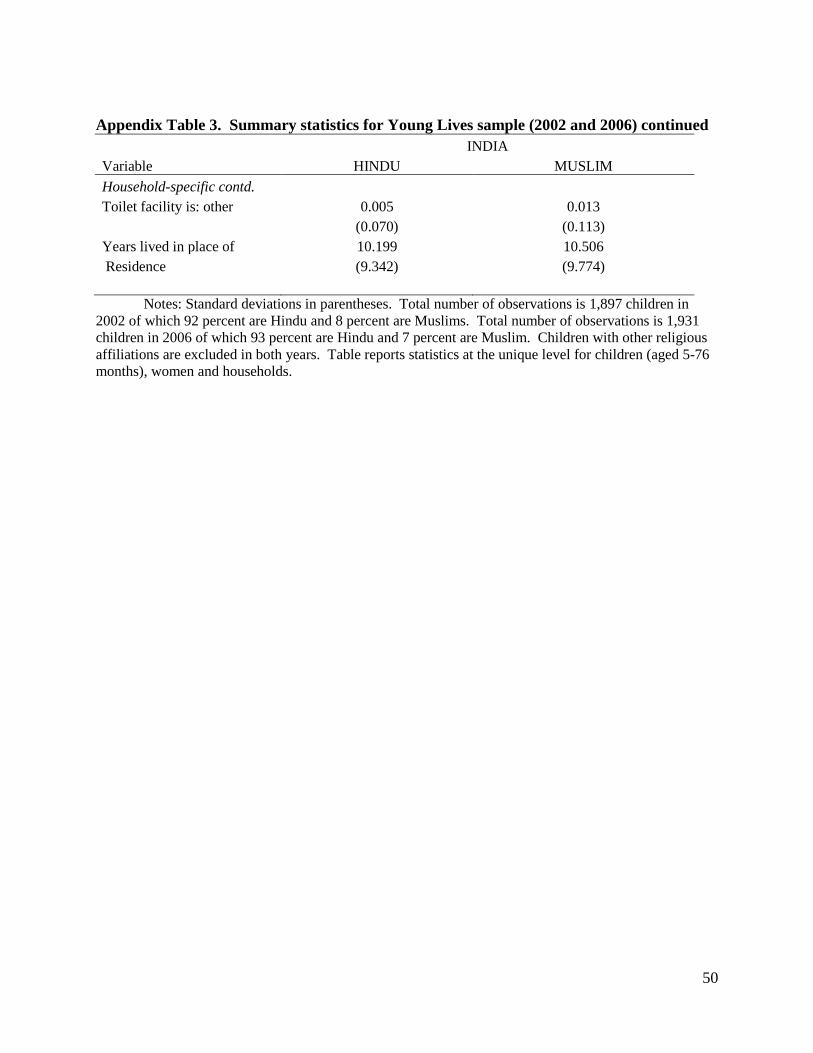
50
Appendix Table 3. Summary statistics for Young Lives sample (2002 and 2006) continued
INDIA
Variable HINDU MUSLIM
Household-specific contd.
Toilet facility is: other 0.005 0.013
(0.070) (0.113)
Years lived in place of 10.199 10.506
Residence (9.342) (9.774)
Notes: Standard deviations in parentheses. Total number of observations is 1,897 children in
2002 of which 92 percent are Hindu and 8 percent are Muslims. Total number of observations is 1,931
children in 2006 of which 93 percent are Hindu and 7 percent are Muslim. Children with other religious
affiliations are excluded in both years. Table reports statistics at the unique level for children (aged 5-76
months), women and households.