Embed Size (px)
Citation preview

The “State” of Persons with Disabilities in India
Nidhiya Menon, Susan Parish and Roderick Rose
Version: May 10, 2012
Abstract
Among countries with comparable levels of income, India has one of the more progressive
disability policy frameworks. However, people with disabilities in India are subject to multiple
disadvantages. This paper focuses on state-level variations in outcomes for people with
disabilities to provide an explanation for the stark contrast between the liberal laws on paper and
the challenges faced by people with disabilities in practice. Using average monthly per capita
expenditure as an indicator of economic well-being, instrumental variables Wald estimator with
state fixed-effects results indicate that households with members with disabilities have
expenditures that are 14 percent lower as compared to households with able members. This
effect is most pronounced among families with male adults and children with disabilities, and in
states that are relatively poor, relatively more urban, those that experience extremes in annual
rainfall and temperature, and those that have low to medium levels of inequality.
Keywords: Disability, India, Monthly Expenditure, State Variations, Poverty, Inequality
JEL Codes: O12, I15, I18
____________________________________________________________________________
Thanks to Sarita Bhalotra, Alka Bhargava, Jeanine Braithwaite, Deon Filmer, Marty Krauss, P.S.
Meena, Philip O’Keefe and Aleksandra Posarac for helpful suggestions and comments. Menon
thanks a faculty research grant from Brandeis University. The usual disclaimer applies.
Corresponding author: Nidhiya Menon, Associate Professor of Economics, Department of
Economics & IBS, MS 021, Brandeis University, Waltham, MA 02454. Tel.: 781.736.2230.
Email: [email protected]. Co-authors: Susan Parish, Nancy Lurie Marks Professor of
Disability Policy and Director, Lurie Institute for Disability Policy, Heller School for Social
Policy and Management, MS 035, Brandeis University, Waltham, MA 02454. Email:
[email protected]. Roderick A. Rose, Senior Research Associate, Carolina Institute for Public
Policy, University of North Carolina, Chapel Hill, 140 Friday Center Drive, Chapel Hill, NC
27517. Email: [email protected].

1
I. Introduction
Despite differing estimates, empirical evidence as of 2007 suggests that between 4 to 8
percent of the population in India is comprised of people with disabilities (World Bank 2007).
This translates into 40-90 million people, a substantial number. People with disabilities in India
are subject to multiple deprivations and limited opportunities in several dimensions of their lives.
Households with people with disabilities are 25 percent less likely to report having 3 meals per
day year around, more likely to have members who are illiterate and children who are not
enrolled in school, have much lower employment rates, and have limited awareness of
entitlements and services available by law for people with disabilities (World Bank 2007). Not
surprisingly, these households are over-represented among the poor and socially marginalized.
The experiences of people with disabilities are in stark contrast to the fact that certain
government departments in India such as the education sector have been viewed as progressive
in their delivery of options to children with distinctive needs (World Bank 2007). Disability
statistics were collected in the Census of India from as early as the late nineteenth century and
the country had special schools that catered to the needs of people with disabilities from around
the same time period. However, integration of people with disabilities and policy commitment to
their participation as equals in society occurred only twenty-five years ago with the passage of
four important laws. These included the Mental Health Act of 1987, the Rehabilitation Council
of India Act of 1992, the People with Disabilities (Equal Opportunities, Protection of Rights and
Full Participation) Act of 1995 (PWD Act), and the National Trust for Welfare of Persons with
Autism, Cerebral Palsy, Mental Retardation and Multiple Disabilities Act of 1999 (World Bank
2007). India also ratified the UN Convention on the Rights of Persons with Disabilities in 2007.
The PWD Act of 1995 was the key central legislation that provided certain entitlements in the

2
areas of education, employment and affirmative action, and other privileges in prevention and
early detection of disabilities. The PWD Act of 1995 also provided for non-discrimination in
access to public modes of transportation such as railways and buses by requiring that these
vehicles be modified in ways to make them accessible to people in wheelchairs, and called for
the installation of ramps in government buildings and public primary health centers as well as the
provision of braille signs and auditory signals at traffic lights and intersections. Under the PWD
Act, the establishment of these entitlements to persons with disabilities was conditional on being
“within (the government’s) limits of economic capacity and development” (World Bank 2007).
How does one reconcile the vulnerabilities of Indians with disabilities in practice with the
relatively advanced set of law (for a developing country) on paper? This is an important
question since widespread hardship among people with disabilities persists in India despite the
extant legislation. Under the Constitution of India, obligations to people with disabilities fall
under the jurisdiction of state governments and the State List under “Relief of people with
disabilities and unemployable” (World Bank 2007).1 Hence, state governments in India are
primarily responsible for implementing laws and distributing social welfare benefits to people
with disabilities. States also have considerable leeway in independently deciding priorities
among issues related to disability, and in creating legislation suited to the context of their
environment’s socio-cultural background (Bagchi 2003, Sinha 2004). By using empirical
methods that recognize the role of states, this research documents considerable variation across
sub-national entities in a basic measure of economic well-being – average monthly per capita
expenditures in households with people with disabilities. The results demonstrate that while a
1 Under India’s federal set-up, the State List consists of 66 topics that state governments may legislate on
independent of the central government. “Relief of people with disabilities and unemployable” is one of
these 66 topics.

3
comprehensive set of commitments to people with disabilities exists by law in India, some states
have been more effective than others in the delivery of their obligations.
Evidence of considerable variability at the state-level in providing for people with
disabilities is evident when one notes that some states have been pro-active in increasing
awareness among people with disabilities about commitments and entitlements (Tamil Nadu,
Karnataka, and New Delhi) whereas others have lagged in implementing many of the basic
entitlements enshrined in the PWD Act of 1995 (Bihar, Maharashtra, Orissa, Uttar Pradesh). In
fact in Uttar Pradesh which is the most populous state in India, 80 percent of households with
people with disabilities were unaware of the process of certification as a person with disability
(World Bank 2007). Further, there appears to be little correlation between the institutional
capacity of a state and provision of services to persons with impairments. For example
Chhattisgarh, a relatively new state, has a well-thought out state-level disability policy that is
often touted within India as a “best practice framework” and model for other states.
Alternatively Gujarat, a more established state, has demonstrated little commitment in
implementing a key requirement of the PWD Act of 1995 (has had only one meeting to facilitate
center-state coordination in distribution of benefits as of 2003) (World Bank 2007).
This study examines relative differences in economic well-being among households with
members with disabilities and those without by using average monthly per capita expenditure as
a benchmark measure. Among households with member(s) with disabilities, we investigate how
expenditure varies by gender of the person with disabilities and by age (whether burden is
different in families with children with disabilities). We begin by using a method that allows sub-
national entities to exhibit different trends in the cross-section (random coefficients regressions).
These household comparisons are conditional on state-specific variations in the recognition of
4
challenges faced by people with disabilities in India, and state-wise differences in delivery of
services to this population.2 Next, we implement an instrumental variables Wald estimator
methodology that corrects for the possibility that disability is endogenous. The study concludes
by reporting results at different percentiles of state characteristics including net domestic
product, ratio of rural to total population, average rainfall and temperature, and population
weighted average inequality, in order to highlight the relative position where the burden for
Indian families with persons with disabilities is greatest.
Results from the state-level random coefficient regression models show that in a
comparison of households with no people with disabilities, households with members with
disabilities have monthly per capita expenditure that is lower by about Rupees 212 (about 23
percent of overall average per capita expenditures). Estimates from linear regression models
(OLS) with state fixed-effects are similar in magnitude to those obtained from the random
coefficients empirical framework. Wald estimator results that correct for endogeneity in the
status of disability indicate that the random coefficient and OLS with state fixed-effects
estimates are positively biased. These estimates suggest that as compared to the reference group
of households with able members, households with persons with disabilities have average
expenditures that are lower by about Rupees 89 (approximately 14 percent of overall per capita
expenditures). Within the group of households that have members with disabilities, those with
female individuals with disabilities have per capita expenditures that are higher than households
with male individuals with disabilities. This is striking given that disability is unlikely to
discriminate by gender and thus there is little reason to believe that impairments afflicting men
are more severe than those afflicting women. The Wald estimator reveals that the greatest
burden of disability is experienced in households with children (0-17 years of age) with
2 We think of these as exploratory results.

5
impairments. Results indicate that in such households, average monthly expenditure is lower by
up to 15 percent as compared to households with no persons with disabilities.
The negative burden of disability documented by the Wald estimator is not uniform
across state characteristics. Analysis at different points in the distribution of state attributes
indicates that the negative effects are most evident in states with less than the 25th
percentile
value of net state domestic product, with less than the 25th
percentile value of rural to total
population, with less than the 25th
percentile value of average annual rainfall, with more than the
75th
percentile value of average annual temperature, and between 25th
to 50th
percentile values of
inequality. Hence, households with persons with disabilities in poor states with relatively urban
populations that experience extremes of climate and low to medium levels of inequality bear the
most hardship. These results underline the importance of state characteristics and the importance
of strong sub-national institutions in determining the welfare of people with disabilities in India.
II. Background on Disability Research in India
Although past work has noted the important but incomplete role played by the state in
delivery of services and entitlements (Thomas 2005, World Bank 2007), there is little rigorous
work in economics on state-level variations in indicators of well-being among people with
disabilities in India. Not surprisingly, disability research in developing countries in general has
tended to focus on the link between disability and poverty (Trani and Loeb 2010, Braithwaite
and Mont 2009, Hoogeveen 2005, Yeo and Moore 2003). This is particularly true for India.
Thomas (2005) argues that poverty is one of the biggest causes and consequences of disability in
India. People with disabilities in India are among the poorest, often live in rural areas, often are
disabled at birth or before school age, are mostly uneducated and widely unemployed. Using
2006 data from Vietnam, Mont and Cuong (2011) show the strong inter-linkage between

6
disability and poverty when the additional cost of living with a disability is taken into account.
This is particularly true in households with children with disabilities. Filmer (2008) argues that
among school-age children (6-17 years) across 13 developing countries, disability-based school
participation deficits are often larger than those associated with characteristics such as gender,
residence in rural areas or the household’s economic standing. Furthermore, Cuong and Mont
(2011) notes that in families where a parent is disabled, non-disabled children tend to have lower
primary and secondary school participation rates. Part of this is attributed to the fact that in such
households, child’s time substitutes for parental time in income generation and household
production. Among children with disabilities in India, girls receive less care than boys and are
more likely to die as a consequence (Thomas 2005). Among children with disabilities, girls also
tend to receive less education than boys.
In an attempt to improve the educational outcomes of children with disabilities, the
government of India has emphasized the development of “special schools” and alternative
systems such as informal education centers. However, education experts have criticized the
widespread development of such schools and systems as the quality of education offered at these
institutions is sub-par, and because attendance at these facilities perpetuates inequalities (Singal
2006a, Singal 2006b). Moreover, the gender gap in schooling measures remains evident in these
institutions as they make little attempt to encourage the schooling of girls with disabilities
(Kalyanpur 2008).
The particular susceptibility of girls with disabilities resonates with other findings for
women with disabilities in India. Mehrotra (2004) argues that women with disabilities in India
face double discrimination due to the prevalence of traditional gender roles and expectations.
Among older adults, there is empirical evidence that women are more likely to hide physical

7
impairments if their spouse is still alive (older married women are less likely to report
disabilities), and because of cultural differences, older women in northern India appear to be
more disadvantaged as compared to their counterparts in the south (Sengupta and Agree 2002).
Furthermore, there is evidence that rural women with disabilities are most likely to be
disregarded by survey enumerators (Jeffrey and Singhal 2008).
A reason for the inter-linkage between disability and poverty is that people with
disabilities have significantly lower employment rates on average, even though the large
majority of this population is capable of working. Using a cross-sectional data set from the state
of Tamil Nadu, Mitra and Sambamoorthi (2008) shows that gaps in employment between
disabled and non-disabled males cannot be explained by differences in education, health or
productivity. The study arrives at this conclusion as a selectivity-corrected wage equation
indicates that wages are not statistically different between disabled and non-disabled males.
Alternatively, the lower employment probability of people with disabilities is attributed to
differential returns to characteristics and from discrimination in employment opportunities.
Other studies that have focused on the employment outcomes of people with disabilities
in India include Thompkins (2010). In a study of the Indira Kranthi Program which facilitates
micro-lending through self-help groups to people with disabilities in rural Andhra Pradesh, it was
found that although the program resulted in increased borrowing, education and asset ownership,
there was negative to zero effects on the labor market participation of the beneficiaries
(Thompkins 2010). The presence of members with disabilities in a household also has important
implications for the labor supply of other household members. Estimates from Uttar Pradesh and
Tamil Nadu show that about 45 percent of households with people with special needs report
another adult being absent from work to care for the person with disability (World Bank 2007).
8
Complicating the assessment of the security of people with disabilities in India is the
relative dearth of nationally representative surveys with detailed data on this population. As of
the last decade, there are only two such surveys – the National Sample Survey (NSS) of 2002
and the Census of India from 2001. Both sources have different definitions for the major types
of impairments; the NSS is judged to be better than the Census in terms of hearing, speech, and
locomotive impairments (Jeffrey and Singal 2008). In terms of visual impairments, the NSS
2002 survey disregarded people wearing spectacles and contact lenses but the Census did not.
Relying on the relative strengths of the NSS versus the Census, we use the nationally
representative information in the former to contribute to research on disability in India in two
ways. First, we offer one route to reconcile the contrast in the relatively enlightened nature of
India’s disability policies (for a developing country) and the challenges faced by people with
special needs in every-day life by focusing on state-level heterogeneity in the distribution of
commitments to the disabled. This is accomplished by allowing for state-level differences in the
behavior analyzed, and to the best of our knowledge, is the first study to explicitly model state-
level variation in outcomes for people with disabilities in India. Second, within this state-
specific structural framework, we consider differences in results by gender and age of the person
with disabilities. Although it is qualitatively recognized that in the population of people with
disabilities, households with female members and children with disabilities may be most
vulnerable, this study breaks new ground by quantitatively assessing how large the differentials
actually are for such households in comparison to those without persons with disabilities.
III. Empirical Methodology
We begin by conducting preliminary analysis to document the influence of state-level
variations. This is accomplished by using a random coefficients model following the

9
methodology outlined in Swamy (1970). The details of the model are presented in the Appendix,
and Appendix Table 1 reports the results of the state-specific random coefficients linear
regression model along with statistical tests for the presence of state-level heterogeneity.
Next we estimate OLS models with state fixed-effects. These models treat the indicator
for disability status as exogenous and provide a comparison benchmark for our preferred
specification, the Wald estimator. The use of state fixed-effects also allows a test of the null
hypothesis that these are jointly zero, that is, there is no evidence of state-level heterogeneity in
the data.
For the random coefficients and OLS models, the outcome and control variables are
measured at the household level. This is because we wish to implement a comparison of
differences among households with and without disabled members conditional on state-level
differences. With multiple households per state, the results tables for the random coefficients
and OLS models report standard errors that are clustered at the state level.
Validity of the random coefficients and OLS estimators rests on the assumption that the
indicator for disability status is exogenous. This may not be the case as the disability indicator
might be measured with error or be correlated with omitted variables. Measurement error might
result if there is under-reporting of disability as might happen in the case of women with
impairments in rural areas.3 Endogeneity in the indicator of households with members with
disabilities might also result due to correlation with omitted variables. For example, if women
with poor nutrition are more likely to bear children with impairments and also more likely to live
in resource-constrained households, then not controlling for health investments in mothers may
lead to spurious correlations between disability indicators and average household expenditure.
3 However, note that such under-reporting leads to a conservative bias in our estimates. That is, with the
inclusion of such members, our results should become stronger.

10
The standard technique to correct for such endogeneity is to use instrumental variables (IV).
Relying on the intuition provided in Moffitt (1996) of IV being equivalent to a “comparison in a
different dimension” or a “method of aggregation”, we obtain unbiased effects of disability status
by regressing mean monthly expenditures at the district level on the district mean of the
disability indicator. The across-district IV estimator is equivalent to a Wald statistic of the
following form:
Where and are the means of expenditure and disability status for the two groups
and . That is, “…IV estimator represents a least squares regression using aggregates
taken over and within cells of .”4 The across-district IV comparison is valid as long as
the variation in disability status across districts is exogenous and not systematically related to
differences in average expenditures between households with and without disabled members.
The exclusion restriction is that district of residence has no direct impact on average monthly
expenditures conditional on the district-mean of disability status. To ensure that the exclusion
restriction remains valid, we include state fixed-effects in the Wald estimator regressions to
control for other factors that might make between state allocations correlated to average monthly
expenditures.5 As before, standard errors are clustered at the state level to control for multiple
observations by state.
IV. Description of Data
Data used in this analysis are constructed by combining the dedicated disability module
and the consumer expenditure module of the NSS 2002. The disability module surveys only
4 Moffitt (1996), p. 464.
5 For example, if states provided more for disabled populations because residents had lower average
monthly expenditures to begin with.

11
those households that have disabled member(s); hence these data alone do not allow a
comparison of outcomes with households that have no disabled individuals. In order to create
the appropriate data set that facilitates such a comparison, households in the disability module
are merged with households in the consumer expenditure module that was fielded in the same
year. The data set has information on 32,669 households of which 15,201 households (46.53
percent) have one or more disabled members. 6,533 households (20 percent) have disabled male
member(s), 4,822 households (14.76 percent) have disabled female(s), and 4,783 households
(14.64 percent) have children with disabilities. Households are the basis of analyses for the
random coefficients and OLS state fixed-effects models, thus individual level outcomes are
averaged to the household level for these regressions. The IV Wald estimator regressions are
implemented at the district level. Nationally representative estimates are obtained by using
weights provided by the NSS.
The NSS has details on five different types of impairments – mental, visual, hearing,
speech and locomotive. Among the disabled, the most common impairment is that associated
with hearing (25.56 percent), followed by mental (24.47 percent) and visual (20.73 percent).
Less than one percent of the sample (0.34 percent) reports multiple impairments. For purposes
of this study, the different types of disabilities are analyzed together since we do not possess
detailed data to model state-level differences in provision of services by disability type.
Approximately 43 percent report being disabled from birth and about 66 percent of households
with members with disabilities reside in rural India.
Figure 1 reports the state-wise percent of households with disabled member(s) where the
comparison group is households with no person(s) with disabilities. If any household member
reports a disability, the disability indicator for that household receives a value of one.

12
Alternatively, the indicator is zero if no member within the home has any one (or more) of the
five impairments measured in the data. From Figure 1 it is clear that the highest proportion of
households with person(s) with disabilities is present in the states of Kerala, Orissa and West
Bengal. For the purpose of analysis, union territories under central government jurisdiction are
combined with neighboring states. Further, newly created states such as Chhattisgarh and
Jharkhand are combined with the states that they were created from (Madhya Pradesh and Bihar,
respectively). This classification system results in 16 state entities as shown in Figure 1.
Figure 2 is a state-wise disaggregation of households with male adult member(s) with
disabilities, female adult member(s) with disabilities and children (below 18 years) with
disabilities (these gender and age-segregated disability measures are constructed in a similar
manner to the creation of the general indicator for disability status at the household level). The
comparison group in each case is households with no person(s) with disabilities. From Figure 2
it is clear that the proportion of households with disabled male members exceeds the proportion
of households with disabled female members across all states. Some part of this may be
explained by the fact that women are less likely to report being disabled, or, as noted above, be
overlooked by enumerators particularly in rural areas. The highest proportion of households
with children with disabilities is present in the states of Orissa, Kerala, and Bihar.
Figure 3 paints a picture of average household economic resources among household
with and without disabled individuals. As expected, the figure shows that in general, average
monthly per capita expenditure is higher in households without person(s) with disabilities. This
figure also shows that among households with person(s) with disabilities, average monthly
expenditures are highest in the states of Kerala, Punjab, and Haryana.

13
Summary statistics of household and state characteristics are reported in Tables 1. This
table shows that average monthly per capita expenditure is about 31 percent lower in households
with person(s) with disabilities as compared to households with able members. Among
households with person(s) with disabilities, the negative burden is most pronounced in those with
children with health and locomotive impairments. Moreover, households with persons with
disabilities are significantly more likely to be rural and have older household heads. Households
with members with disabilities are likely to own more land as compared to households without
such members; however families with individuals with impairments are also more likely to have
household heads that are illiterate. Families with member(s) with impairments are also more
likely to live in independent structures that are made of unstable materials.
Information on state attributes was obtained from several sources. Data on net state
domestic product and state-level rural and urban populations were obtained from the Economic
Organization and Public Policy Program (EOPP) database housed at LSE. Given that the NSSO
data are from 2002, these state characteristics were selected from 2001 and merged into the NSS
sample to understand contemporaneous impacts as a function of state attributes in the preceding
year. Data on annual rainfall and temperature were obtained from the India Meteorological
Department. These data are as of 2000 since 2001 numbers were unavailable. Finally, state-
wise data on rural and urban inequality (Gini coefficients constructed from consumption
expenditures) measures from 2000 were obtained from the annual publications of the Reserve
Bank of India. These were subsequently combined into a single population weighted average
measure of inequality for each state using information on rural and urban populations from the
EOPP database as weights. Summary statistics for state characteristics in Table 1 indicate that
whereas households with person(s) with disabilities reside in states with somewhat higher levels

14
of net state domestic product and annual average rainfall as compared to households with no
person(s) with disabilities, such relative differentials are absent when the ratio of rural to total
population or the population weighted average measure of inequality is taken into consideration.
V. Results
Random coefficients results
Results from the random coefficients linear regression models are reported in Appendix
Table 1. As noted above, these models present a preliminary test for state-level heterogeneity.
The comparison group for all columns in this table is households without individuals with
disabilities. Overall, the results are as hypothesized. Households with members with disabilities
have significantly lower average per capita spending as compared to households in which all
members are able. Among those with members with impairments, the negative burden of
disability as measured by reduced average per capita spending is most pronounced in households
with male adult person(s) with disabilities followed by households with children with
disabilities. Results in Appendix Table 1 show that although households with female person(s)
with disabilities also experience reduced per capita expenditures, the magnitude of the decline is
not as extreme as in other cases. An explanation for this is that labor markets in developing
countries such as India are often segmented by gender, and thus primarily hire and cater to male
workers. Hence there is a significant effect on household income and expenditures when the
main bread-winner in the home is unable to participate in wage or skilled work due to disability.
The sizeable relative decline in per capita expenditures in households with children with
disabilities most probably reflects interrupted labor force participation from time spent caring for
the child, and from the additional expenses involved in the provision of this care.

15
Appendix Table 1 also reports tests of parameter constancy in the random coefficients
framework, which is a test for equivalence in coefficient estimates across states. The p-values
for all outcomes indicate that the null hypothesis can be rejected, that is, there is statistically
discernible variation in these parameters across states. This rejection indicates the presence of
substantial state-level heterogeneity in the dependent variable across all models of Appendix
Table 1.
OLS with state fixed-effects results
Table 2 reports results from the linear OLS regression with state fixed-effects. These
estimates are the benchmark against which the preferred IV Wald estimator results that follow
are compared. Patterns evident in the random coefficients results resonate here as average per
capita monthly spending is significantly lower in families with people with disabilities and this
effect is largest in households with adult male members with impairments. An explanation could
be as noted above, that is, this reflects the gender-segmented nature of wage and labor markets in
India. However, if families with female individuals with impairments tend to live in households
that are female headed (18 percent of our sample), then given the nature of segmentation, the per
capita expenditure penalty associated with disability should be more stark in households with
female(s) with impairments. This is especially so when one notes from Table 1 that the
percentage of households in which the head is illiterate is highest among households with female
person(s) with disabilities. Thus in addition to a labor market segmentation story, it is also likely
that the estimate in the third column of Table 2 reflects under-reporting of disability by women
and/or the fact that women with disabilities continue to participate in everyday activities. In any
case, a comparison of the estimates in columns two and three of Table 2 leads to the interesting
observation that in relation to households that have no members with disabilities, those with

16
disabled adult female(s) have slightly higher levels of monthly per capita expenditure (of about
Rupees 54, which is 7.5 percent of the average monthly per capita expenditure in households
with disabled members) as compared to households with disabled adult male(s). This higher
level of expenditure in households with disabled women is consistent with qualitative evidence
in Thomas (2005) which notes that where men and women have similar levels of impairments,
women are likely to continue to work. As in the case of the random coefficient estimates,
families with children with disabilities have lower average per capita expenditures as compared
to those with no members with disabilities. Finally, an F-test that the state fixed-effects are
jointly zero is strongly rejected across all columns in Table 2; hence state-level heterogeneity is
statistically discernible in these data.
IV Wald estimator results
As noted above, the indicator for disability status may not be exogenous due to
measurement error and possible correlation with omitted variables. Measurement error might
result if there is under-reporting of disability. Endogeneity in the indicator of households with
members with disabilities might also result due to omitted variables. For example, if women
with poor nutrition are more likely to bear children with impairments and also more likely to live
in resource-constrained households, then not controlling for mother’s health investments may
lead to spurious correlations between the disability indicator and average household expenditure.
Endogeneity might also result due to selection on unobservables. For example, in households
with more egalitarian preferences, girl children with disabilities may not be discriminated against
in terms of human capital investments. Such households may thus have less depressed average
per capita spending since as adults, these girls might work to supplement household income.

17
We address these concerns by instrumenting for disability by using a Wald estimator of the form
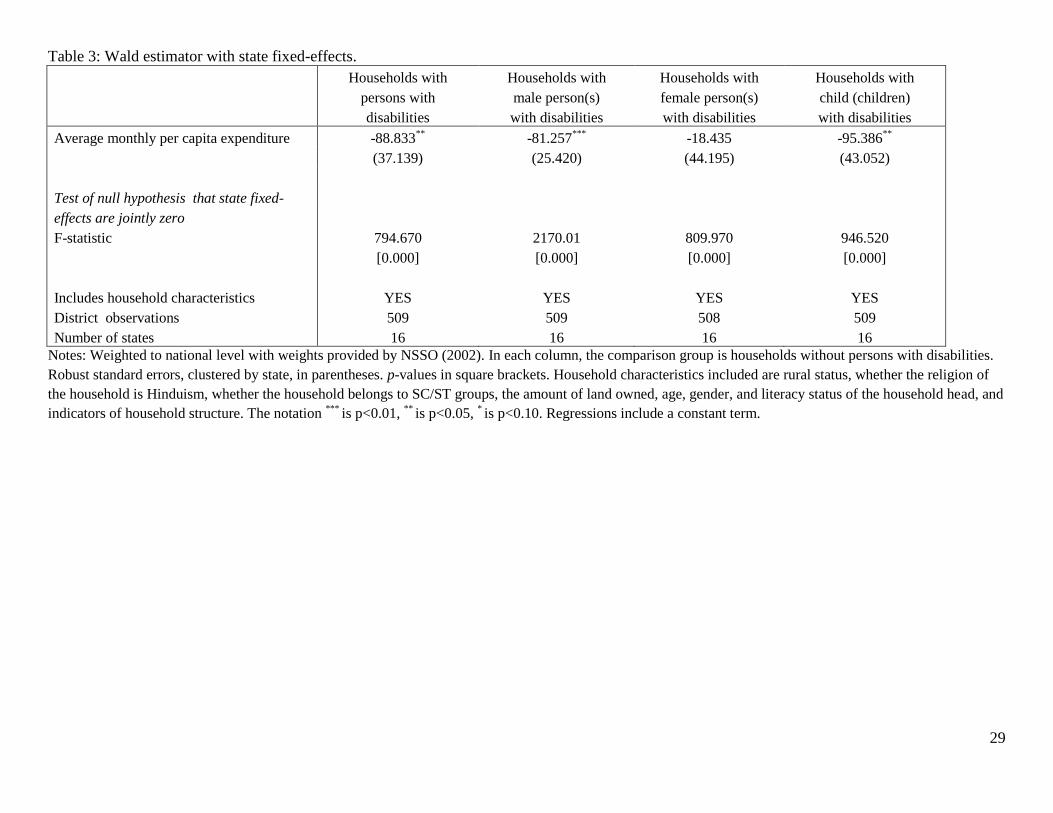
discussed above. The IV Wald estimator state fixed-effects results are presented in Table 3.
The IV Wald estimator in the first column of Table 3 reports that as compared to
households with no people with disabilities, those with members with disabilities have average
monthly per capita spending that is lower by about Rupees 89 (14 percent of overall per capita
expenditures). The smaller magnitude of this result in comparison to the OLS models above
suggests that endogeneity caused the OLS estimate to be positively biased. As before, the
greatest burden associated with having member(s) with disabilities in the household is reflected
in families with children and adult male members with disabilities. The Wald estimator result in
the third column indicates that when compared along the average per capita spending dimension,
families with female members with disabilities are statistically equivalent to those without any
members with disabilities. Finally, F-tests that the state fixed-effects are jointly zero continue to
indicate the presence of substantial state-level heterogeneity in these data.
There is clear statistical evidence for the presence of state-level variation in the models
analyzed thus far. In the final section of this study, we shed light on which state attributes have
the strongest implications for families with person(s) with disabilities. To focus the analysis, we
compare households with person(s) with disabilities to those with able members without
differentiating by gender or age of the member with impairments. These Wald estimator with
state fixed-effects results are reported in Table 4. The most obvious source of state heterogeneity
is that some states are richer than others and outcomes for people with disabilities may be less
severe in relatively well-off states. We find some evidence for this in the first row of results in
Table 4. Households with people with disabilities that reside in states with net state domestic
product in the lower end of the distribution experience the only statistically significant negative

18
effect on average monthly per person spending. There is no evidence that in the middle to upper
parts of the distribution of net state domestic product, families with members with disabilities
face any differential expenditure handicap.
The second state feature that we consider reflects the observation that states with larger
rural populations may have worse outcomes for people with disabilities. We do find some
evidence for this in the second set of results in Table 4; however, the unexpected finding is that
the burden of disability is up to three times as severe in states with low rural to total populations.
That is, the negative effect on monthly per capita expenditures in households with person(s) with
disabilities is relatively large in states that are more urban. An explanation for this may be that
while rural India has widespread subsistence farming, income and spending in urban India
depends on employment in wage labor markets. If sources of income are not diversified and
disability results in loss of work, the adverse impact on expenditure may be higher in urban
settings.
Next we investigate the impact of the state’s climate (rainfall and temperature) on the
relative hardship experienced by households with members with disabilities. The idea here is
that given the general lack of weather-indexed insurance, outcomes for vulnerable households
are likely to be more severe in states with extreme climate. The third and fourth sets of rows in
Table 4 provide evidence in favor of this idea. In particular, families with members with
disabilities in states with relatively low rainfall (less than the 25th
percentile value) experience
the largest decline in average expenditures as compared to families with able members. States
with relatively more rain (50-75th
percentile values) also see significant negative impacts on
households with person(s) with disabilities, but the magnitude of the effect is relatively small.
Extremes in average annual temperature also appear to matter. In particular, although residence

19
in relatively cold states has some effect on relative monthly spending, residence in states with the
highest annual temperatures has a relative negative impact that is almost five times in magnitude.
The rainfall and temperature estimates in Table 4 emphasize that as compared to families with
able members, household income for those with members with disabilities is especially
vulnerable in states that experience extremes in weather patterns.
The final set of results in Table 4 relate to state inequality measured by a population
weighted average Gini measure. The intent here is to gauge whether the relative burden borne
by households with people with disabilities is higher in states that are more unequal. There is
some descriptive evidence in favor of this notion in the case of developed countries such as the
United States (Parish et al. 2012). In the absence of social safety nets and other programs for
adults and children with disabilities, this may be particularly evident in developing countries
such as India. The fifth set of results in Table 4 report estimates related to the inequality
measure we employ. Surprisingly, hardships faced by families with persons with disabilities are
not largest at the upper tail of the distribution (most unequal states) but in the low to moderate
range (25th
to 50th
percentile). The coefficient in Table 4 indicates that among states in this
range, families with members with impairments have per capita monthly spending that is lower
by around Rupees 238 (37 percent of overall average monthly spending) as compared to other
families with healthy members. This effect is large and an explanation may arise from a cause of
inequality in developing countries such as India. As is well understood, ownership of factors of
production (land, capital, and labor) has direct implications for inequality and since ownership of
land tends to be concentrated, states in which there is cultivable land will be less equal. In our
data, the states that fall in the 25th
to 50th
percentile of inequality include Punjab and West
Bengal, two of the most fertile areas in the country. Thus differences in average monthly

20
spending are discernible in this range since households with members with disabilities (who tend
to be more poor with fewer assets) in these states are even more deprived than households with
members with disabilities in the overall data. On the other hand, states with low levels of
inequality (Assam, Bihar, and Jammu and Kashmir) have households that are all uniformly poor
(only asset is unskilled labor). Average expenditure differentials between families with and
without members with disabilities are thus less likely to be evident in this sub-group of states.
This is true for the most unequal states as well (Karnataka, Kerala, and Tamil Nadu) since in this
group, households with people with disabilities are relatively better off in comparison to the
general population of families with individuals with disabilities (these southern states have high
rates of literacy and are socio-economically and culturally more progressive in comparison to the
rest of India).
In sum, the burden of disability as measured by relative deficits in household average
monthly per capita spending are most apparent in poor states with urban populations, extremes in
rainfall and temperature and low to moderate levels of inequality.
VI. Conclusion and Policy Implications
Outcomes for people with disabilities in India are not consistent with the aims of its
disability legislation or its ratification of the UN Convention on the Rights of Persons with
Disabilities. By using empirical methods that are cognizant of state-level variations, this research
provides evidence of state-wise disparities in the economic well-being of people with disabilities.
Under the Constitution of India, primary responsibility for delivery of services and commitments
to people with impairments rests at the state level. Hence a focus on sub-national entities
enables a clear understanding of where implementation is weak. Using an instrumental variables
Wald estimator with state-fixed effects technique that corrects for possible endogeneity in the
21
indicator of disability status, we find that households with members with impairments fare
significantly worse as compared to households without people with impairments. In particular,
households with individuals with disabilities have up to 14 percent lower average monthly per
person spending as compared to families with able members. Similar trends hold when the
analysis is disaggregated by gender of the individual with disabilities, however, in comparison to
families with male adults with impairments, those with female adults with disabilities appear to
experience no statistically discernible penalty. The burden for families with children with
disabilities is higher than that experienced in households with adult male members with
impairments (15 percent deficit versus 13 percent deficit, respectively). Chi-squared and F-tests
for parameter constancy across states are almost uniformly rejected, thus indicating the presence
of substantial state-level heterogeneity across all models estimated.
These results imply that a way to ameliorate the economic well-being of people with
disabilities in India may rest on improving services at the state-level. In particular, a fruitful
route might be to extend central government aid to this population, particularly households with
persons with disabilities in poor states that are subject to extremes in rainfall and annual
temperatures. There is an important compensatory role to be played by the central government
in this environment since features such as the weather are exogenous to state control. State
governments too have critical parts to play since anecdotal evidence suggests that people with
impairments are often unaware of their rights and entitlements. A more dedicated role by state
institutions to increase such awareness, perhaps in concert with non-government organizations,
would be valuable. This is because with awareness of entitlements, families with members with
disabilities will be in a better position to avail of resources dedicated towards them, thus helping
to cushion declines in average monthly spending.

22
Furthermore, as opposed to aid alone, a more pro-active state-government role in
furthering access to small loans (perhaps by acting as a part-guarantor) may be invaluable in
relaxing resource constraints for people with disabilities in India. Finally, better mechanisms for
increasing service outreach to smaller administrative units (villages, districts and Panchayati Raj
institutions) within a state may bring tangible benefits to people with disabilities, and on the most
vulnerable section of this population, families with children with disabilities. An example of
such a measure that would bring immediate betterment would be the provision of schools in
villages that were constructed in a suitable manner to accommodate children with learning,
visual, hearing and locomotive impairments. By analyzing relative welfare differentials
experienced by families with individuals with disabilities and by highlighting the importance of
state institutions in shaping these differentials, this study contributes to an area of economic
research that has not been actively examined before.

23
References
Angrist, Joshua. 1991. “Grouped-data Estimation and Testing in Simple Labor-Supply Models,”
Journal of Econometrics 47: 243-266.
Angrist, Joshua, and Jorn-Steffen Pischke. 2009. Mostly Harmless Econometrics: An
Empiricist’s Companion. Princeton and Oxford: Princeton University Press.
Bagchi, Amaresh. 2003. “Rethinking Federalism: Changing Power Relations Between the Center
and The States,” Journal of Federalism 33(4): 21-42.
Braithwaite, Jeanine, and Daniel Mont. 2009. “Disability and Poverty: A Survey of World Bank
Poverty Assessments and Implications,” forthcoming in Alter: The European Journal of
Disability Research.
Cuong, Nguyen Viet, and Daniel Mont. 2011. “Does Parental Disability Matter to Child
Education?” World Bank Policy Research Working Paper, No. 5743.
Filmer, Deon. 2008. “Disability, Poverty, and Schooling in Developing Countries: Results from
14 Household Surveys,” World Bank Economic Review 22(1): 141-163.
Hoogeveen, Johannes. 2005. “Measuring Welfare for Small but Vulnerable Groups: Poverty and
Disability in Uganda,” Journal of African Economies 14(4): 603-631.
Jeffrey, Roger, and Nidhi Singal. 2008. “Measuring Disability in India,” Economic and Political
Weekly 43 (12 and 13): 22-24.
Johnston, Jack, and John DiNardo. 1997. Econometric Methods. 4th
edition. New York:
McGraw-Hill.
Kalyanpur, Maya. 2008. “The Paradox of Majority Underrepresentation in Special Education in
India,” The Journal of Special Education 42(1): 55-64.
Mehrotra, Nilika. 2004. “Women, Disability, and Social Support in Rural Haryana,” Economic
and Political Weekly 39(52): 5640-5644.
Mitra, Sophie, and Usha Sambamoorthi. 2008. “Disability and the Rural Labor Market in India:
Evidence for Males in Tamil Nadu,” World Development 36(5): 934-952.
Moffitt, Robert. 1996. “Identification of Causal Effects Using Instrumental Variables:
Comment,” Journal of the American Statistical Association 91(434): 462-465.
Mont, Daniel, and Nguyen Viet Cuong. 2011. “Disability and Poverty in Vietnam,” World Bank
Economic Review 25(2): 323-359.

24
Parish, Susan, Rose, Roderick, Dababnah, Sarah, Yoo, Joan, Shawn Cassiman. 2012. “State-
Level Income Inequality and Family Burden of US Families Raising Children with
Special Health Care Needs,” Social Science & Medicine 74: 399-407.
Sengupta, Manisha, and Emily Agree. 2002. “Gender and Disability Among Older Adults in
North and South India: Differences Associated with Coresidence and Marriage,” Journal
of Cross-Cultural Gerontology 17: 313-336.
Singal, Nidhi. 2006a. “Inclusive Education in India: International Concept, National
Interpretation,” International Journal of Disability, Development and Education 53(3):
351-369.
Singal, Nidhi. 2006b. “An Ecosystemic Approach for Understanding Inclusive Education: An
Indian Case Study,” European Journal of Psychology of Education 21(3): 239-252.
Sinha, Aseema. 2004. “The Changing Political Economy of Federalism in India: A Historical
Institutionalist Approach,” India Review 3(1): 25-63.
Swamy, P.A. V. B. 1970. “Efficient Inference in a Random Coefficients Regression Model,”
Econometrica 38: 311-323.
Thomas, Phillipa. 2005. “Mainstreaming Disability in Development: India Country Report,”
Disability Knowledge and Research Report.
Thompkins, Allison. 2010. “Micro-lending in India: An Equal Access Possibility,” MIT: Job
Market Paper.
Trani, Jean-Francois, and Mitchell Loeb. 2010. “Poverty and Disability: A Vicious Cycle?
Evidence from Afghanistan and Zambia,” Journal of International Development (in
press).
Yeo, Rebecca, and Karen Moore. 2003. “Including people with disabilities in Poverty Reduction
Work: Nothing About Us, Without Us,” World Development 31(3): 571-590.
World Bank. 2007. “People with Disabilities in India: From Commitments to Outcomes,”
Human Development Unit: South Asia Region: 1-186.

25
Figure 1: State-wise percent of households with person(s) with disabilities.
Notes: Author’s calculations. Estimates weighted to national level with weights provided by NSSO (2002).
Figure 2: State-wise percent of households with person(s) with disabilities who are adult male, adult female, or a child.
Notes: Author’s calculations. Estimates weighted to national level with weights provided by NSSO (2002).
0
10
20
30
40
50
60
70
Percent of households with person(s) with disabilities: comparison group is households with no persons with disabilities
0
10
20
30
40
50
Percent of households with person(s) with disabilities who is (are) male: comparison group is households with no disabled members
Percent of households with person(s) with disabilities who is (are) female: comparison group is households with no disabled members
Percent of households with person(s) with disabilities who is (are) a child (children): comparison group is households with no disabled members

26
Figure 3: State-wise average monthly per capita expenditure in households with and without disabled member(s).
Notes: Author’s calculations. Estimates weighted to national level with weights provided by NSSO (2002).
0200400600800
1000120014001600
Average monthly per capita expenditure in households with person(s) with disabilities
Average monthly per capita expenditure in households with no person(s) with disabilities

27
Table 1: Summary statistics at the household level.
Variable Households with Households with Households with Households with Households with
no PWDs PWDs male PWDs female PWDs CWDs
Household level:
Average monthly per capita 1079.402 744.418 746.709 799.195 684.521
expenditure† (1008.492) (651.957) (579.654) (804.971) (559.305)
Dummy for rural household 0.498 0.657 0.634 0.657 0.689
(0.500) (0.475) (0.482) (0.475) (0.463)
Dummy for household religion 0.781 0.770 0.780 0.767 0.760
is Hinduism (0.414) (0.421) (0.414) (0.423) (0.427)
Dummy for household belongs to 0.278 0.297 0.287 0.286 0.315
Scheduled Caste or Scheduled Tribe (0.448) (0.457) (0.453) (0.452) (0.465)
Land possessed in hectares 0.591 0.663 0.679 0.669 0.652
(1.830) (1.681) (1.843) (1.797) (1.560)
Age of household head in years 44.348 46.066 47.743 47.923 42.056
(13.991) (13.333) (13.577) (13.733) (11.562)
Dummy for household has male 0.879 0.904 0.967 0.819 0.908
head (0.326) (0.294) (0.180) (0.385) (0.288)
Dummy for household head is not 0.288 0.354 0.346 0.362 0.354
literate (0.453) (0.478) (0.476) (0.481) (0.478)
Dummy for household lives in an 0.743 0.828 0.819 0.838 0.831
independent structure (0.437) (0.377) (0.385) (0.368) (0.374)
Dummy for household lives in a 0.112 0.181 0.188 0.172 0.174
structure that is not solid (concrete) (0.315) (0.385) (0.391) (0.377) (0.379)
State level:
Net state domestic product in 2001 1005.898 1034.023 1040.212 1028.375 1039.533
(in billion rupees) (570.073) (562.633) (561.760) (555.105) (570.635)
Ratio of rural to total population in 0.735 0.733 0.729 0.729 0.741
2001 (0.099) (0.100) (0.101) (0.101) (0.099)
Average annual rainfall in mms. 203.614 217.433 219.983 223.568 207.924
in 2000 (102.189) (105.590) (107.383) (110.672) (98.284)
Average annual temperature in 26.613 26.855 26.898 26.912 26.768
degrees Celsius in 2000 (1.652) (1.613) (1.608) (1.639) (1.579)
Population weighted average of 0.257 0.259 0.260 0.261 0.257
rural and urban Gini coefficients (0.031) (0.032) (0.033) (0.033) (0.031) Notes:
† Denotes dependent variable where monthly per capita expenditure is reported in 2002 Indian Rupees. Weighted to national level with weights provided by NSSO (2002).
Standard errors in parenthesis. Total number of households is 32669. “PWD” denotes persons with disabilities; “CWD” denotes children with disabilities. Number of households
with no PWDs is 17468 and with PWDs is 15201; number of households with male PWDs is 6533, with female PWDs is 4822 and with CWDs is 4783.

28
Table 2: Ordinary least squares regressions with state fixed-effects.
Households with Households with Households with Households with
persons with male person(s) female person(s) child (children)
disabilities with disabilities with disabilities with disabilities
Average monthly per capita expenditure -210.212***
-220.080***
-165.813***
-204.440***
(25.807) (29.317) (27.135) (21.929)
Test of null hypothesis that state fixed-
effects are jointly zero
F-statistic 21105.100 46910.280 7151.480 6481.120
[0.000] [0.000] [0.000] [0.000]
Includes household characteristics YES YES YES YES
Household observations 32458 23830 22134 22095
Number of states 16 16 16 16
Notes: Weighted to national level with weights provided by NSSO (2002). In each column, the comparison group is households without persons with disabilities.
Robust standard errors, clustered by state, in parentheses. p-values in square brackets. Household characteristics included are rural status, whether the religion of
the household is Hinduism, whether the household belongs to SC/ST groups, the amount of land owned, age, gender, and literacy status of the household head, and
indicators of household structure. The notation ***
is p<0.01, **
is p<0.05, * is p<0.10. Regressions include a constant term.
29
Table 3: Wald estimator with state fixed-effects.
Households with Households with Households with Households with
persons with male person(s) female person(s) child (children)
disabilities with disabilities with disabilities with disabilities
Average monthly per capita expenditure -88.833**
-81.257***
-18.435 -95.386**
(37.139) (25.420) (44.195) (43.052)
Test of null hypothesis that state fixed-
effects are jointly zero
F-statistic 794.670 2170.01 809.970 946.520
[0.000] [0.000] [0.000] [0.000]
Includes household characteristics YES YES YES YES
District observations 509 509 508 509
Number of states 16 16 16 16
Notes: Weighted to national level with weights provided by NSSO (2002). In each column, the comparison group is households without persons with disabilities.
Robust standard errors, clustered by state, in parentheses. p-values in square brackets. Household characteristics included are rural status, whether the religion of
the household is Hinduism, whether the household belongs to SC/ST groups, the amount of land owned, age, gender, and literacy status of the household head, and
indicators of household structure. The notation ***
is p<0.01, **
is p<0.05, * is p<0.10. Regressions include a constant term.

30
Table 4: Wald estimator with state fixed-effects results for different percentiles of state characteristics.
Outcome: average monthly per capita expenditure in households with person
with disabilities compared to households with no persons with disabilities
< 25th percentile 25-50
th percentile 50-75
th percentile > 75
th percentile
Net state domestic product -61.803**
-53.495 -136.041 -77.606
(29.963) (89.526) (148.532) (99.527)
[N=119] [N=149] [N=113] [N=128]
Ratio of rural to total population in state -258.388**
-131.740***
-46.679 -89.781***
(112.506) (36.990) (46.364) (26.710)
[N=129] [N=133] [N=133] [N=114]
Average annual rainfall -150.765* -134.002 -66.887
* -75.842
(80.420) (129.666) (35.740) (156.653)
[N=137] [N=121] [N=157] [N=94]
Average annual temperature -49.027***
25.509 -154.038**
-243.833**
(14.146) (77.894) (74.076) (114.197)
[N=98] [N=92] [N=169] [n=150]
Population weighted Gini -55.322 -238.136**
-53.494 -89.232
(41.293) (121.115) (42.291) (92.674)
[N=124] [N=133] [N=141] [N=111]
Includes household characteristics YES YES YES YES
Number of states 16 16 16 16
Notes: Weighted to national level with weights provided by NSSO (2002). Robust standard errors, clustered by state, in parentheses; number of district
observations in square brackets. Household characteristics included are rural status, whether the religion of the household is Hinduism, whether the household
belongs to SC/ST groups, the amount of land owned, age, gender, and literacy status of the household head, and indicators of household structure. Rural status is
omitted in the case of ratio of rural to total population in state estimates. The notation ***
is t>=1.64, **
is t>=1.96, * is t>=2.58. Regressions include a constant term.

31
Appendix: Random coefficients models
To allow for state-level variations in a preliminary comparison of households with and without
disabled members, we employ a state-specific random-coefficients linear regression model based
on Swamy (1970). Consider the following:
Where denotes a state, and is the ( ) coefficient vector for the th state.
6 is
a matrix of control variables with Treating parameter heterogeneity as
stochastic implies that
With ( ) and ( ) . Swamy (1970) provides a solution to finding and by
noting that the resulting generalized least squares (GLS) estimator from stacking the equations
is a weighted-average of the within-panel ordinary least squares (OLS) estimators (“panel” refers
to states). The required parameters are estimated using a two-step approach (where the
procedure begins by estimating with OLS) outlined in Swamy (1970). Results of these
random coefficients models with conditioning at the state level are reported in Appendix Table 1.
Further, Swamy (1970) provides a test of the null of parameter constancy between the
OLS estimate of (disregarding the panel structure) and the weighted average of the within-
panel OLS estimators. This is a test of whether statistically equivalent estimates may be
obtained by pooling the models and ignoring cross-panel variations. Johnston and DiNardo
(1997) shows that the test in Swamy (1970) is essentially the same as a test of the null that the
estimated coefficients are equal in a generalized group-wise heteroskedastic least squares model.
Results of these tests, which provide statistical evidence for state-level heterogeneity, are also
reported in Appendix Table 1.
6 For clarity of exposition, this discussion ignores subscripts that pertain to the household.

32
Appendix Table 1: Random-coefficients regressions.
Households with Households with Households with Households with
persons with male person(s) female person(s) child (children)
disabilities with disabilities with disabilities with disabilities
Average monthly per capita expenditure -212.092***
-219.195***
-162.483***
-208.413***
(13.571) (20.747) (13.347) (15.111)
Test of parameter constancy
value 2319.89 1663.73 1583.60 1656.32
[0.000] [0.000] [0.000] [0.000]
Includes household characteristics YES YES YES YES
Household observations 32458 23830 22134 22095
Number of states 16 16 16 16
Notes: Weighted to national level with weights provided by NSSO (2002). In each column, the comparison group is households without persons with disabilities.
Bootstrapped standard errors, clustered by state, in parentheses. p-values in square brackets. Household characteristics included are rural status, whether the
religion of the household is Hinduism, whether the household belongs to SC/ST groups, the amount of land owned, age, gender, and literacy status of the
household head, and indicators of household structure. The notation ***
is p<0.01, **
is p<0.05, * is p<0.10. Regressions include a constant term.
![PERSONS WITH DISABILITIES ACT · Persons With Disabilities CAP. 133 LAWS OF KENYA PERSONS WITH DISABILITIES ACT CHAPTER 133 Revised Edition 2012 [2003] Published by the National Council](https://img.pdfslide.us/doc/110x75/5eb26c7ec7fa8751474b044c/persons-with-disabilities-persons-with-disabilities-cap-133-laws-of-kenya-persons.jpg)