Embed Size (px)
Citation preview

An Estimate of the Reliability of the Survey of Consumer Finances Risk-Tolerance
Question
John E. Grable1 Walter Schumm
Kansas State University
TCAI Working Paper University of Arizona
January 2007
This manuscript has not been previously published in any form.
1 Contact Information: John E. Grable, Ph.D., Institute of Personal Financial Planning, School of Family Studies and Human Services, 318 Justin Hall, Kansas State University, Manhattan, KS 66506; Phone: 785.532.1486; Fax: 785.532.5505; Email: [email protected]
SCF Risk Tolerance Reliability 1
An Estimate of the Reliability of the Survey of Consumer Finances Risk-Tolerance
Question
Summary. The reliability of the Survey of Consumer Finances risk-tolerance question
has not been reported in the literature. However, given the importance of reliability as a
necessary condition for validity there is a need to know and report the question’s
reliability estimate. The purpose of this paper is to provide such an estimate. Several
approaches were used to estimate the reliability of the question. Estimates of reliability
ranged from a low of .07 to a high of .78. Although no precise reliability figure emerged
from the analyses, results suggest that the reliability of the item most likely falls in the
range of .52 to .59, with .59 being the most likely estimate of reliability.
Key Words: Survey of Consumer Finances (SCF), risk tolerance, reliability, validity
SCF Risk Tolerance Reliability 2
The impact of a person’s willingness to engage in financial behaviors in which
there can be definite negative outcomes is a topic that has interested researchers working
in the consumer and personal finance fields for decades. Over the past ten years, for
instance, financial risk tolerance has been studied as a factor influencing household debt
(Godwin, 1998), racial differences in decision making (Gutter, Fox, & Montalto, 1999),
housing cost burdens (DeVaney, Chiremba, & Vincent, 2004), and the willingness to
invest for retirement (Cavanagh & Sharpe, 2002), to name just a few topics that relate to
how willing individuals are to take financial risk.
Among family and consumer economists and personal finance researchers one
question continues to be widely used to assess the willingness of individuals to take
financial risks. That one item is known as the Survey of Consumer Finances (SCF) risk-
tolerance question. The question is shown below:
Which of the following statements on this page comes closest to the amount of
financial risk that you are willing to take when you save or make investments?
1. Take substantial financial risk expecting to earn substantial returns.
2. Take above average financial risks expecting to earn above average returns.
3. Take average financial risks expecting to earn average returns.
4. Not willing to take any financial risks.
The popularity of this item among researchers is based on several factors. First, the item
is one of the only risk-tolerance questions asked in national surveys of consumers. As
such, responses can be used to gauge the general risk-taking preferences of Americans,
whereas many other surveys that ask risk questions are limited in generalizability to the
U.S. population. Second, the wide use of the item has generally been recognized as a
SCF Risk Tolerance Reliability 3
measure offering a high degree of face validity. While it is true that some researchers
have argued that the item may not be a “good proxy for people’s true risk aversion”
(Chen & Finke, 1996, p. 94), the majority of researchers using the item continue to do so
assuming the question is a reliable substitute for longer more valid risk scales. Finally,
the item continues to be used because there are few other choices available for those who
want to assess risk tolerance with a nationally representative consumer finance database.
Given the SCF risk-tolerance question’s wide use, Grable and Lytton (2001)
conducted a test to determine the concurrent validity of the item. They presented 17
examples of how the item was used between 1993 and 2001. Grable and Lytton
concluded that the item does not fully represent the spectrum of financial risk tolerance.
They did, however, determine that the question is most closely linked with investment
choice attitudes. Although the concurrent validity coefficient (r = .54) was not
particularly strong, it was noted that the item’s validity was sufficient for continued use
in exploratory studies, as long as researchers acknowledged the potential validity threats
associated with the item’s use.i This paper extends Grable and Lytton’s analysis by
testing whether or not the ongoing use of the SCF risk-tolerance question offers
researchers and end users sufficient reliability. Several estimates of the SCF risk-
tolerance question’s reliability are presented in an effort to answer this important
question.
Reliability Defined
Pedhazur and Schmelkin (1991) reported that a “measure cannot be valid, if it is
not reliable” (p. 81). Reliability refers to how free an item or scale is from measurement
error. Another way to think about reliability is how consistent a measure is from one use
SCF Risk Tolerance Reliability 4
to another. The lower the level of random error the higher the reliability (Vogt, 1993).
There are several ways the reliability of a scale can be measured, such as using split-half
estimates, test-retest estimates, and internal-consistency estimates. According to
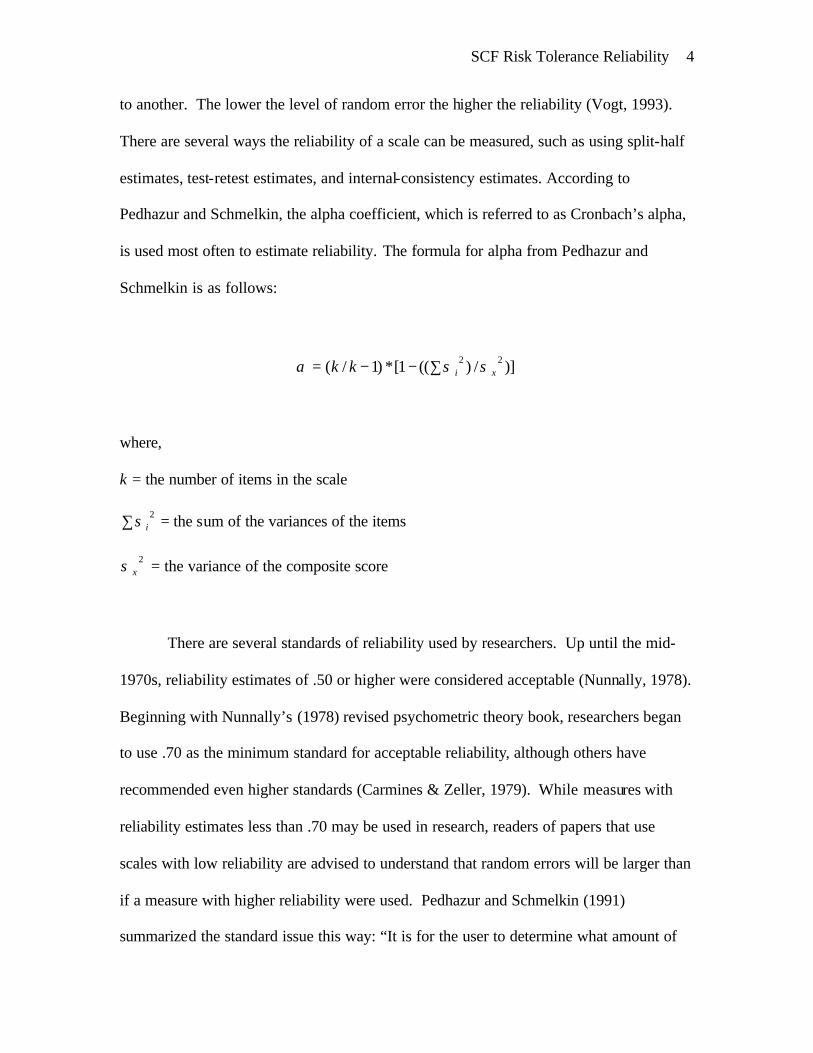
Pedhazur and Schmelkin, the alpha coefficient, which is referred to as Cronbach’s alpha,
is used most often to estimate reliability. The formula for alpha from Pedhazur and
Schmelkin is as follows:
)]/)((1[*)1/( 22xikk σσα ∑−−=
where,
k = the number of items in the scale
2iσ∑ = the sum of the variances of the items
2xσ = the variance of the composite score
There are several standards of reliability used by researchers. Up until the mid-
1970s, reliability estimates of .50 or higher were considered acceptable (Nunnally, 1978).
Beginning with Nunnally’s (1978) revised psychometric theory book, researchers began
to use .70 as the minimum standard for acceptable reliability, although others have
recommended even higher standards (Carmines & Zeller, 1979). While measures with
reliability estimates less than .70 may be used in research, readers of papers that use
scales with low reliability are advised to understand that random errors will be larger than
if a measure with higher reliability were used. Pedhazur and Schmelkin (1991)
summarized the standard issue this way: “It is for the user to determine what amount of
SCF Risk Tolerance Reliability 5
error he or she is willing to tolerate, given the specific circumstances of the study (e.g.,
what the scores are to be used for, cost of the study)” (p. 110); however, high reliability
estimates are almost always preferred over lower ones.
As suggested in the preceding discussion, and as evidenced by the internal-
consistency reliability formula, Cronbach’s alpha is traditionally estimated for multiple
item scales. The alpha formula shown above cannot accommodate single item measures
(Zeller & Carmines, 1980). This is the reason few researchers calculate or report
reliability estimates for the SCF risk-tolerance question. This does not mean, however,
that reliability cannot or should not be estimated for measures like the SCF risk-tolerance
question. According to Zeller and Carmines, from a measurement perspective, using a
single indicant “is highly undesirable … unless there is a priori information available” (p.
48) to quantify the indicant’s reliability. The purpose of this paper is to use a priori
information to provide an estimate of the SCF risk-tolerance question’s reliability.
Method
Data were obtained from a randomly selected convenience sample of faculty and
staff at a large southeastern state university using a survey methodology. The survey
response rate was 54%. The sample (N = 1,075) was over-weighted with women (55%),
non-Hispanic Whites (90%), and those that were married (72%). Household incomes
ranged from a low of $20,000 to over $90,000 per year. The mean age of respondents
was 43 years.
During the survey process respondents were asked to answer a series of risk-
tolerance assessment questions, including those used by Grable and Lytton (1999) in their
13-item risk-tolerance summated scale. The mean risk score for respondents in this study
SCF Risk Tolerance Reliability 6
on the 13-item scale was 25.43, with a standard deviation of 5.31. Scores ranged from a
low of 13 to a high of 44. Low scores were interpreted to mean a low level of risk
tolerance, and vice-a-versa. The scale is generally considered to offer researchers a
reasonable level of validity and reliability (Grable & Lytton, 2003; Yang, 2004). Based
on responses from those in the sample, the Cronbach’s alpha (i.e., a measure of
reliability) was determined to be .75. This corresponds to reported alphas ranging from
.70 to .85 in other studies.
During the survey process respondents were also asked to answer the SCF risk-
tolerance question. The range of responses was as follows:
a. 4% “willing to take substantial financial risk expecting to earn substantial
returns.” [Coded 4]
b. 22% “willing to take above average financial risks expecting to earn above
average returns.” [Coded 3]
c. 56% “willing to take average financial risks expecting to earn average
returns.” [Coded 2]
d. 18% “not willing to take any financial risks.” [Coded 1]
The mean score was 2.11, with a standard deviation of .73. The distribution of answers
was different than what is typically noted in the Survey of Consumer Finances, but
similar to what others have found when assessing professional audiences (see Grable &
Lytton, 2001, p. 48). Overall, fewer respondents answered that they were not willing to
take any financial risks compared to what has been reported in the literature when the
item is used nationally. Following the same procedure used by Grable and Lytton (2001),
SCF Risk Tolerance Reliability 7
responses to the SCF risk-tolerance question were correlated with the 13- item risk scale.
A correlation of .54 was noted.
The reliability and correlation data obtained from the survey were used in a series
of tests to estimate the reliability of the SCF risk-tolerance question. A description of
each test and the results are presented below.
Test One
According to Thorndike (2005), “The ceiling for the possible validity of a test is
set by its reliability” (p. 124). “Alpha provides a conservative estimate of a measure’s
reliability” (Carmines & Zeller, 1979, p. 45). In terms of the SCF risk-tolerance
question, an estimated reliability will indicate the amount of random error that is being
measured. It is possible to estimate a maximum level of reliability for an item if (a) the
correlation between the item and another measure is known, and (b) if the reliability of
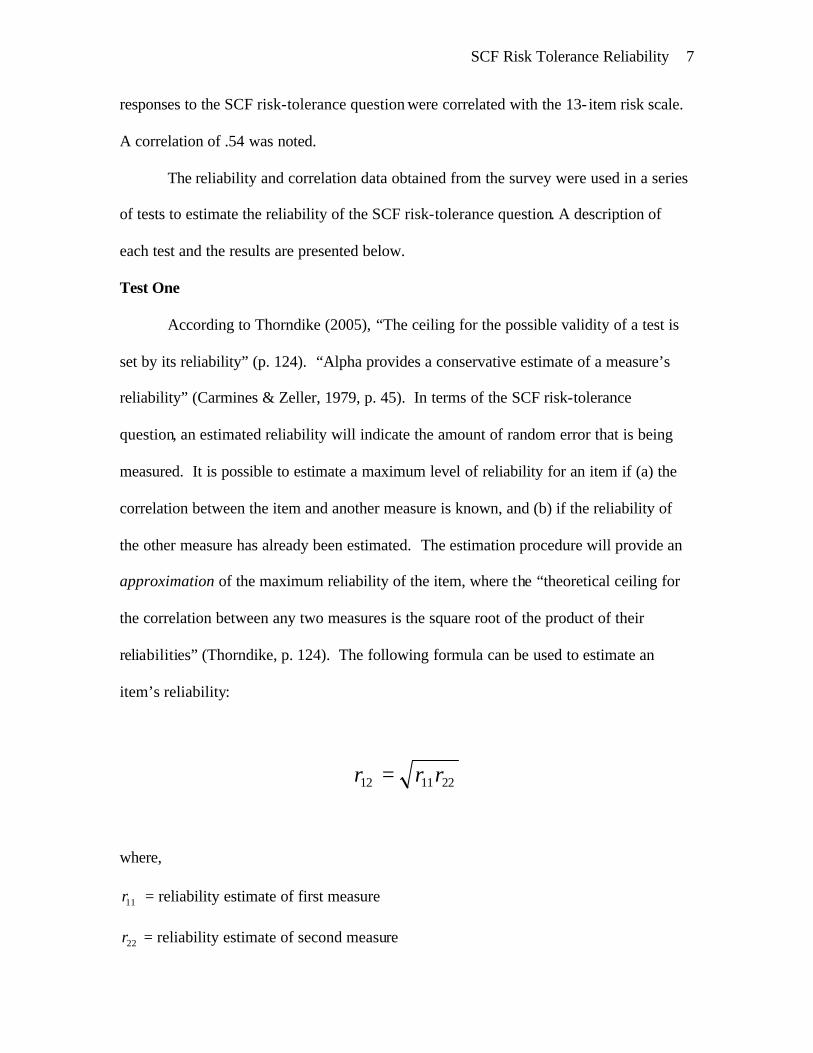
the other measure has already been estimated. The estimation procedure will provide an
approximation of the maximum reliability of the item, where the “theoretical ceiling for
the correlation between any two measures is the square root of the product of their
reliabilities” (Thorndike, p. 124). The following formula can be used to estimate an
item’s reliability:
221112 rrr =
where,
11r = reliability estimate of first measure
22r = reliability estimate of second measure
SCF Risk Tolerance Reliability 8
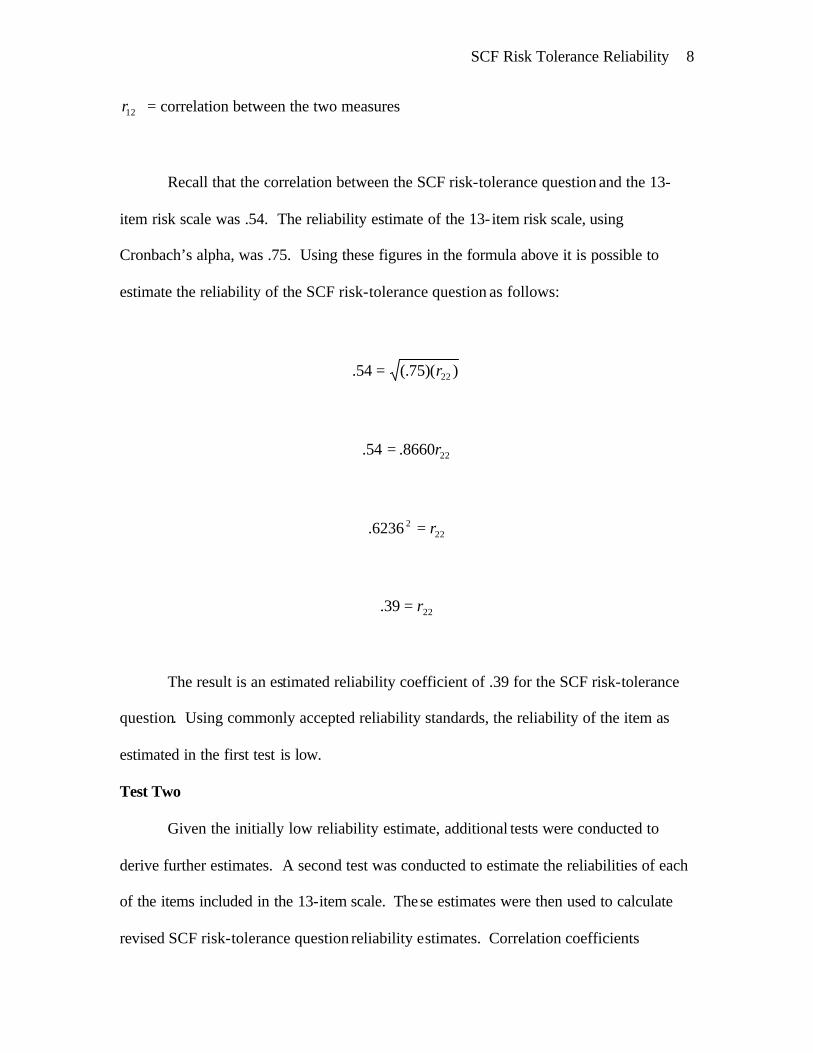
12r = correlation between the two measures
Recall that the correlation between the SCF risk-tolerance question and the 13-
item risk scale was .54. The reliability estimate of the 13- item risk scale, using
Cronbach’s alpha, was .75. Using these figures in the formula above it is possible to
estimate the reliability of the SCF risk-tolerance question as follows:
))(75(.54. 22r=
228660.54. r=
2226236. r=
2239. r=
The result is an estimated reliability coefficient of .39 for the SCF risk-tolerance
question. Using commonly accepted reliability standards, the reliability of the item as
estimated in the first test is low.
Test Two
Given the initially low reliability estimate, additional tests were conducted to
derive further estimates. A second test was conducted to estimate the reliabilities of each
of the items included in the 13-item scale. These estimates were then used to calculate
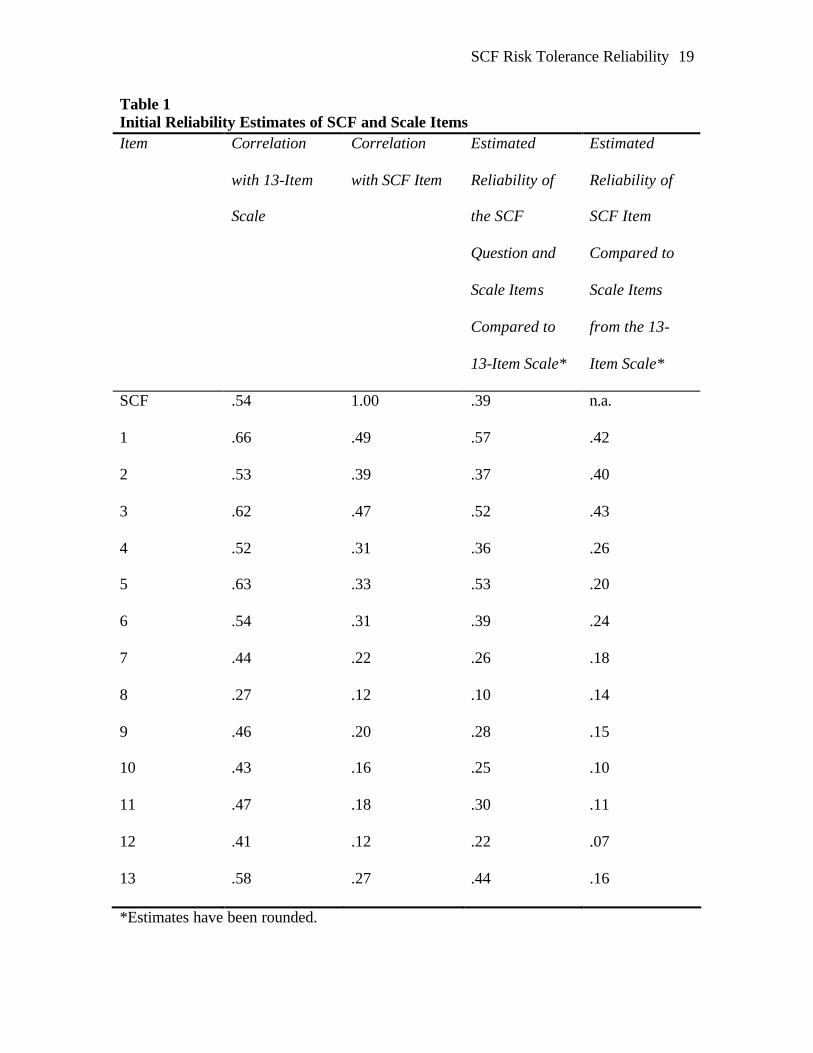
revised SCF risk-tolerance question reliability estimates. Correlation coefficients
SCF Risk Tolerance Reliability 9
between each item in the scale and the 13- item scale and each scale item and the SCF
risk-tolerance question are shown in columns two and three, respectively, of Table 1.
Based on the correlation coefficients and calculated item reliabilities, an approximation
of the SCF risk-tolerance question’s reliability was calculated 13 times, as shown in
Table 1 column 5. Using this procedure, a slight improvement in the estimation was
noted using items 1, 2, and 3; however, the estimates were still relatively low.
Insert Table 1 About Here
Test Three
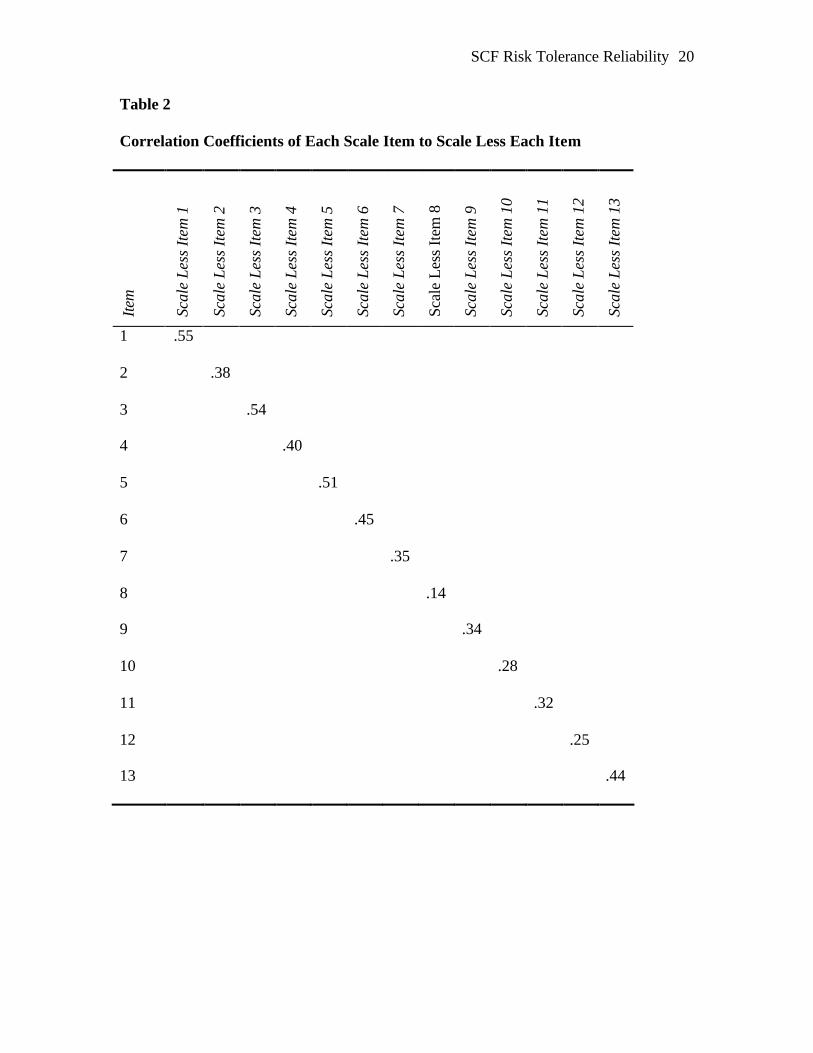
One potential problem with the method used in the second test is that each of the 13 scale
items was correlated with the full 13- item scale. This resulted in a correlation coefficient
that was based partly on each item’s correlation with itself, which likely overestimated
the correlation coefficient. In order to address this issue, 13 revised scales were created.
The revised scales consisted of 12 items. The first revised scale included all scale
questions less the first item. The second scale included all questions less the second
question and so forth. Correlations between each item and the reduced- item scale from
which the item was taken were calculated. Results are presented in Table 2.
Insert Table 2 About Here
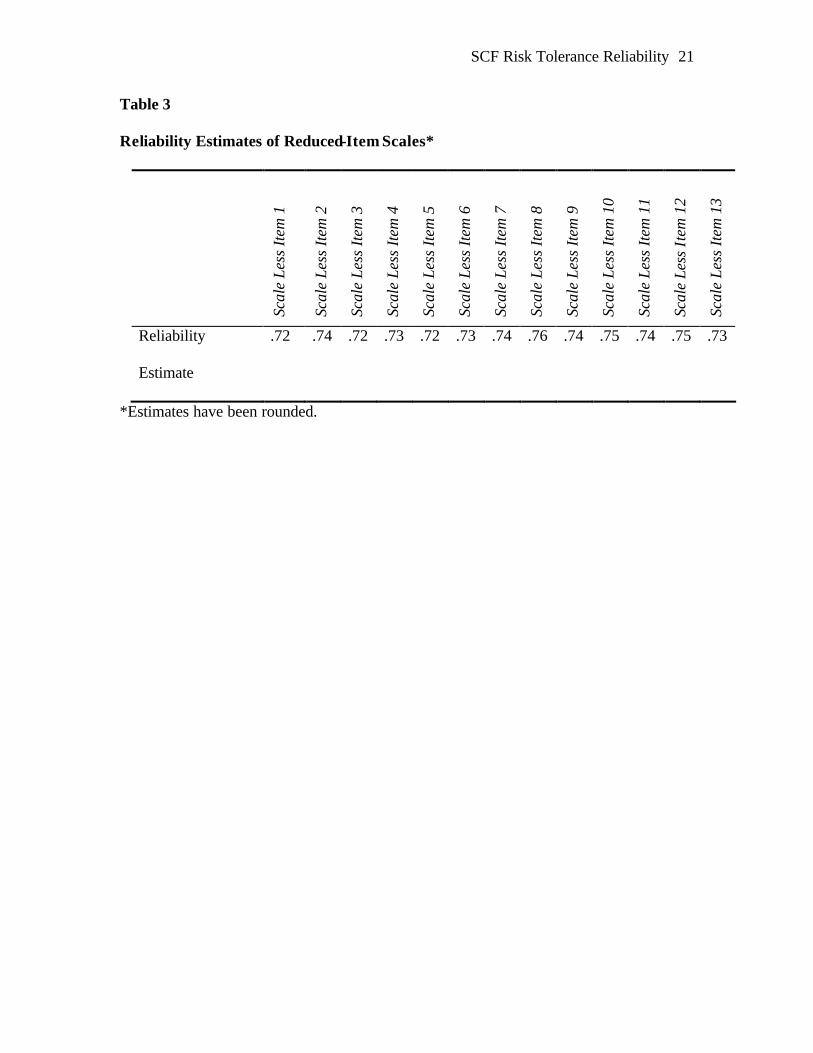
A reliability estimate, using Cronbach’s alpha, was calculated for each of the
revised scales. The results are shown in Table 3.
Insert Table 3 About Here
Based on the correlations between each item and the reduced-item scale from
which the item was taken (Table 2) and the reliability estimates of the reduced- item
scales (Table 3), it was possible to estimate a reliability for each of the individual scale
SCF Risk Tolerance Reliability 10
items. These estimates are shown in Table 4. As expected, the reliability estimates were
lower than originally calculated (Table 1).
A revised estimation of the SCF risk-tolerance question’s reliability was
calculated using the correlation coefficients from column three in Table 1 and the
reliability estimates of the scale items (Table 4). The reliability estimate was higher than
initially calculated when compared to items 1, 2, 3, and 4 (Table 5).
Insert Table 4 About Here
Insert Table 5 About Here
Test Four
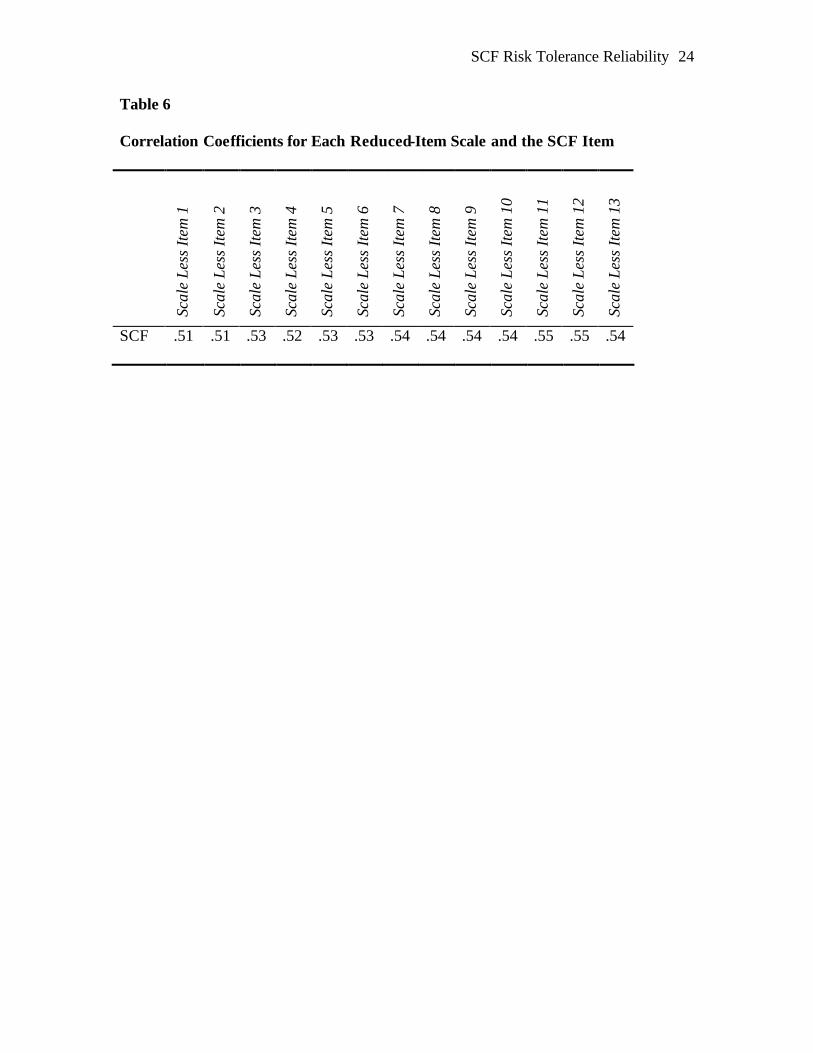
A similar test was conducted to estimate the reliability of the SCF risk-tolerance
question directly from the reduced- item scale reliabilities (Table 3). In order to make the
estimations, correlations between each reduced- item scale and the SCF risk-tolerance
question were needed. The calculated coefficients are presented in Table 6.
Insert Table 6 About Here
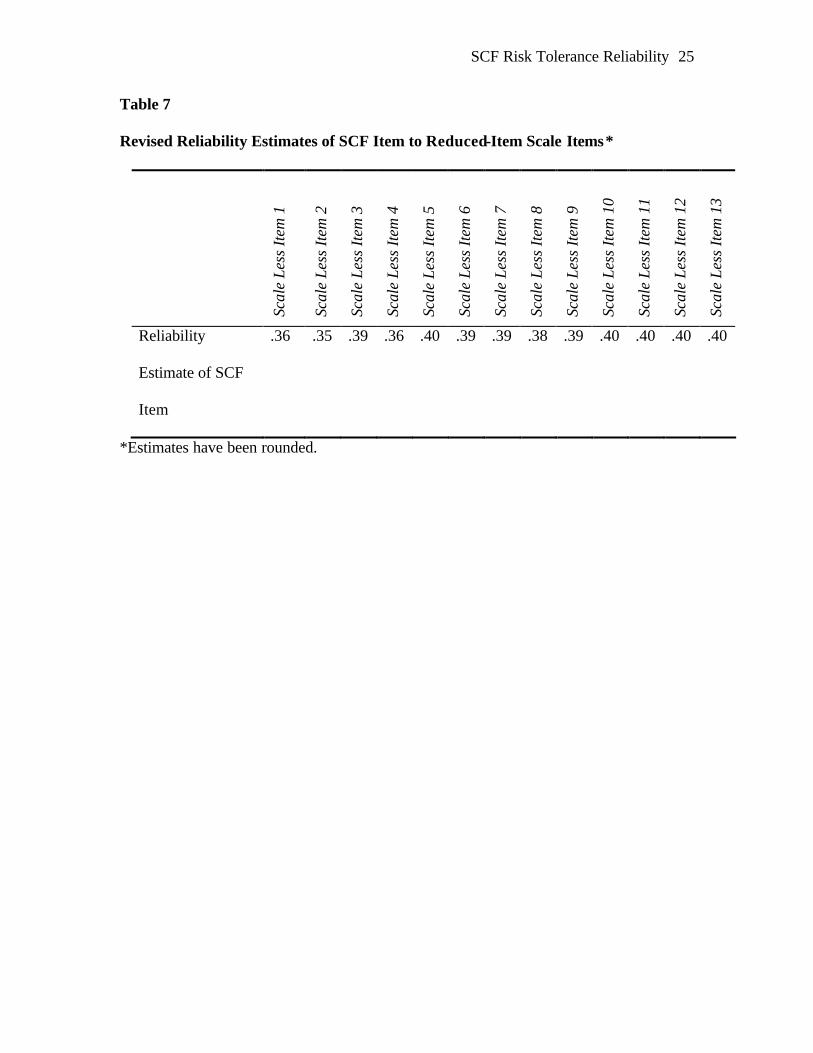
Data from Tables 3 and 6 were then used to calculate revised reliability estimates
for the SCF risk-tolerance question (Table 7). In general, the estimated reliabilities using
this procedure were low but in line with the initial estimate of .39.
Insert Table 7 About Here
Test Five
Results from Test Three showed that the reliability estimate of the SCF risk-
tolerance question could be as high as .78 when compared to Item 2. This estimate was
the highest calculated among all four tests. Two factors resulted in this approximation.
First, the correlation between Item 2 and the SCF risk-tolerance question was .39, and
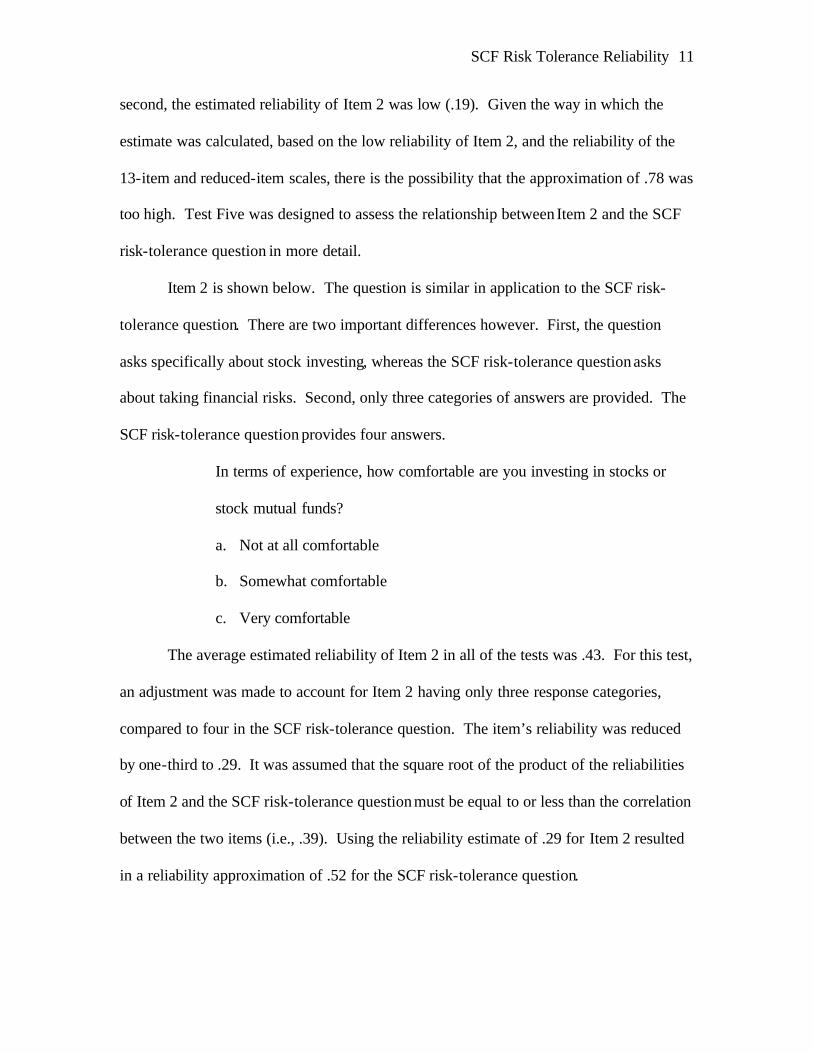
SCF Risk Tolerance Reliability 11
second, the estimated reliability of Item 2 was low (.19). Given the way in which the
estimate was calculated, based on the low reliability of Item 2, and the reliability of the
13-item and reduced-item scales, there is the possibility that the approximation of .78 was
too high. Test Five was designed to assess the relationship between Item 2 and the SCF
risk-tolerance question in more detail.
Item 2 is shown below. The question is similar in application to the SCF risk-
tolerance question. There are two important differences however. First, the question
asks specifically about stock investing, whereas the SCF risk-tolerance question asks
about taking financial risks. Second, only three categories of answers are provided. The
SCF risk-tolerance question provides four answers.
In terms of experience, how comfortable are you investing in stocks or
stock mutual funds?
a. Not at all comfortable
b. Somewhat comfortable
c. Very comfortable
The average estimated reliability of Item 2 in all of the tests was .43. For this test,
an adjustment was made to account for Item 2 having only three response categories,
compared to four in the SCF risk-tolerance question. The item’s reliability was reduced
by one-third to .29. It was assumed that the square root of the product of the reliabilities
of Item 2 and the SCF risk-tolerance question must be equal to or less than the correlation
between the two items (i.e., .39). Using the reliability estimate of .29 for Item 2 resulted
in a reliability approximation of .52 for the SCF risk-tolerance question.
SCF Risk Tolerance Reliability 12
Given the similar content of Item 2 and the SCF risk-tolerance question it was
then assumed that the reliabilities of the two items could be similar. Based on this
assumption, a further analysis was conducted. Adjusting Item 2 by a factor of one-third
to account for fewer response categories, and with the correlation unchanged (.39),
resulted in a reliability estimate of .26 (i.e., .39 x .67) for Item 2. This, in turn, generated
an estimated reliability coefficient of .59 for the SCF risk-tolerance question.
Discussion
Several approaches were used to estimate the reliability of the SCF risk-tolerance
question. Estimates of reliability ranged from a low of .07 to a high of .78. The initial
estimate, based on the correlation between the SCF risk-tolerance question and a 13-item
risk-tolerance scale with a known reliability of .75 was .39. Although no precise
reliability figure emerged from the analyses, Test Five provided the most useful insight
into the likely maximum reliability for the SCF risk-tolerance question. Results suggest
that the reliability of the item most likely falls in the range of .52 to .59, with .59 being
the theoretical ceiling of the question’s reliability.
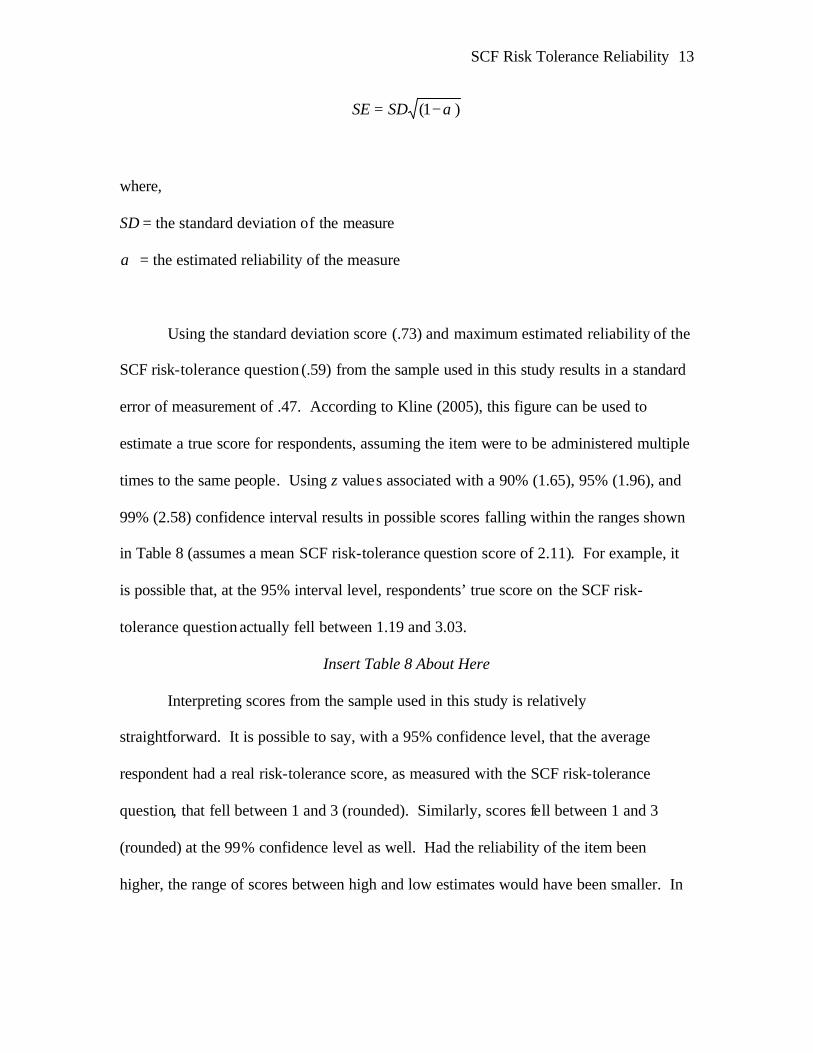
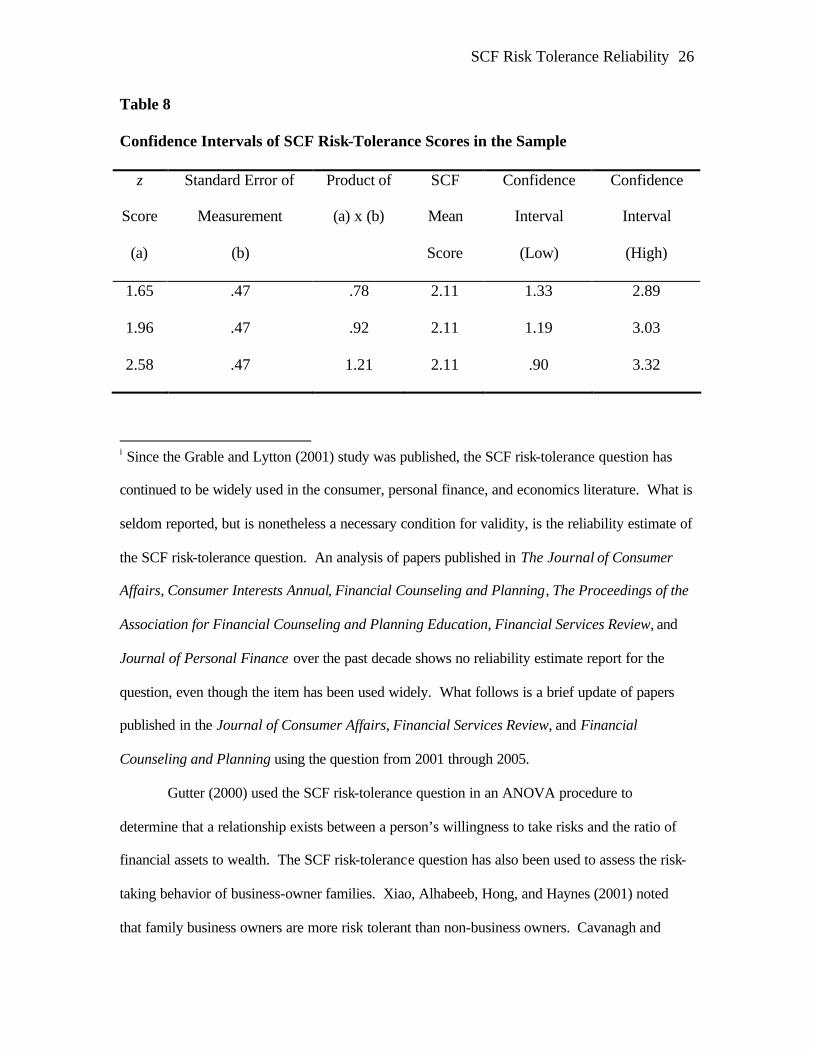
One way to interpret the reliability estimate is to establish confidence intervals
around a given score. Kline (2005) explained how this can be accomplished. First, the
standard deviation of scores from a particular sample should be calculated. Second, the
standard deviation score, along with the estimated reliability of the measure, should be
used to calculate the standard error of measurement. The outcome can then be used to
develop confidence intervals around any given score using the measure. The standard
error of measurement formula, from Kline, is as follows:
SCF Risk Tolerance Reliability 13
)1( α−= SDSE
where,
SD = the standard deviation of the measure
α = the estimated reliability of the measure
Using the standard deviation score (.73) and maximum estimated reliability of the
SCF risk-tolerance question (.59) from the sample used in this study results in a standard
error of measurement of .47. According to Kline (2005), this figure can be used to
estimate a true score for respondents, assuming the item were to be administered multiple
times to the same people. Using z values associated with a 90% (1.65), 95% (1.96), and
99% (2.58) confidence interval results in possible scores falling within the ranges shown
in Table 8 (assumes a mean SCF risk-tolerance question score of 2.11). For example, it
is possible that, at the 95% interval level, respondents’ true score on the SCF risk-
tolerance question actually fell between 1.19 and 3.03.
Insert Table 8 About Here
Interpreting scores from the sample used in this study is relatively
straightforward. It is possible to say, with a 95% confidence level, that the average
respondent had a real risk-tolerance score, as measured with the SCF risk-tolerance
question, that fell between 1 and 3 (rounded). Similarly, scores fell between 1 and 3
(rounded) at the 99% confidence level as well. Had the reliability of the item been
higher, the range of scores between high and low estimates would have been smaller. In

SCF Risk Tolerance Reliability 14
other words, the confidence generated by answers to the question would have been
stronger.
The results of this study are potentially controversial. The low initial level of
reliability estimated for the SCF risk-tolerance question (i.e., .39) and the wide range of
subsequent reliability estimates may cause some to question the sample from which the
estimates were generated. In many respects, the estimation procedure was heavily
influenced by the sample used in this study. Respondent characteristics differed
substantially from those sampled in the SCF. In this study, respondents were better
educated than SCF respondents. Respondents also differed in terms of other
demographic characteristics. More non-Hispanic Whites and women were present in the
sample than what would normally be found in the weighted SCF data. These are all
factors that might account for a relatively higher reported willingness to take risks than is
generally reported in studies that use SCF data. On the other hand, although the sample
differs from the national SCF demographic profile, this should not dramatically invalidate
the results of this study. If the reliability of the SCF risk-tolerance question is higher at
the national level then it should also remain high when used with sub-samples of U.S.
households. If it turns out that the question’s reliability varies considerably from one
sample to another, this may mean that more significant validity issues may be being
violated.
As suggested above, given the relatively homogenous nature of the sample, it is
reasonable to assume that the estimated reliability coefficient for the SCF risk-tolerance
question obtained in this study might be somewhat lower than an estimate derived from a
national sample. The question that remains unanswered is how much lower? One way to
SCF Risk Tolerance Reliability 15
answer this question is to develop correlations between the question and other valid and
reliable scales and items. Grable and Lytton (2001) attempted to do this using the 13-
item risk scale and its subcomponents. Their results indicated that the correlation
between the item and other reasonable multi- item measures of risk tolerance did not
exceed .60. In order to generate a .70 reliability estimate for the SCF risk-tolerance
question, the correlation between the 13- item risk scale and the question would need to
be .72; this level of correlation has not been reported in the literature with the 13-item
scale or any other measure.
Further research is warranted to test the validity of both the 13-item risk-tolerance
scale and the SCF risk-tolerance question. Ideally, it would be useful to obtain
correlation estimates between the SCF risk-tolerance question and other known scales
that show acceptable levels of validity and reliability. It would be particularly helpful if
such a study could be conducted using national norms for sample selection. It is in this
way that a more accurate estimate of the item’s reliability can be established. Until such
research is conducted and disseminated, researchers who use the SCF risk-tolerance
question ought to consider the possibility that the item’s reliability is relatively low, and
probably no higher than .59, and take steps to account for this possibility when
interpreting findings.
SCF Risk Tolerance Reliability 16
References
Carmines, E. G., & Zeller, R. A. (1979). Reliability and validity assessment. Beverly
Hills, CA: Sage.
Cavanagh, J. A., & Sharpe, D. L. (2002). The impact of debt levels on participation in
and level of discretionary retirement savings. Financial Counseling and Planning,
13 (1), 47-60.
Chen, P., & Finke, M. S. (1996). Negative net worth and the life cycle hypothesis.
Financial Counseling and Planning, 7 (1), 87-96.
Coleman, S. (2003). Risk tolerance and the investment behavior of Black and Hispanic
heads of household. Financial Counseling and Planning, 14 (2), 43-52.
DeVaney, S. A., Chiremba, S., & Vincent, A-M. (2004). Life cycle stage and housing
cost burden. Financial Counseling and Planning, 15 (1), 31-40.
Godwin, D. D. (1998). Household debt quintiles: Explaining changes 1983-1989. The
Journal of Consumer Affairs, 32, 369-393.
Grable, J. E., & Lytton, R. H. (2001). Assessing the concurrent validity of the SCR risk
tolerance question. Financial Counseling and Planning, 12 (2), 43-54.
Grable, J. E., & Lytton, R. H. (2003). Testing the validity of a risk assessment instrument.
Financial Services Review, 12, 257-274.
Gutter, M. S., Fox, J. J., & Montalto, C. P. (1999). Racial differences in investor decision
making. Financial Services Review, 8, 149-162.
Gutter, M. S. (2000). Human wealth and financial asset ownership. Financial Counseling
and Planning, 11 (2), 9-20.

SCF Risk Tolerance Reliability 17
King, A. S., & King, J. T. (2005). The decision between debit and credit: Finance
charges, float, and fear. Financial Services Review, 14, 21-36.
Kline, T. J. B. (2005). Psychological testing: A practical approach to design and
evaluation. Thousand Oaks, CA: Sage.
Nunnally, J. (1978). Psychometric theory (2nd ed.). New York: McGraw-Hill.
Pedhazur, E. J., & Schmelkin, L. P. (1991). Measurement, design, and analysis: An
integrated approach. Hillsdale, NJ: Lawrence Erlbaum Associates.
Spencer, H. L., & Fan, J. X. (2002). Savers, debtors, and simultaneous debtors and
savers. Financial Counseling and Planning, 13 (2), 25-38.
Thorndike, R. M. (2005). Measurement and evaluation in psychology and education.
Upper Saddle River, NJ: Pearson.
Vogt, W. P. (1993). Dictionary of statistics and methodology. Newbury Park, CA: Sage
Xiao, J. J., Alhabeeb, M. J., Hong, G-S., & Haynes, G. W. (2001). Attitude toward risk
and risk-taking behavior of business owing families. The Journal of Consumer
Affairs, 35, 307-325.
Yang, Y. (2004). Characteristics of risk preferences: revelations from Grable & Lytton’s
13-items questionnaire. Journal of Personal Finance, 3 (3), 20-40.
Yao, R., Hanna, S. D., & Montalto, C. P. (2002). Factors related to meeting the capital
accumulation ratio guideline. Financial Services Review, 11, 153-171.
Yao, R., Hanna, S. D., & Montalto, C. P. (2003). The capital accumulation ratio as an
indicator of retirement adequacy. Financial Counseling and Planning, 14 (2), 1-
12.

SCF Risk Tolerance Reliability 18
Yilmazer, T., & DeVaney, S. A. (2005). Household debt over the life cycle. Financial
Services Review, 14, 285-304.
Zeller, R. A., & Carmines, E. G. (1980). Measurement in the social sciences. London:
Cambridge University Press.
SCF Risk Tolerance Reliability 19
Table 1 Initial Reliability Estimates of SCF and Scale Items Item Correlation
with 13-Item
Scale
Correlation
with SCF Item
Estimated
Reliability of
the SCF
Question and
Scale Items
Compared to
13-Item Scale*
Estimated
Reliability of
SCF Item
Compared to
Scale Items
from the 13-
Item Scale*
SCF .54 1.00 .39 n.a.
1 .66 .49 .57 .42
2 .53 .39 .37 .40
3 .62 .47 .52 .43
4 .52 .31 .36 .26
5 .63 .33 .53 .20
6 .54 .31 .39 .24
7 .44 .22 .26 .18
8 .27 .12 .10 .14
9 .46 .20 .28 .15
10 .43 .16 .25 .10
11 .47 .18 .30 .11
12 .41 .12 .22 .07
13 .58 .27 .44 .16
*Estimates have been rounded.
SCF Risk Tolerance Reliability 20
Table 2
Correlation Coefficients of Each Scale Item to Scale Less Each Item Ite
m
Scal
e Le
ss It
em 1
Scal
e Le
ss It
em 2
Scal
e Le
ss It
em 3
Scal
e Le
ss It
em 4
Scal
e Le
ss It
em 5
Scal
e Le
ss It
em 6
Scal
e Le
ss It
em 7
Scal
e Le
ss It
em 8
Scal
e Le
ss It
em 9
Scal
e Le
ss It
em 1
0
Scal
e Le
ss It
em 1
1
Scal
e Le
ss It
em 1
2
Scal
e Le
ss It
em 1
3
1 .55
2 .38
3 .54
4 .40
5 .51
6 .45
7 .35
8 .14
9 .34
10 .28
11 .32
12 .25
13 .44
SCF Risk Tolerance Reliability 21
Table 3
Reliability Estimates of Reduced-Item Scales* Sc
ale
Less
Item
1
Scal
e Le
ss It
em 2
Scal
e Le
ss It
em 3
Scal
e Le
ss It
em 4
Scal
e Le
ss It
em 5
Scal
e Le
ss It
em 6
Scal
e Le
ss It
em 7
Scal
e Le
ss It
em 8
Scal
e Le
ss It
em 9
Scal
e Le
ss It
em 1
0
Scal
e Le
ss It
em 1
1
Scal
e Le
ss I
tem
12
Scal
e Le
ss It
em 1
3
Reliability
Estimate
.72 .74 .72 .73 .72 .73 .74 .76 .74 .75 .74 .75 .73
*Estimates have been rounded.

SCF Risk Tolerance Reliability 22
Table 4
Reliability Estimates of Scale Items Based on Reduced-Item Scale Reliabilities* Ite
m 1
Item
2
Item
3
Item
4
Item
5
Item
6
Item
7
Item
8
Item
9
Item
10
Item
11
Item
12
Item
13
Reliability
Estimate
.42 .19 .40 .21 .36 .28 .16 .03 .16 .11 .13 .08 .27
*Estimates have been rounded.

SCF Risk Tolerance Reliability 23
Table 5
Revised Estimate of Reliability for the SCF Item Compared to Estimated
Reliabilities of Scale Items*
Item
1
Item
2
Item
3
Item
4
Item
5
Item
6
Item
7
Item
8
Item
9
Item
10
Item
11
Item
12
Item
13
Reliability
Estimate of SCF
Item
.56 .78 .55 .44 .30 .34 .28 .51 .26 .24 .24 .18 .28
*Estimates have been rounded.
SCF Risk Tolerance Reliability 24
Table 6
Correlation Coefficients for Each Reduced-Item Scale and the SCF Item Sc
ale
Less
Item
1
Scal
e Le
ss It
em 2
Scal
e Le
ss It
em 3
Scal
e Le
ss It
em 4
Scal
e Le
ss It
em 5
Scal
e Le
ss It
em 6
Scal
e Le
ss It
em 7
Scal
e Le
ss It
em 8
Scal
e Le
ss It
em 9
Scal
e Le
ss It
em 1
0
Scal
e Le
ss It
em 1
1
Scal
e Le
ss It
em 1
2
Scal
e Le
ss It
em 1
3
SCF .51 .51 .53 .52 .53 .53 .54 .54 .54 .54 .55 .55 .54
SCF Risk Tolerance Reliability 25
Table 7
Revised Reliability Estimates of SCF Item to Reduced-Item Scale Items* Sc
ale
Less
Item
1
Scal
e Le
ss It
em 2
Scal
e Le
ss It
em 3
Scal
e Le
ss It
em 4
Scal
e Le
ss It
em 5
Scal
e Le
ss It
em 6
Scal
e Le
ss It
em 7
Scal
e Le
ss It
em 8
Scal
e Le
ss It
em 9
Scal
e Le
ss It
em 1
0
Scal
e Le
ss It
em 1
1
Scal
e Le
ss It
em 1
2
Scal
e Le
ss It
em 1
3
Reliability
Estimate of SCF
Item
.36 .35 .39 .36 .40 .39 .39 .38 .39 .40 .40 .40 .40
*Estimates have been rounded.
SCF Risk Tolerance Reliability 26
Table 8
Confidence Intervals of SCF Risk-Tolerance Scores in the Sample
z
Score
(a)
Standard Error of
Measurement
(b)
Product of
(a) x (b)
SCF
Mean
Score
Confidence
Interval
(Low)
Confidence
Interval
(High)
1.65 .47 .78 2.11 1.33 2.89
1.96 .47 .92 2.11 1.19 3.03
2.58 .47 1.21 2.11 .90 3.32
i Since the Grable and Lytton (2001) study was published, the SCF risk-tolerance question has
continued to be widely used in the consumer, personal finance, and economics literature. What is
seldom reported, but is nonetheless a necessary condition for validity, is the reliability estimate of
the SCF risk-tolerance question. An analysis of papers published in The Journal of Consumer
Affairs, Consumer Interests Annual, Financial Counseling and Planning, The Proceedings of the
Association for Financial Counseling and Planning Education, Financial Services Review, and
Journal of Personal Finance over the past decade shows no reliability estimate report for the
question, even though the item has been used widely. What follows is a brief update of papers
published in the Journal of Consumer Affairs, Financial Services Review, and Financial
Counseling and Planning using the question from 2001 through 2005.
Gutter (2000) used the SCF risk-tolerance question in an ANOVA procedure to
determine that a relationship exists between a person’s willingness to take risks and the ratio of
financial assets to wealth. The SCF risk-tolerance question has also been used to assess the risk-
taking behavior of business-owner families. Xiao, Alhabeeb, Hong, and Haynes (2001) noted
that family business owners are more risk tolerant than non-business owners. Cavanagh and

SCF Risk Tolerance Reliability 27
Sharpe (2002) used the item as an economic resource proxy for a household’s debt level as a
factor impacting retirement savings. They found a positive relationship between the decision to
participate in a retirement savings program and having above average risk, as measured by the
SCF risk-tolerance question. Spencer and Fan (2002) used the item to determine that people with
simultaneous debt and savings were more willing to take substantial to above average risks
compared to debtors.
Yao, Hanna, and Montalto (2002) utilized the SCF risk-tolerance question to conclude
that “households that are willing to take above average risk in order to obtain above average
returns are the most likely to meet capital accumulation ratios” (p. 165). In a similar study, Yao,
Hanna, and Montalto (2003) used the SCF risk-tolerance question as a factor in determining the
relationship between meeting the capital accumulation ratio guideline and retirement adequacy.
They did not find a relationship between being willing to take financial risks and be ing
adequately prepared for retirement. Coleman (2003) used the risk item as an outcome variable.
She found that Hispanic heads of households exhibited higher levels of risk aversion than non-
Hispanic Whites and African-Americans.
The SCF risk-tolerance question has also been used in studies that do not initially appear
to have much in common with risk assessment. DeVaney et al. (2004) used the item as a factor to
predict the affordability of housing cost debt. They found that as risk tolerance increased
households were 23% more likely to have an affordable housing cost burden. Others have used
the item to help predict household debt levels. King and King (2005) found no impact of risk
aversion on the probability that a household uses a debit card. Yilmazer and DeVaney (2005)
looked at the relationship between household debt changes and the impact of risk tolerance. They
noted that the probability of holding certain types of debt (e.g., non-mortgage, non-credit card)
increased from those willing to assume above average or substantial risk.
SCF Risk Tolerance Reliability 28
As these examples highlight, the SCF risk-tolerance question has been used extensively
in the consumer, personal finance, and economics literature. The importance of the item is well
established. There have been efforts taken to estimate the item’s validity, but there is little known
about the item’s reliability. The remainder of this paper explores issues related to reliability
assessment, and the procedures used to estimate the reliability of the SCF risk-tolerance question.