Embed Size (px)
Citation preview
Disclaimer
This Report, including the data and information contained in this Report, is provided to you on an
“as is” and “as available” basis at the sole discretion of the Government of Alberta and subject to the
terms and conditions of use below (the “Terms and Conditions”). The Government of Alberta has
not verified this Report for accuracy and does not warrant the accuracy of, or make any other
warranties or representations regarding, this Report. Furthermore, updates to this Report may not
be made available. Your use of any of this Report is at your sole and absolute risk.
This Report is provided to the Government of Alberta, and the Government of Alberta has obtained
a license or other authorization for use of the Reports, from:
Shell Canada Energy, Chevron Canada Limited. and Marathon Oil Canada Corporation, for
the Quest Project
(collectively the “Project”)
Each member of the Project expressly disclaims any representation or warranty, express or
implied, as to the accuracy or completeness of the material and information contained herein, and
none of them shall have any liability, regardless of any negligence or fault, for any statements
contained in, or for any omissions from, this Report. Under no circumstances shall the Government
of Alberta or the Project be liable for any damages, claims, causes of action, losses, legal fees or
expenses, or any other cost whatsoever arising out of the use of this Report or any part thereof or
the use of any other data or information on this website.
Terms and Conditions of Use
Except as indicated in these Terms and Conditions, this Report and any part thereof shall not be
copied, reproduced, distributed, republished, downloaded, displayed, posted or transmitted in any
form or by any means, without the prior written consent of the Government of Alberta and the
Project.
The Government of Alberta’s intent in posting this Report is to make them available to the public
for personal and non-commercial (educational) use. You may not use this Report for any other
purpose. You may reproduce data and information in this Report subject to the following
conditions:
• any disclaimers that appear in this Report shall be retained in their original form and
applied to the data and information reproduced from this Report
• the data and information shall not be modified from its original form
• the Project shall be identified as the original source of the data and information, while this
website shall be identified as the reference source, and
• the reproduction shall not be represented as an official version of the materials reproduced,
nor as having been made in affiliation with or with the endorsement of the Government of
Alberta or the Project

By accessing and using this Report, you agree to indemnify and hold the Government of Alberta and
the Project, and their respective employees and agents, harmless from and against any and all
claims, demands, actions and costs (including legal costs on a solicitor-client basis) arising out of
any breach by you of these Terms and Conditions or otherwise arising out of your use or
reproduction of the data and information in this Report.
Your access to and use of this Report is subject exclusively to these Terms and Conditions and any
terms and conditions contained within the Report itself, all of which you shall comply with. You will
not use this Report for any purpose that is unlawful or prohibited by these Terms and Conditions.
You agree that any other use of this Report means you agree to be bound by these Terms and
Conditions. These Terms and Conditions are subject to modification, and you agree to review them
periodically for changes. If you do not accept these Terms and Conditions you agree to immediately
stop accessing this Report and destroy all copies in your possession or control.
These Terms and Conditions may change at any time, and your continued use and reproduction of
this Report following any changes shall be deemed to be your acceptance of such change.
If any of these Terms and Conditions should be determined to be invalid, illegal or unenforceable
for any reason by any court of competent jurisdiction then the applicable provision shall be severed
and the remaining provisions of these Terms and Conditions shall survive and remain in full force
and effect and continue to be binding and enforceable.
These Terms and Conditions shall: (i) be governed by and construed in accordance with the laws of
the province of Alberta and you hereby submit to the exclusive jurisdiction of the Alberta courts,
and (ii) ensure to the benefit of, and be binding upon, the Government of Alberta and your
respective successors and assigns.
GS.10.52419
GS.10.52419
Quest CCS Project RAM Study – Final Report
Quest CCS Project RAM Study – Final Report
by
R.M. Stephens
GS.10.52419 1
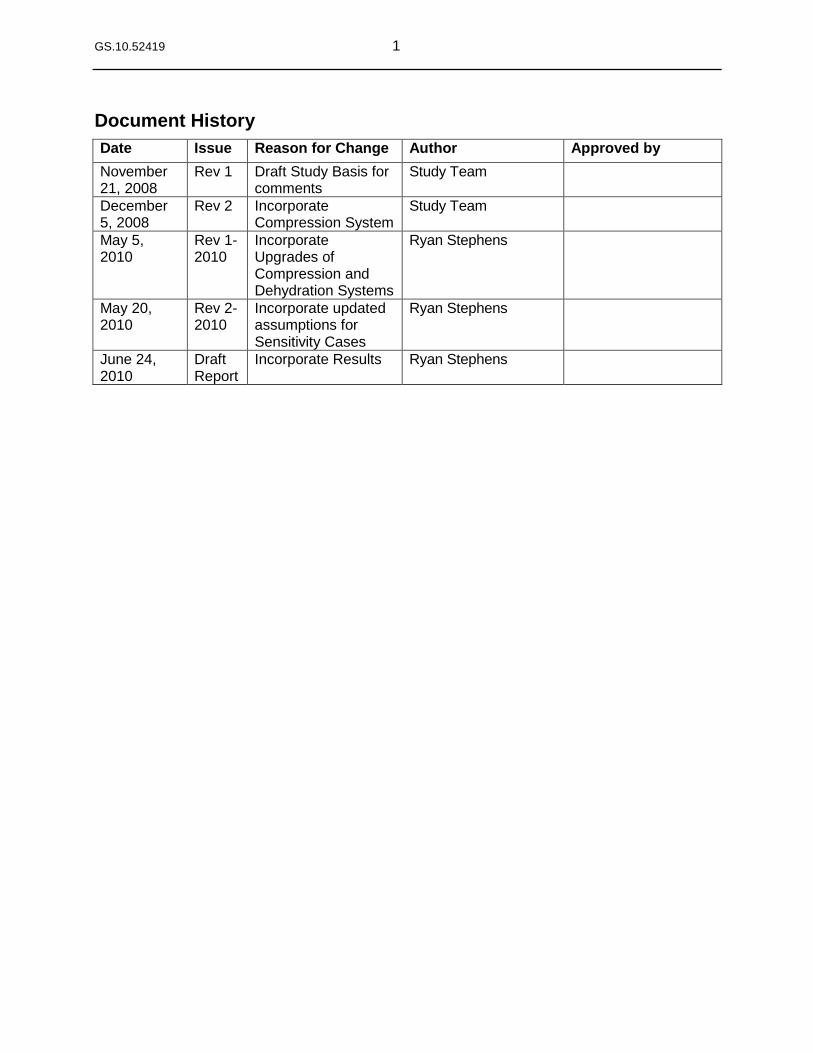
Document History
Date Issue Reason for Change Author Approved by
November 21, 2008
Rev 1 Draft Study Basis for comments
Study Team
December 5, 2008
Rev 2 Incorporate Compression System
Study Team
May 5, 2010
Rev 1-2010
Incorporate Upgrades of Compression and Dehydration Systems
Ryan Stephens
May 20, 2010
Rev 2-2010
Incorporate updated assumptions for Sensitivity Cases
Ryan Stephens
June 24, 2010
Draft Report
Incorporate Results Ryan Stephens
GS.10.52419 2
Executive Summary
Shell Global Solutions has performed an update to the reliability study for the CO2 capture, compression, and storage facility that has been proposed for the Scotford Upgrader. The study was used to determine the availability of the facility, identify key equipment that contributes to the downtime of the system, then use sensitivity analysis to quantify the impact of alternative design configurations. Reliability data was taken from previous studies performed for Shell Canada and other refineries. For the Base Case, the average production efficiency was predicted to be 95.5%. The compression section contributed the majority of the losses. An alternative equipment configuration (Sensitivity 3) was considered, with air cooling changed to water cooling. The alternative configuration had an expected production efficiency of 97.6%. Several other scenarios were simulated to include the impact of the pipeline and well injection facilities, and to investigate the sparing of pumps and compressors. A lean-amine only case was also run to consider a low-CAPEX case.
GS.10.52419 3
Table of Contents
Document History 1
Executive Summary 2
1. Introduction 5
2. Scope, Objectives, and Deliverables 6
2.1 Objectives 6 2.2 Scope 6 2.3 Deliverables 7 2.4 General Assumptions 7 2.5 Level of Study 8 2.6 Study Input Data 8
3. Modeling Assumptions 9 3.1 Introduction 9 3.2 Overall System Assumptions 9 3.2.1 Overall System Configuration 9 3.3 Equipment Modeling Assumptions 11 3.3.1 Introduction 11 3.3.2 Reliability Block Diagrams 11 3.3.3 CO2 Absorption Section 12 3.3.4 ADIP-X (Accelerated MDEA) Regeneration Section 13 3.3.4.1 Amine Flash Regeneration Section 13 3.3.4.2 Amine Stripper Section 14 3.3.4.3 Cooling and Filtering Section 15 3.3.5 CO2 Compression Section 16 3.3.6 CO2 Dehydration Section 17
4. Unit Reliability Data 18 4.1 Data Sources 19 4.2 Reliability Data Table 20 4.3 Maintenance and Operations 25 4.3.1 Work Prioritization 25 4.3.2 Mobilization and Delay Times 25 4.3.3 Restart Times 25 4.3.4 Spare Parts 25 4.3.5 Scheduled Unit Shutdowns 25
5. Base Case Results – Lean / SemiLean System with Air Cooling 26
6. Sensitivities 30
6.1 Overview 30 6.2 Design Class 1 (Sensitivity 1) – [Lean/SemiLean with AirCooling, Reduced
Pump Redundancy] 30 6.3 Amine Regeneration Section Pump Redundancy (Sensitivity 2) -
Lean/SemiLean with Air Cooling, Reduced Pump Redundancy 31 6.4 Alternative Equipment Configuration (Sensitivity 3) – Change from Air Cooling
to Water Cooling 33 6.4.1 Description 33 6.4.2 Sensitivity Results 34 6.5 CO2 Export Pipeline and Injection Wells (Sensitivity 4) 35
GS.10.52419 4
6.5.1 Scheduled Well Shutdowns 37 6.5.2 Pigging 38 6.5.3 Pipeline/Wells Sensitivity Results 41 6.6 2x50% and 2 x 100% Spared Compressors (Sensitivity 5) – Design Class 3 41 6.7 Lean Amine Only Case (Sensitivity 6) – Low CAPEX Case 42
Appendix A. CO2 Capture System Reliability Block Diagram 43
Bibliographic Information 50
Report distribution 51
GS.10.52419 5
1. Introduction
The Athabasca Oil Sands Project (AOSP) is a joint venture between Shell Canada Limited, Chevron Canada Limited and Western Oil Sands L. P. The existing AOSP (―Base Plant‖) was brought into operation in early 2003. The Base Plant consists of an Upstream facility at the Muskeg River Mine site and a Downstream facility (the Scotford Upgrader) located near Fort Saskatchewan. A southbound diluted bitumen (―dilbit‖) pipeline and a northbound diluent pipeline, owned and operated by Terasen, connect the two sites. To position the Athabasca Oil Sands Project with the necessary stakeholder support for the initial project and for future growth, a significant voluntary commitment was made by Shell Canada to reduce the Base Plant‘s full cycle green house gas (GHG) emissions by 50%. The technology that will contribute to meeting this commitment is to capture CO2 from the existing Baseplant and Expansion 1 Upgrader Hydrogen Manufacturing Units (HMUs) located at Shell‘s Scotford Upgrader site near Ft. Saskatchewan, Alberta. Shell Canada is planning to build CO2 Capture and Compression facilities to process 1.2 million tons of CO2 per year. These facilities would capture the CO2 produced at the Upgrader HMUs where hydrogen is produced for the conversion of bitumen to synthetic crude oil. A high-level reliability study was performed during year 2009 to determine the overall availability of the proposed CO2 Capture System in order to assess if any potential affect of unavailability on the HMU units. Shell Canada has requested an update to last year‘s study to reflect the following design changes (to the base case):
Equipment that has been removed: Lean Amine Trim Cooler 1 TEG Filter TEG Surge Drum TEG Still Column
Equipment that has been added: Absorber Water Wash Pumps TEG KO Drum
Compression stages have been increased from 4 to 8 This change increases the amount of KO Drums by 3 This change increases the amount of Intercoolers by 4 The current model includes failure modes per compression stage, in contrast to
last year‘s model, where a single failure mode was assumed for the whole compressor.
All compression stages remain driven by a single electric motor. The Still Column and Surge Tank that were adjacent to the TEG Stripping Column were
removed. This document details the basic data, study results, and assumptions from which the reliability model of the CO2 Capture System was constructed. The study was conducted using the reliability simulation software TARO.
GS.10.52419 6
2. Scope, Objectives, and Deliverables
2.1 Objectives
Shell Global Solutions (WTC) has been requested to perform an update to the reliability study of the CO2 Capture System that was conducted during year 2009. The objective of the study is primarily to identify potential plant availability gaps and areas for improvement. This can be achieved by the following:
Determine the availability of the proposed CO2 Capture System
Identify key equipment that contribute to downtime of proposed CO2 Capture System
Using sensitivity analysis to quantify the impact of: Alternative configurations (e.g. equipment sparing) Alternative failure data (e.g. reliability improvement programs) Alternative maintenance schedules
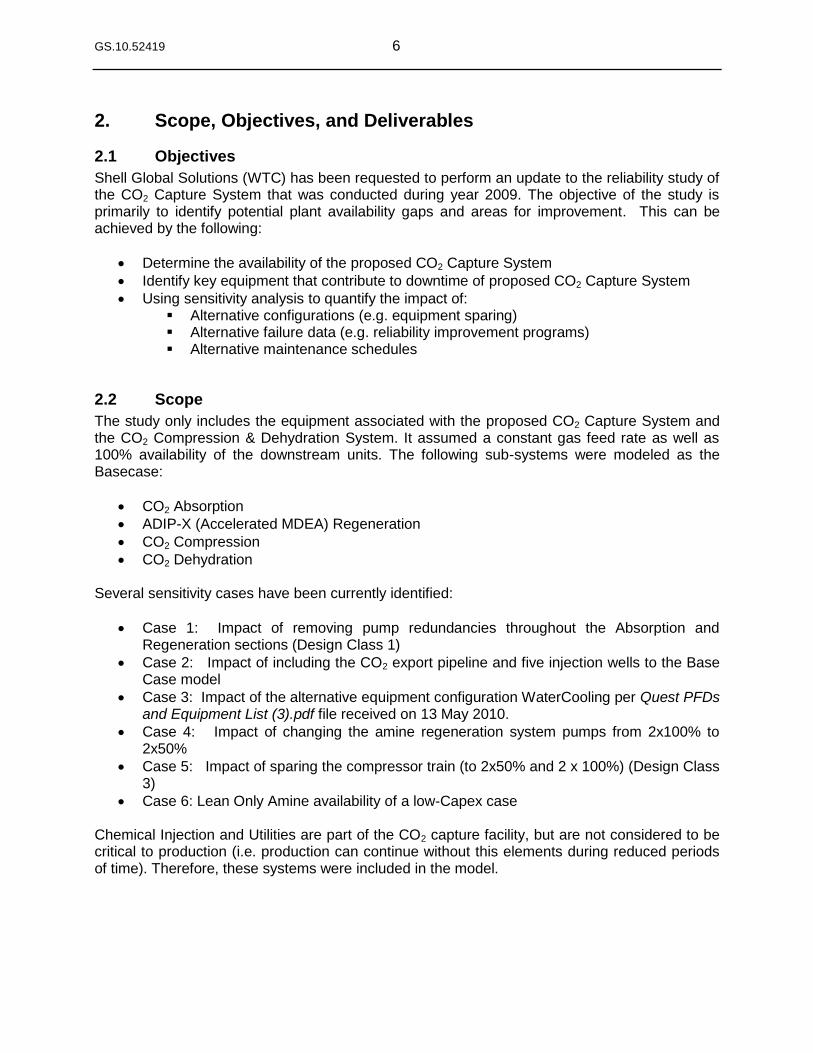
2.2 Scope
The study only includes the equipment associated with the proposed CO2 Capture System and the CO2 Compression & Dehydration System. It assumed a constant gas feed rate as well as 100% availability of the downstream units. The following sub-systems were modeled as the Basecase:
CO2 Absorption
ADIP-X (Accelerated MDEA) Regeneration
CO2 Compression
CO2 Dehydration Several sensitivity cases have been currently identified:
Case 1: Impact of removing pump redundancies throughout the Absorption and Regeneration sections (Design Class 1)
Case 2: Impact of including the CO2 export pipeline and five injection wells to the Base Case model
Case 3: Impact of the alternative equipment configuration WaterCooling per Quest PFDs and Equipment List (3).pdf file received on 13 May 2010.
Case 4: Impact of changing the amine regeneration system pumps from 2x100% to 2x50%
Case 5: Impact of sparing the compressor train (to 2x50% and 2 x 100%) (Design Class 3)
Case 6: Lean Only Amine availability of a low-Capex case Chemical Injection and Utilities are part of the CO2 capture facility, but are not considered to be critical to production (i.e. production can continue without this elements during reduced periods of time). Therefore, these systems were included in the model.
GS.10.52419 7
2.3 Deliverables
Key findings, conclusions and recommendations following the completion of the study were also summarized in presentation format, which were contain the following:
Overall availability and production efficiency of CO2 Capture System Criticality ranking of the equipment in the system, identifying the key contributors to
lost production (downtime) Results of sensitivity analyses
2.4 General Assumptions
The CO2 capture facility separates CO2 for sequestration in a geological formation to reduce the green house gas emission from the Scotford Upgrader. The CO2 capture facility is designed to remove CO2 from the process gas streams of the Hydrogen Manufacturing Units (HMUs) and to further dehydrate and compress the captured CO2 to a supercritical state to allow for efficient pipeline transportation to a suitable long-term storage site. The CO2 capture scope includes three HMUs, two identical existing HMU trains in the base Upgrader and one being designed as part of the Upgrader Expansion 1 project. The CO2 is removed from the HMU ―syngas‖ by contacting the mixed gas stream of methane, carbon dioxide, carbon monoxide and hydrogen, with accelerated MDEA (ADIP-X). Three amine absorbers used to remove the CO2 will be situated in the HMUs upstream of the pressure swing absorber (PSA) block. The CO2 is separated from the amine in a common amine regeneration process that produces 99% pure CO2 at a pressure slightly above atmospheric pressure. The purified CO2 stream will then be compressed and dehydrated to a supercritical state by a multi-stage compressor and then transported via pipeline to off-site disposition. The purified CO2 stream can then be used in Enhanced Oil Recovery (EOR) and sequestration. The following assumptions have been made for the modeling of the CO2 Capture System: The table below shows the expected inlet Feed Gas flowrates:
Table 2-1: Inlet Feed Gas Flowrates
Flow to Unit Tag ID Feed Gas Flow Feed Gas CO2 Content
Kmol/hr tons/hr Kmol/hr tons/hr
Amine Absorber #1 C-1 7,189.7 316.3 1,187.0 52.2
Amine Absorber #2 C-2 7,189.7 316.3 1,187.0 52.2
Amine Absorber #3 C-3 10,321.0 454.1 1,745.3 76.8
Total 24,700.4 1,086.7 4,119.3 181.2
Shell Canada Energy operates two existing Hydrogen Manufacturing Units (HMU1 & HMU2) and is in the process of designing and constructing a 3rd HMU (Expansion 1 HMU) at the AOSP Scotford Upgrader. The CO2 Capture System is designed to process 1,086.7 tonnes/hour of CO2 rich hydrogen gas:
C-1 and C-2 absorbers are each designed to treat 316.3 tonnes/hour of CO2 rich hydrogen gas from HMU1 and HMU2
GS.10.52419 8
C-3 absorber is designed to treat 454.1 tonnes/hour of CO2 rich hydrogen gas from HMU3
It is based on the Design that 80% of the Feed Gas CO2 is removed – 145 tonnes/hr (1.2 MTPY)
It is assumed that there is a 100% availability of the upstream gas feed and downstream units
Base Case premises include:
System Life: 25 years
Start date: 2015
Number of simulations: 200
2.5 Level of Study
Failure modes were defined on an equipment level (i.e. not on a component level). For each production critical equipment item, the model includes one or more failure modes depending on the utilized data source. The equipment was characterized through the frequency and duration of equipment outages. This equipment could be characterized by a number of failure modes.
2.6 Study Input Data
The study is based on the following data provided by the project team:
Updated project PFDs for the proposed CO2 Capture System issued on 30 September 2009, supplied by Shell Canada – Lean /SemiLean Case
Updated PFDs issued in June 2010 - Lean Only Case
The reliability data from previous studies
GS.10.52419 9
3. Modeling Assumptions
3.1 Introduction
This section contains the assumptions used to create the simulation life-cycle models for this analysis. It consists of the following sections:
Section 3.2: Overall System Assumptions
Section 3.3: Equipment Modeling Assumptions
3.2 Overall System Assumptions
3.2.1 Overall System Configuration
The CO2 Capture System model was divided into the following groups, representing the unit‘s processing sections: The following systems were modeled:
CO2 Absorption - Absorber #1 feed from HMU 1 - Absorber #2 feed from HMU 2 - Absorber #3 feed from HMU 3
ADIP-X (Accelerated MDEA) Regeneration - Semi-Lean Still - Amine Stripper
CO2 Compression & Dehydration - 8-stage compression - TEG Dehydration
Base Case is predominately Air Cooled due to Cooling Water availability limitations in 2009
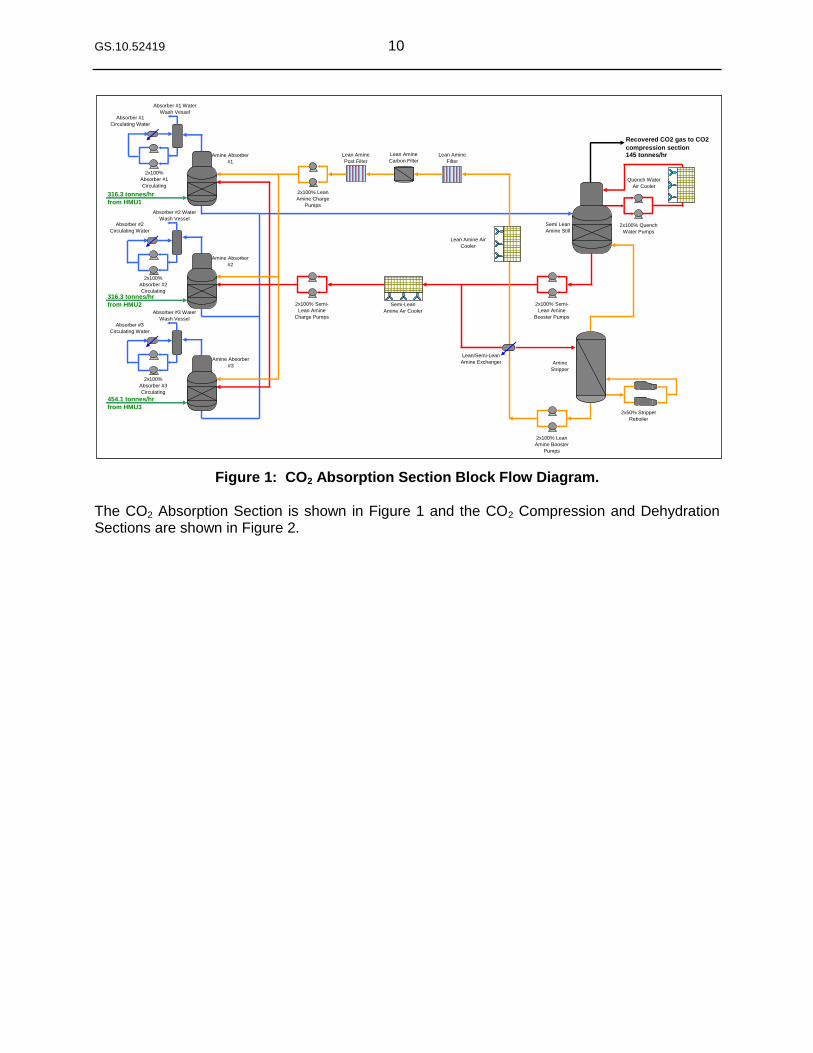
Figures 1 and 2 depict the configuration of the CO2 Capture System that was modeled in the Base Case.
GS.10.52419 10
Figure 1: CO2 Absorption Section Block Flow Diagram. The CO2 Absorption Section is shown in Figure 1 and the CO2 Compression and Dehydration Sections are shown in Figure 2.
145 tonnes/hr
316.3 tonnes/hr
from HMU1
316.3 tonnes/hr
from HMU2
454.1 tonnes/hr
from HMU3
Recovered CO2 gas to CO2
compression section
2x100% Quench
Water Pumps
Lean Amine
Filter
Quench Water
Air Cooler
2x100% Semi-
Lean Amine
Charge Pumps
Semi-Lean
Amine Air Cooler
2x100% Semi-
Lean Amine
Booster Pumps
2x100% Lean
Amine Booster
Pumps
2x100% Lean
Amine Charge
Pumps
Amine Absorber
#1
Amine Absorber
#2
Amine Absorber
#3
Absorber #1
Circulating Water
Cooler
Absorber #1 Water
Wash Vessel
Lean/Semi-Lean
Amine Exchanger
Semi Lean
Amine Still
Amine
Stripper
2x50% Stripper
Reboiler
Lean Amine Air
Cooler
Lean Amine
Carbon Filter
Lean Amine
Post Filter
Absorber #2
Circulating Water
Cooler
Absorber #2 Water
Wash Vessel
2x100%
Absorber #1
Circulating
Water Pumps
2x100%
Absorber #2
Circulating
Water Pumps
Absorber #3
Circulating Water
Cooler
Absorber #3 Water
Wash Vessel
2x100%
Absorber #3
Circulating
Water Pumps
GS.10.52419 11
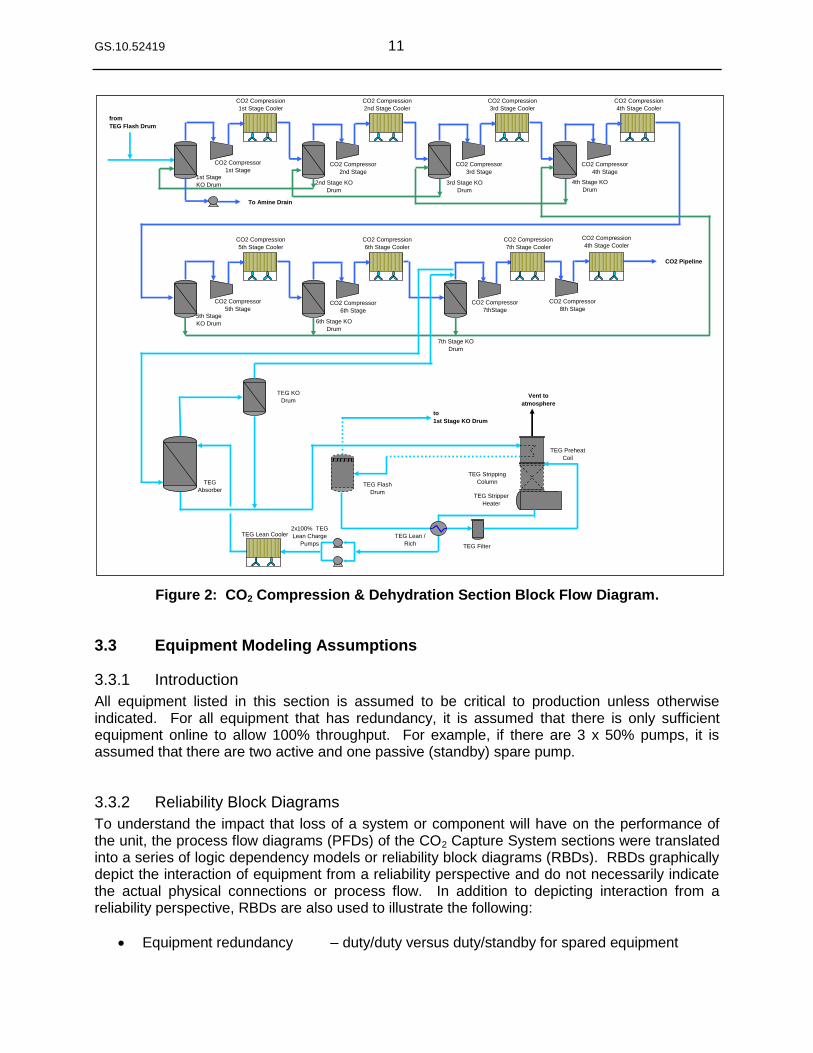
Figure 2: CO2 Compression & Dehydration Section Block Flow Diagram.
3.3 Equipment Modeling Assumptions
3.3.1 Introduction
All equipment listed in this section is assumed to be critical to production unless otherwise indicated. For all equipment that has redundancy, it is assumed that there is only sufficient equipment online to allow 100% throughput. For example, if there are 3 x 50% pumps, it is assumed that there are two active and one passive (standby) spare pump.
3.3.2 Reliability Block Diagrams
To understand the impact that loss of a system or component will have on the performance of the unit, the process flow diagrams (PFDs) of the CO2 Capture System sections were translated into a series of logic dependency models or reliability block diagrams (RBDs). RBDs graphically depict the interaction of equipment from a reliability perspective and do not necessarily indicate the actual physical connections or process flow. In addition to depicting interaction from a reliability perspective, RBDs are also used to illustrate the following:
Equipment redundancy – duty/duty versus duty/standby for spared equipment
CO2 Pipeline
from
TEG Flash Drum
to
1st Stage KO Drum
Vent to
atmosphere
To Amine Drain
TEG Stripping
Column
TEG Stripper
Heater
TEG Lean /
Rich
Exchanger
1st Stage
KO Drum
CO2 Compressor
1st Stage
CO2 Compression
1st Stage Cooler
TEG Preheat
Coil
2nd Stage KO
Drum
TEG KO
Drum
TEG Flash
Drum
2x100% TEG
Lean Charge
Pumps TEG Filter
TEG
Absorber
CO2 Compressor
2nd Stage
CO2 Compression
2nd Stage Cooler
3rd Stage KO
Drum
CO2 Compressor
3rd Stage
CO2 Compression
3rd Stage Cooler
4th Stage KO
Drum
CO2 Compressor
4th Stage
CO2 Compression
4th Stage Cooler
5th Stage
KO Drum
CO2 Compressor
5th Stage
CO2 Compression
5th Stage Cooler
6th Stage KO
Drum
CO2 Compressor
6th Stage
CO2 Compression
6th Stage Cooler
7th Stage KO
Drum
CO2 Compressor
7thStage
CO2 Compression
7th Stage Cooler
CO2 Compressor
8th Stage
CO2 Compression
4th Stage Cooler
TEG Lean Cooler
GS.10.52419 12
Equipment configuration – series or parallel arrangement
Equipment capacity – 2 x 50% versus 2 x 100%, etc. Appendix A of this Study Basis contains detailed RBDs for the CO2 Capture System. These RBDs should be reviewed in conjunction with the assumptions listed in the following Study Basis sections. In the following sections, each of the CO2 Capture System sub-systems is discussed in detail, covering equipment configuration, sparing and criticality.
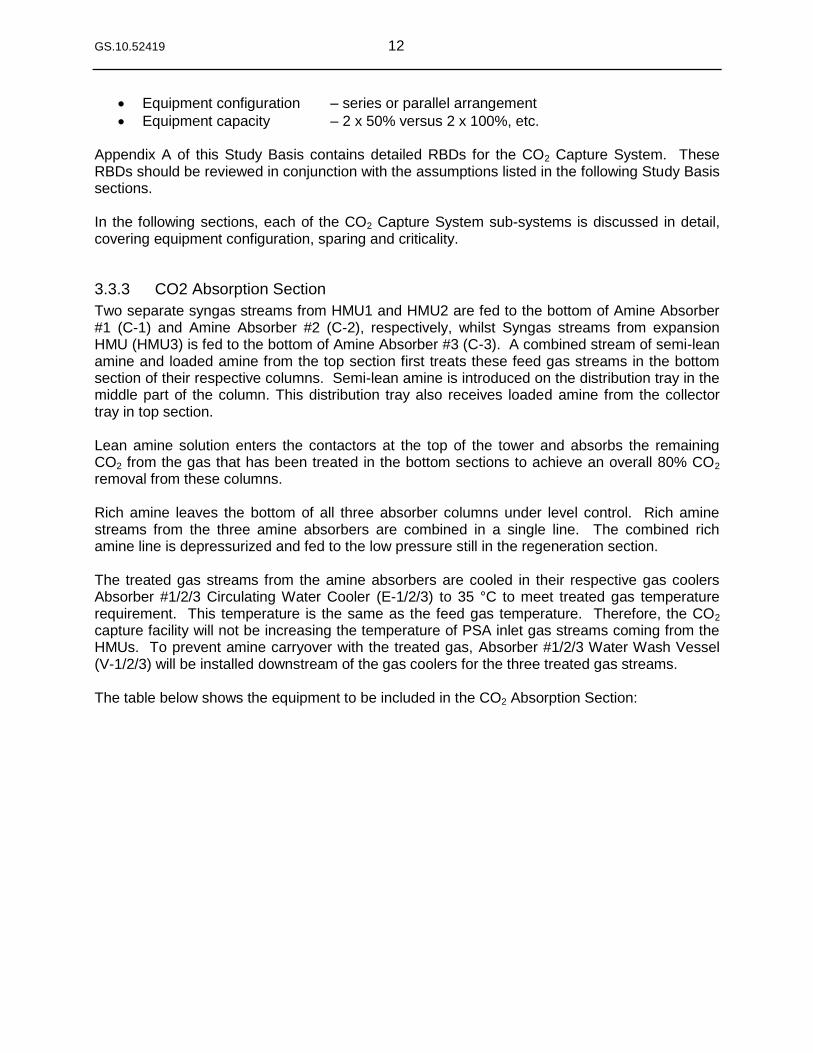
3.3.3 CO2 Absorption Section
Two separate syngas streams from HMU1 and HMU2 are fed to the bottom of Amine Absorber #1 (C-1) and Amine Absorber #2 (C-2), respectively, whilst Syngas streams from expansion HMU (HMU3) is fed to the bottom of Amine Absorber #3 (C-3). A combined stream of semi-lean amine and loaded amine from the top section first treats these feed gas streams in the bottom section of their respective columns. Semi-lean amine is introduced on the distribution tray in the middle part of the column. This distribution tray also receives loaded amine from the collector tray in top section. Lean amine solution enters the contactors at the top of the tower and absorbs the remaining CO2 from the gas that has been treated in the bottom sections to achieve an overall 80% CO2 removal from these columns. Rich amine leaves the bottom of all three absorber columns under level control. Rich amine streams from the three amine absorbers are combined in a single line. The combined rich amine line is depressurized and fed to the low pressure still in the regeneration section. The treated gas streams from the amine absorbers are cooled in their respective gas coolers Absorber #1/2/3 Circulating Water Cooler (E-1/2/3) to 35 °C to meet treated gas temperature requirement. This temperature is the same as the feed gas temperature. Therefore, the CO2 capture facility will not be increasing the temperature of PSA inlet gas streams coming from the HMUs. To prevent amine carryover with the treated gas, Absorber #1/2/3 Water Wash Vessel (V-1/2/3) will be installed downstream of the gas coolers for the three treated gas streams. The table below shows the equipment to be included in the CO2 Absorption Section:
GS.10.52419 13
Table 3-1: CO2 Absorption Section Equipment
Equipment Tag ID Configuration Comment
Amine Absorber #1 C-1 1×100% Processes 29% of total Hydrogen flow to system
Absorber #1 Circulating Water Cooler
E-1 1×100% Plate & Frame Heat Exchanger
Absorber #1 Water Wash Vessel V-1 1×100% Low Pressure Vessel
Absorber #1 Circulating Water Pumps
P-8 A/B 2x100% Centrifugal, motor driven pumps
Amine Absorber #2 C-2 1×100% Processes 29% of total Hydrogen flow to system
Absorber #2 Circulating Water Cooler
E-2 1×100% Plate & Frame Heat Exchanger
Absorber #2 Water Wash Vessel V-2 1×100% Low Pressure Vessel
Absorber #2 Circulating Water Pumps
P-9 A/B 2x100% Centrifugal, motor driven pumps
Amine Absorber #3 C-3 1×100% Processes 42% of total Hydrogen flow to system
Absorber #3 Circulating Water Cooler
E-3 1×100% Plate & Frame Heat Exchanger
Absorber #3 Water Wash Vessel V-3 1×100% Low Pressure Vessel
Absorber #3 Circulating Water Pumps
P-10 A/B
2x100% Centrifugal, motor driven pumps
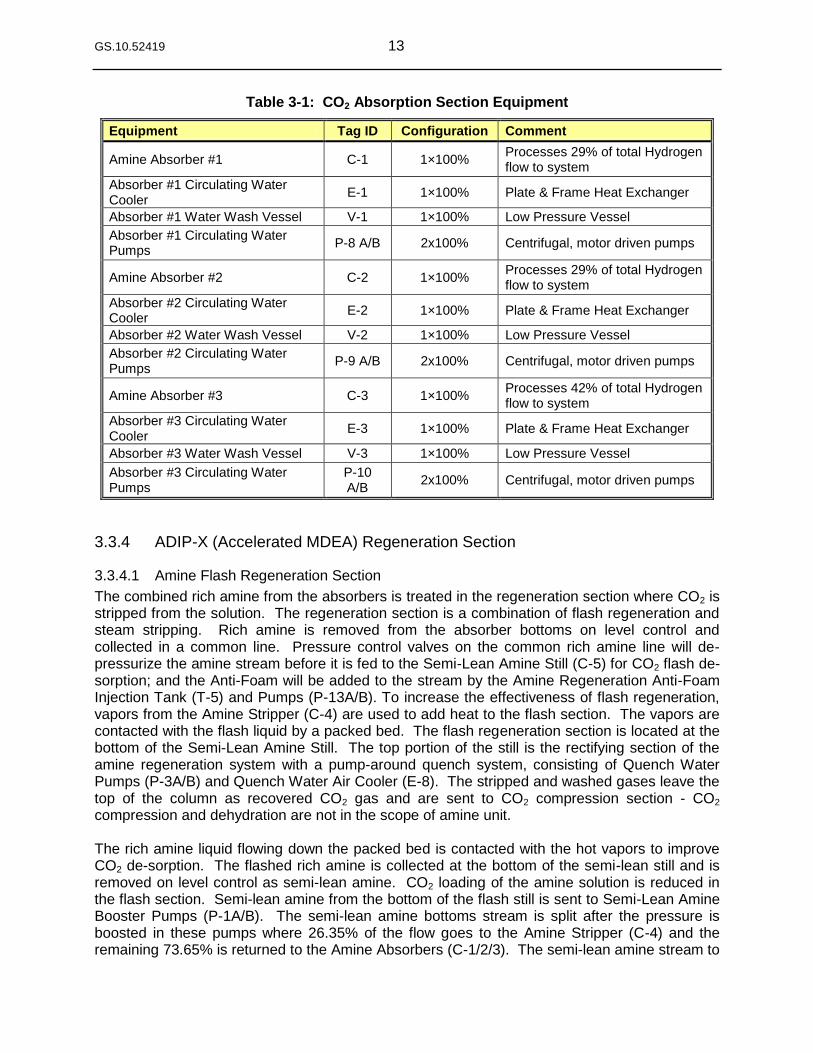
3.3.4 ADIP-X (Accelerated MDEA) Regeneration Section
3.3.4.1 Amine Flash Regeneration Section
The combined rich amine from the absorbers is treated in the regeneration section where CO2 is stripped from the solution. The regeneration section is a combination of flash regeneration and steam stripping. Rich amine is removed from the absorber bottoms on level control and collected in a common line. Pressure control valves on the common rich amine line will de-pressurize the amine stream before it is fed to the Semi-Lean Amine Still (C-5) for CO2 flash de-sorption; and the Anti-Foam will be added to the stream by the Amine Regeneration Anti-Foam Injection Tank (T-5) and Pumps (P-13A/B). To increase the effectiveness of flash regeneration, vapors from the Amine Stripper (C-4) are used to add heat to the flash section. The vapors are contacted with the flash liquid by a packed bed. The flash regeneration section is located at the bottom of the Semi-Lean Amine Still. The top portion of the still is the rectifying section of the amine regeneration system with a pump-around quench system, consisting of Quench Water Pumps (P-3A/B) and Quench Water Air Cooler (E-8). The stripped and washed gases leave the top of the column as recovered CO2 gas and are sent to CO2 compression section - CO2 compression and dehydration are not in the scope of amine unit. The rich amine liquid flowing down the packed bed is contacted with the hot vapors to improve CO2 de-sorption. The flashed rich amine is collected at the bottom of the semi-lean still and is removed on level control as semi-lean amine. CO2 loading of the amine solution is reduced in the flash section. Semi-lean amine from the bottom of the flash still is sent to Semi-Lean Amine Booster Pumps (P-1A/B). The semi-lean amine bottoms stream is split after the pressure is boosted in these pumps where 26.35% of the flow goes to the Amine Stripper (C-4) and the remaining 73.65% is returned to the Amine Absorbers (C-1/2/3). The semi-lean amine stream to
GS.10.52419 14
the amine absorbers is cooled by the Semi-Lean Amine Air Cooler (E-4) and pumped by Semi-Lean Charge Pumps (P-5A/B). Semi-lean amine is fed to the three amine absorbers on flow control. The table below shows the equipment to be included in the Amine Flash Regeneration Section:
Table 3-2: Amine Flash Regeneration Section Equipment
Equipment Tag ID Configuration Comment
Semi Lean Amine Still C-5 1×100%
Quench Water Pumps P-3 A/B 2x100% Centrifugal, motor driven pumps
Quench Water Air Cooler E-8 1×100% Air Cooler – 1 bay, 2×50% fans/motors
Semi-Lean Amine Booster Pumps P-1 A/B 2x100% Centrifugal, motor driven pumps
Semi-Lean Amine Air Cooler E-4 1×100% Air Cooler – 1 bay, 2×50% fans/motors
Semi-Lean Amine Charge Pumps P-5 A/B 2x100% Centrifugal, motor driven pumps
Amine Regeneration Anti-Foam Injection Tank
T-5 1×100% Not Critical
Amine Regeneration Anti-Foam Injection Pumps
P-13 A/B 2x100% Not Critical
3.3.4.2 Amine Stripper Section
The semi-lean stream to the Amine Stripper (C-4) is fed to the column on flow control. This stream first passes through the Lean/Semi-Lean Amine Exchanger (E-5) where it is heated by hot lean amine. Then it is enhanced with Amine and Piperazine from the respective Make-Up Tanks (T-1/2) and Pumps (P-7/78). The heated semi-lean amine from the heat exchanger then goes through a flow control valve before entering the Amine Stripper at the top of the column. In the Amine Stripper the acid gas (CO2) in the amine is removed by stripping steam. Acid gases are removed from the amine solution by a combination of high temperature, low pressure, and stripping steam (to reduce the acid gas partial pressure). Steam generated by re-boiling the solvent provides:
i. Heat for raising the temperature of the feed (semi-lean amine) ii. Heat of de-sorption of the acid gas iii. Heat to generate stripping steam (to reduce the acid gas partial pressure)
The heat for generating stripping steam in the Stripper Reboiler (E-7A/B) is provided by low pressure steam. The gas stripped from the amine solution leaves the top of the stripper column and flows to Semi-Lean Amine Still (C-5). The regenerated lean amine leaves the bottom of the stripper column and is pumped by the Lean Amine Booster Pumps (P-2A/B) to the Lean/Semi-Lean Amine Exchanger (E-5) to cool the regenerated lean amine, before entering the Cooling and Filtering Section. The table below shows the equipment to be included in the Amine Stripper Section:
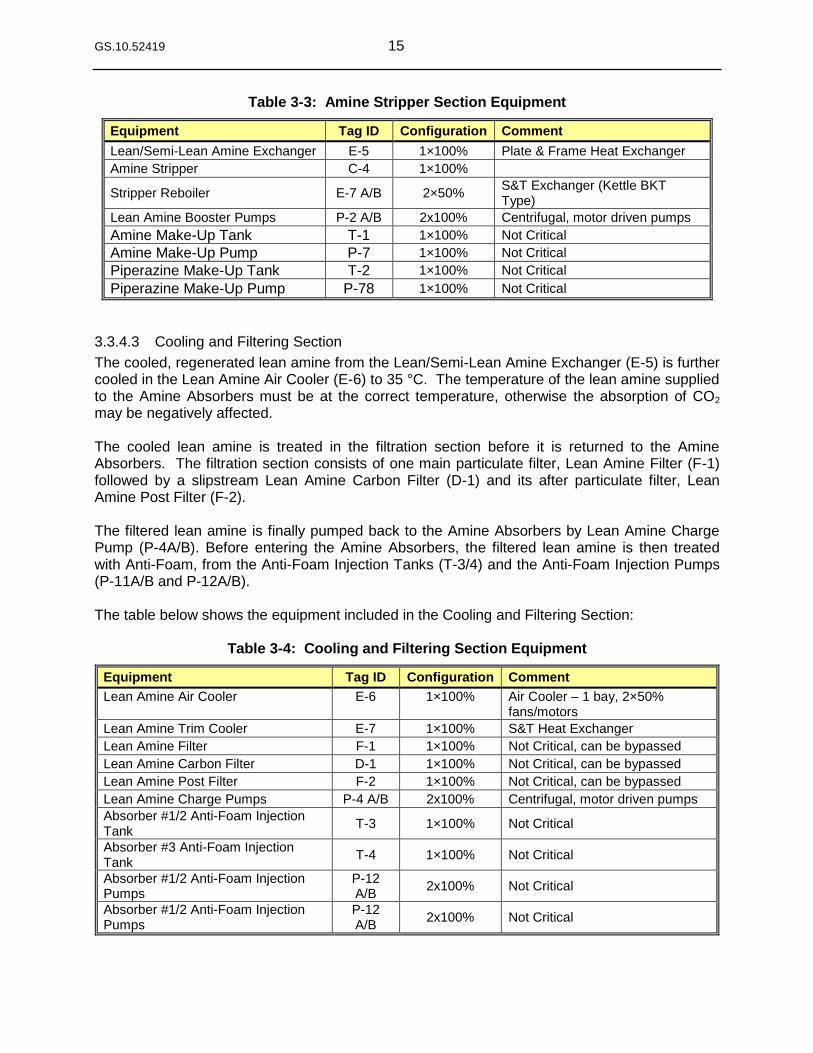
GS.10.52419 15
Table 3-3: Amine Stripper Section Equipment
Equipment Tag ID Configuration Comment
Lean/Semi-Lean Amine Exchanger E-5 1×100% Plate & Frame Heat Exchanger
Amine Stripper C-4 1×100%
Stripper Reboiler E-7 A/B 2×50% S&T Exchanger (Kettle BKT Type)
Lean Amine Booster Pumps P-2 A/B 2x100% Centrifugal, motor driven pumps
Amine Make-Up Tank T-1 1×100% Not Critical
Amine Make-Up Pump P-7 1×100% Not Critical
Piperazine Make-Up Tank T-2 1×100% Not Critical
Piperazine Make-Up Pump P-78 1×100% Not Critical
3.3.4.3 Cooling and Filtering Section
The cooled, regenerated lean amine from the Lean/Semi-Lean Amine Exchanger (E-5) is further cooled in the Lean Amine Air Cooler (E-6) to 35 °C. The temperature of the lean amine supplied to the Amine Absorbers must be at the correct temperature, otherwise the absorption of CO2 may be negatively affected. The cooled lean amine is treated in the filtration section before it is returned to the Amine Absorbers. The filtration section consists of one main particulate filter, Lean Amine Filter (F-1) followed by a slipstream Lean Amine Carbon Filter (D-1) and its after particulate filter, Lean Amine Post Filter (F-2). The filtered lean amine is finally pumped back to the Amine Absorbers by Lean Amine Charge Pump (P-4A/B). Before entering the Amine Absorbers, the filtered lean amine is then treated with Anti-Foam, from the Anti-Foam Injection Tanks (T-3/4) and the Anti-Foam Injection Pumps (P-11A/B and P-12A/B). The table below shows the equipment included in the Cooling and Filtering Section:
Table 3-4: Cooling and Filtering Section Equipment
Equipment Tag ID Configuration Comment
Lean Amine Air Cooler E-6 1×100% Air Cooler – 1 bay, 2×50% fans/motors
Lean Amine Trim Cooler E-7 1×100% S&T Heat Exchanger
Lean Amine Filter F-1 1×100% Not Critical, can be bypassed
Lean Amine Carbon Filter D-1 1×100% Not Critical, can be bypassed
Lean Amine Post Filter F-2 1×100% Not Critical, can be bypassed
Lean Amine Charge Pumps P-4 A/B 2x100% Centrifugal, motor driven pumps
Absorber #1/2 Anti-Foam Injection Tank
T-3 1×100% Not Critical
Absorber #3 Anti-Foam Injection Tank
T-4 1×100% Not Critical
Absorber #1/2 Anti-Foam Injection Pumps
P-12 A/B
2x100% Not Critical
Absorber #1/2 Anti-Foam Injection Pumps
P-12 A/B
2x100% Not Critical
GS.10.52419 16
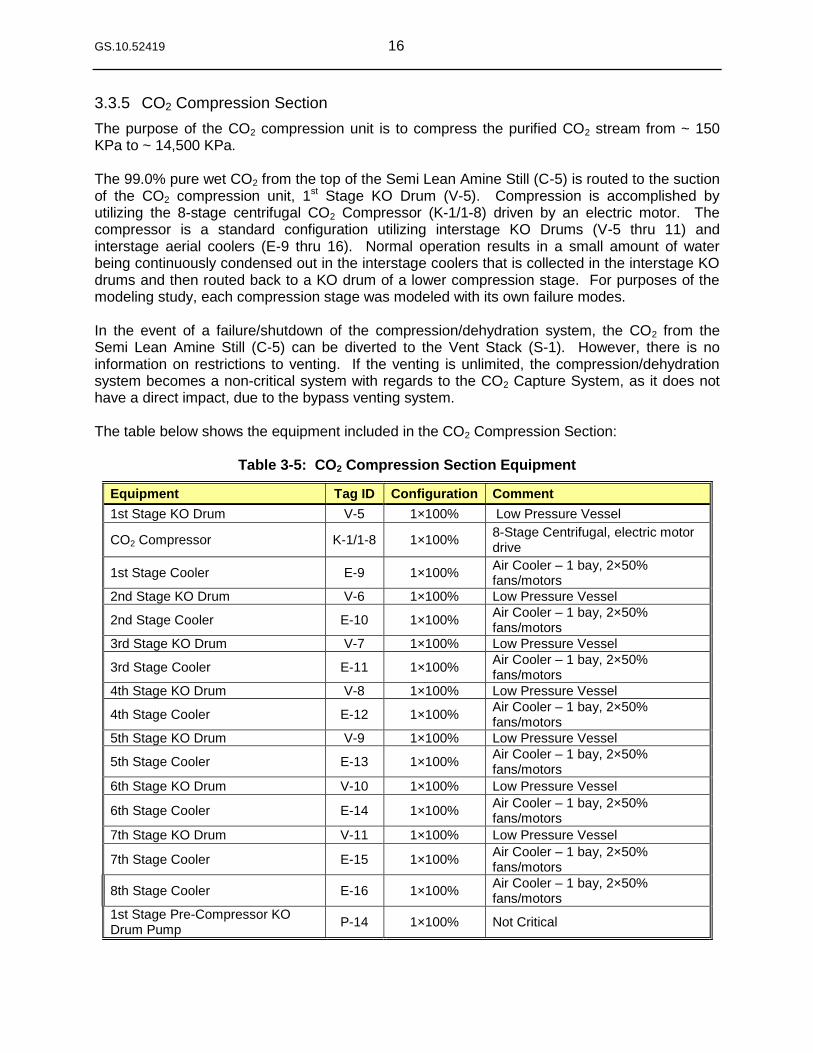
3.3.5 CO2 Compression Section
The purpose of the CO2 compression unit is to compress the purified CO2 stream from ~ 150 KPa to ~ 14,500 KPa. The 99.0% pure wet CO2 from the top of the Semi Lean Amine Still (C-5) is routed to the suction of the CO2 compression unit, 1st Stage KO Drum (V-5). Compression is accomplished by utilizing the 8-stage centrifugal CO2 Compressor (K-1/1-8) driven by an electric motor. The compressor is a standard configuration utilizing interstage KO Drums (V-5 thru 11) and interstage aerial coolers (E-9 thru 16). Normal operation results in a small amount of water being continuously condensed out in the interstage coolers that is collected in the interstage KO drums and then routed back to a KO drum of a lower compression stage. For purposes of the modeling study, each compression stage was modeled with its own failure modes. In the event of a failure/shutdown of the compression/dehydration system, the CO2 from the Semi Lean Amine Still (C-5) can be diverted to the Vent Stack (S-1). However, there is no information on restrictions to venting. If the venting is unlimited, the compression/dehydration system becomes a non-critical system with regards to the CO2 Capture System, as it does not have a direct impact, due to the bypass venting system. The table below shows the equipment included in the CO2 Compression Section:
Table 3-5: CO2 Compression Section Equipment
Equipment Tag ID Configuration Comment
1st Stage KO Drum V-5 1×100% Low Pressure Vessel
CO2 Compressor K-1/1-8 1×100% 8-Stage Centrifugal, electric motor drive
1st Stage Cooler E-9 1×100% Air Cooler – 1 bay, 2×50% fans/motors
2nd Stage KO Drum V-6 1×100% Low Pressure Vessel
2nd Stage Cooler E-10 1×100% Air Cooler – 1 bay, 2×50% fans/motors
3rd Stage KO Drum V-7 1×100% Low Pressure Vessel
3rd Stage Cooler E-11 1×100% Air Cooler – 1 bay, 2×50% fans/motors
4th Stage KO Drum V-8 1×100% Low Pressure Vessel
4th Stage Cooler E-12 1×100% Air Cooler – 1 bay, 2×50% fans/motors
5th Stage KO Drum V-9 1×100% Low Pressure Vessel
5th Stage Cooler E-13 1×100% Air Cooler – 1 bay, 2×50% fans/motors
6th Stage KO Drum V-10 1×100% Low Pressure Vessel
6th Stage Cooler E-14 1×100% Air Cooler – 1 bay, 2×50% fans/motors
7th Stage KO Drum V-11 1×100% Low Pressure Vessel
7th Stage Cooler E-15 1×100% Air Cooler – 1 bay, 2×50% fans/motors
8th Stage Cooler E-16 1×100% Air Cooler – 1 bay, 2×50% fans/motors
1st Stage Pre-Compressor KO Drum Pump
P-14 1×100% Not Critical
GS.10.52419 17
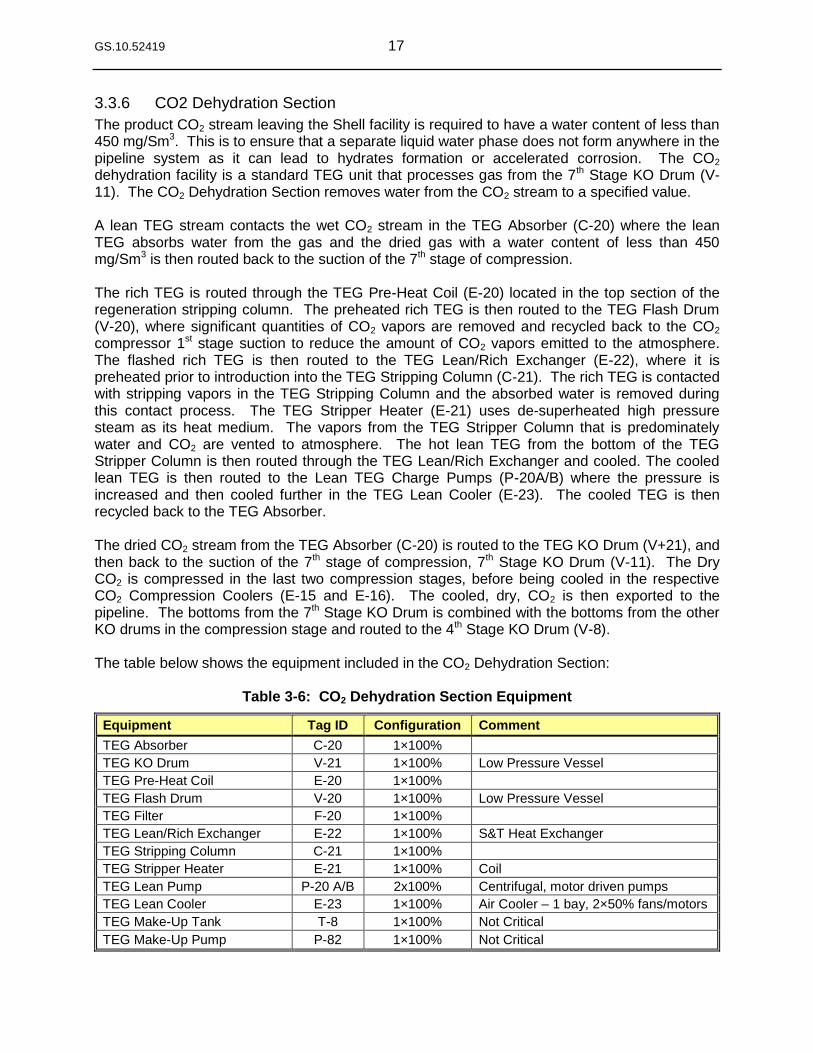
3.3.6 CO2 Dehydration Section
The product CO2 stream leaving the Shell facility is required to have a water content of less than 450 mg/Sm3. This is to ensure that a separate liquid water phase does not form anywhere in the pipeline system as it can lead to hydrates formation or accelerated corrosion. The CO2 dehydration facility is a standard TEG unit that processes gas from the 7th Stage KO Drum (V-11). The CO2 Dehydration Section removes water from the CO2 stream to a specified value. A lean TEG stream contacts the wet CO2 stream in the TEG Absorber (C-20) where the lean TEG absorbs water from the gas and the dried gas with a water content of less than 450 mg/Sm3 is then routed back to the suction of the 7th stage of compression. The rich TEG is routed through the TEG Pre-Heat Coil (E-20) located in the top section of the regeneration stripping column. The preheated rich TEG is then routed to the TEG Flash Drum (V-20), where significant quantities of CO2 vapors are removed and recycled back to the CO2 compressor 1st stage suction to reduce the amount of CO2 vapors emitted to the atmosphere. The flashed rich TEG is then routed to the TEG Lean/Rich Exchanger (E-22), where it is preheated prior to introduction into the TEG Stripping Column (C-21). The rich TEG is contacted with stripping vapors in the TEG Stripping Column and the absorbed water is removed during this contact process. The TEG Stripper Heater (E-21) uses de-superheated high pressure steam as its heat medium. The vapors from the TEG Stripper Column that is predominately water and CO2 are vented to atmosphere. The hot lean TEG from the bottom of the TEG Stripper Column is then routed through the TEG Lean/Rich Exchanger and cooled. The cooled lean TEG is then routed to the Lean TEG Charge Pumps (P-20A/B) where the pressure is increased and then cooled further in the TEG Lean Cooler (E-23). The cooled TEG is then recycled back to the TEG Absorber. The dried CO2 stream from the TEG Absorber (C-20) is routed to the TEG KO Drum (V+21), and then back to the suction of the 7th stage of compression, 7th Stage KO Drum (V-11). The Dry CO2 is compressed in the last two compression stages, before being cooled in the respective CO2 Compression Coolers (E-15 and E-16). The cooled, dry, CO2 is then exported to the pipeline. The bottoms from the 7th Stage KO Drum is combined with the bottoms from the other KO drums in the compression stage and routed to the 4th Stage KO Drum (V-8). The table below shows the equipment included in the CO2 Dehydration Section:
Table 3-6: CO2 Dehydration Section Equipment
Equipment Tag ID Configuration Comment
TEG Absorber C-20 1×100%
TEG KO Drum V-21 1×100% Low Pressure Vessel
TEG Pre-Heat Coil E-20 1×100%
TEG Flash Drum V-20 1×100% Low Pressure Vessel
TEG Filter F-20 1×100%
TEG Lean/Rich Exchanger E-22 1×100% S&T Heat Exchanger
TEG Stripping Column C-21 1×100%
TEG Stripper Heater E-21 1×100% Coil
TEG Lean Pump P-20 A/B 2x100% Centrifugal, motor driven pumps
TEG Lean Cooler E-23 1×100% Air Cooler – 1 bay, 2×50% fans/motors
TEG Make-Up Tank T-8 1×100% Not Critical
TEG Make-Up Pump P-82 1×100% Not Critical
GS.10.52419 18
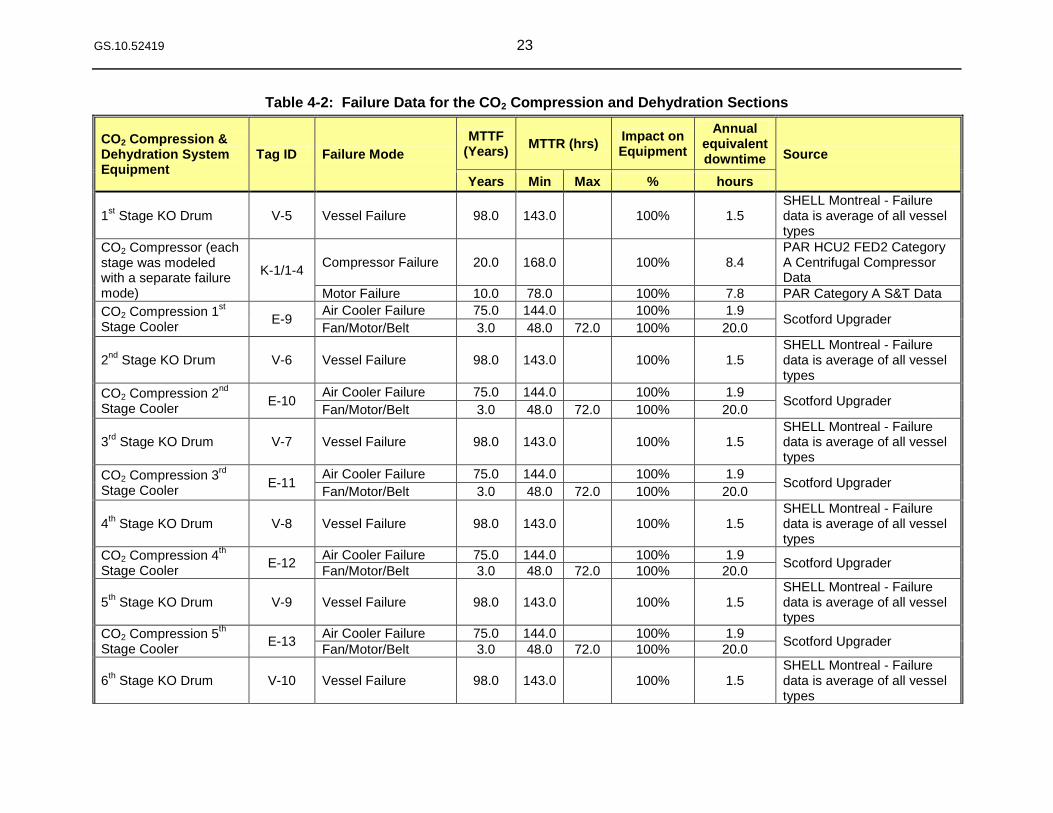
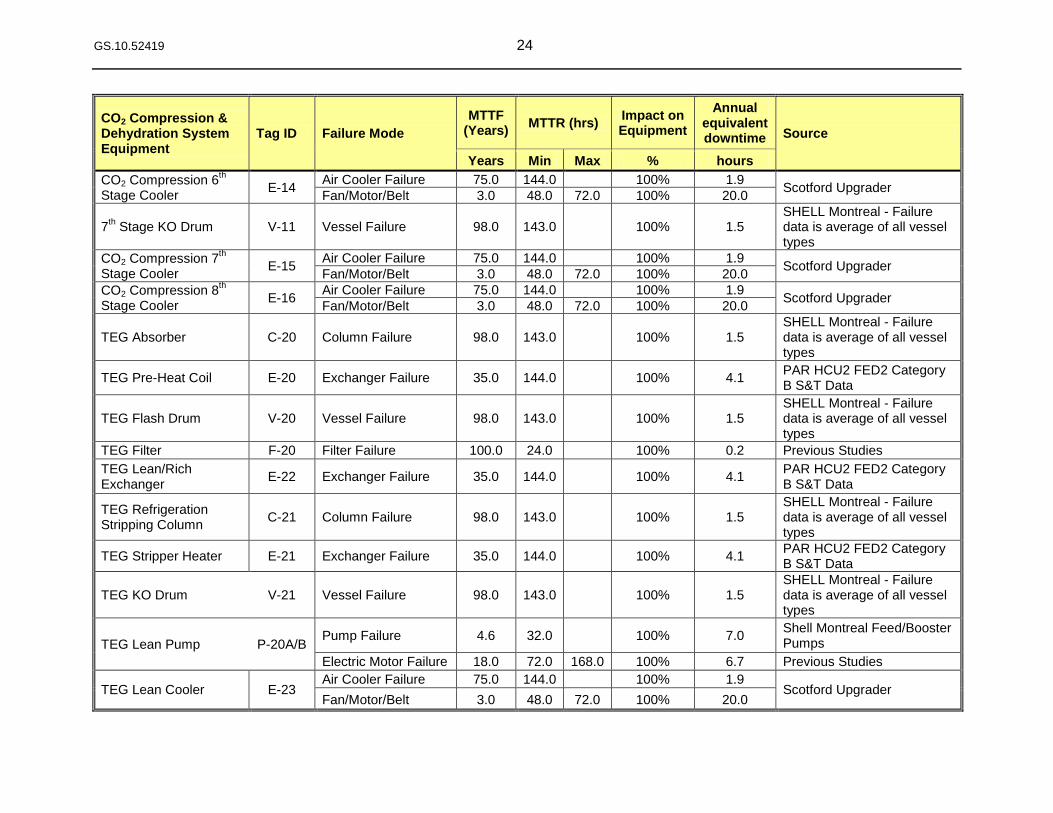
4. Unit Reliability Data
The reliability model for the CO2 Capture System was developed using previous failure data from similar projects. Below is a brief explanation of the terms used in the failure data tables: MTTF: Mean Time to Failure (years) The average time between consecutive failures calculated by dividing the cumulative observed time by the total number of failures. This term only applies to components with exponential failure distributions. MTTR: Mean Time to Repair (hours) It is a measure of the average time taken to diagnose and restore failed equipment to an operational state. If the failure data is reported on the equipment level, this value includes any logistic delays. If only the minimum MTTR was given, then a constant repair time was used. If Minimum and Maximum values were present, then a rectangular distribution was used and the repair duration varied between the two values. If three values are given (Minimum, maximum and Most Likely) then a triangular distribution was used, and the repair time varied between the minimum and maximum values with an increased probability of being close to the Most Likely repair time. Impact on Unit Rate It indicates if the failure causes a total shutdown of the system (100%) or a slowdown. If a slowdown is indicated then the rate reduction is shown as percentages (1% to 99%) of the design flow rate through the unit. When reviewing the reliability data in the next section the following should be noted:
The failure rates are for critical failures only, i.e. those requiring the equipment to be taken offline immediately to allow repair, prior to resuming normal production. In addition to these critical failures, equipment can also incur incipient failures, which do not require immediate repair of the equipment (for example small leakages). For modeling purposes, it is assumed that these incipient failures can be accommodated until the next plant turnaround at which time they are repaired. These failures have therefore not been included in the simulation models.
The failure modes used reflect the average number of times a piece of equipment causes total or partial production loss. In order to achieve these ‗expected‘ equipment failure rates, it is assumed that industry standard inspection and maintenance activities are carried out during plant turnarounds.
Process equipment blocks modeled include equipment plus typical instrumentation (level alarms, pressure control, high temperature, etc.). In other words, the failure data represents an overall reliability figure for each piece of equipment, at the equipment level, rather than individual component level.
GS.10.52419 19
4.1 Data Sources
Failure data for equipment utilized in the Shell Canada, CO2 Capture System have been collected from the following sources:
Reliability database from Shell Canada projects
Reliability database from previous Shell projects The following sections summarize the failure data for the process specific equipment in the CO2 Capture System. For simulation purposes, the expected MTTF is used. Variations in the MTTF may be further investigated in sensitivity cases. The MTTR is the total repair time associated with the failed equipment.
GS.10.52419 20
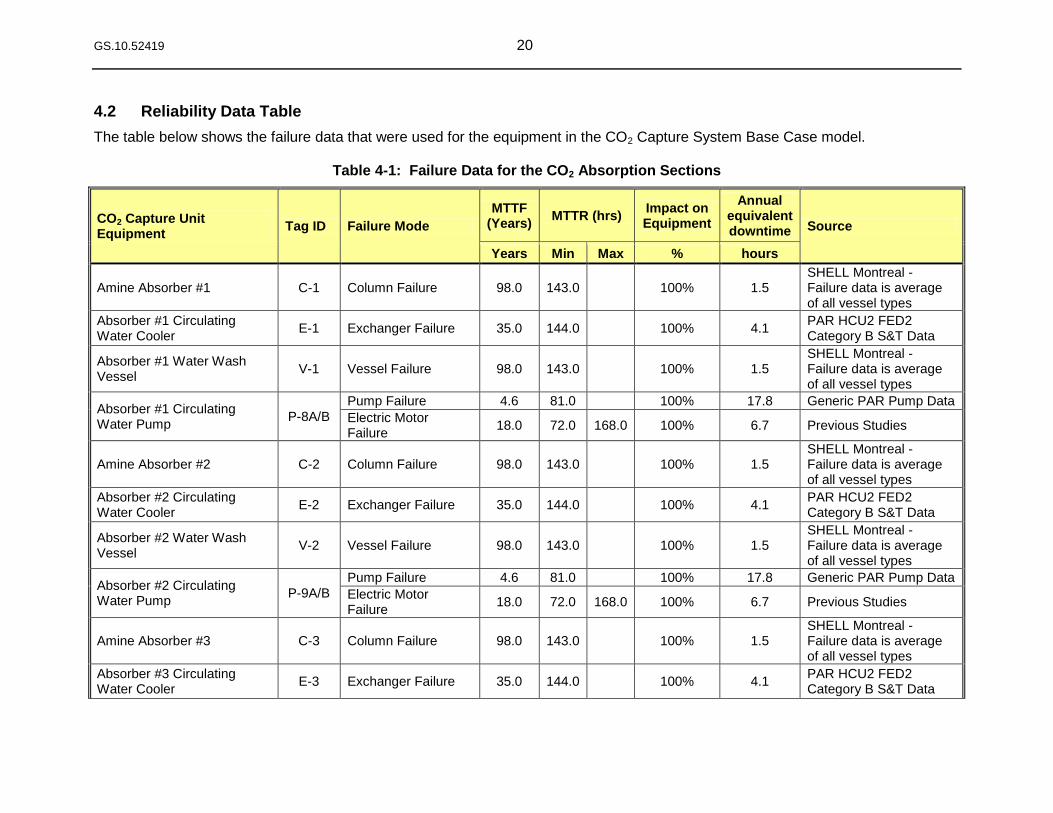
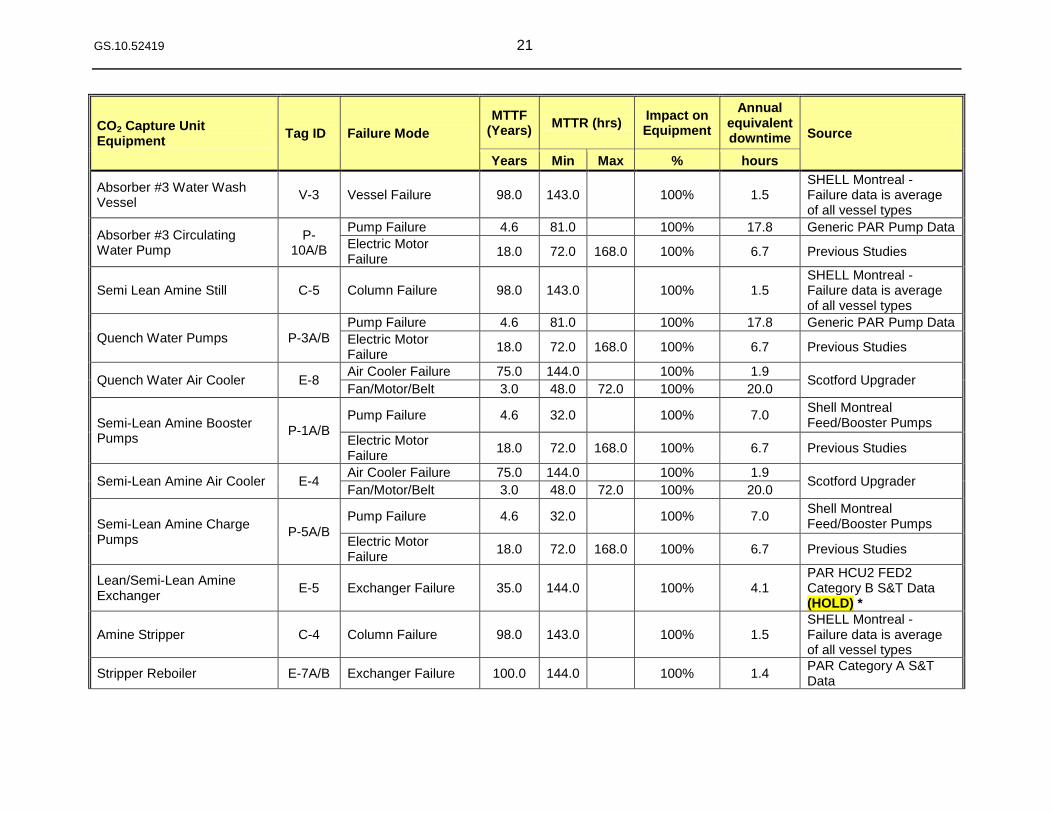
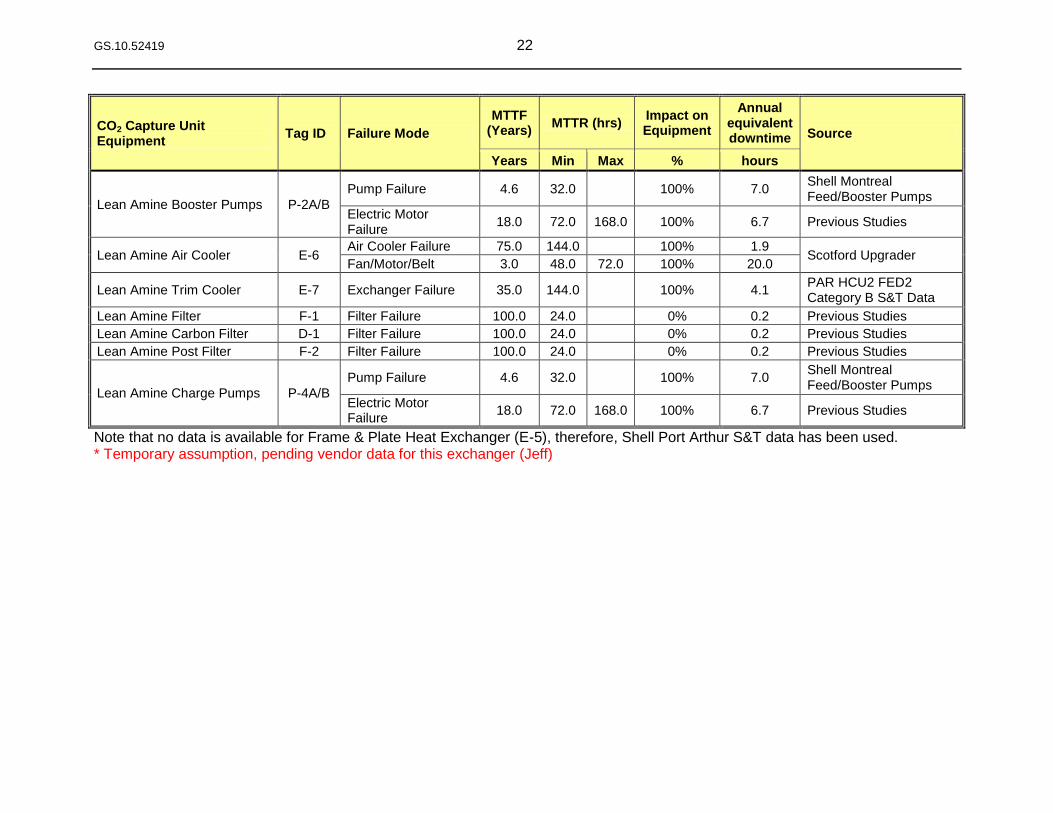
4.2 Reliability Data Table
The table below shows the failure data that were used for the equipment in the CO2 Capture System Base Case model.
Table 4-1: Failure Data for the CO2 Absorption Sections
CO2 Capture Unit Equipment
Tag ID Failure Mode
MTTF (Years)
MTTR (hrs) Impact on Equipment
Annual equivalent downtime Source
Years Min Max % hours
Amine Absorber #1 C-1 Column Failure 98.0 143.0 100% 1.5 SHELL Montreal - Failure data is average of all vessel types
Absorber #1 Circulating Water Cooler
E-1 Exchanger Failure 35.0 144.0 100% 4.1 PAR HCU2 FED2 Category B S&T Data
Absorber #1 Water Wash Vessel
V-1 Vessel Failure 98.0 143.0 100% 1.5 SHELL Montreal - Failure data is average of all vessel types
Absorber #1 Circulating Water Pump
P-8A/B
Pump Failure 4.6 81.0 100% 17.8 Generic PAR Pump Data
Electric Motor Failure
18.0 72.0 168.0 100% 6.7 Previous Studies
Amine Absorber #2 C-2 Column Failure 98.0 143.0 100% 1.5 SHELL Montreal - Failure data is average of all vessel types
Absorber #2 Circulating Water Cooler
E-2 Exchanger Failure 35.0 144.0 100% 4.1 PAR HCU2 FED2 Category B S&T Data
Absorber #2 Water Wash Vessel
V-2 Vessel Failure 98.0 143.0 100% 1.5 SHELL Montreal - Failure data is average of all vessel types
Absorber #2 Circulating Water Pump
P-9A/B
Pump Failure 4.6 81.0 100% 17.8 Generic PAR Pump Data
Electric Motor Failure
18.0 72.0 168.0 100% 6.7 Previous Studies
Amine Absorber #3 C-3 Column Failure 98.0 143.0 100% 1.5 SHELL Montreal - Failure data is average of all vessel types
Absorber #3 Circulating Water Cooler
E-3 Exchanger Failure 35.0 144.0 100% 4.1 PAR HCU2 FED2 Category B S&T Data
GS.10.52419 21
CO2 Capture Unit Equipment
Tag ID Failure Mode
MTTF (Years)
MTTR (hrs) Impact on Equipment
Annual equivalent downtime Source
Years Min Max % hours
Absorber #3 Water Wash Vessel
V-3 Vessel Failure 98.0 143.0 100% 1.5 SHELL Montreal - Failure data is average of all vessel types
Absorber #3 Circulating Water Pump
P-10A/B
Pump Failure 4.6 81.0 100% 17.8 Generic PAR Pump Data
Electric Motor Failure
18.0 72.0 168.0 100% 6.7 Previous Studies
Semi Lean Amine Still C-5 Column Failure 98.0 143.0 100% 1.5 SHELL Montreal - Failure data is average of all vessel types
Quench Water Pumps P-3A/B
Pump Failure 4.6 81.0 100% 17.8 Generic PAR Pump Data
Electric Motor Failure
18.0 72.0 168.0 100% 6.7 Previous Studies
Quench Water Air Cooler E-8 Air Cooler Failure 75.0 144.0 100% 1.9
Scotford Upgrader Fan/Motor/Belt 3.0 48.0 72.0 100% 20.0
Semi-Lean Amine Booster Pumps
P-1A/B Pump Failure 4.6 32.0 100% 7.0
Shell Montreal Feed/Booster Pumps
Electric Motor Failure
18.0 72.0 168.0 100% 6.7 Previous Studies
Semi-Lean Amine Air Cooler E-4 Air Cooler Failure 75.0 144.0 100% 1.9
Scotford Upgrader Fan/Motor/Belt 3.0 48.0 72.0 100% 20.0
Semi-Lean Amine Charge Pumps
P-5A/B
Pump Failure 4.6 32.0 100% 7.0 Shell Montreal Feed/Booster Pumps
Electric Motor Failure
18.0 72.0 168.0 100% 6.7 Previous Studies
Lean/Semi-Lean Amine Exchanger
E-5 Exchanger Failure 35.0 144.0 100% 4.1 PAR HCU2 FED2 Category B S&T Data (HOLD) *
Amine Stripper C-4 Column Failure 98.0 143.0 100% 1.5 SHELL Montreal - Failure data is average of all vessel types
Stripper Reboiler E-7A/B Exchanger Failure 100.0 144.0 100% 1.4 PAR Category A S&T Data
GS.10.52419 22
CO2 Capture Unit Equipment
Tag ID Failure Mode
MTTF (Years)
MTTR (hrs) Impact on Equipment
Annual equivalent downtime Source
Years Min Max % hours
Lean Amine Booster Pumps P-2A/B
Pump Failure 4.6 32.0 100% 7.0 Shell Montreal Feed/Booster Pumps
Electric Motor Failure
18.0 72.0 168.0 100% 6.7 Previous Studies
Lean Amine Air Cooler E-6 Air Cooler Failure 75.0 144.0 100% 1.9
Scotford Upgrader Fan/Motor/Belt 3.0 48.0 72.0 100% 20.0
Lean Amine Trim Cooler E-7 Exchanger Failure 35.0 144.0 100% 4.1 PAR HCU2 FED2 Category B S&T Data
Lean Amine Filter F-1 Filter Failure 100.0 24.0 0% 0.2 Previous Studies
Lean Amine Carbon Filter D-1 Filter Failure 100.0 24.0 0% 0.2 Previous Studies
Lean Amine Post Filter F-2 Filter Failure 100.0 24.0 0% 0.2 Previous Studies
Lean Amine Charge Pumps P-4A/B
Pump Failure 4.6 32.0 100% 7.0 Shell Montreal Feed/Booster Pumps
Electric Motor Failure
18.0 72.0 168.0 100% 6.7 Previous Studies
Note that no data is available for Frame & Plate Heat Exchanger (E-5), therefore, Shell Port Arthur S&T data has been used. * Temporary assumption, pending vendor data for this exchanger (Jeff)
GS.10.52419 23
Table 4-2: Failure Data for the CO2 Compression and Dehydration Sections
CO2 Compression & Dehydration System Equipment
Tag ID Failure Mode
MTTF (Years)
MTTR (hrs) Impact on Equipment
Annual equivalent downtime Source
Years Min Max % hours
1st Stage KO Drum V-5 Vessel Failure 98.0 143.0 100% 1.5
SHELL Montreal - Failure data is average of all vessel types
CO2 Compressor (each stage was modeled with a separate failure mode)
K-1/1-4 Compressor Failure 20.0 168.0 100% 8.4
PAR HCU2 FED2 Category A Centrifugal Compressor Data
Motor Failure 10.0 78.0 100% 7.8 PAR Category A S&T Data
CO2 Compression 1st
Stage Cooler E-9
Air Cooler Failure 75.0 144.0 100% 1.9 Scotford Upgrader
Fan/Motor/Belt 3.0 48.0 72.0 100% 20.0
2nd
Stage KO Drum V-6 Vessel Failure 98.0 143.0 100% 1.5 SHELL Montreal - Failure data is average of all vessel types
CO2 Compression 2nd
Stage Cooler
E-10 Air Cooler Failure 75.0 144.0 100% 1.9
Scotford Upgrader Fan/Motor/Belt 3.0 48.0 72.0 100% 20.0
3rd
Stage KO Drum V-7 Vessel Failure 98.0 143.0 100% 1.5 SHELL Montreal - Failure data is average of all vessel types
CO2 Compression 3rd
Stage Cooler
E-11 Air Cooler Failure 75.0 144.0 100% 1.9
Scotford Upgrader Fan/Motor/Belt 3.0 48.0 72.0 100% 20.0
4th Stage KO Drum V-8 Vessel Failure 98.0 143.0 100% 1.5
SHELL Montreal - Failure data is average of all vessel types
CO2 Compression 4th
Stage Cooler E-12
Air Cooler Failure 75.0 144.0 100% 1.9 Scotford Upgrader
Fan/Motor/Belt 3.0 48.0 72.0 100% 20.0
5th Stage KO Drum V-9 Vessel Failure 98.0 143.0 100% 1.5
SHELL Montreal - Failure data is average of all vessel types
CO2 Compression 5th
Stage Cooler E-13
Air Cooler Failure 75.0 144.0 100% 1.9 Scotford Upgrader
Fan/Motor/Belt 3.0 48.0 72.0 100% 20.0
6th Stage KO Drum V-10 Vessel Failure 98.0 143.0 100% 1.5
SHELL Montreal - Failure data is average of all vessel types
GS.10.52419 24
CO2 Compression & Dehydration System Equipment
Tag ID Failure Mode
MTTF (Years)
MTTR (hrs) Impact on Equipment
Annual equivalent downtime Source
Years Min Max % hours
CO2 Compression 6th
Stage Cooler E-14
Air Cooler Failure 75.0 144.0 100% 1.9 Scotford Upgrader
Fan/Motor/Belt 3.0 48.0 72.0 100% 20.0
7th Stage KO Drum V-11 Vessel Failure 98.0 143.0 100% 1.5
SHELL Montreal - Failure data is average of all vessel types
CO2 Compression 7th
Stage Cooler E-15
Air Cooler Failure 75.0 144.0 100% 1.9 Scotford Upgrader
Fan/Motor/Belt 3.0 48.0 72.0 100% 20.0
CO2 Compression 8th
Stage Cooler E-16
Air Cooler Failure 75.0 144.0 100% 1.9 Scotford Upgrader
Fan/Motor/Belt 3.0 48.0 72.0 100% 20.0
TEG Absorber C-20 Column Failure 98.0 143.0 100% 1.5 SHELL Montreal - Failure data is average of all vessel types
TEG Pre-Heat Coil E-20 Exchanger Failure 35.0 144.0 100% 4.1 PAR HCU2 FED2 Category B S&T Data
TEG Flash Drum V-20 Vessel Failure 98.0 143.0 100% 1.5 SHELL Montreal - Failure data is average of all vessel types
TEG Filter F-20 Filter Failure 100.0 24.0 100% 0.2 Previous Studies
TEG Lean/Rich Exchanger
E-22 Exchanger Failure 35.0 144.0 100% 4.1 PAR HCU2 FED2 Category B S&T Data
TEG Refrigeration Stripping Column
C-21 Column Failure 98.0 143.0 100% 1.5 SHELL Montreal - Failure data is average of all vessel types
TEG Stripper Heater E-21 Exchanger Failure 35.0 144.0 100% 4.1 PAR HCU2 FED2 Category B S&T Data
TEG KO Drum V-21 Vessel Failure 98.0 143.0 100% 1.5 SHELL Montreal - Failure data is average of all vessel types
TEG Lean Pump P-20A/B Pump Failure 4.6 32.0 100% 7.0
Shell Montreal Feed/Booster Pumps
Electric Motor Failure 18.0 72.0 168.0 100% 6.7 Previous Studies
TEG Lean Cooler E-23 Air Cooler Failure 75.0 144.0 100% 1.9
Scotford Upgrader Fan/Motor/Belt 3.0 48.0 72.0 100% 20.0
GS.10.52419 25
4.3 Maintenance and Operations
The following are the assumptions used for modeling maintenance activities/constraints for the CO2 Capture System:
4.3.1 Work Prioritization
Maintenance/repair activities are only carried out for items that have failed critically and will result in either unit shutdown or production slow down. It was assumed that all incipient type failures (failures which do not impact on production rates) will be addressed on an opportunity basis (i.e. they will be addressed if the unit is down for other reasons).
4.3.2 Mobilization and Delay Times
The CO2 Capture System is a continuous processing unit operated 24 hours per day. Critical failures, i.e. those failures that result in loss of capacity at failure were assumed to require immediate mobilization of a repair crew. A delay time of 4 hours will be incurred when mobilizing maintenance personnel (from failure to start of repair). It was assumed that the failure data in the previous section will not incorporate any mobilization time required for repairs.
4.3.3 Restart Times
The failure data for the individual unspared equipment reported in the previous section include any restart times of the equipment/unit.
4.3.4 Spare Parts
The model assumes that spares are available to enable immediate repair of all equipment.
4.3.5 Scheduled Unit Shutdowns
It was assumed that scheduled maintenance will take place in line with the HMU scheduled maintenance shutdowns. The Base Case did not include scheduled maintenance shutdowns.
GS.10.52419 26
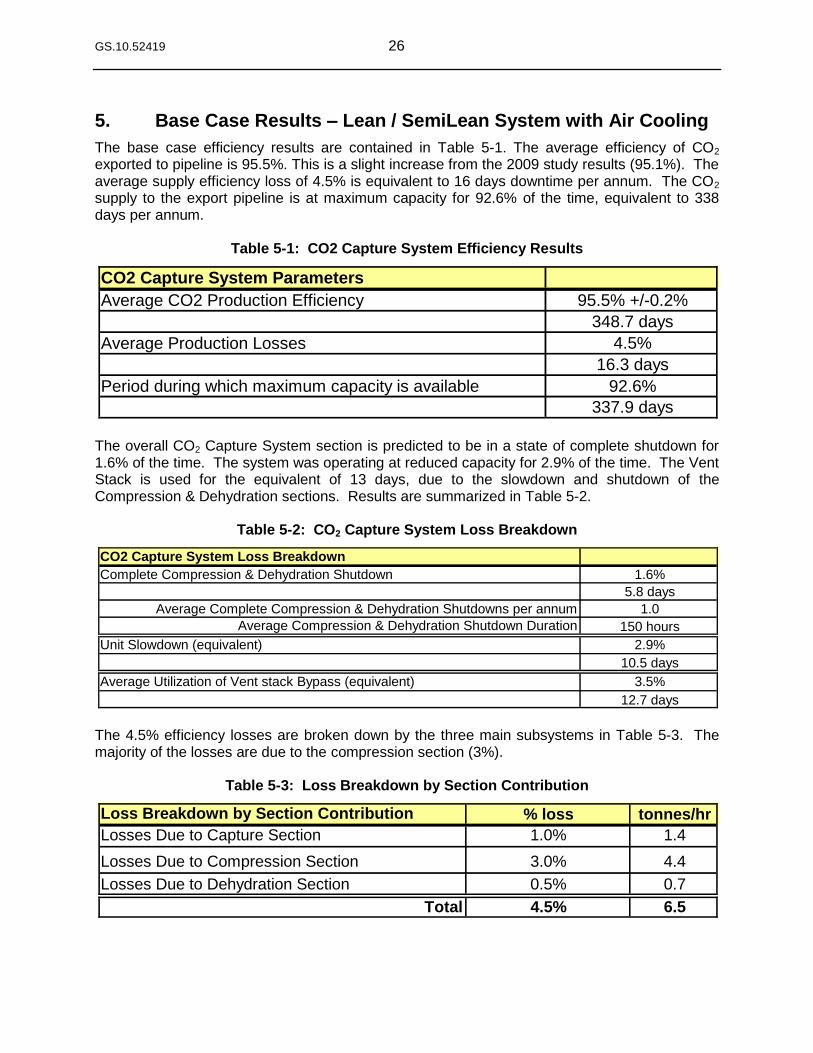
5. Base Case Results – Lean / SemiLean System with Air Cooling
The base case efficiency results are contained in Table 5-1. The average efficiency of CO2 exported to pipeline is 95.5%. This is a slight increase from the 2009 study results (95.1%). The average supply efficiency loss of 4.5% is equivalent to 16 days downtime per annum. The CO2 supply to the export pipeline is at maximum capacity for 92.6% of the time, equivalent to 338 days per annum.
Table 5-1: CO2 Capture System Efficiency Results
The overall CO2 Capture System section is predicted to be in a state of complete shutdown for 1.6% of the time. The system was operating at reduced capacity for 2.9% of the time. The Vent Stack is used for the equivalent of 13 days, due to the slowdown and shutdown of the Compression & Dehydration sections. Results are summarized in Table 5-2.
Table 5-2: CO2 Capture System Loss Breakdown
The 4.5% efficiency losses are broken down by the three main subsystems in Table 5-3. The majority of the losses are due to the compression section (3%).
Table 5-3: Loss Breakdown by Section Contribution
CO2 Capture System Parameters
Average CO2 Production Efficiency 95.5% +/-0.2%
348.7 days
Average Production Losses 4.5%
16.3 days
Period during which maximum capacity is available 92.6%
337.9 days
CO2 Capture System Loss Breakdown
Complete Compression & Dehydration Shutdown 1.6%
5.8 days
Average Complete Compression & Dehydration Shutdowns per annum 1.0
Average Compression & Dehydration Shutdown Duration 150 hours
Unit Slowdown (equivalent) 2.9%
10.5 days
Average Utilization of Vent stack Bypass (equivalent) 3.5%
12.7 days
Loss Breakdown by Section Contribution % loss tonnes/hr
Losses Due to Capture Section 1.0% 1.4
Losses Due to Compression Section 3.0% 4.4
Losses Due to Dehydration Section 0.5% 0.7
Total 4.5% 6.5
GS.10.52419 27
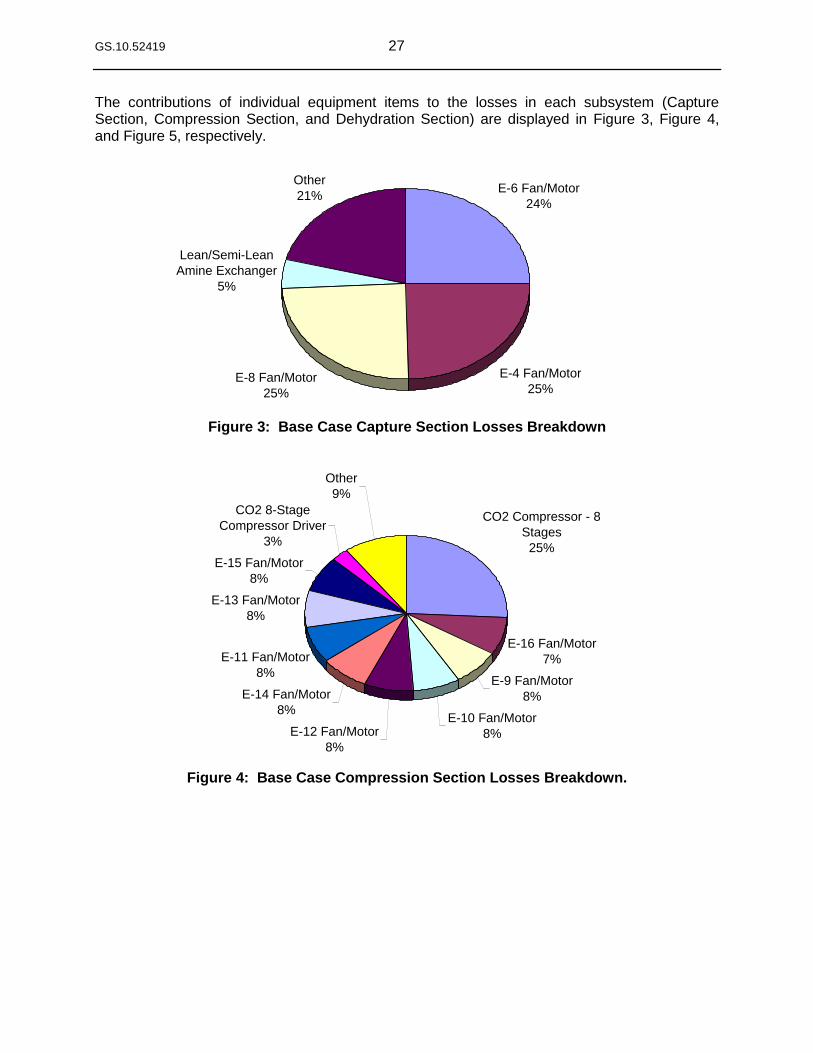
The contributions of individual equipment items to the losses in each subsystem (Capture Section, Compression Section, and Dehydration Section) are displayed in Figure 3, Figure 4, and Figure 5, respectively.
Figure 3: Base Case Capture Section Losses Breakdown
Figure 4: Base Case Compression Section Losses Breakdown.
CO2 Capture Section
E-6 Fan/Motor
24%
E-4 Fan/Motor
25%E-8 Fan/Motor
25%
Lean/Semi-Lean
Amine Exchanger
5%
Other
21%
CO2 Compression Section
CO2 Compressor - 8
Stages
25%
E-16 Fan/Motor
7%
E-9 Fan/Motor
8%
E-10 Fan/Motor
8%E-12 Fan/Motor
8%
E-14 Fan/Motor
8%
E-11 Fan/Motor
8%
E-13 Fan/Motor
8%
E-15 Fan/Motor
8%
CO2 8-Stage
Compressor Driver
3%
Other
9%
GS.10.52419 28
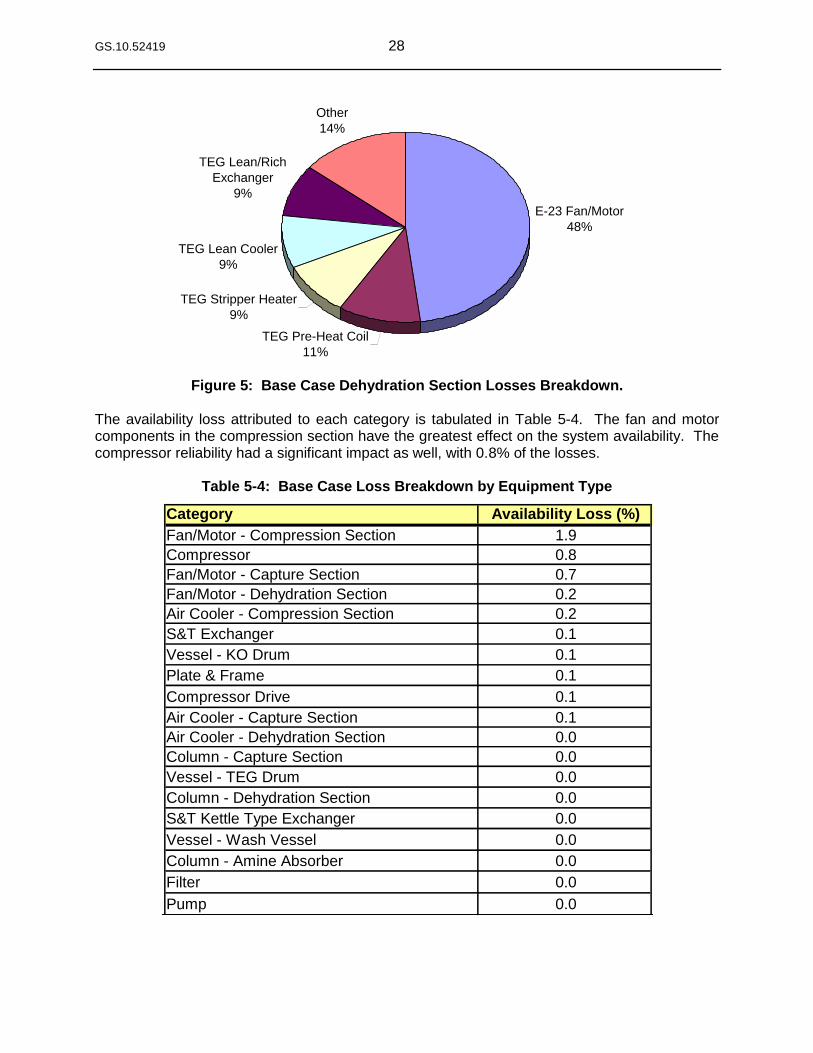
Figure 5: Base Case Dehydration Section Losses Breakdown. The availability loss attributed to each category is tabulated in Table 5-4. The fan and motor components in the compression section have the greatest effect on the system availability. The compressor reliability had a significant impact as well, with 0.8% of the losses.
Table 5-4: Base Case Loss Breakdown by Equipment Type
CO2 Dehydration Section
E-23 Fan/Motor
48%
TEG Pre-Heat Coil
11%
TEG Stripper Heater
9%
TEG Lean Cooler
9%
TEG Lean/Rich
Exchanger
9%
Other
14%
Category Availability Loss (%)
Fan/Motor - Compression Section 1.9
Compressor 0.8
Fan/Motor - Capture Section 0.7
Fan/Motor - Dehydration Section 0.2
Air Cooler - Compression Section 0.2
S&T Exchanger 0.1
Vessel - KO Drum 0.1
Plate & Frame 0.1
Compressor Drive 0.1
Air Cooler - Capture Section 0.1
Air Cooler - Dehydration Section 0.0
Column - Capture Section 0.0
Vessel - TEG Drum 0.0
Column - Dehydration Section 0.0
S&T Kettle Type Exchanger 0.0
Vessel - Wash Vessel 0.0
Column - Amine Absorber 0.0
Filter 0.0
Pump 0.0
GS.10.52419 29
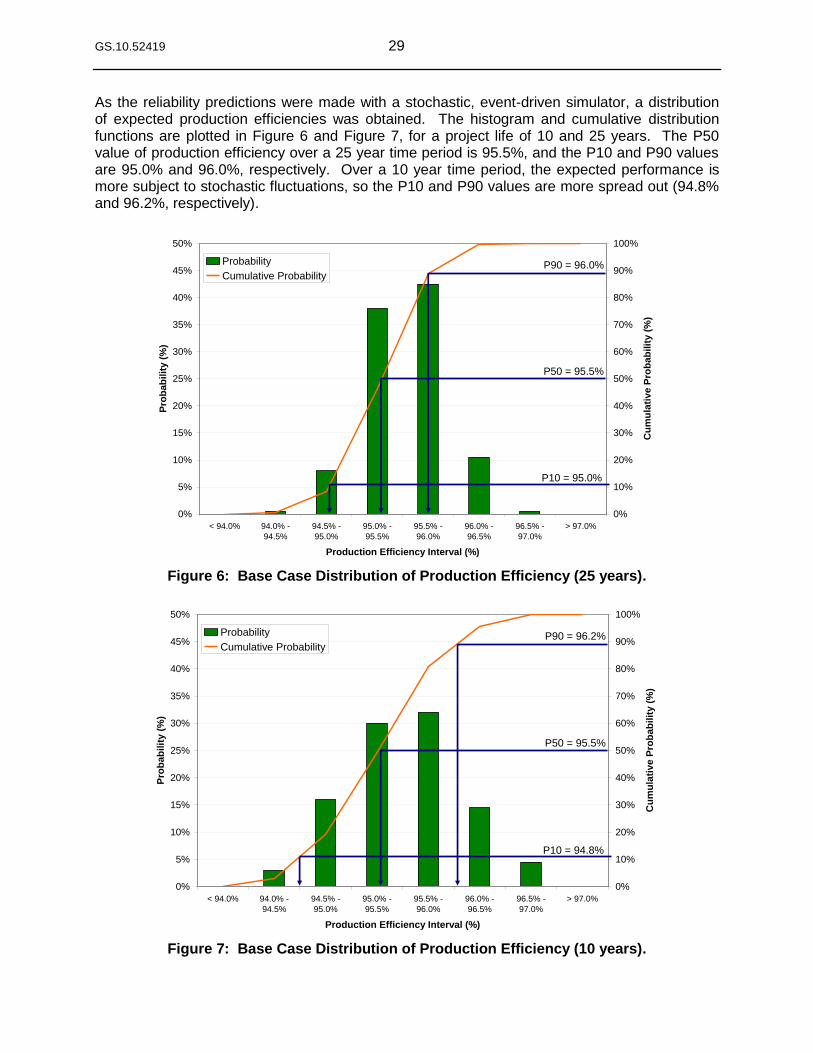
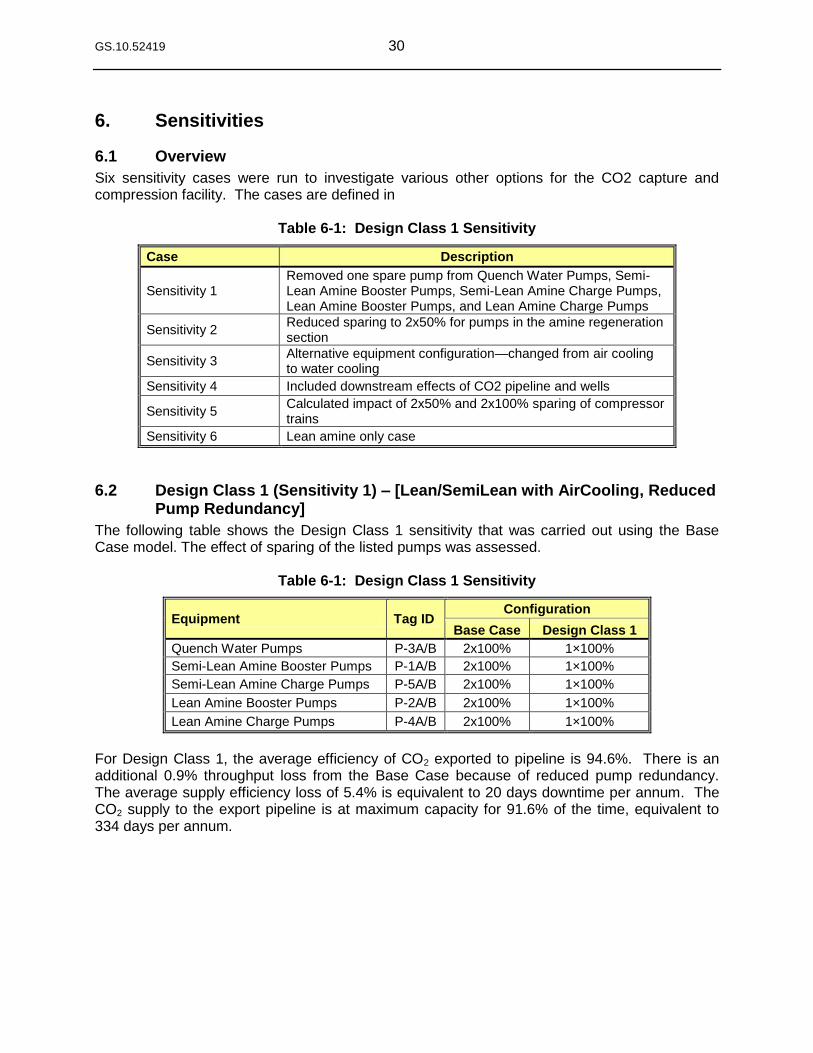
As the reliability predictions were made with a stochastic, event-driven simulator, a distribution of expected production efficiencies was obtained. The histogram and cumulative distribution functions are plotted in Figure 6 and Figure 7, for a project life of 10 and 25 years. The P50 value of production efficiency over a 25 year time period is 95.5%, and the P10 and P90 values are 95.0% and 96.0%, respectively. Over a 10 year time period, the expected performance is more subject to stochastic fluctuations, so the P10 and P90 values are more spread out (94.8% and 96.2%, respectively).
Figure 6: Base Case Distribution of Production Efficiency (25 years).
Figure 7: Base Case Distribution of Production Efficiency (10 years).
0%
5%
10%
15%
20%
25%
30%
35%
40%
45%
50%
< 94.0% 94.0% -
94.5%
94.5% -
95.0%
95.0% -
95.5%
95.5% -
96.0%
96.0% -
96.5%
96.5% -
97.0%
> 97.0%
Production Efficiency Interval (%)
Pro
bab
ilit
y (
%)
0%
10%
20%
30%
40%
50%
60%
70%
80%
90%
100%
Cu
mu
lati
ve P
rob
ab
ilit
y (
%)
Probability
Cumulative Probability
P10 = 95.0%
P50 = 95.5%
P90 = 96.0%
0%
5%
10%
15%
20%
25%
30%
35%
40%
45%
50%
< 94.0% 94.0% -
94.5%
94.5% -
95.0%
95.0% -
95.5%
95.5% -
96.0%
96.0% -
96.5%
96.5% -
97.0%
> 97.0%
Production Efficiency Interval (%)
Pro
bab
ilit
y (
%)
0%
10%
20%
30%
40%
50%
60%
70%
80%
90%
100%
Cu
mu
lati
ve P
rob
ab
ilit
y (
%)
Probability
Cumulative Probability
P10 = 94.8%
P50 = 95.5%
P90 = 96.2%
GS.10.52419 30
6. Sensitivities
6.1 Overview
Six sensitivity cases were run to investigate various other options for the CO2 capture and compression facility. The cases are defined in
Table 6-1: Design Class 1 Sensitivity
Case Description
Sensitivity 1 Removed one spare pump from Quench Water Pumps, Semi-Lean Amine Booster Pumps, Semi-Lean Amine Charge Pumps, Lean Amine Booster Pumps, and Lean Amine Charge Pumps
Sensitivity 2 Reduced sparing to 2x50% for pumps in the amine regeneration section
Sensitivity 3 Alternative equipment configuration—changed from air cooling to water cooling
Sensitivity 4 Included downstream effects of CO2 pipeline and wells
Sensitivity 5 Calculated impact of 2x50% and 2x100% sparing of compressor trains
Sensitivity 6 Lean amine only case
6.2 Design Class 1 (Sensitivity 1) – [Lean/SemiLean with AirCooling, Reduced Pump Redundancy]
The following table shows the Design Class 1 sensitivity that was carried out using the Base Case model. The effect of sparing of the listed pumps was assessed.
Table 6-1: Design Class 1 Sensitivity
Equipment Tag ID Configuration
Base Case Design Class 1
Quench Water Pumps P-3A/B 2x100% 1×100%
Semi-Lean Amine Booster Pumps P-1A/B 2x100% 1×100%
Semi-Lean Amine Charge Pumps P-5A/B 2x100% 1×100%
Lean Amine Booster Pumps P-2A/B 2x100% 1×100%
Lean Amine Charge Pumps P-4A/B 2x100% 1×100%
For Design Class 1, the average efficiency of CO2 exported to pipeline is 94.6%. There is an additional 0.9% throughput loss from the Base Case because of reduced pump redundancy. The average supply efficiency loss of 5.4% is equivalent to 20 days downtime per annum. The CO2 supply to the export pipeline is at maximum capacity for 91.6% of the time, equivalent to 334 days per annum.
GS.10.52419 31
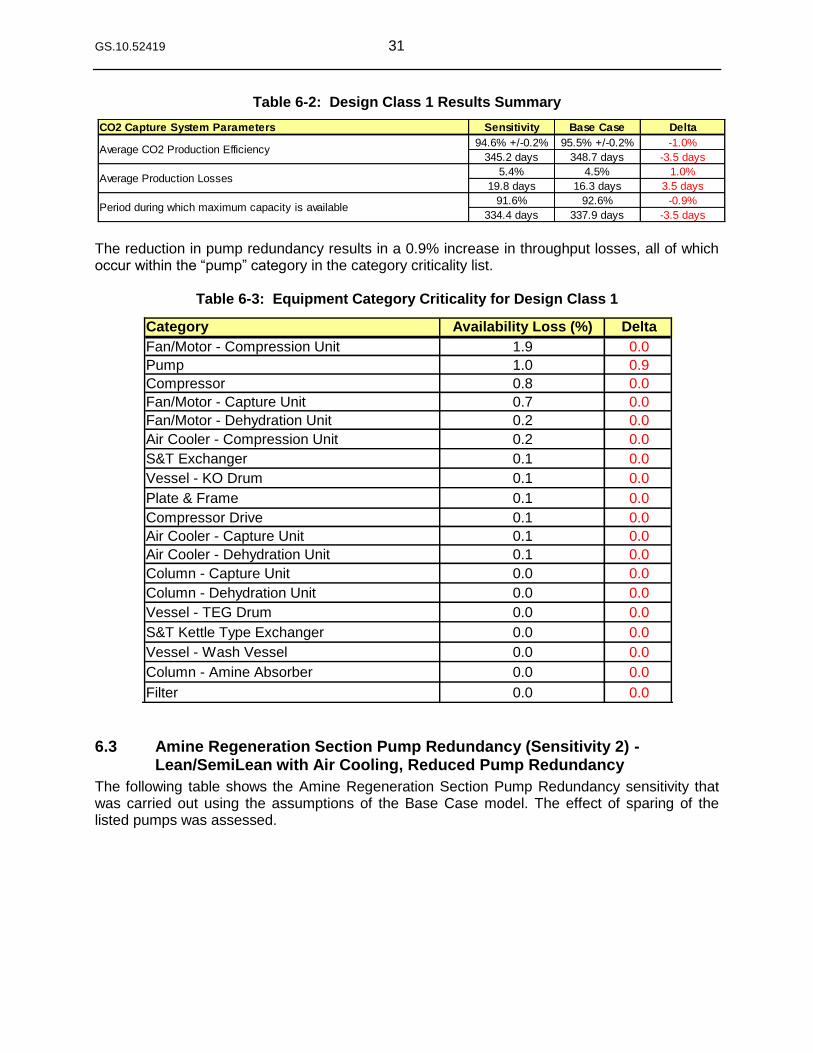
Table 6-2: Design Class 1 Results Summary
The reduction in pump redundancy results in a 0.9% increase in throughput losses, all of which occur within the ―pump‖ category in the category criticality list.
Table 6-3: Equipment Category Criticality for Design Class 1
6.3 Amine Regeneration Section Pump Redundancy (Sensitivity 2) - Lean/SemiLean with Air Cooling, Reduced Pump Redundancy
The following table shows the Amine Regeneration Section Pump Redundancy sensitivity that was carried out using the assumptions of the Base Case model. The effect of sparing of the listed pumps was assessed.
CO2 Capture System Parameters Sensitivity Base Case Delta
94.6% +/-0.2% 95.5% +/-0.2% -1.0%
345.2 days 348.7 days -3.5 days
5.4% 4.5% 1.0%
19.8 days 16.3 days 3.5 days
91.6% 92.6% -0.9%
334.4 days 337.9 days -3.5 days
Average CO2 Production Efficiency
Average Production Losses
Period during which maximum capacity is available
Category Availability Loss (%) Delta
Fan/Motor - Compression Unit 1.9 0.0
Pump 1.0 0.9
Compressor 0.8 0.0
Fan/Motor - Capture Unit 0.7 0.0
Fan/Motor - Dehydration Unit 0.2 0.0
Air Cooler - Compression Unit 0.2 0.0
S&T Exchanger 0.1 0.0
Vessel - KO Drum 0.1 0.0
Plate & Frame 0.1 0.0
Compressor Drive 0.1 0.0
Air Cooler - Capture Unit 0.1 0.0
Air Cooler - Dehydration Unit 0.1 0.0
Column - Capture Unit 0.0 0.0
Column - Dehydration Unit 0.0 0.0
Vessel - TEG Drum 0.0 0.0
S&T Kettle Type Exchanger 0.0 0.0
Vessel - Wash Vessel 0.0 0.0
Column - Amine Absorber 0.0 0.0
Filter 0.0 0.0
GS.10.52419 32
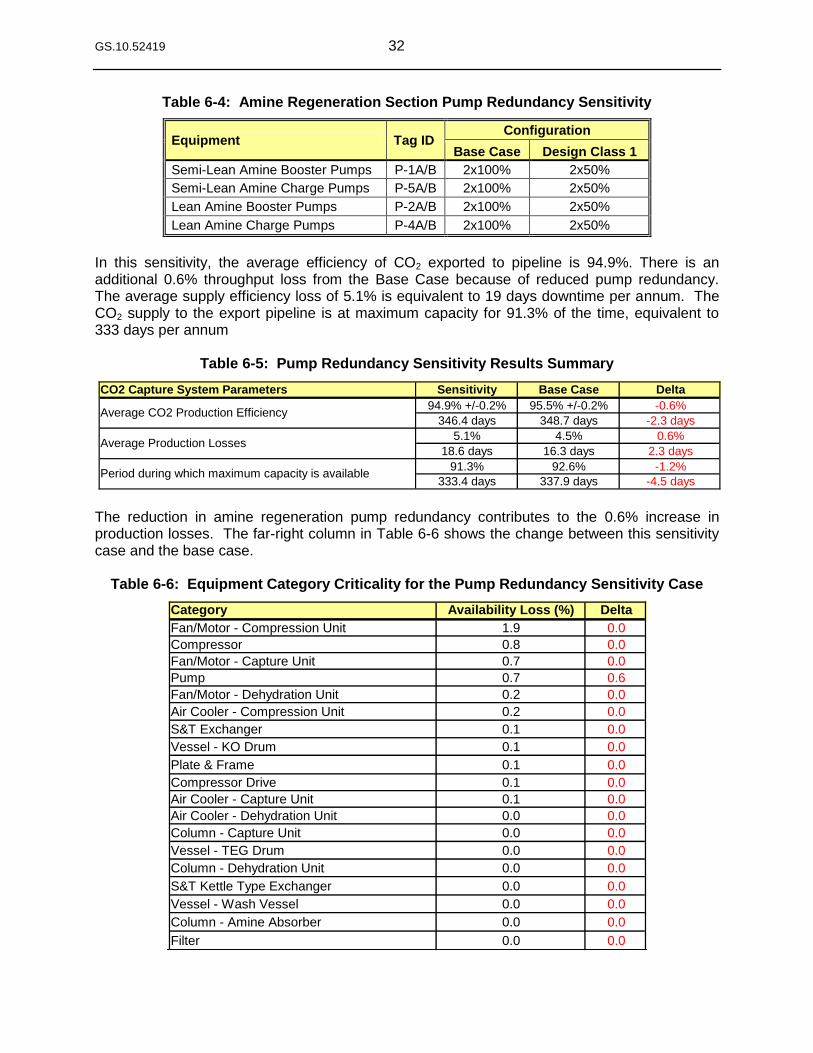
Table 6-4: Amine Regeneration Section Pump Redundancy Sensitivity
Equipment Tag ID Configuration
Base Case Design Class 1
Semi-Lean Amine Booster Pumps P-1A/B 2x100% 2x50%
Semi-Lean Amine Charge Pumps P-5A/B 2x100% 2x50%
Lean Amine Booster Pumps P-2A/B 2x100% 2x50%
Lean Amine Charge Pumps P-4A/B 2x100% 2x50%
In this sensitivity, the average efficiency of CO2 exported to pipeline is 94.9%. There is an additional 0.6% throughput loss from the Base Case because of reduced pump redundancy. The average supply efficiency loss of 5.1% is equivalent to 19 days downtime per annum. The CO2 supply to the export pipeline is at maximum capacity for 91.3% of the time, equivalent to 333 days per annum
Table 6-5: Pump Redundancy Sensitivity Results Summary
The reduction in amine regeneration pump redundancy contributes to the 0.6% increase in production losses. The far-right column in Table 6-6 shows the change between this sensitivity case and the base case.
Table 6-6: Equipment Category Criticality for the Pump Redundancy Sensitivity Case
CO2 Capture System Parameters Sensitivity Base Case Delta
94.9% +/-0.2% 95.5% +/-0.2% -0.6%
346.4 days 348.7 days -2.3 days
5.1% 4.5% 0.6%
18.6 days 16.3 days 2.3 days
91.3% 92.6% -1.2%
333.4 days 337.9 days -4.5 days
Average CO2 Production Efficiency
Average Production Losses
Period during which maximum capacity is available
Category Availability Loss (%) Delta
Fan/Motor - Compression Unit 1.9 0.0
Compressor 0.8 0.0
Fan/Motor - Capture Unit 0.7 0.0
Pump 0.7 0.6
Fan/Motor - Dehydration Unit 0.2 0.0
Air Cooler - Compression Unit 0.2 0.0
S&T Exchanger 0.1 0.0
Vessel - KO Drum 0.1 0.0
Plate & Frame 0.1 0.0
Compressor Drive 0.1 0.0
Air Cooler - Capture Unit 0.1 0.0
Air Cooler - Dehydration Unit 0.0 0.0
Column - Capture Unit 0.0 0.0
Vessel - TEG Drum 0.0 0.0
Column - Dehydration Unit 0.0 0.0
S&T Kettle Type Exchanger 0.0 0.0
Vessel - Wash Vessel 0.0 0.0
Column - Amine Absorber 0.0 0.0
Filter 0.0 0.0
GS.10.52419 33
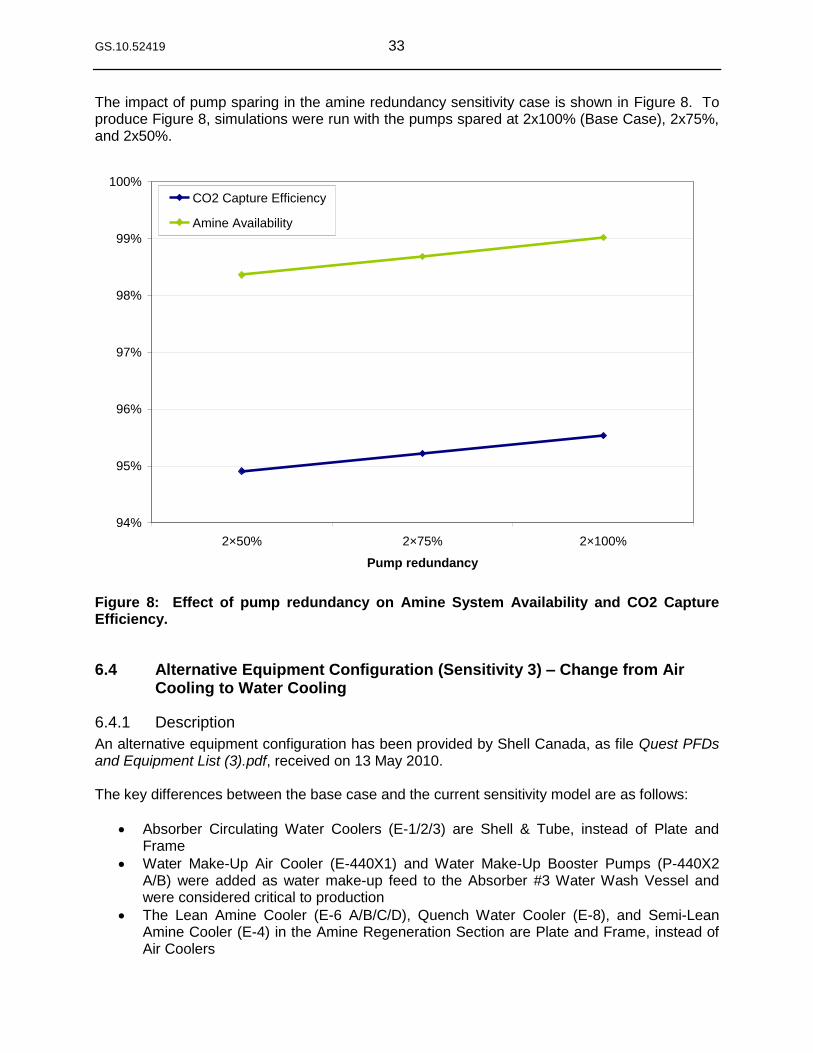
The impact of pump sparing in the amine redundancy sensitivity case is shown in Figure 8. To produce Figure 8, simulations were run with the pumps spared at 2x100% (Base Case), 2x75%, and 2x50%.
Figure 8: Effect of pump redundancy on Amine System Availability and CO2 Capture Efficiency.
6.4 Alternative Equipment Configuration (Sensitivity 3) – Change from Air Cooling to Water Cooling
6.4.1 Description
An alternative equipment configuration has been provided by Shell Canada, as file Quest PFDs and Equipment List (3).pdf, received on 13 May 2010. The key differences between the base case and the current sensitivity model are as follows:
Absorber Circulating Water Coolers (E-1/2/3) are Shell & Tube, instead of Plate and Frame
Water Make-Up Air Cooler (E-440X1) and Water Make-Up Booster Pumps (P-440X2 A/B) were added as water make-up feed to the Absorber #3 Water Wash Vessel and were considered critical to production
The Lean Amine Cooler (E-6 A/B/C/D), Quench Water Cooler (E-8), and Semi-Lean Amine Cooler (E-4) in the Amine Regeneration Section are Plate and Frame, instead of Air Coolers
94%
95%
96%
97%
98%
99%
100%
2×50% 2×75% 2×100%
Pump redundancy
CO2 Capture Efficiency
Amine Availability
GS.10.52419 34
The Stripper Reboiler Condensate Pots (V-24503 A/B) are added to the Amine Regeneration section
Coolers in the CO2 Compression Section are Shell & Tube, instead of Air Coolers, except for the Compressor 8th Stage Cooler (E-16)
The Compressor 7th Stage Cooler (E-15) is deleted
The TEG Stripper Heater Condensate Pot (V-24521) is added to the TEG Dehydration Section
The Power Recovery Turbine Package that is included in the alternative equipment configuration was not considered critical to production, as it is not believed that the CO2 Carbon Capture System will be shut down upon failure of this package. If the impact of such package is believed to be significant, it can be included in the model, once Shell Canada has provided the predicted relationship between production efficiency and the Power Recovery Turbine Package. Utilities and Chemical Injection equipment were not addressed.
6.4.2 Sensitivity Results
In this sensitivity, the average efficiency of CO2 exported to pipeline is 97.6%. There is a 2.1% production efficiency increase from the Base Case mainly because of the replacement of Air Coolers with Plate & Frame and Shell & Tube Coolers.
- Air Cooler availability = 99.76% - Shell & Tube / Plate & Frame availability = 99.96%
The average supply efficiency loss of 2.4% is equivalent to 9 days downtime per annum. The CO2 supply to the export pipeline is at maximum capacity for 96.9% of the time, equivalent to 354 days per annum.
Table 6-7: Sensitivity 3 Results Summary
The 2.4% efficiency loss is broken down by section in Table 6-8:
0.3% of the losses are due to the CO2 Capture section – showing a 0.7% reduction in losses (as compared to the Base Case)
1.6% of the losses are due to the CO2 Compression section – showing a 1.4% reduction in losses
0.5% of the losses are due to the CO2 Dehydration section – remaining unchanged, as no heat exchangers were changed in the Dehydration section
CO2 Capture System Parameters Sensitivity Base Case Delta
97.6% +/-0.1% 95.5% +/-0.2% 2.1%
356.3 days 348.7 days 7.6 days
2.4% 4.5% -2.1%
8.7 days 16.3 days -7.6 days
96.9% 92.6% 4.3%
353.6 days 337.9 days 15.7 days
Average CO2 Production Efficiency
Average Production Losses
Period during which maximum capacity is available
GS.10.52419 35
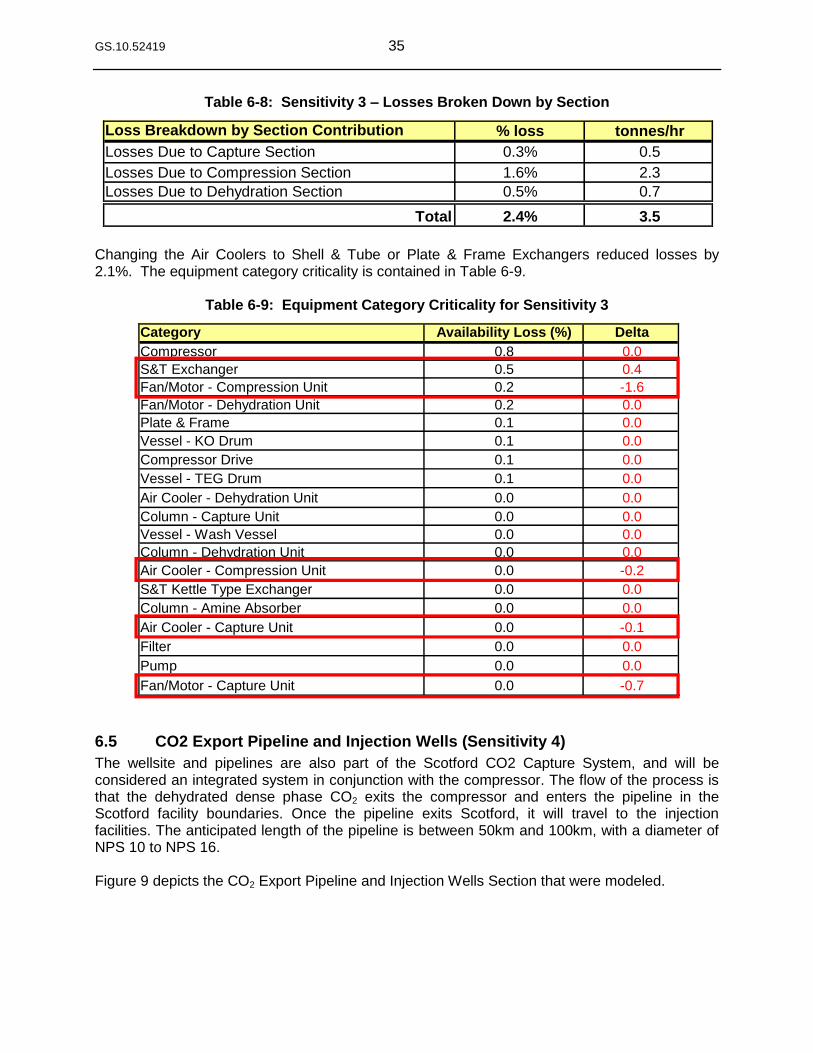
Table 6-8: Sensitivity 3 – Losses Broken Down by Section
Changing the Air Coolers to Shell & Tube or Plate & Frame Exchangers reduced losses by 2.1%. The equipment category criticality is contained in Table 6-9.
Table 6-9: Equipment Category Criticality for Sensitivity 3
6.5 CO2 Export Pipeline and Injection Wells (Sensitivity 4)
The wellsite and pipelines are also part of the Scotford CO2 Capture System, and will be considered an integrated system in conjunction with the compressor. The flow of the process is that the dehydrated dense phase CO2 exits the compressor and enters the pipeline in the Scotford facility boundaries. Once the pipeline exits Scotford, it will travel to the injection facilities. The anticipated length of the pipeline is between 50km and 100km, with a diameter of NPS 10 to NPS 16. Figure 9 depicts the CO2 Export Pipeline and Injection Wells Section that were modeled.
Loss Breakdown by Section Contribution % loss tonnes/hr
Losses Due to Capture Section 0.3% 0.5
Losses Due to Compression Section 1.6% 2.3
Losses Due to Dehydration Section 0.5% 0.7
Total 2.4% 3.5
Category Availability Loss (%) Delta
Compressor 0.8 0.0
S&T Exchanger 0.5 0.4
Fan/Motor - Compression Unit 0.2 -1.6
Fan/Motor - Dehydration Unit 0.2 0.0
Plate & Frame 0.1 0.0
Vessel - KO Drum 0.1 0.0
Compressor Drive 0.1 0.0
Vessel - TEG Drum 0.1 0.0
Air Cooler - Dehydration Unit 0.0 0.0
Column - Capture Unit 0.0 0.0
Vessel - Wash Vessel 0.0 0.0
Column - Dehydration Unit 0.0 0.0
Air Cooler - Compression Unit 0.0 -0.2
S&T Kettle Type Exchanger 0.0 0.0
Column - Amine Absorber 0.0 0.0
Air Cooler - Capture Unit 0.0 -0.1
Filter 0.0 0.0
Pump 0.0 0.0
Fan/Motor - Capture Unit 0.0 -0.7
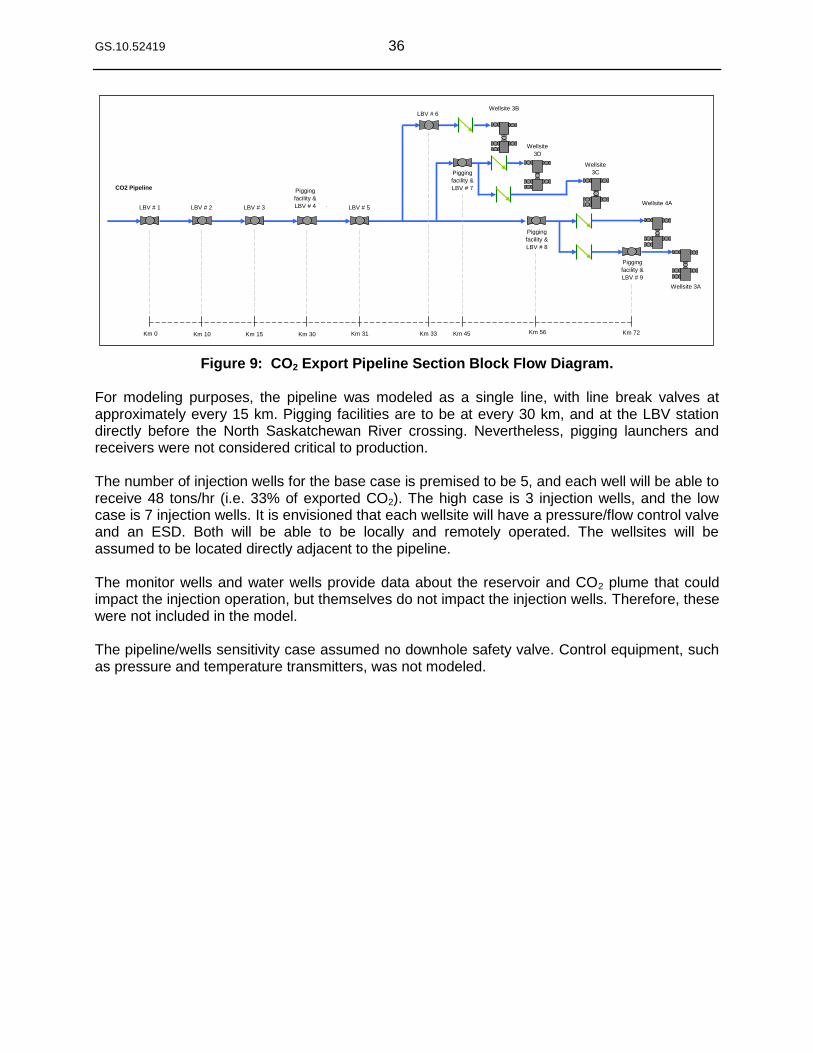
GS.10.52419 36
Figure 9: CO2 Export Pipeline Section Block Flow Diagram. For modeling purposes, the pipeline was modeled as a single line, with line break valves at approximately every 15 km. Pigging facilities are to be at every 30 km, and at the LBV station directly before the North Saskatchewan River crossing. Nevertheless, pigging launchers and receivers were not considered critical to production. The number of injection wells for the base case is premised to be 5, and each well will be able to receive 48 tons/hr (i.e. 33% of exported CO2). The high case is 3 injection wells, and the low case is 7 injection wells. It is envisioned that each wellsite will have a pressure/flow control valve and an ESD. Both will be able to be locally and remotely operated. The wellsites will be assumed to be located directly adjacent to the pipeline. The monitor wells and water wells provide data about the reservoir and CO2 plume that could impact the injection operation, but themselves do not impact the injection wells. Therefore, these were not included in the model. The pipeline/wells sensitivity case assumed no downhole safety valve. Control equipment, such as pressure and temperature transmitters, was not modeled.
CO2 Pipeline
LBV # 1 LBV # 2 LBV # 3
Pigging
facility &
LBV # 4 LBV # 5
Km 10Km 0 Km 15 Km 30
Wellsite 3B
Wellsite 4A
Wellsite 3A
Pigging
facility &
LBV # 9
LBV # 6
Pigging
facility &
LBV # 8
Km 31 Km 33 Km 56 Km 72
Wellsite
3D
Km 45
Pigging
facility &
LBV # 7
Wellsite
3C
GS.10.52419 37
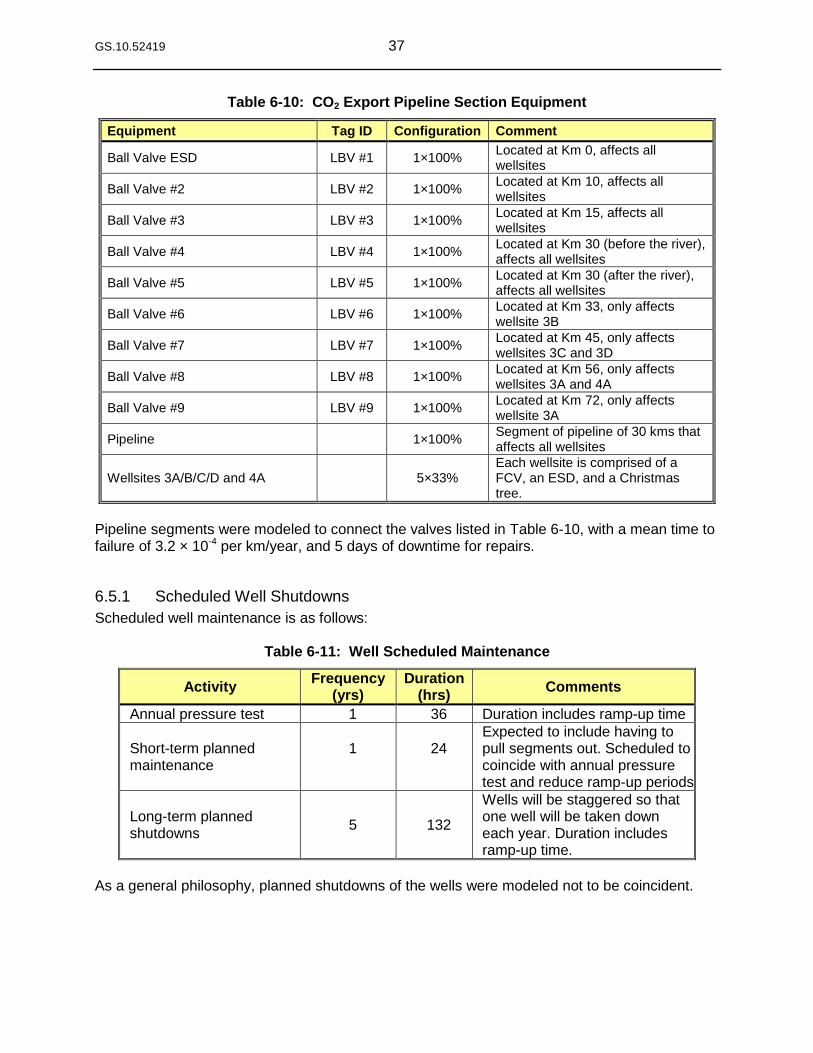
Table 6-10: CO2 Export Pipeline Section Equipment
Equipment Tag ID Configuration Comment
Ball Valve ESD LBV #1 1×100% Located at Km 0, affects all wellsites
Ball Valve #2 LBV #2 1×100% Located at Km 10, affects all wellsites
Ball Valve #3 LBV #3 1×100% Located at Km 15, affects all wellsites
Ball Valve #4 LBV #4 1×100% Located at Km 30 (before the river), affects all wellsites
Ball Valve #5 LBV #5 1×100% Located at Km 30 (after the river), affects all wellsites
Ball Valve #6 LBV #6 1×100% Located at Km 33, only affects wellsite 3B
Ball Valve #7 LBV #7 1×100% Located at Km 45, only affects wellsites 3C and 3D
Ball Valve #8 LBV #8 1×100% Located at Km 56, only affects wellsites 3A and 4A
Ball Valve #9 LBV #9 1×100% Located at Km 72, only affects wellsite 3A
Pipeline 1×100% Segment of pipeline of 30 kms that affects all wellsites
Wellsites 3A/B/C/D and 4A 5×33% Each wellsite is comprised of a FCV, an ESD, and a Christmas tree.
Pipeline segments were modeled to connect the valves listed in Table 6-10, with a mean time to failure of 3.2 × 10⁻⁴ per km/year, and 5 days of downtime for repairs.
6.5.1 Scheduled Well Shutdowns
Scheduled well maintenance is as follows:
Table 6-11: Well Scheduled Maintenance
Activity Frequency
(yrs) Duration
(hrs) Comments
Annual pressure test 1 36 Duration includes ramp-up time
Short-term planned maintenance
1
24
Expected to include having to pull segments out. Scheduled to coincide with annual pressure test and reduce ramp-up periods
Long-term planned shutdowns
5 132
Wells will be staggered so that one well will be taken down each year. Duration includes ramp-up time.
As a general philosophy, planned shutdowns of the wells were modeled not to be coincident.
GS.10.52419 38
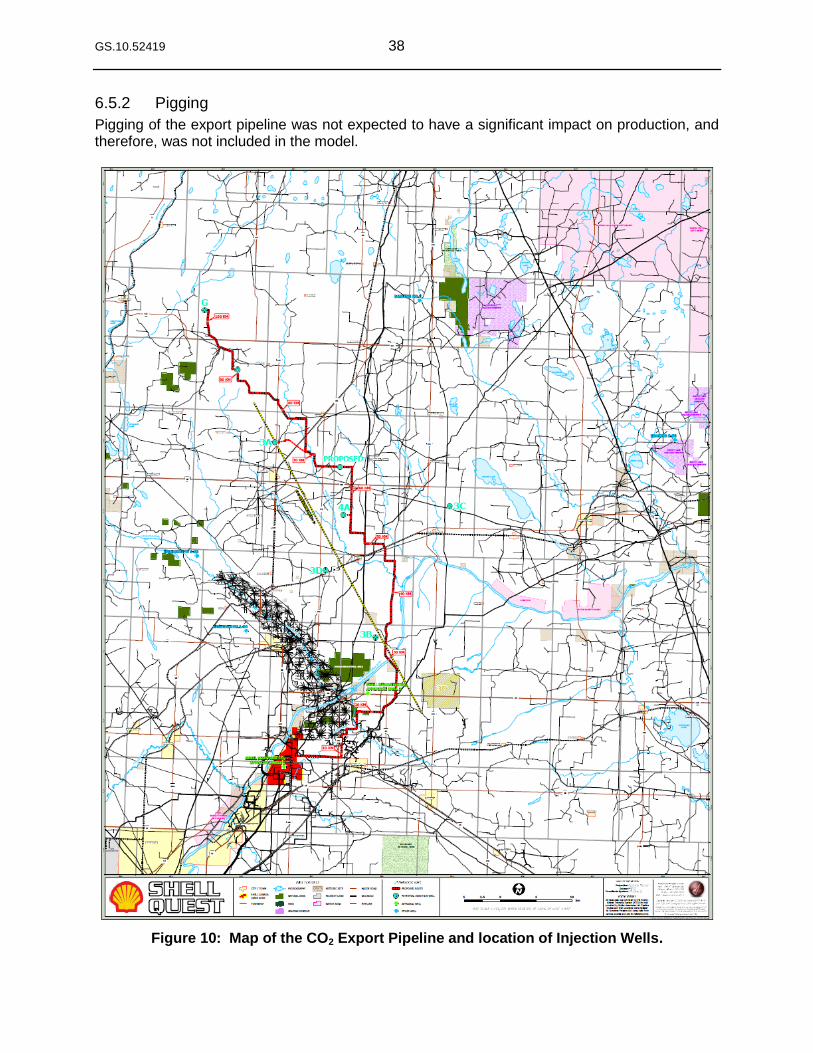
6.5.2 Pigging
Pigging of the export pipeline was not expected to have a significant impact on production, and therefore, was not included in the model.
Figure 10: Map of the CO2 Export Pipeline and location of Injection Wells.
GS.10.52419 39
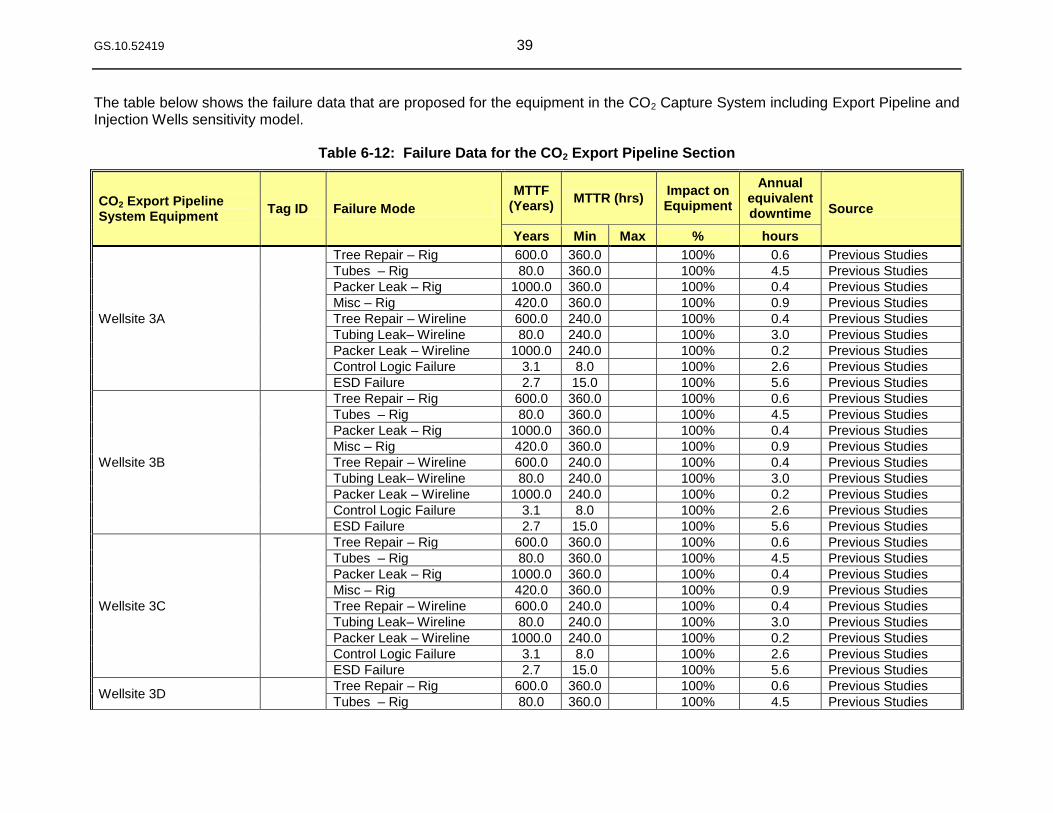
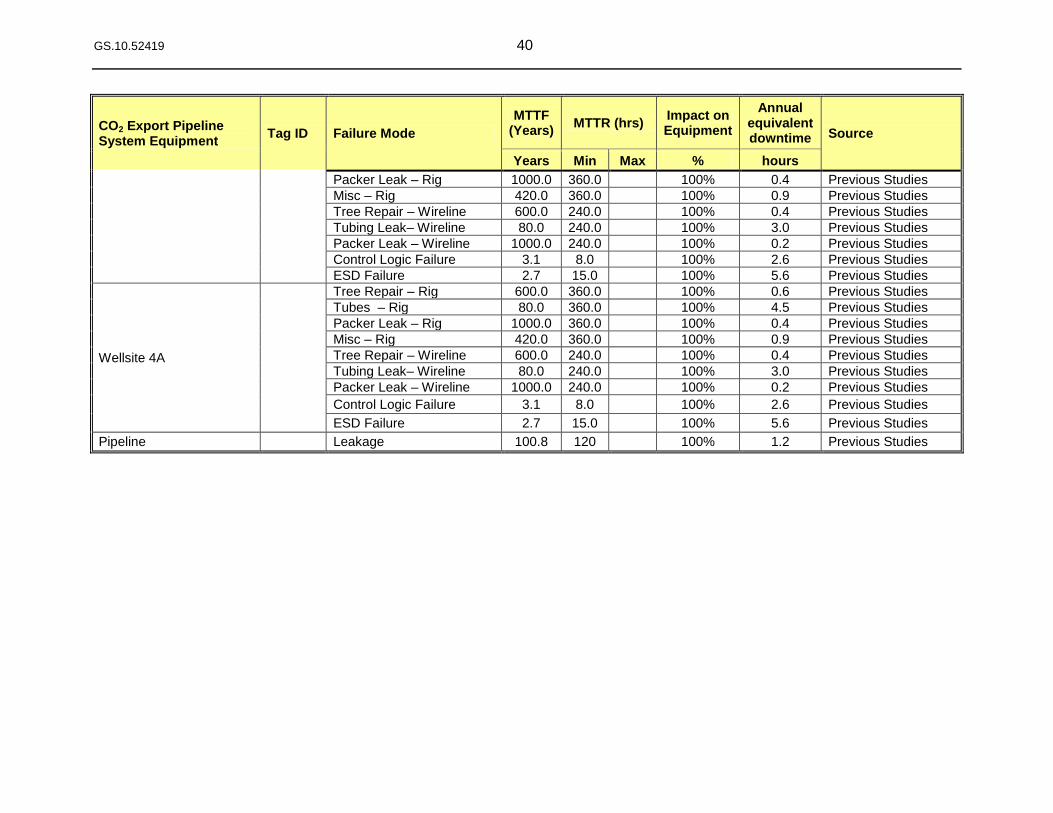
The table below shows the failure data that are proposed for the equipment in the CO2 Capture System including Export Pipeline and Injection Wells sensitivity model.
Table 6-12: Failure Data for the CO2 Export Pipeline Section
CO2 Export Pipeline System Equipment
Tag ID Failure Mode
MTTF (Years)
MTTR (hrs) Impact on Equipment
Annual equivalent downtime Source
Years Min Max % hours
Wellsite 3A
Tree Repair – Rig 600.0 360.0 100% 0.6 Previous Studies
Tubes – Rig 80.0 360.0 100% 4.5 Previous Studies
Packer Leak – Rig 1000.0 360.0 100% 0.4 Previous Studies
Misc – Rig 420.0 360.0 100% 0.9 Previous Studies
Tree Repair – Wireline 600.0 240.0 100% 0.4 Previous Studies
Tubing Leak– Wireline 80.0 240.0 100% 3.0 Previous Studies
Packer Leak – Wireline 1000.0 240.0 100% 0.2 Previous Studies
Control Logic Failure 3.1 8.0 100% 2.6 Previous Studies
ESD Failure 2.7 15.0 100% 5.6 Previous Studies
Wellsite 3B
Tree Repair – Rig 600.0 360.0 100% 0.6 Previous Studies
Tubes – Rig 80.0 360.0 100% 4.5 Previous Studies
Packer Leak – Rig 1000.0 360.0 100% 0.4 Previous Studies
Misc – Rig 420.0 360.0 100% 0.9 Previous Studies
Tree Repair – Wireline 600.0 240.0 100% 0.4 Previous Studies
Tubing Leak– Wireline 80.0 240.0 100% 3.0 Previous Studies
Packer Leak – Wireline 1000.0 240.0 100% 0.2 Previous Studies
Control Logic Failure 3.1 8.0 100% 2.6 Previous Studies
ESD Failure 2.7 15.0 100% 5.6 Previous Studies
Wellsite 3C
Tree Repair – Rig 600.0 360.0 100% 0.6 Previous Studies
Tubes – Rig 80.0 360.0 100% 4.5 Previous Studies
Packer Leak – Rig 1000.0 360.0 100% 0.4 Previous Studies
Misc – Rig 420.0 360.0 100% 0.9 Previous Studies
Tree Repair – Wireline 600.0 240.0 100% 0.4 Previous Studies
Tubing Leak– Wireline 80.0 240.0 100% 3.0 Previous Studies
Packer Leak – Wireline 1000.0 240.0 100% 0.2 Previous Studies
Control Logic Failure 3.1 8.0 100% 2.6 Previous Studies
ESD Failure 2.7 15.0 100% 5.6 Previous Studies
Wellsite 3D Tree Repair – Rig 600.0 360.0 100% 0.6 Previous Studies
Tubes – Rig 80.0 360.0 100% 4.5 Previous Studies
GS.10.52419 40
CO2 Export Pipeline System Equipment
Tag ID Failure Mode
MTTF (Years)
MTTR (hrs) Impact on Equipment
Annual equivalent downtime Source
Years Min Max % hours
Packer Leak – Rig 1000.0 360.0 100% 0.4 Previous Studies
Misc – Rig 420.0 360.0 100% 0.9 Previous Studies
Tree Repair – Wireline 600.0 240.0 100% 0.4 Previous Studies
Tubing Leak– Wireline 80.0 240.0 100% 3.0 Previous Studies
Packer Leak – Wireline 1000.0 240.0 100% 0.2 Previous Studies
Control Logic Failure 3.1 8.0 100% 2.6 Previous Studies
ESD Failure 2.7 15.0 100% 5.6 Previous Studies
Wellsite 4A
Tree Repair – Rig 600.0 360.0 100% 0.6 Previous Studies
Tubes – Rig 80.0 360.0 100% 4.5 Previous Studies
Packer Leak – Rig 1000.0 360.0 100% 0.4 Previous Studies
Misc – Rig 420.0 360.0 100% 0.9 Previous Studies
Tree Repair – Wireline 600.0 240.0 100% 0.4 Previous Studies
Tubing Leak– Wireline 80.0 240.0 100% 3.0 Previous Studies
Packer Leak – Wireline 1000.0 240.0 100% 0.2 Previous Studies
Control Logic Failure 3.1 8.0 100% 2.6 Previous Studies
ESD Failure 2.7 15.0 100% 5.6 Previous Studies
Pipeline Leakage 100.8 120 100% 1.2 Previous Studies
GS.10.52419 41
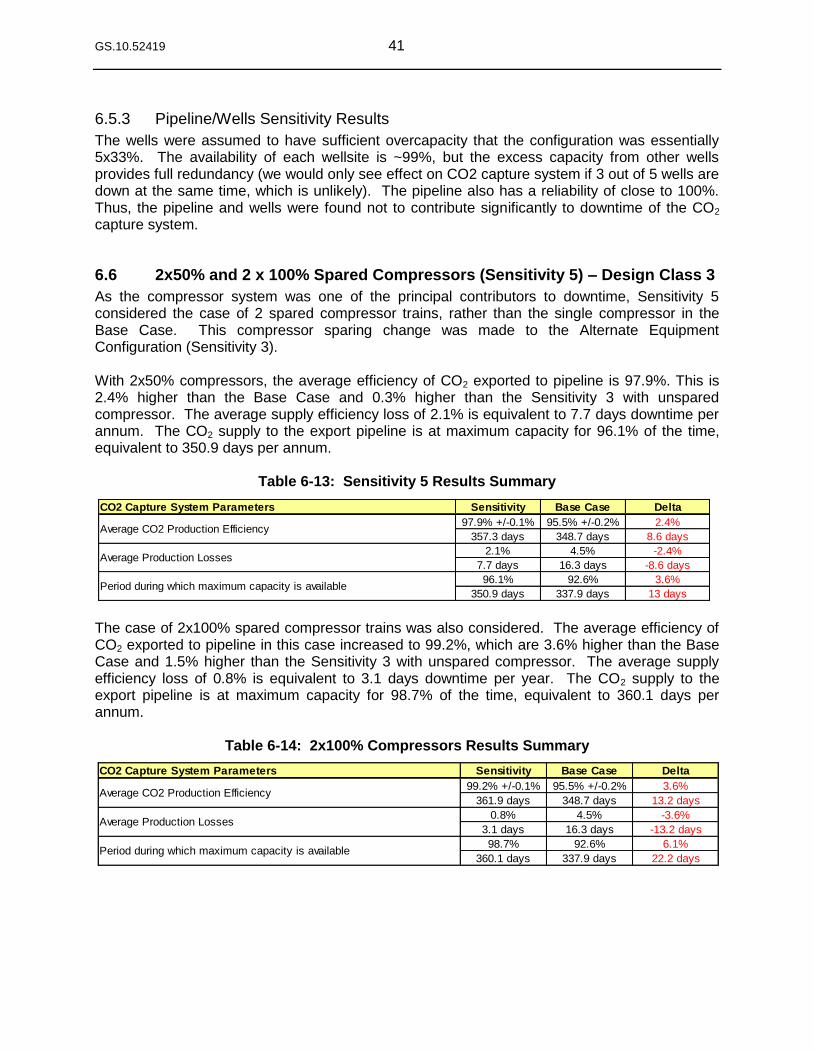
6.5.3 Pipeline/Wells Sensitivity Results
The wells were assumed to have sufficient overcapacity that the configuration was essentially 5x33%. The availability of each wellsite is ~99%, but the excess capacity from other wells provides full redundancy (we would only see effect on CO2 capture system if 3 out of 5 wells are down at the same time, which is unlikely). The pipeline also has a reliability of close to 100%. Thus, the pipeline and wells were found not to contribute significantly to downtime of the CO2 capture system.
6.6 2x50% and 2 x 100% Spared Compressors (Sensitivity 5) – Design Class 3
As the compressor system was one of the principal contributors to downtime, Sensitivity 5 considered the case of 2 spared compressor trains, rather than the single compressor in the Base Case. This compressor sparing change was made to the Alternate Equipment Configuration (Sensitivity 3). With 2x50% compressors, the average efficiency of CO2 exported to pipeline is 97.9%. This is 2.4% higher than the Base Case and 0.3% higher than the Sensitivity 3 with unspared compressor. The average supply efficiency loss of 2.1% is equivalent to 7.7 days downtime per annum. The CO2 supply to the export pipeline is at maximum capacity for 96.1% of the time, equivalent to 350.9 days per annum.
Table 6-13: Sensitivity 5 Results Summary
The case of 2x100% spared compressor trains was also considered. The average efficiency of CO2 exported to pipeline in this case increased to 99.2%, which are 3.6% higher than the Base Case and 1.5% higher than the Sensitivity 3 with unspared compressor. The average supply efficiency loss of 0.8% is equivalent to 3.1 days downtime per year. The CO2 supply to the export pipeline is at maximum capacity for 98.7% of the time, equivalent to 360.1 days per annum.
Table 6-14: 2x100% Compressors Results Summary
CO2 Capture System Parameters Sensitivity Base Case Delta
97.9% +/-0.1% 95.5% +/-0.2% 2.4%
357.3 days 348.7 days 8.6 days
2.1% 4.5% -2.4%
7.7 days 16.3 days -8.6 days
96.1% 92.6% 3.6%
350.9 days 337.9 days 13 days
Average CO2 Production Efficiency
Average Production Losses
Period during which maximum capacity is available
CO2 Capture System Parameters Sensitivity Base Case Delta
99.2% +/-0.1% 95.5% +/-0.2% 3.6%
361.9 days 348.7 days 13.2 days
0.8% 4.5% -3.6%
3.1 days 16.3 days -13.2 days
98.7% 92.6% 6.1%
360.1 days 337.9 days 22.2 days
Average CO2 Production Efficiency
Average Production Losses
Period during which maximum capacity is available
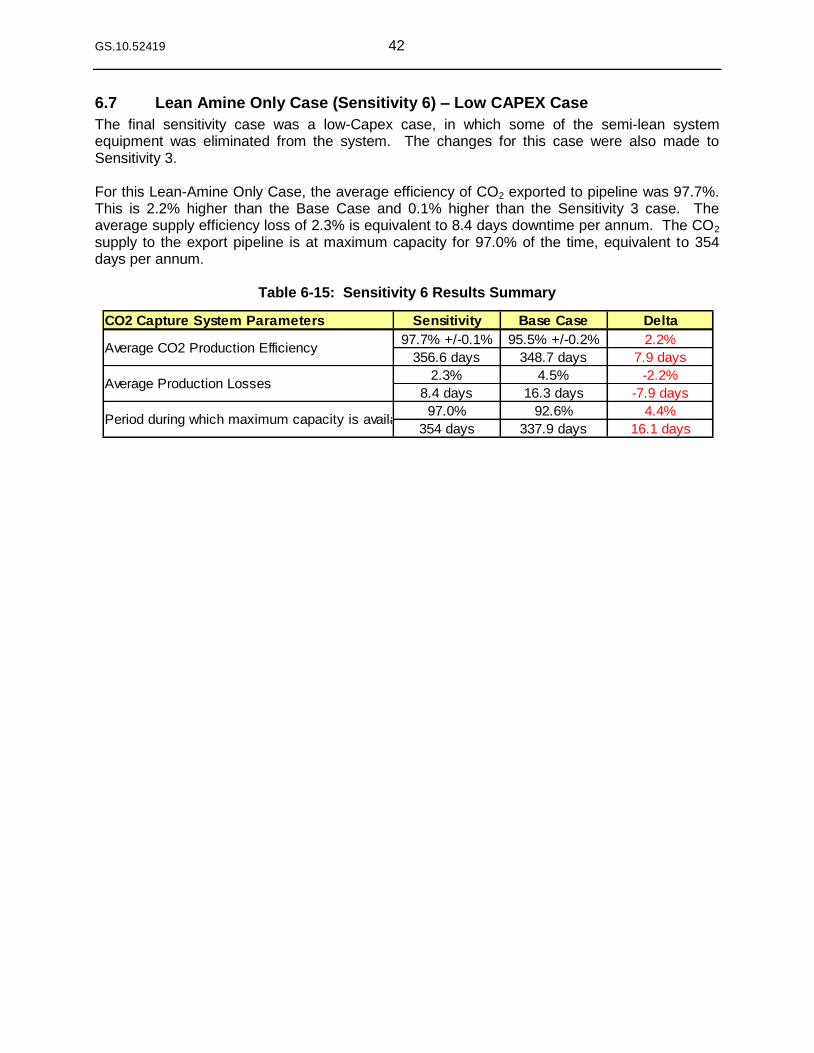
GS.10.52419 42
6.7 Lean Amine Only Case (Sensitivity 6) – Low CAPEX Case
The final sensitivity case was a low-Capex case, in which some of the semi-lean system equipment was eliminated from the system. The changes for this case were also made to Sensitivity 3. For this Lean-Amine Only Case, the average efficiency of CO2 exported to pipeline was 97.7%. This is 2.2% higher than the Base Case and 0.1% higher than the Sensitivity 3 case. The average supply efficiency loss of 2.3% is equivalent to 8.4 days downtime per annum. The CO2 supply to the export pipeline is at maximum capacity for 97.0% of the time, equivalent to 354 days per annum.
Table 6-15: Sensitivity 6 Results Summary
CO2 Capture System Parameters Sensitivity Base Case Delta
97.7% +/-0.1% 95.5% +/-0.2% 2.2%
356.6 days 348.7 days 7.9 days
2.3% 4.5% -2.2%
8.4 days 16.3 days -7.9 days
97.0% 92.6% 4.4%
354 days 337.9 days 16.1 days
Average CO2 Production Efficiency
Average Production Losses
Period during which maximum capacity is available
GS.10.52419 43
Appendix A. CO2 Capture System Reliability Block Diagram
Appendix A contains the detailed reliability block diagram for the CO2 Capture system:
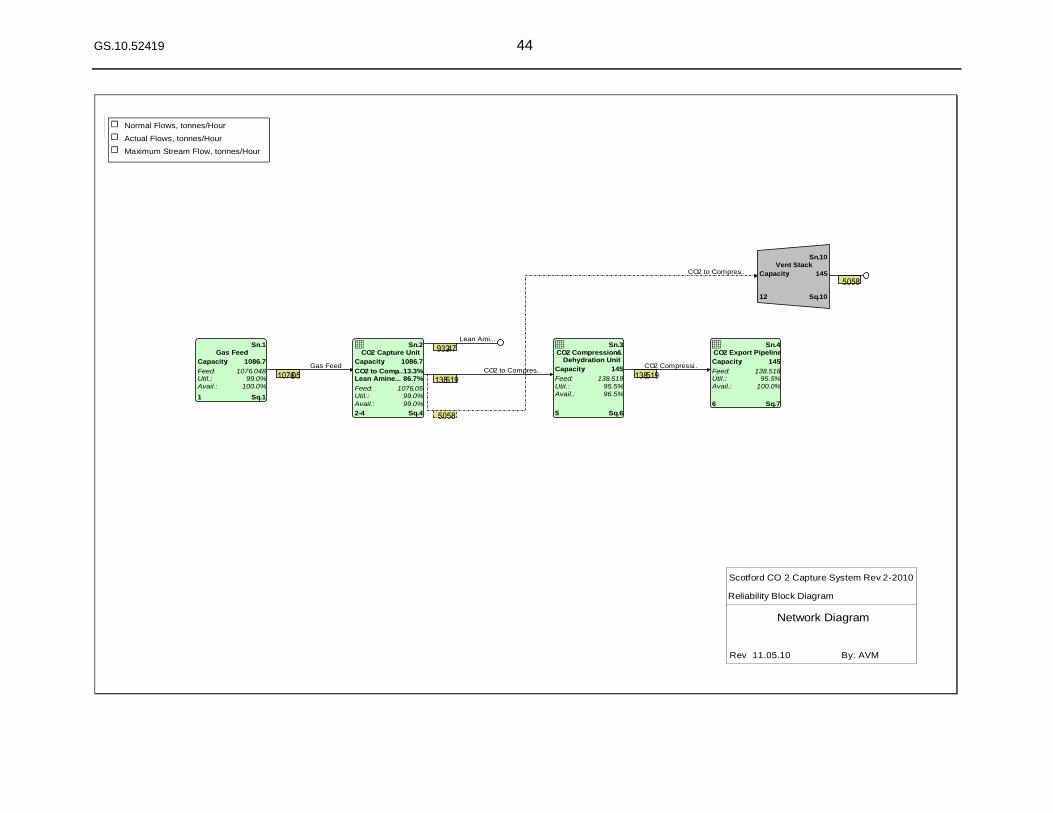
GS.10.52419 44
Normal Flows, tonnes/Hour
Actual Flows, tonnes/Hour
Maximum Stream Flow, tonnes/Hour
CO2 to Compres...
Gas FeedCO2 to Compres...
CO2 Compressi...
5.058
1076.05138.519
138.519
5.058
Lean Ami...
932.47
Sn.10
Sq.1012
Vent Stack
Capacity: 145
Sn.1
Sq.11
Gas Feed
Capacity: 1086.7
Feed: 1076.048Util.: 99.0%Avail.: 100.0%
Sn.2
Sq.42-4
CO2 Capture Unit
Capacity: 1086.7
13.3%CO2 to Comp...86.7%Lean Amine ...
Feed: 1076.05Util.: 99.0%
Avail.: 99.0%
Sn.3
Sq.65
CO2 Compression &Dehydration Unit
Capacity: 145
Feed: 138.519Util.: 95.5%Avail.: 96.5%
Sn.4
Sq.76
CO2 Export Pipeline
Capacity: 145
Feed: 138.518Util.: 95.5%Avail.: 100.0%
Scotford CO 2 Capture System Rev 2-2010
Network Diagram
Rev 11.05.10 By: AVM
Reliability Block Diagram
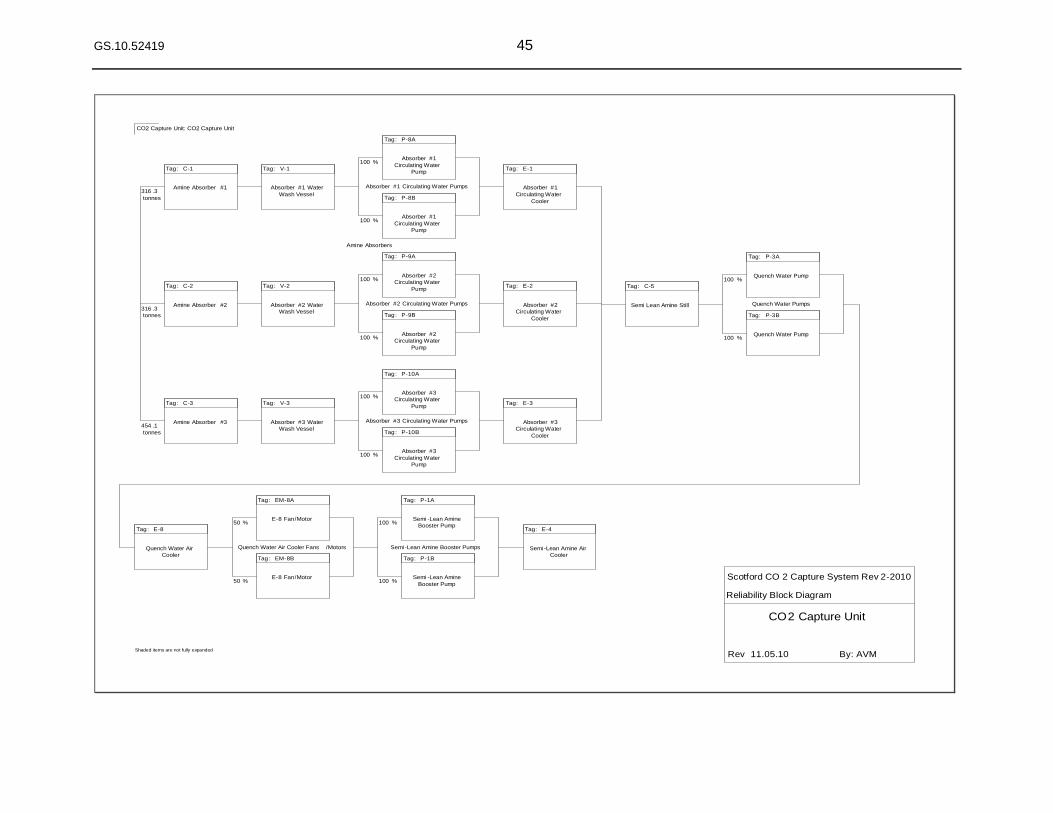
GS.10.52419 45
Amine Absorber #1
Tag: C-1
Absorber #1 Water
Wash Vessel
Tag: V-1
Absorber #1
Circulating Water
Pump
Tag: P-8A
Absorber #1
Circulating Water
Pump
Tag: P-8B
Absorber #1 Circulating Water Pumps
100 %
100 %
Absorber #1
Circulating Water
Cooler
Tag: E-1
Amine Absorber #2
Tag: C-2
Absorber #2 Water
Wash Vessel
Tag: V-2
Absorber #2
Circulating Water
Pump
Tag: P-9A
Absorber #2
Circulating Water
Pump
Tag: P-9B
Absorber #2 Circulating Water Pumps
100 %
100 %
Absorber #2
Circulating Water
Cooler
Tag: E-2
Amine Absorber #3
Tag: C-3
Absorber #3 Water
Wash Vessel
Tag: V-3
Absorber #3
Circulating Water
Pump
Tag: P-10A
Absorber #3
Circulating Water
Pump
Tag: P-10B
Absorber #3 Circulating Water Pumps
100 %
100 %
Absorber #3
Circulating Water
Cooler
Tag: E-3
CO2 Capture Unit: CO2 Capture Unit
Amine Absorbers
316 .3
tonnes
316 .3
tonnes
454 .1
tonnes
Semi Lean Amine Still
Tag: C-5
Quench Water Pump
Tag: P-3A
Quench Water Pump
Tag: P-3B
Quench Water Pumps
100 %
100 %
Quench Water Air
Cooler
Tag: E-8
E-8 Fan/Motor
Tag: EM-8A
E-8 Fan/Motor
Tag: EM-8B
Quench Water Air Cooler Fans /Motors
50 %
50 %
Semi -Lean Amine
Booster Pump
Tag: P-1A
Semi -Lean Amine
Booster Pump
Tag: P-1B
Semi -Lean Amine Booster Pumps
100 %
100 %
Semi -Lean Amine Air
Cooler
Tag: E-4
Scotford CO 2 Capture System Rev 2-2010
CO2 Capture Unit
Rev 11.05.10 By: AVM
Reliability Block Diagram
Shaded items are not fully expanded
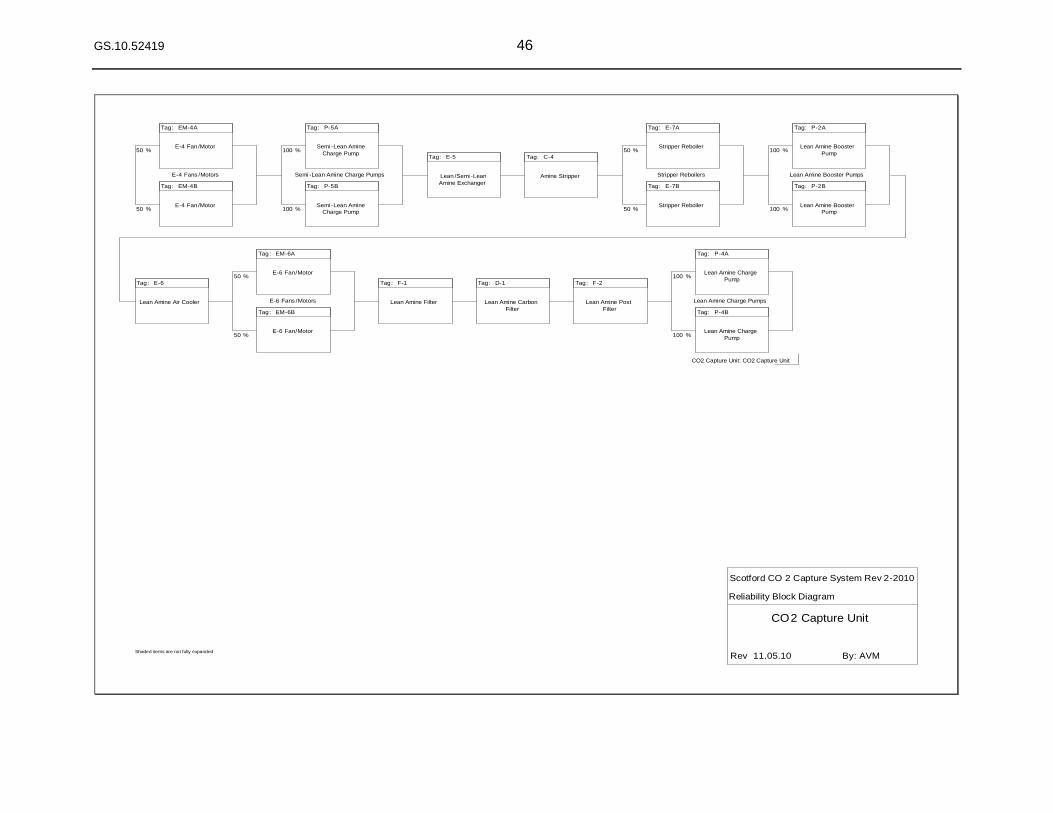
GS.10.52419 46
E-4 Fan/Motor
Tag: EM-4A
E-4 Fan/Motor
Tag: EM-4B
E-4 Fans /Motors
50 %
50 %
Semi -Lean Amine
Charge Pump
Tag: P-5A
Semi -Lean Amine
Charge Pump
Tag: P-5B
Semi -Lean Amine Charge Pumps
100 %
100 %
Lean /Semi -Lean
Amine Exchanger
Tag: E-5
Amine Stripper
Tag: C-4
Stripper Reboiler
Tag: E-7A
Stripper Reboiler
Tag: E-7B
Stripper Reboilers
50 %
50 %
Lean Amine Booster
Pump
Tag: P-2A
Lean Amine Booster
Pump
Tag: P-2B
Lean Amine Booster Pumps
100 %
100 %
Lean Amine Air Cooler
Tag: E-6
E-6 Fan/Motor
Tag: EM-6A
E-6 Fan/Motor
Tag: EM-6B
E-6 Fans /Motors
50 %
50 %
Lean Amine Filter
Tag: F-1
Lean Amine Carbon
Filter
Tag: D-1
Lean Amine Post
Filter
Tag: F-2
Lean Amine Charge
Pump
Tag: P-4A
Lean Amine Charge
Pump
Tag: P-4B
CO2 Capture Unit: CO2 Capture Unit
Lean Amine Charge Pumps
100 %
100 %
Scotford CO 2 Capture System Rev 2-2010
CO2 Capture Unit
Rev 11.05.10 By: AVM
Reliability Block Diagram
Shaded items are not fully expanded
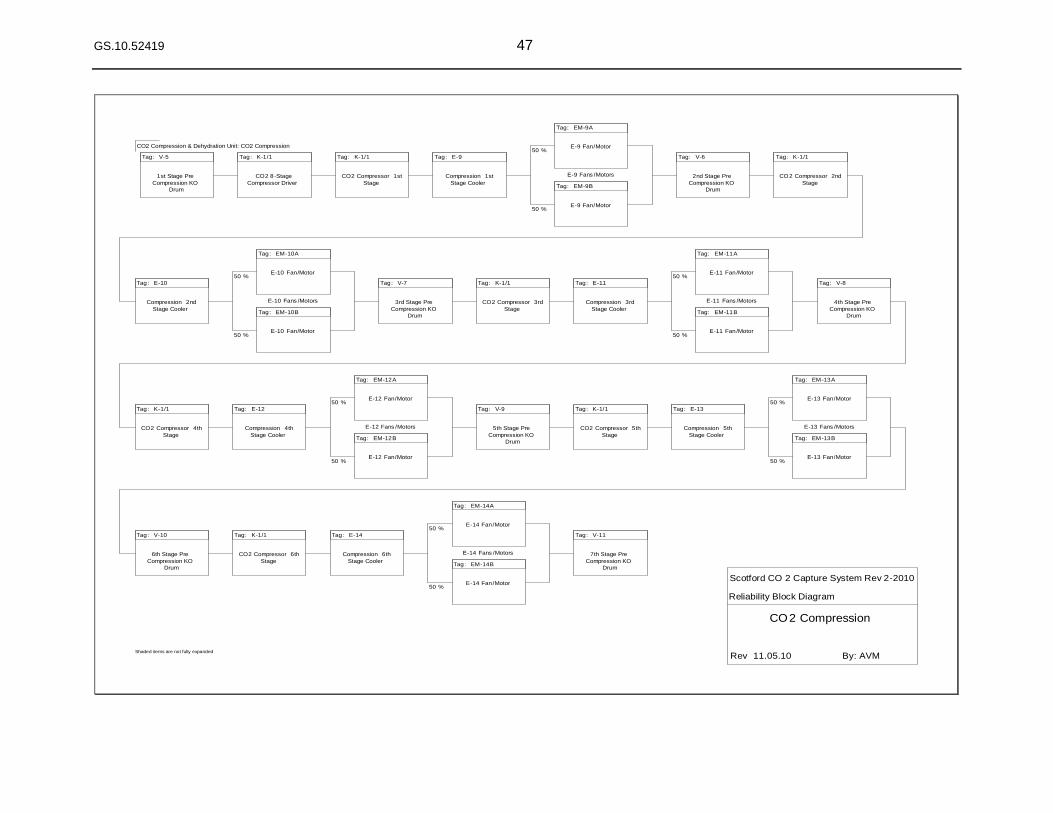
GS.10.52419 47
1st Stage Pre
Compression KO
Drum
Tag: V-5
CO2 Compression & Dehydration Unit: CO2 Compression
CO2 8-Stage
Compressor Driver
Tag: K-1/1
CO2 Compressor 1st
Stage
Tag: K-1/1
Compression 1st
Stage Cooler
Tag: E-9
E-9 Fan/Motor
Tag: EM-9A
E-9 Fan/Motor
Tag: EM-9B
E-9 Fans /Motors
50 %
50 %
2nd Stage Pre
Compression KO
Drum
Tag: V-6
CO2 Compressor 2nd
Stage
Tag: K-1/1
Compression 2nd
Stage Cooler
Tag: E-10
E-10 Fan/Motor
Tag: EM-10A
E-10 Fan/Motor
Tag: EM-10B
E-10 Fans /Motors
50 %
50 %
3rd Stage Pre
Compression KO
Drum
Tag: V-7
CO2 Compressor 3rd
Stage
Tag: K-1/1
Compression 3rd
Stage Cooler
Tag: E-11
E-11 Fan/Motor
Tag: EM-11A
E-11 Fan/Motor
Tag: EM-11B
E-11 Fans /Motors
50 %
50 %
4th Stage Pre
Compression KO
Drum
Tag: V-8
CO2 Compressor 4th
Stage
Tag: K-1/1
Compression 4th
Stage Cooler
Tag: E-12
E-12 Fan/Motor
Tag: EM-12A
E-12 Fan/Motor
Tag: EM-12B
E-12 Fans /Motors
50 %
50 %
5th Stage Pre
Compression KO
Drum
Tag: V-9
CO2 Compressor 5th
Stage
Tag: K-1/1
Compression 5th
Stage Cooler
Tag: E-13
E-13 Fan/Motor
Tag: EM-13A
E-13 Fan/Motor
Tag: EM-13B
E-13 Fans /Motors
50 %
50 %
6th Stage Pre
Compression KO
Drum
Tag: V-10
CO2 Compressor 6th
Stage
Tag: K-1/1
Compression 6th
Stage Cooler
Tag: E-14
E-14 Fan/Motor
Tag: EM-14A
E-14 Fan/Motor
Tag: EM-14B
E-14 Fans /Motors
50 %
50 %
7th Stage Pre
Compression KO
Drum
Tag: V-11
Scotford CO 2 Capture System Rev 2-2010
CO2 Compression
Rev 11.05.10 By: AVM
Reliability Block Diagram
Shaded items are not fully expanded
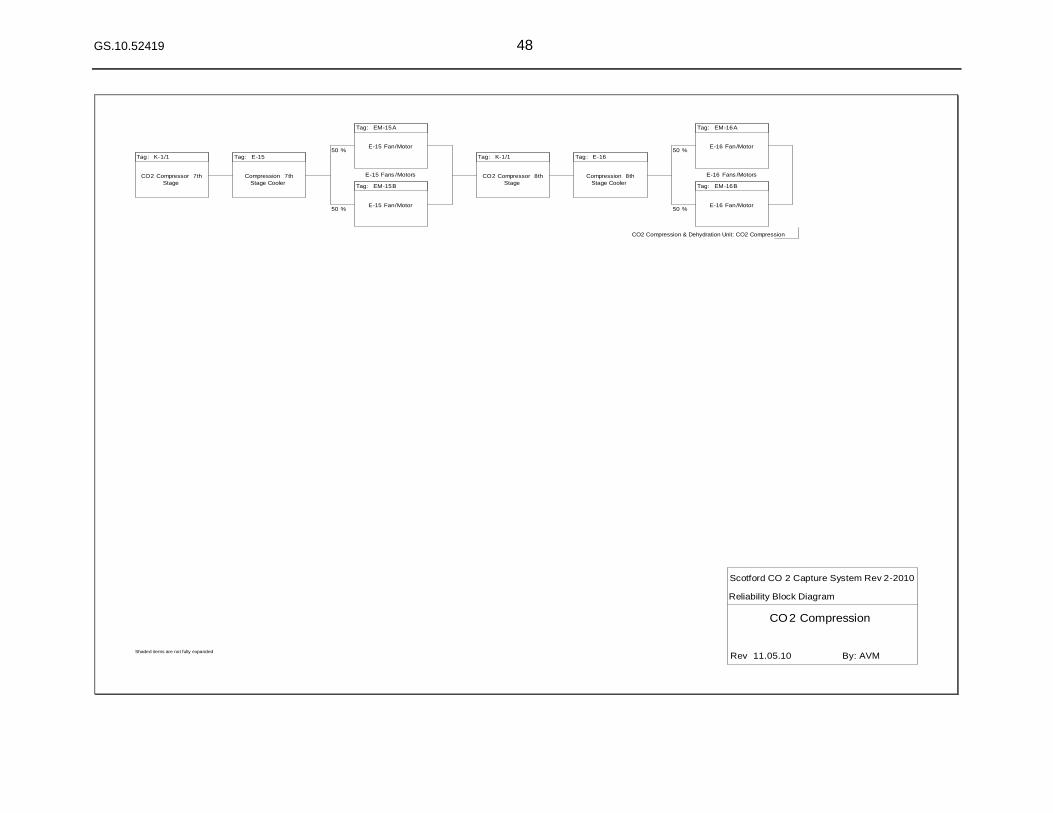
GS.10.52419 48
CO2 Compressor 7th
Stage
Tag: K-1/1
Compression 7th
Stage Cooler
Tag: E-15
E-15 Fan/Motor
Tag: EM-15A
E-15 Fan/Motor
Tag: EM-15B
E-15 Fans /Motors
50 %
50 %
CO2 Compressor 8th
Stage
Tag: K-1/1
Compression 8th
Stage Cooler
Tag: E-16
E-16 Fan/Motor
Tag: EM-16A
E-16 Fan/Motor
Tag: EM-16B
CO2 Compression & Dehydration Unit: CO2 Compression
E-16 Fans /Motors
50 %
50 %
Scotford CO 2 Capture System Rev 2-2010
CO2 Compression
Rev 11.05.10 By: AVM
Reliability Block Diagram
Shaded items are not fully expanded
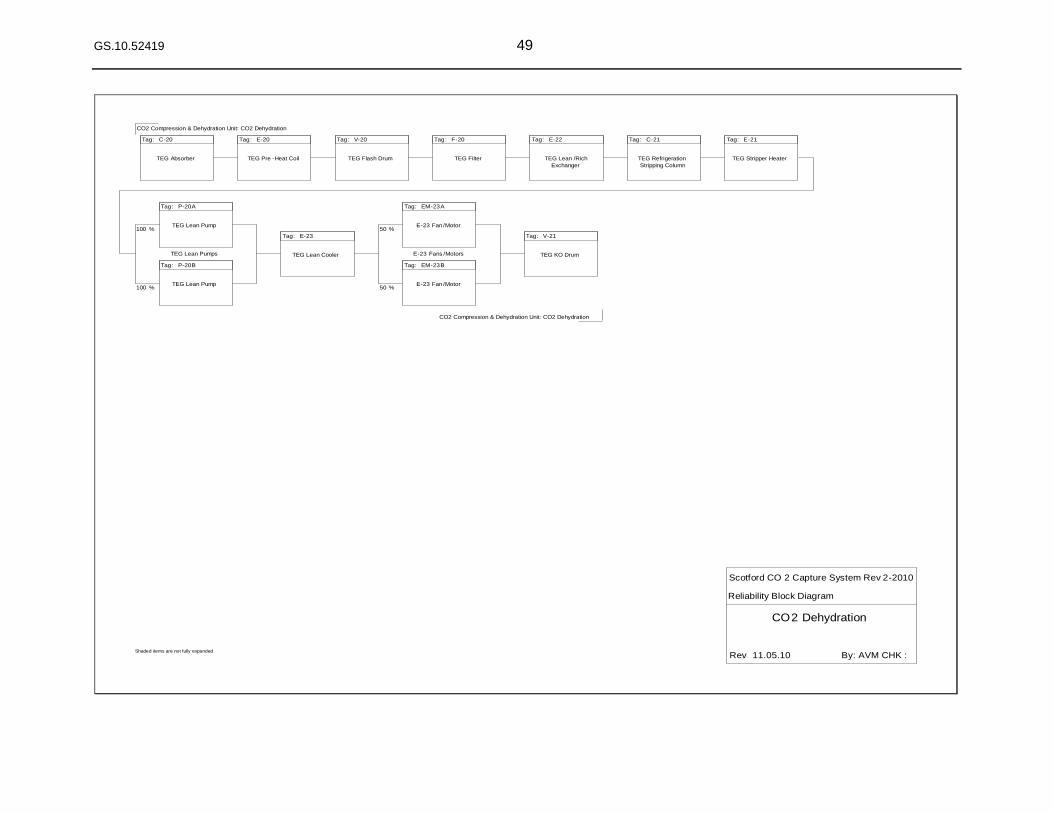
GS.10.52419 49
TEG Absorber
Tag: C-20
CO2 Compression & Dehydration Unit: CO2 Dehydration
TEG Pre -Heat Coil
Tag: E-20
TEG Flash Drum
Tag: V-20
TEG Filter
Tag: F-20
TEG Lean /Rich
Exchanger
Tag: E-22
TEG Refrigeration
Stripping Column
Tag: C-21
TEG Stripper Heater
Tag: E-21
TEG Lean Pump
Tag: P-20A
TEG Lean Pump
Tag: P-20B
TEG Lean Pumps
100 %
100 %
TEG Lean Cooler
Tag: E-23
E-23 Fan/Motor
Tag: EM-23A
E-23 Fan/Motor
Tag: EM-23B
E-23 Fans /Motors
50 %
50 %
TEG KO Drum
Tag: V-21
CO2 Compression & Dehydration Unit: CO2 Dehydration
Scotford CO 2 Capture System Rev 2-2010
CO2 Dehydration
Rev 11.05.10 By: AVM CHK :
Reliability Block Diagram
Shaded items are not fully expanded
GS.10.52419 50
Bibliographic Information
This report has been classified as Confidential and is subject to US Export Control regulations and has been classified as ECCN EAR 99.
Report Number : GS.10.52419
Title : Quest CCS Project RAM Study – Final Report
Author(s) : R.M. Stephens PTE/AOEX
Verified by : C.E. White PTE/EOEX
Approved by : R.W. Daniel PTE/AOEX
Content Owner : R.M. Stephens PTE/AOEX
Issue Date : September 2010
Activity Code : ZZPT/006964/01
Sponsor : Jeffrey Leontowich
Keywords : reliability modeling, reliability, availability, maintainability, capacity utilization
Electronic file : GS.10.52419.pdf
Issuing Company : Shell Global Solutions (US) Inc. Westhollow Technology Center, P.O. Box 4327, Houston, TX 77210, USA. Tel. +1 281 544 8844
GS.10.52419 51
Report distribution
Outside Shell Global Solutions
Company name and address
J. Leontowich, SCAN-PTM/APCA, CAL-SC SC-1570B E
S. Peplinski, SCAN-PTM/APCA, CAL-SC SC-1572B E
Within Shell Global Solutions
Name Ref. Ind. Location
R.M. Stephens PTE/AOEX HOU-WTC MF 150 E
C.E. White PTE/EOEX RIJ-KES Ak-446AA E
R.W. Daniel PTE/AOEX HOU-WTC MF-150 E
This report can be freely shared with all Shell Global Solutions employees.