Embed Size (px)
Citation preview
Relevant • Independent • Objectivewww.ceri.ca1
Exports of LNG and LPG’sWhy Now?
Canadian Energy Research Institute
Peter HowardCanadian Energy Research Institute
April, 2014
Relevant • Independent • Objectivewww.ceri.ca2
Canadian Energy Research InstituteUpcoming Study Releases
Natural Gas Liquids (NGLs) in North America: An UpdatePart I – UpstreamForthcoming April 2014
Natural Gas Liquids (NGLs) in North America: An UpdatePart II – Midstream and Downstream InfrastructureForthcoming April 2014
Natural Gas Liquids (NGLs) in North America: An UpdatePart III – Market FundamentalsForthcoming April 2014
Relevant • Independent • Objectivewww.ceri.ca3
Canadian Energy Research InstituteUpcoming Study Releases
Natural Gas Liquids (NGLs) in North America: An UpdatePart IV – Global Markets and OpportunitiesForthcoming April 2014
Natural Gas Liquids (NGLs) in North America: An UpdatePart V – Future OutlookForthcoming May 2014
An Economic Analysis of TransCanada’s Energy East Pipeline ProjectForthcoming April 2014
Relevant • Independent • Objectivewww.ceri.ca4
Canadian Energy Research InstituteUpcoming Study Releases
Oil PathwaysForthcoming May 2014
Canadian Oil Sands Supply Costs and Development Projects (2013-2047)Forthcoming May 2014
Relevant • Independent • Objectivewww.ceri.ca5
The Story Starts Here!
North American Natural Gas Market (2013-2030)
Relevant • Independent • Objectivewww.ceri.ca6
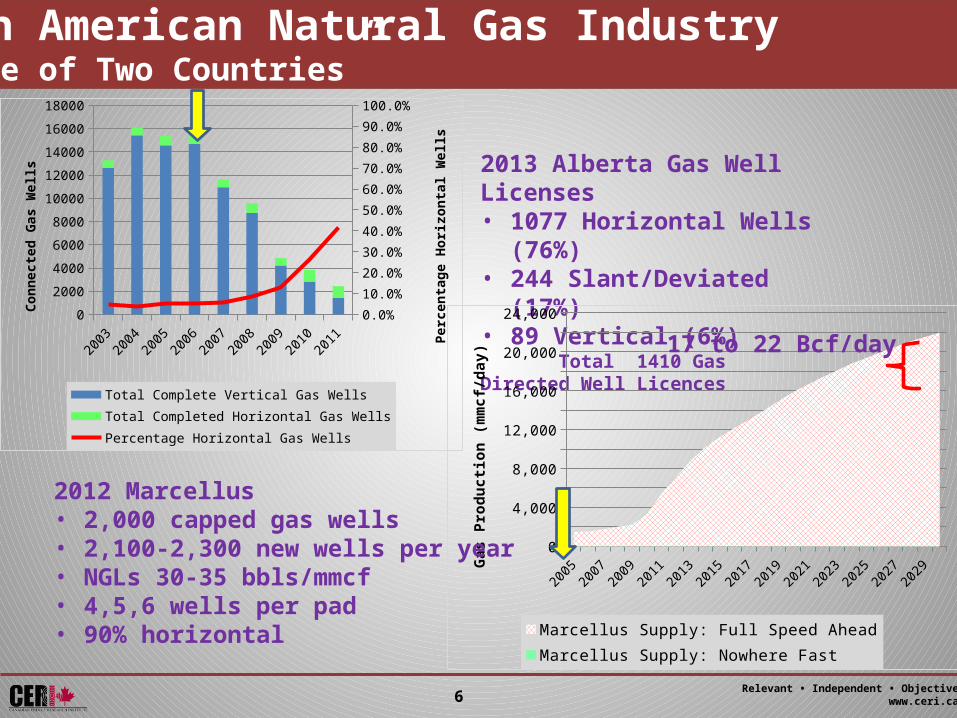
North American Natural Gas Industry “A Tale of Two Countries”
2003 2004 2005 2006 2007 2008 2009 2010 20110
2000
4000
6000
8000
10000
12000
14000
16000
18000
0.0%
10.0%
20.0%
30.0%
40.0%
50.0%
60.0%
70.0%
80.0%
90.0%
100.0%
Total Complete Vertical Gas WellsTotal Completed Horizontal Gas WellsPercentage Horizontal Gas Wells
Conn
ecte
d Ga
s Wel
ls
Perc
enta
ge H
orizo
ntal
Wel
ls 2013 Alberta Gas Well Licenses• 1077 Horizontal Wells (76%)• 244 Slant/Deviated (17%)• 89 Vertical (6%) Total 1410 Gas Directed Well Licences
20052007
20092011
20132015
20172019
20212023
20252027
20290
2,0004,0006,0008,000
10,00012,00014,00016,00018,00020,00022,00024,000
Marcellus Supply: Full Speed AheadMarcellus Supply: Nowhere Fast
Gas
Pro
ducti
on (m
mcf
/day
)2012 Marcellus• 2,000 capped gas wells• 2,100-2,300 new wells per year• NGLs 30-35 bbls/mmcf• 4,5,6 wells per pad• 90% horizontal
17 to 22 Bcf/day
Relevant • Independent • Objectivewww.ceri.ca7
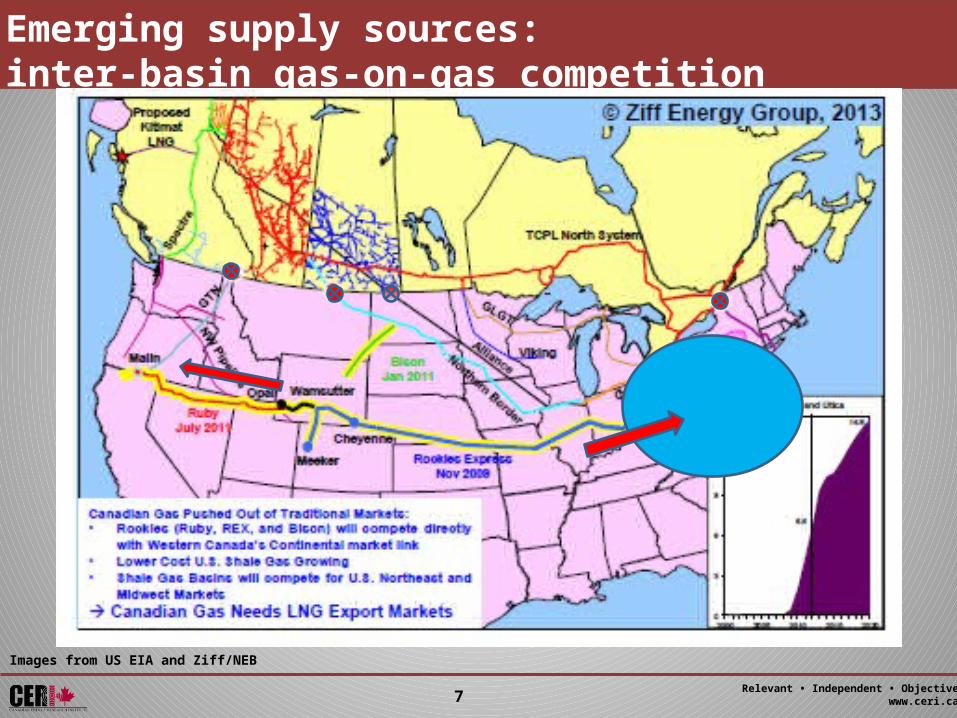
Emerging supply sources: inter-basin gas-on-gas competition
Images from US EIA and Ziff/NEB
Relevant • Independent • Objectivewww.ceri.ca8
20102011
20122013
20142015
20162017
20182019
20202021
20222023
20242025
20262027
20282029
20300
1,000
2,000
3,000
4,000
5,000
6,000
7,000
8,000
9,000
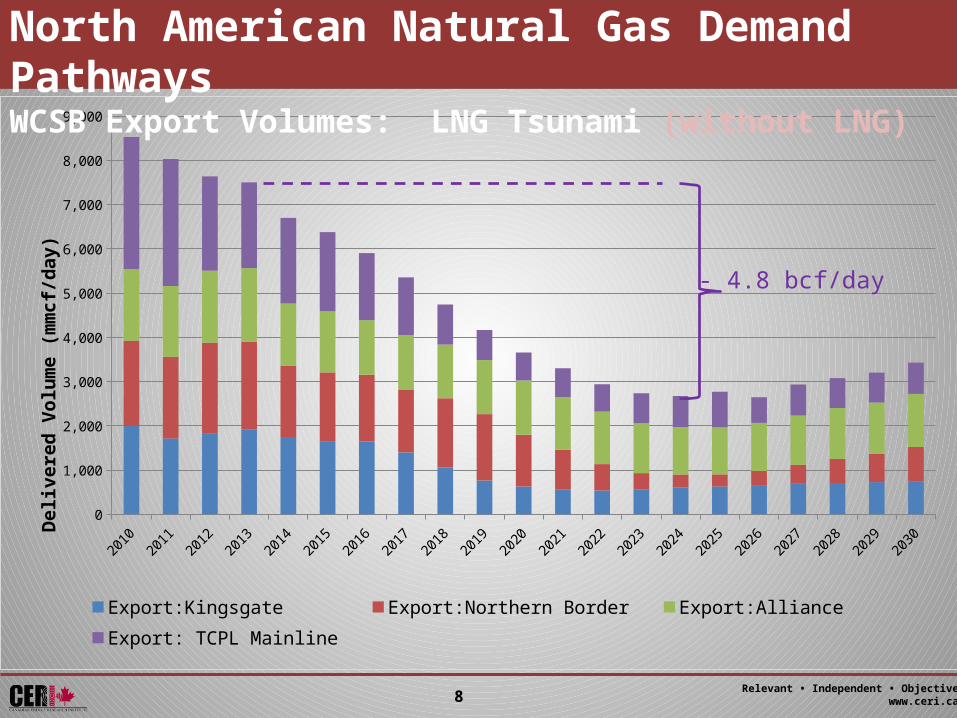
Export:Kingsgate Export:Northern Border Export:Alliance Export: TCPL Mainline
Del
iver
ed V
olum
e (m
mcf
/day
)North American Natural Gas Demand PathwaysWCSB Export Volumes: LNG Tsunami (without LNG)
- 4.8 bcf/day
Relevant • Independent • Objectivewww.ceri.ca9
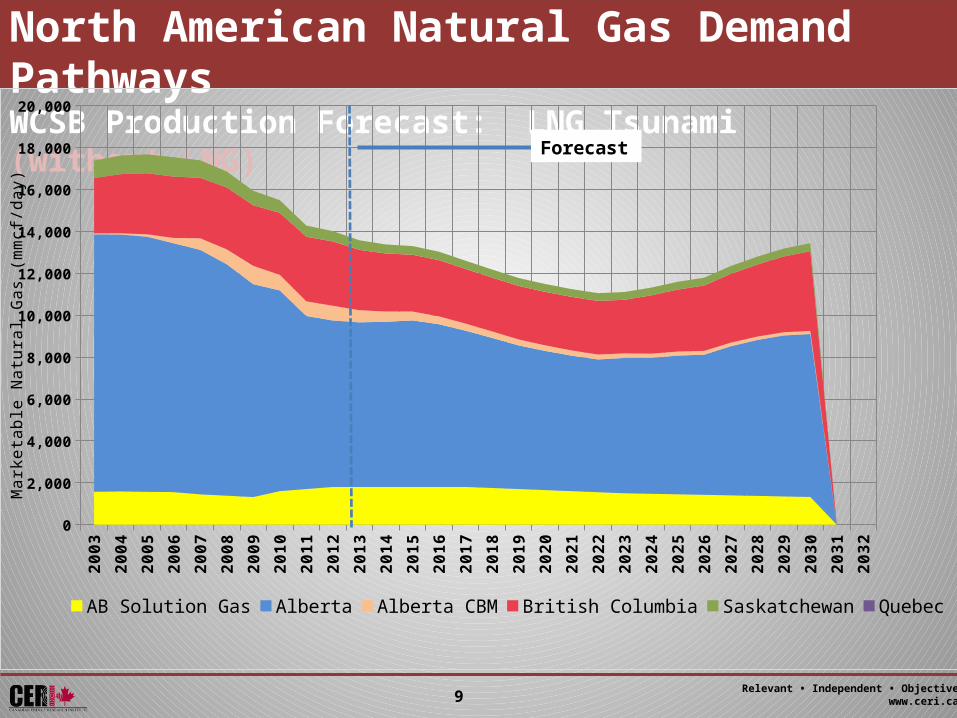
North American Natural Gas Demand PathwaysWCSB Production Forecast: LNG Tsunami (without LNG)
2003
2004
2005
2006
2007
2008
2009
2010
2011
2012
2013
2014
2015
2016
2017
2018
2019
2020
2021
2022
2023
2024
2025
2026
2027
2028
2029
2030
2031
2032
0
2,000
4,000
6,000
8,000
10,000
12,000
14,000
16,000
18,000
20,000
AB Solution Gas Alberta Alberta CBM British Columbia Saskatchewan Quebec
Mar
keta
ble
Nat
ural
Gas
(mm
cf/d
ay)
Forecast
Relevant • Independent • Objectivewww.ceri.ca10
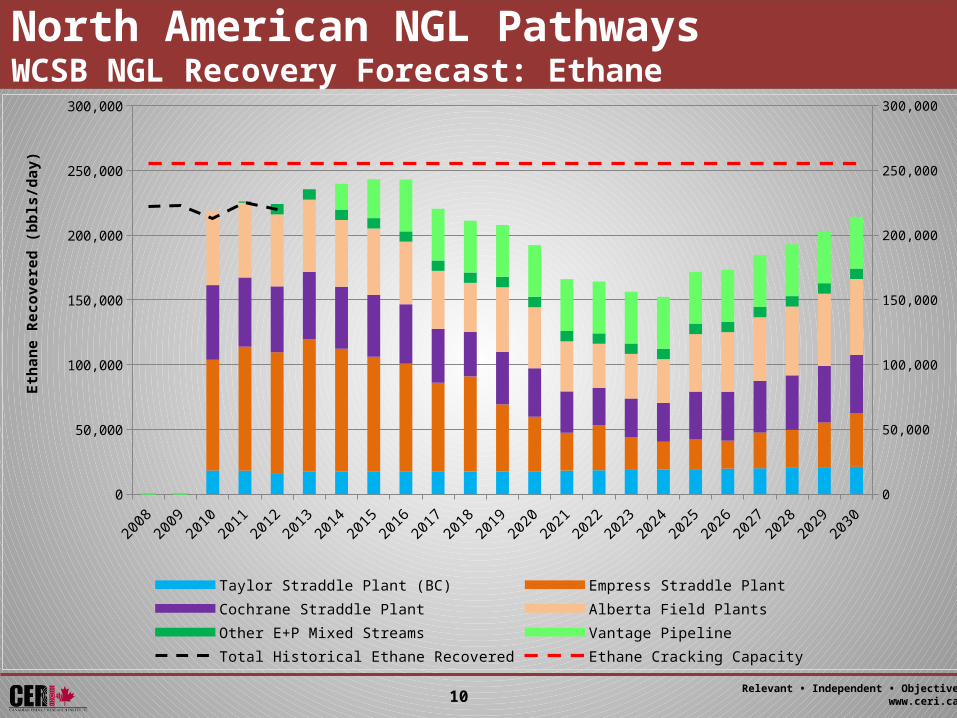
North American NGL PathwaysWCSB NGL Recovery Forecast: Ethane
2008 2009 2010 2011 2012 2013 2014 2015 2016 2017 2018 2019 2020 2021 2022 2023 2024 2025 2026 2027 2028 2029 20300
50,000
100,000
150,000
200,000
250,000
300,000
0
50,000
100,000
150,000
200,000
250,000
300,000
Taylor Straddle Plant (BC) Empress Straddle Plant Cochrane Straddle PlantAlberta Field Plants Other E+P Mixed Streams Vantage PipelineTotal Historical Ethane Recovered Ethane Cracking Capacity
Etha
ne R
ecov
ered
(bbl
s/da
y)
Relevant • Independent • Objectivewww.ceri.ca11
Global Competition for theAsia-Pacific Market
Relevant • Independent • Objectivewww.ceri.ca12
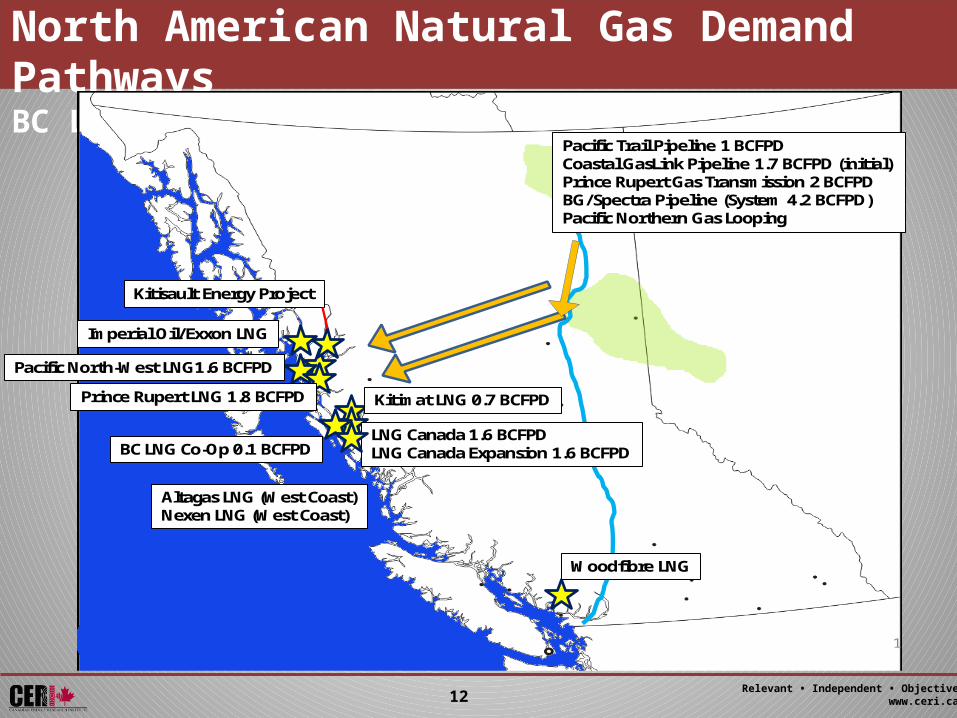
NE British Columbia versus
NW Alberta
1
Kitimat LNG 0.7 BCFPD
LNG Canada 1.6 BCFPDLNG Canada Expansion 1.6 BCFPDBC LNG Co-Op 0.1 BCFPD
Prince Rupert LNG 1.8 BCFPD
Pacific North-West LNG1.6 BCFPD
Kitisault Energy Project
Woodfibre LNG
Imperial Oil/Exxon LNG
Altagas LNG (West Coast)Nexen LNG (West Coast)
Pacific Trail Pipeline 1 BCFPDCoastal GasLink Pipeline 1.7 BCFPD (initial)Prince Rupert Gas Transmission 2 BCFPDBG/Spectra Pipeline (System 4.2 BCFPD)Pacific Northern Gas Looping
North American Natural Gas Demand PathwaysBC LNG Projects
Relevant • Independent • Objectivewww.ceri.ca13
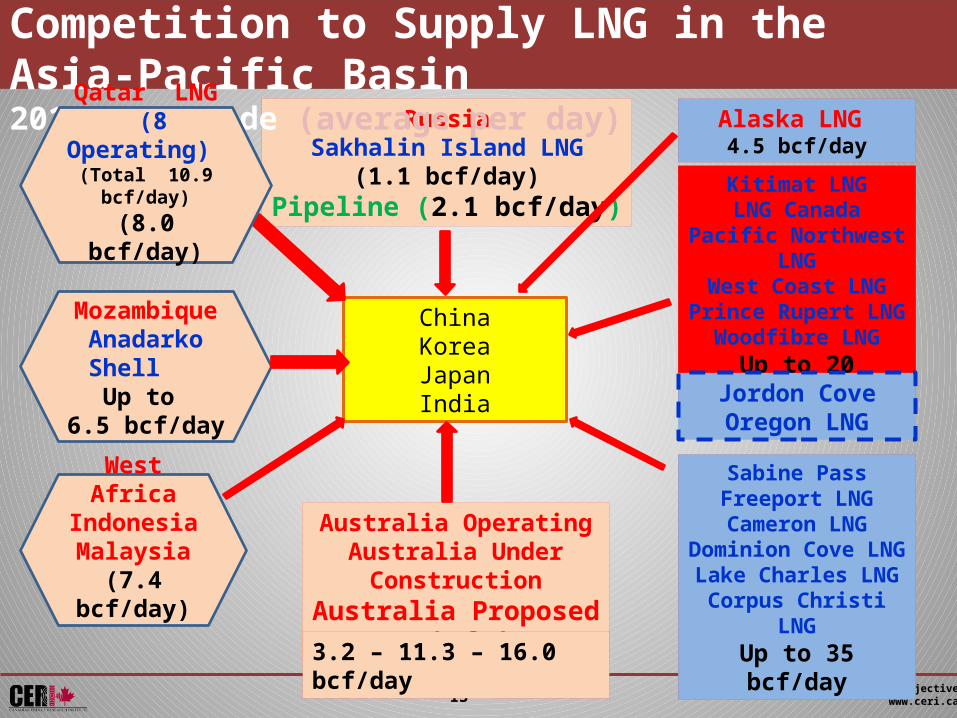
ChinaKoreaJapanIndia
Alaska LNG 4.5 bcf/day
Kitimat LNGLNG Canada
Pacific Northwest LNGWest Coast LNG
Prince Rupert LNGWoodfibre LNG
Up to 20 bcf/day
Jordon CoveOregon LNG
Sabine PassFreeport LNGCameron LNG
Dominion Cove LNGLake Charles LNG
Corpus Christi LNGUp to 35 bcf/day
Australia OperatingAustralia Under Construction
Australia Proposed(2.5 bcf/day)
RussiaSakhalin Island LNG
(1.1 bcf/day)Pipeline (2.1 bcf/day)
Competition to Supply LNG in the Asia-Pacific Basin2012 LNG Trade (average per day)
Qatar LNG (8 Operating)
(Total 10.9 bcf/day)(8.0 bcf/day)
MozambiqueAnadarko
Shell Up to
6.5 bcf/day
West AfricaIndonesiaMalaysia
(7.4 bcf/day)
3.2 – 11.3 – 16.0 bcf/day
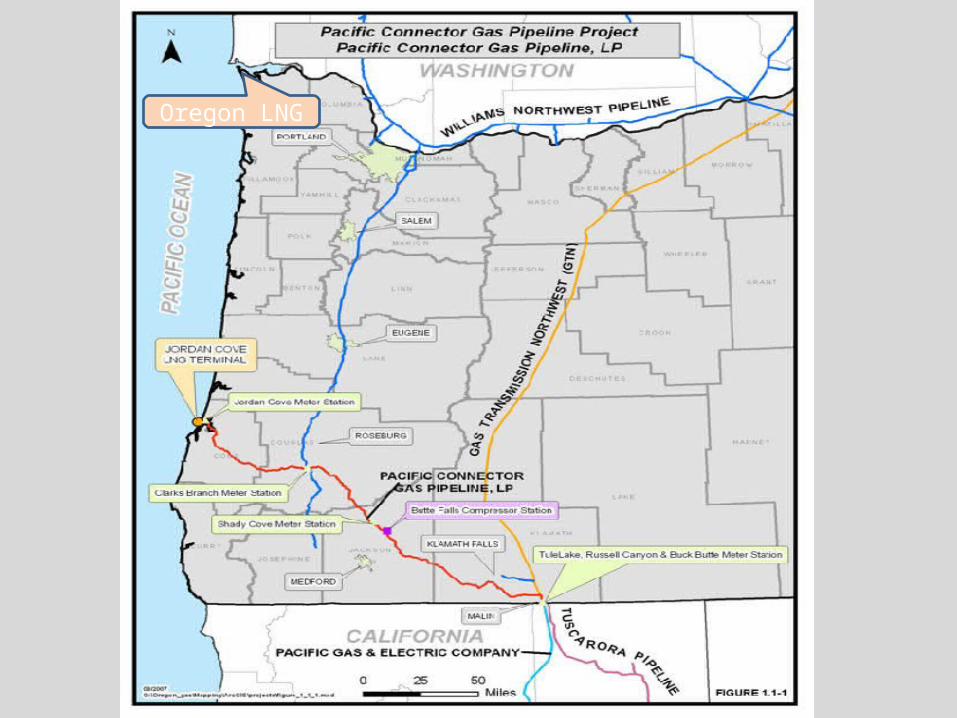
Oregon LNG
Relevant • Independent • Objectivewww.ceri.ca15
How Competitive is Western Canada?
Relevant • Independent • Objectivewww.ceri.ca16
Economic Viability of Gas Developments in the WCSBA Supply Cost Comparison
• The Supply Cost value represents the natural gas price that is required to cover all costs (capital, operating, royalties and taxes) and earn a minimum return on investment (10 percent real).
• The Supply Cost calculation includes the uplift value of producing, capturing and selling natural gas liquids in concert with natural gas production.
Relevant • Independent • Objectivewww.ceri.ca17
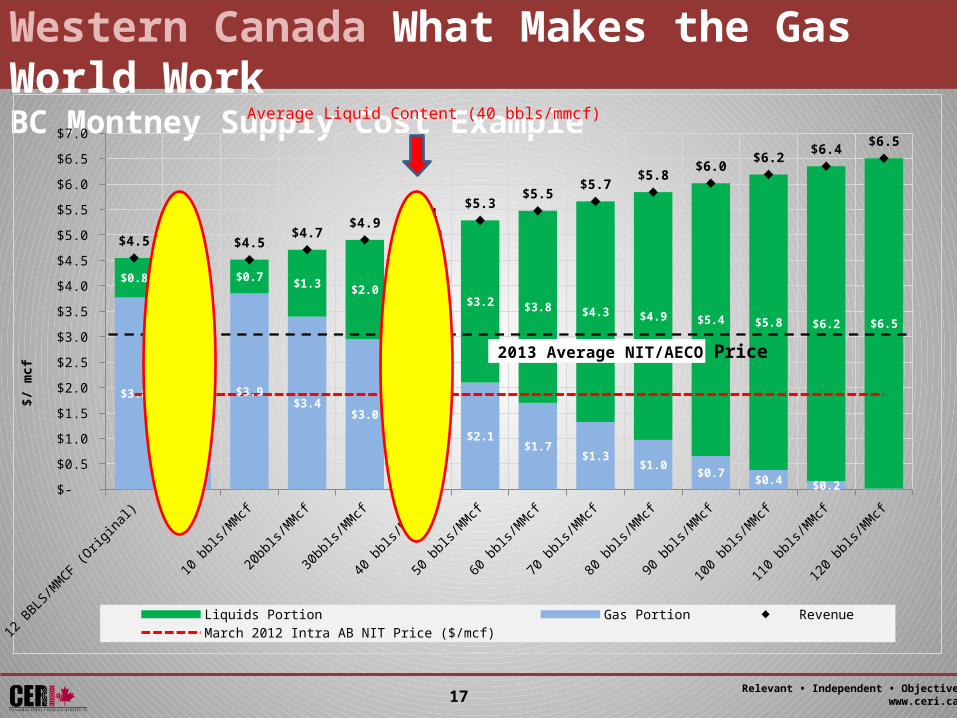
Western Canada What Makes the Gas World WorkBC Montney Supply Cost Example
12 BBLS/MMCF
(Original)
DRY 10 bbls/MMcf
20bbls/MMcf
30bbls/MMcf
40 bbls/MMcf
50 bbls/MMcf
60 bbls/MMcf
70 bbls/MMcf
80 bbls/MMcf
90 bbls/MMcf
100 bbls/MMcf
110 bbls/MMcf
120 bbls/MMcf
$-
$0.5
$1.0
$1.5
$2.0
$2.5
$3.0
$3.5
$4.0
$4.5
$5.0
$5.5
$6.0
$6.5
$7.0
$3.8 $3.8 $3.9 $3.4
$3.0 $2.5
$2.1 $1.7
$1.3 $1.0
$0.7 $0.4 $0.2
$0.8
$-
$0.7 $1.3 $2.0 $2.6 $3.2 $3.8 $4.3 $4.9 $5.4 $5.8 $6.2 $6.5
$4.5
$3.8
$4.5 $4.7
$4.9 $5.1
$5.3 $5.5
$5.7 $5.8
$6.0 $6.2
$6.4 $6.5
Liquids Portion Gas Portion Revenue March 2012 Intra AB NIT Price ($/mcf)
$/ m
cf
2013 Average NIT/AECO Price
Average Liquid Content (40 bbls/mmcf)
Relevant • Independent • Objectivewww.ceri.ca18
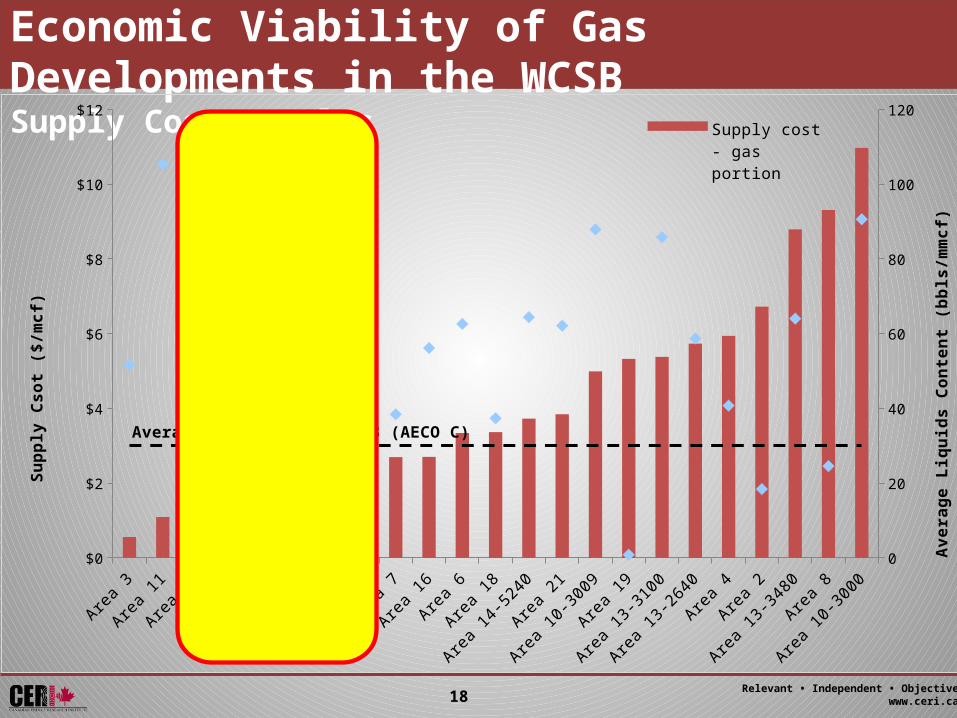
Economic Viability of Gas Developments in the WCSBSupply Cost Results
Area 3
Area 11
Area 10
Area 13
Area 9
Area 15
Area 14
Area 34-F5
000
Area 7
Area 16
Area 6
Area 18
Area 14-5240
Area 21
Area 10-3009
Area 19
Area 13-3100
Area 13-2640
Area 4
Area 2
Area 13-3480
Area 8
Area 10-3000
$0
$2
$4
$6
$8
$10
$12
0
20
40
60
80
100
120Supply cost - gas portionLiquid content (bbls/mmcf)
Supp
ly C
sot
($/m
cf)
Ave
rage
Liq
uids
Con
tent
(bbl
s/m
mcf
)
Average Market Price 2013 (AECO C)
Relevant • Independent • Objectivewww.ceri.ca19
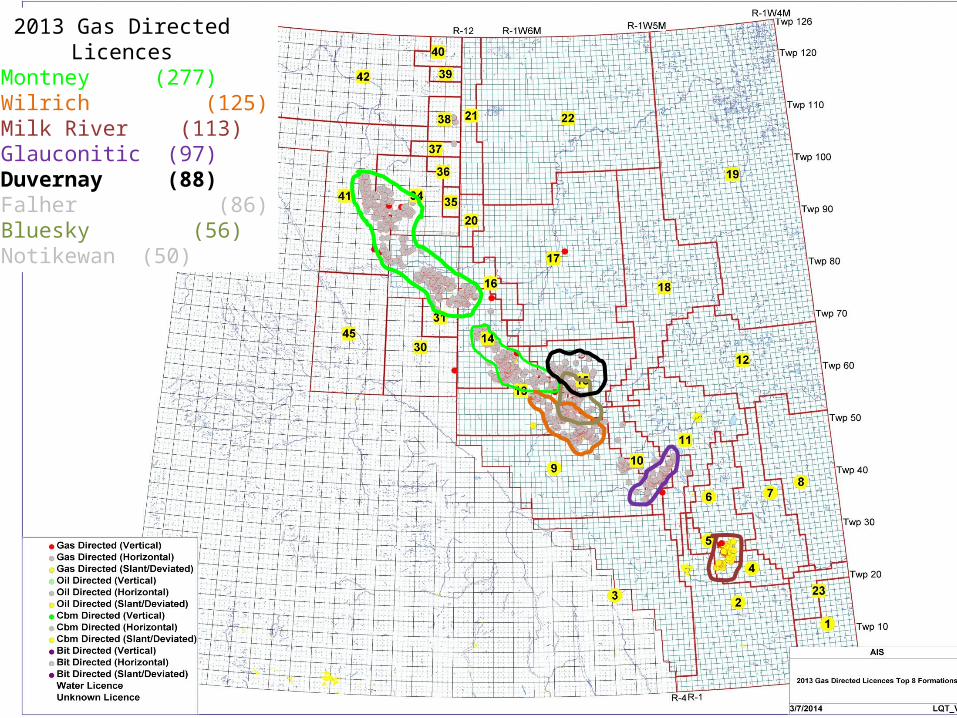
2013 Gas DirectedLicences
1 Montney (277)2 Wilrich (125)3 Milk River (113)4 Glauconitic (97)5 Duvernay (88)6 Falher (86)7 Bluesky (56)8 Notikewan (50)
Relevant • Independent • Objectivewww.ceri.ca20
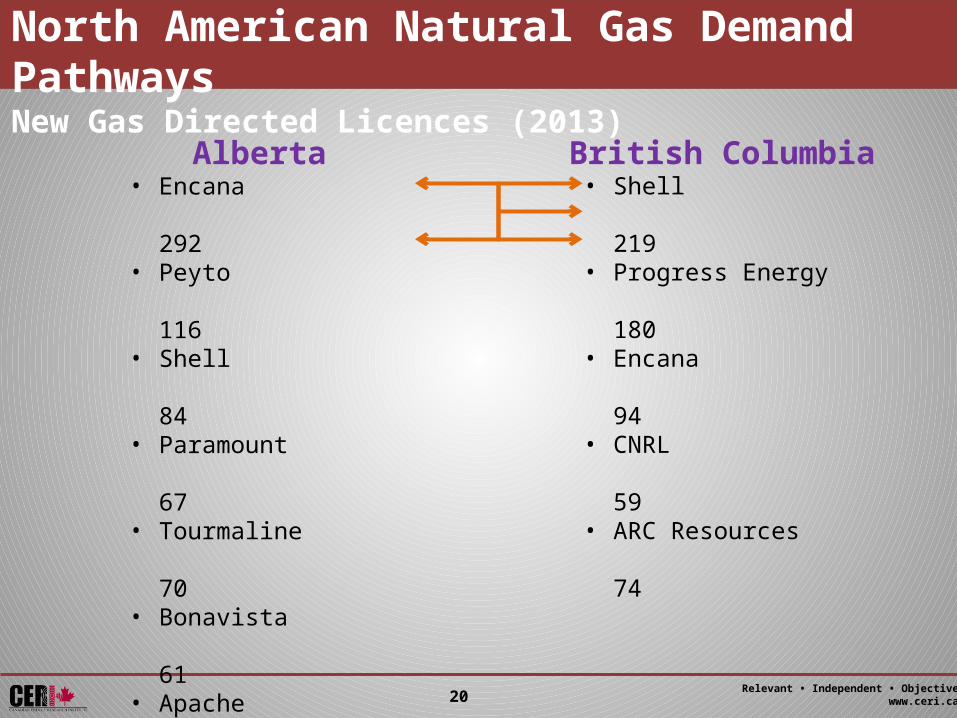
Alberta• Encana
292• Peyto
116• Shell
84• Paramount
67• Tourmaline
70• Bonavista
61• Apache
48• Husky
43• Seven Generations
44
• 9 producers 825• 60% of total licences
• Total Gas Licences (AB) 1410
British Columbia• Shell
219• Progress Energy
180• Encana
94• CNRL
59• ARC Resources
74
• 5 producers 626• 70% of total licences
• Total Licences (BC) 901
North American Natural Gas Demand PathwaysNew Gas Directed Licences (2013)
Relevant • Independent • Objectivewww.ceri.ca21
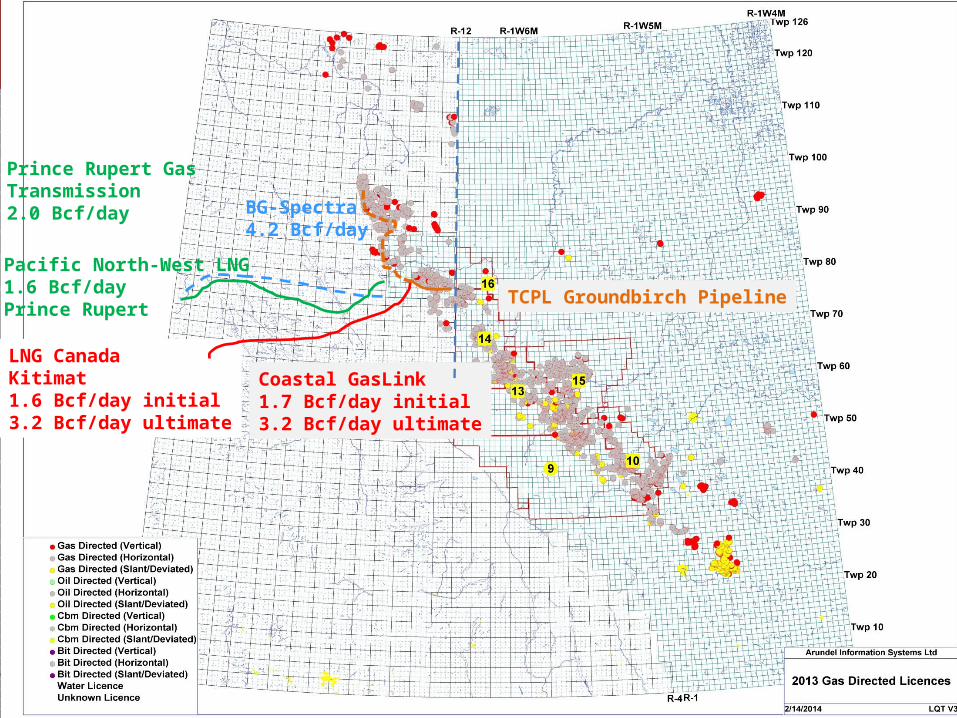
Coastal GasLink1.7 Bcf/day initial3.2 Bcf/day ultimate
LNG CanadaKitimat1.6 Bcf/day initial3.2 Bcf/day ultimate
Prince Rupert GasTransmission2.0 Bcf/day
Pacific North-West LNG1.6 Bcf/dayPrince Rupert
TCPL Groundbirch Pipeline
BG-Spectra4.2 Bcf/day
Relevant • Independent • Objectivewww.ceri.ca22
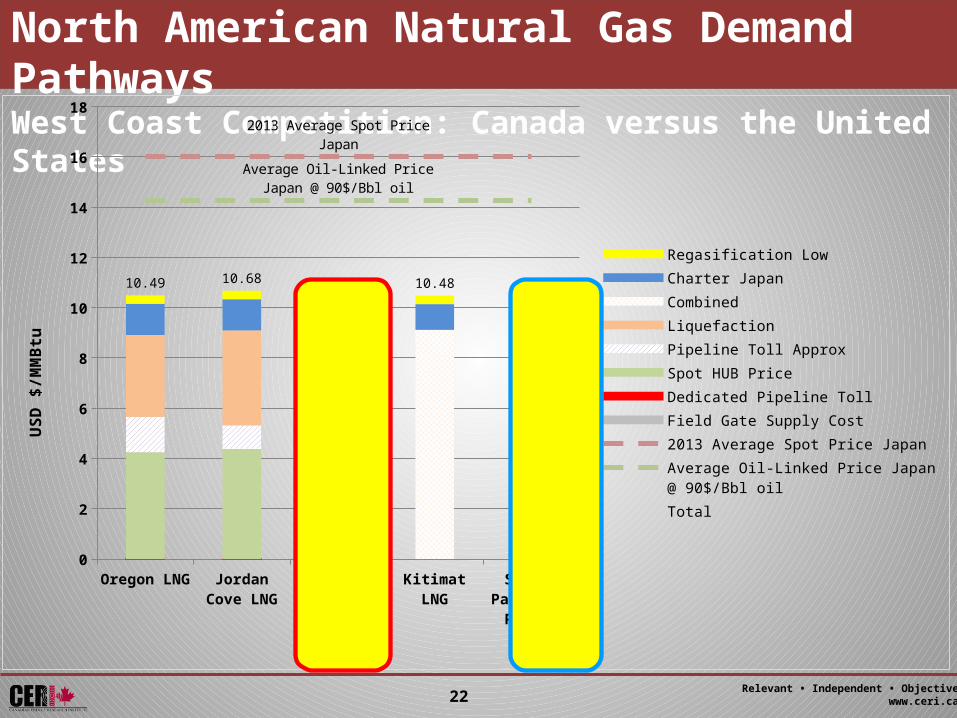
North American Natural Gas Demand PathwaysWest Coast Competition: Canada versus the United States
Oregon LNG Jordan Cove LNG
Canada LNG Kitimat LNG Sabine Pass with Panama
Canal
0
2
4
6
8
10
12
14
16
18
2013 Average Spot Price Japan
Average Oil-Linked Price Japan @ 90$/Bbl oil
10.49 10.68
9.8810.48
9.39
Regasification LowCharter JapanCombinedLiquefaction Pipeline Toll ApproxSpot HUB PriceDedicated Pipeline TollField Gate Supply Cost2013 Average Spot Price JapanAverage Oil-Linked Price Japan @ 90$/Bbl oilTotal
USD
$/M
MBt
u
Relevant • Independent • Objectivewww.ceri.ca23
Producer Optionality?
Relevant • Independent • Objectivewww.ceri.ca24
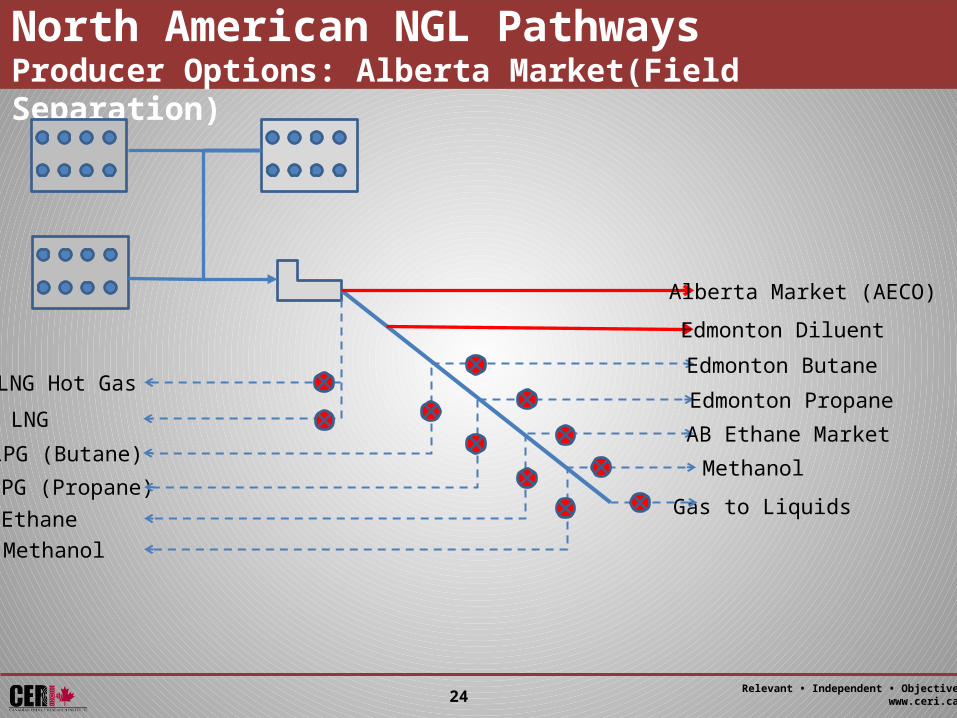
North American NGL PathwaysProducer Options: Alberta Market(Field Separation)
Alberta Market (AECO)
Edmonton Diluent
Edmonton Butane
Edmonton Propane
AB Ethane Market
Gas to Liquids
Methanol
LNG Hot Gas
LNG
LPG (Butane)
LPG (Propane)EthaneMethanol

Relevant • Independent • Objectivewww.ceri.ca25
North American NGL PathwaysProducer Options: Alberta Market(Field Shallow cut plant)
Alberta Market (AECO)
Edmonton Diluent
Edmonton Butane
Edmonton Propane
AB Ethane Market
Gas to Liquids
Methanol
LNG Hot Gas
LNG
LPG (Butane)
LPG (Propane)EthaneMethanol
Relevant • Independent • Objectivewww.ceri.ca26
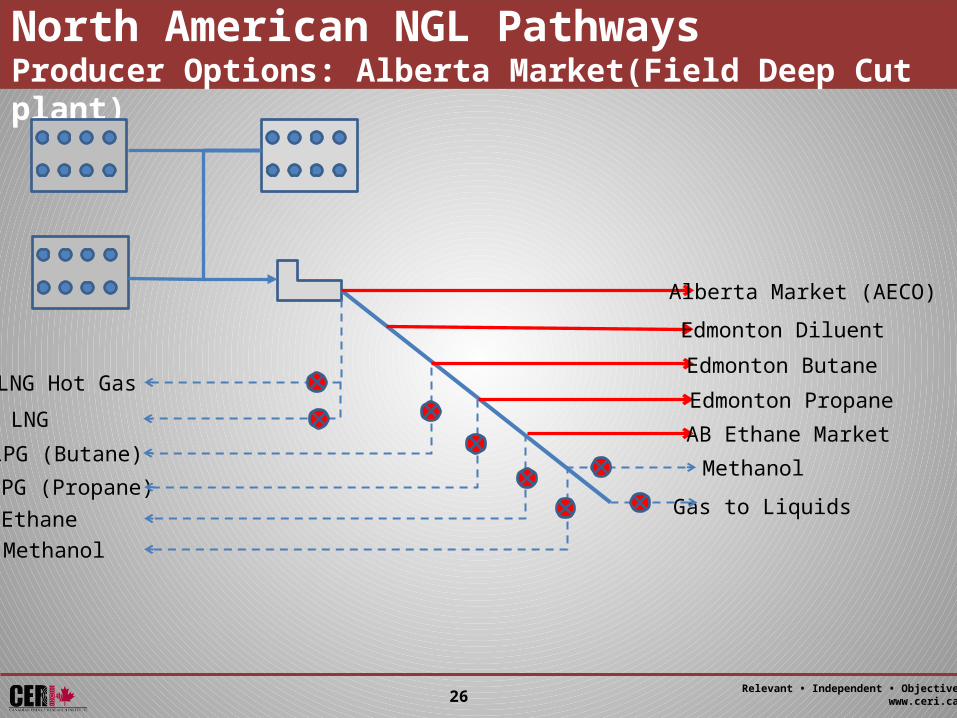
North American NGL PathwaysProducer Options: Alberta Market(Field Deep Cut plant)
Alberta Market (AECO)
Edmonton Diluent
Edmonton Butane
Edmonton Propane
AB Ethane Market
Gas to Liquids
Methanol
LNG Hot Gas
LNG
LPG (Butane)
LPG (Propane)EthaneMethanol
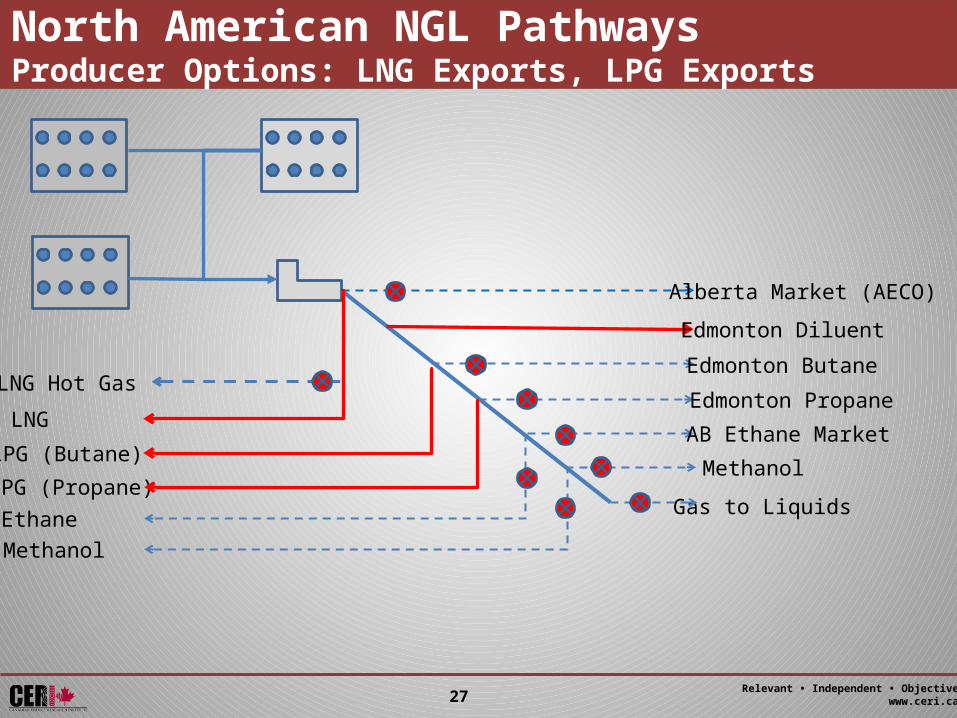
Relevant • Independent • Objectivewww.ceri.ca27
North American NGL PathwaysProducer Options: LNG Exports, LPG Exports
Alberta Market (AECO)
Edmonton Diluent
Edmonton Butane
Edmonton Propane
AB Ethane Market
Gas to Liquids
Methanol
LNG Hot Gas
LNG
LPG (Butane)
LPG (Propane)EthaneMethanol
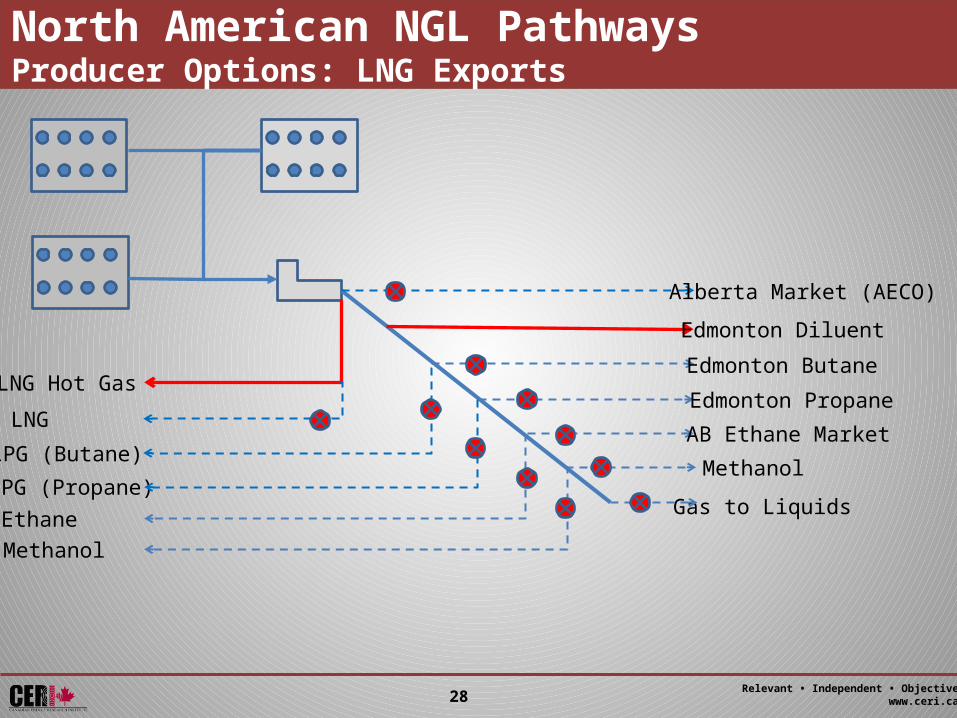
Relevant • Independent • Objectivewww.ceri.ca28
North American NGL PathwaysProducer Options: LNG Exports
Alberta Market (AECO)
Edmonton Diluent
Edmonton Butane
Edmonton Propane
AB Ethane Market
Gas to Liquids
Methanol
LNG Hot Gas
LNG
LPG (Butane)
LPG (Propane)EthaneMethanol
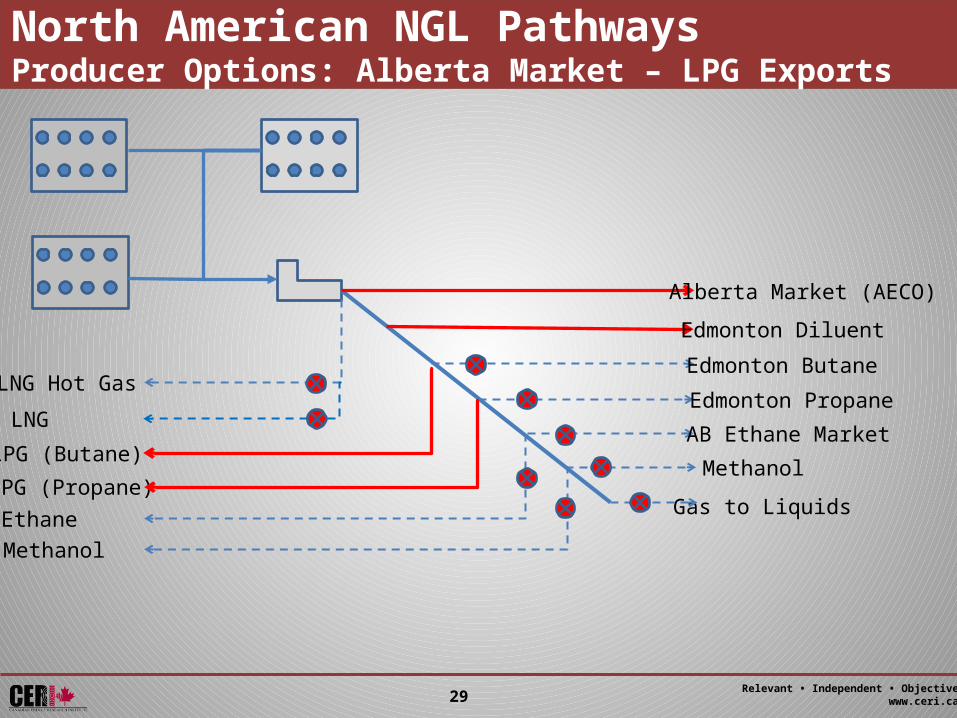
Relevant • Independent • Objectivewww.ceri.ca29
North American NGL PathwaysProducer Options: Alberta Market – LPG Exports
Alberta Market (AECO)
Edmonton Diluent
Edmonton Butane
Edmonton Propane
AB Ethane Market
Gas to Liquids
Methanol
LNG Hot Gas
LNG
LPG (Butane)
LPG (Propane)EthaneMethanol
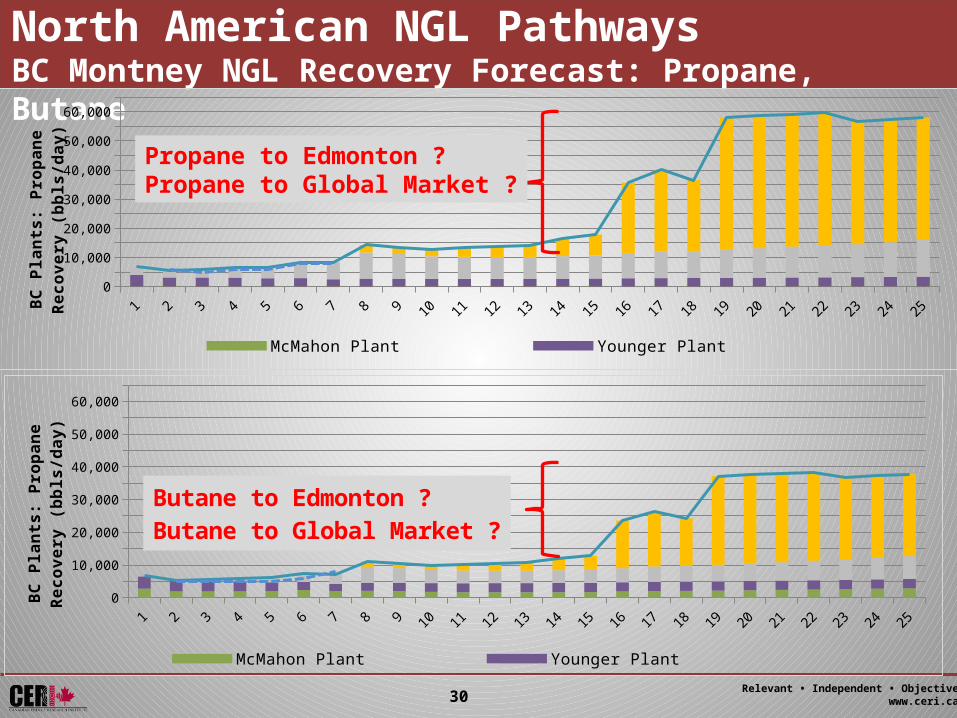
Relevant • Independent • Objectivewww.ceri.ca30
North American NGL PathwaysBC Montney NGL Recovery Forecast: Propane, Butane
1 2 3 4 5 6 7 8 9 10 11 12 13 14 15 16 17 18 19 20 21 22 23 24 250
5,00010,00015,00020,00025,00030,00035,00040,00045,00050,00055,00060,00065,000
McMahon Plant Younger Plant Other Plants Shell LNG SupplyProgress LNG Supply Total Propane Recovery Historical
BC P
lant
s: P
ropa
ne R
ecov
ery
(bbl
s/da
y)
1 2 3 4 5 6 7 8 9 10 11 12 13 14 15 16 17 18 19 20 21 22 23 24 250
5,00010,00015,00020,00025,00030,00035,00040,00045,00050,00055,00060,00065,000
McMahon Plant Younger Plant Other PlantsShell LNG Supply Progress LNG Supply Total Butane Recovery
BC P
lant
s: P
ropa
ne R
ecov
ery
(bbl
s/da
y) Butane to Edmonton ?Butane to Global Market ?
Propane to Edmonton ?Propane to Global Market ?
Relevant • Independent • Objectivewww.ceri.ca31
Let the Games Begin?
Relevant • Independent • Objectivewww.ceri.ca32
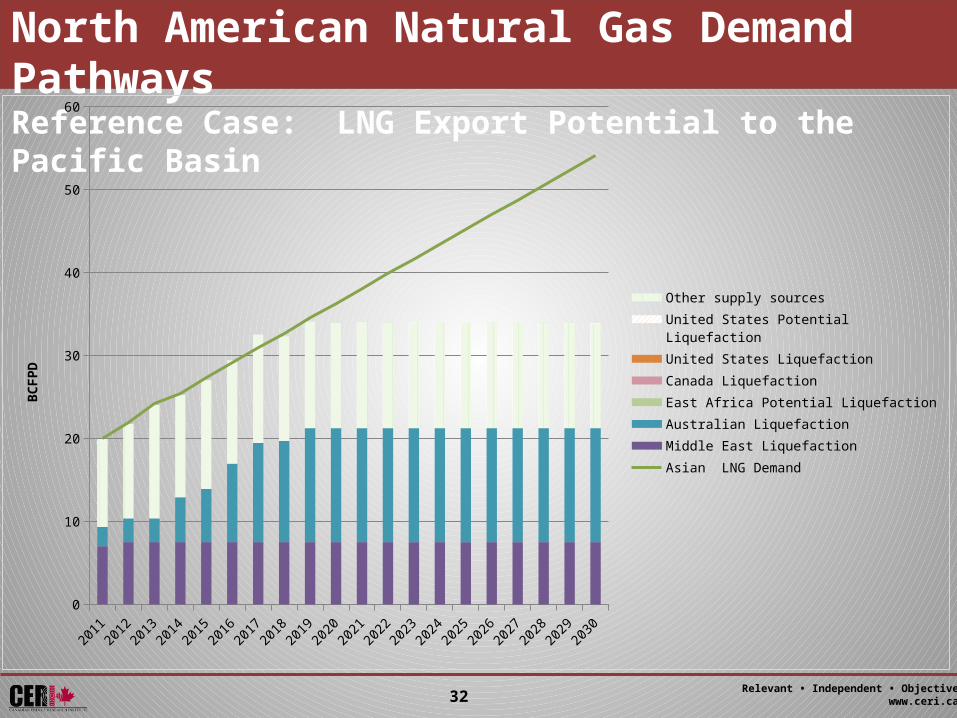
North American Natural Gas Demand PathwaysReference Case: LNG Export Potential to the Pacific Basin
2011 2012 2013 2014 2015 2016 2017 2018 2019 2020 2021 2022 2023 2024 2025 2026 2027 2028 2029 20300
10
20
30
40
50
60
Other supply sourcesUnited States Potential LiquefactionUnited States LiquefactionCanada LiquefactionEast Africa Potential LiquefactionAustralian LiquefactionMiddle East Liquefaction Asian LNG Demand
BCFP
D
Relevant • Independent • Objectivewww.ceri.ca33
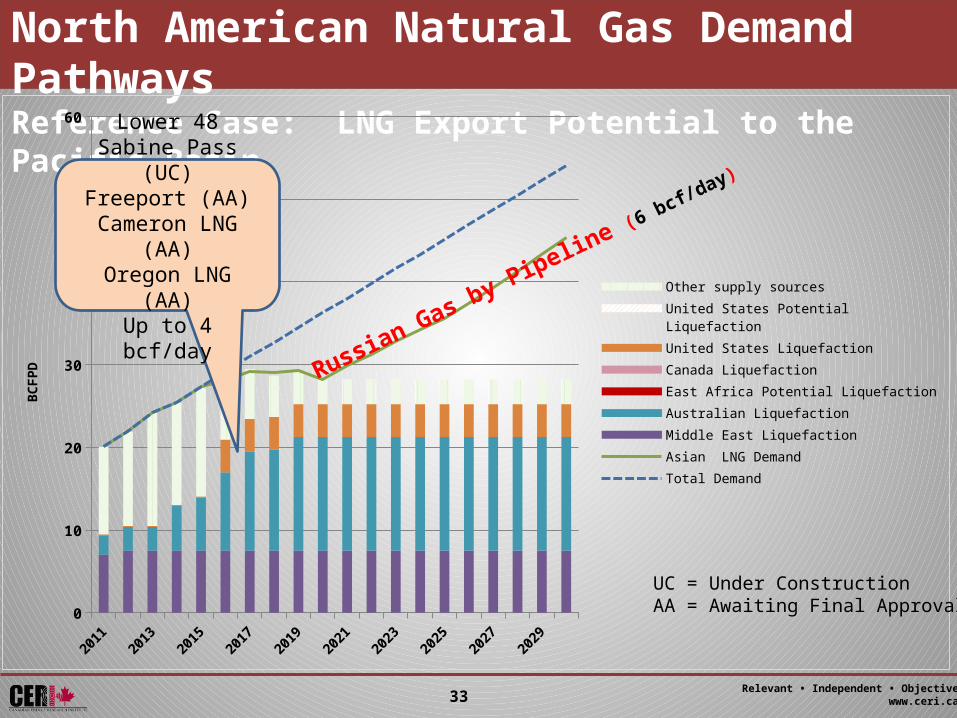
North American Natural Gas Demand PathwaysReference Case: LNG Export Potential to the Pacific Basin
20112012
20132014
20152016
20172018
20192020
20212022
20232024
20252026
20272028
20292030
0
10
20
30
40
50
60
Other supply sourcesUnited States Potential LiquefactionUnited States LiquefactionCanada LiquefactionEast Africa Potential LiquefactionAustralian LiquefactionMiddle East Liquefaction Asian LNG DemandTotal Demand
BCFP
D
Russian Gas by Pipeline (6 bcf/day)
Lower 48Sabine Pass (UC)
Freeport (AA)Cameron LNG (AA)Oregon LNG (AA)Up to 4 bcf/day
UC = Under ConstructionAA = Awaiting Final Approvals
Relevant • Independent • Objectivewww.ceri.ca34
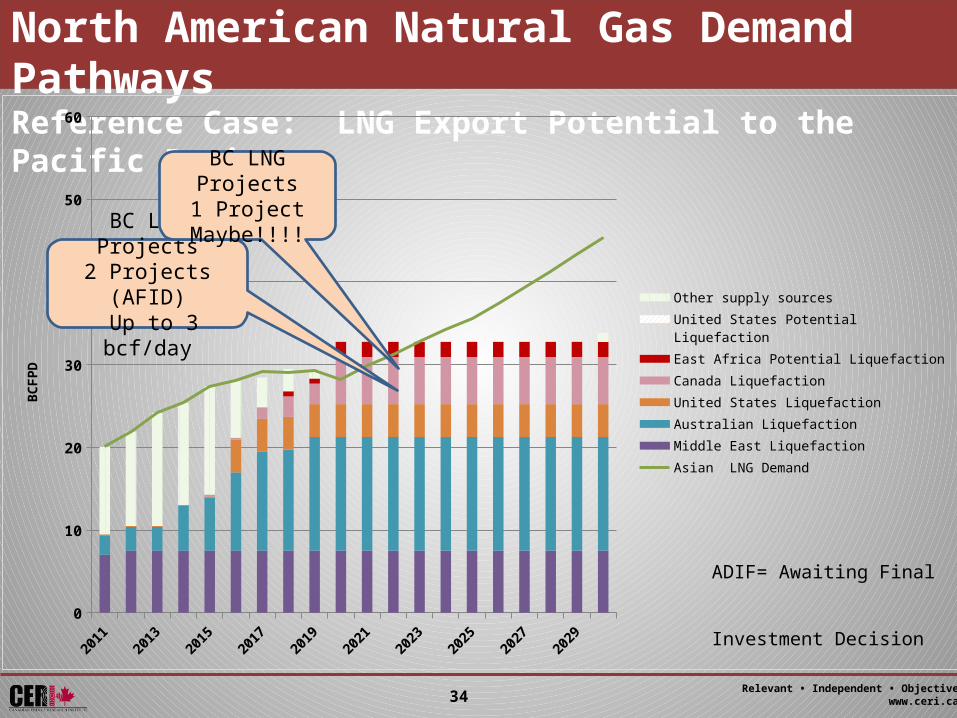
North American Natural Gas Demand PathwaysReference Case: LNG Export Potential to the Pacific Basin
20112012
20132014
20152016
20172018
20192020
20212022
20232024
20252026
20272028
20292030
0
10
20
30
40
50
60
Other supply sourcesUnited States Potential LiquefactionEast Africa Potential LiquefactionCanada LiquefactionUnited States LiquefactionAustralian LiquefactionMiddle East Liquefaction Asian LNG Demand
BCFP
D
BC LNG Projects2 Projects (AFID) Up to 3 bcf/day
BC LNG Projects1 Project
Maybe!!!!
ADIF= Awaiting Final Investment Decision
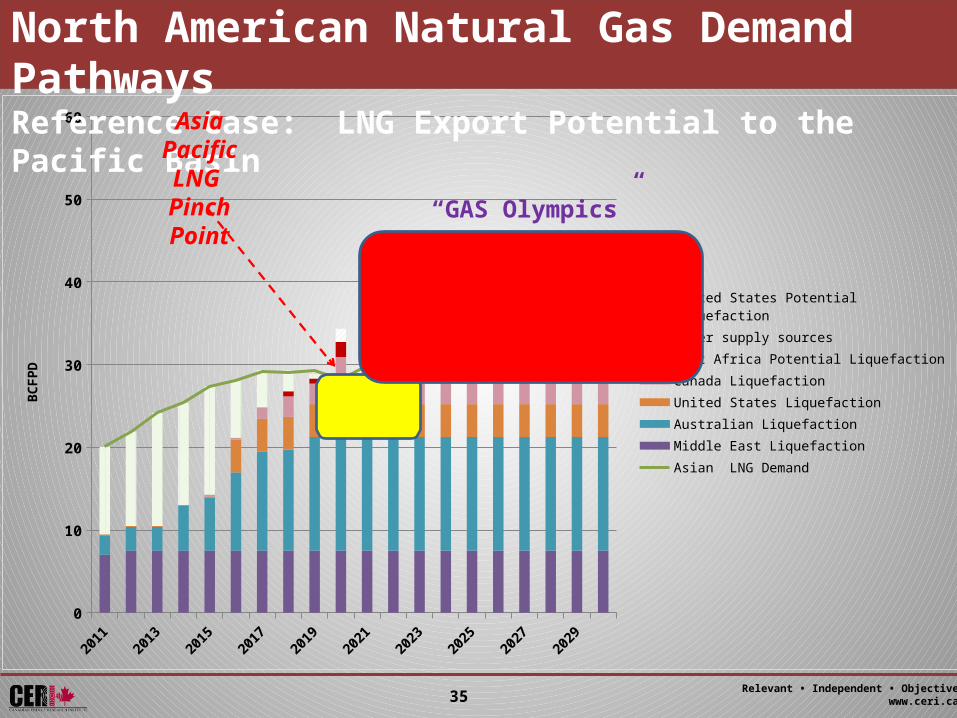
Relevant • Independent • Objectivewww.ceri.ca35
20112012
20132014
20152016
20172018
20192020
20212022
20232024
20252026
20272028
20292030
0
10
20
30
40
50
60
United States Potential LiquefactionOther supply sourcesEast Africa Potential LiquefactionCanada LiquefactionUnited States LiquefactionAustralian LiquefactionMiddle East Liquefaction Asian LNG Demand
BCFP
DNorth American Natural Gas Demand PathwaysReference Case: LNG Export Potential to the Pacific Basin
Asia Pacific LNG
Pinch Point“GAS Olympics”
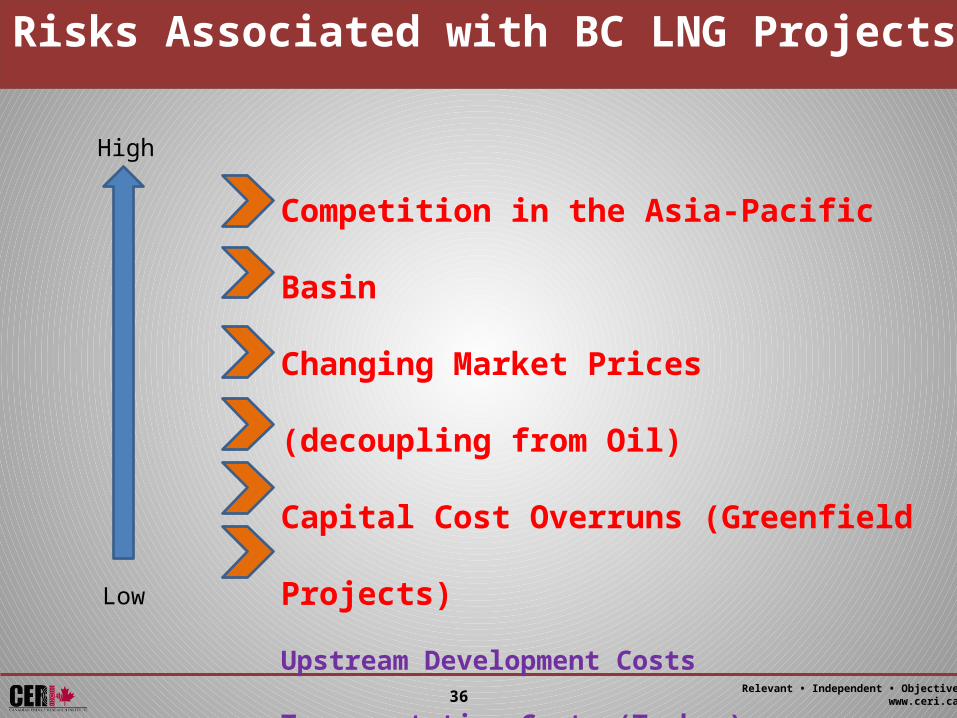
Relevant • Independent • Objectivewww.ceri.ca36
Competition in the Asia-Pacific Basin
Changing Market Prices (decoupling from Oil)
Capital Cost Overruns (Greenfield Projects)
Upstream Development Costs
Transportation Costs (Tanker)
Pipeline Tolls
High
Low
Risks Associated with BC LNG Projects
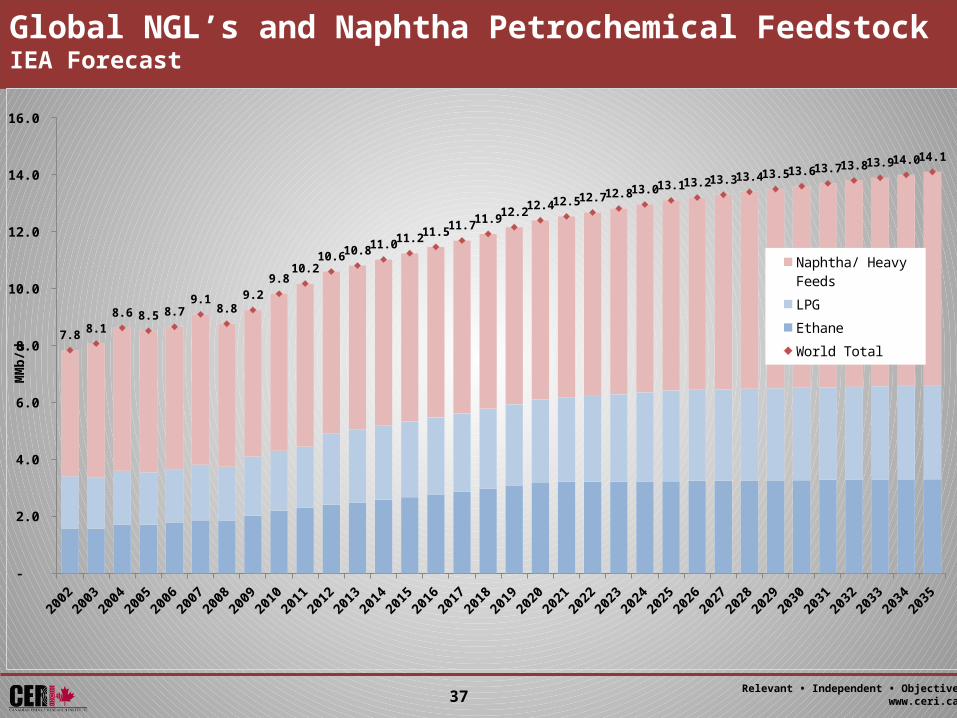
Relevant • Independent • Objectivewww.ceri.ca37
Global NGL’s and Naphtha Petrochemical FeedstockIEA Forecast
20022003
20042005
20062007
20082009
20102011
20122013
20142015
20162017
20182019
20202021
20222023
20242025
20262027
20282029
20302031
20322033
20342035
-
2.0
4.0
6.0
8.0
10.0
12.0
14.0
16.0
7.8 8.1 8.6 8.5 8.7
9.1 8.8
9.2 9.8
10.2 10.6 10.8 11.0 11.2 11.5 11.7 11.9 12.2 12.4 12.5 12.7 12.8 13.0 13.1 13.2 13.3 13.4 13.5 13.6 13.7 13.8 13.9 14.0 14.1
Naphtha/ Heavy Feeds
LPG
Ethane
World Total
MM
b/d
Relevant • Independent • Objectivewww.ceri.ca38
Canadian Energy Research Institute
Thank you for your timePlease visit us atwww.ceri.ca