Embed Size (px)
Citation preview
Relevant • Independent • Objective www.ceri.ca 1
Canadian Energy Research Institute
Greenhouse Gas Emissions Reductions in Canada through Electrification of Energy
Services
Allan Fogwill President&CEO
March 2017
Relevant • Independent • Objective www.ceri.ca
Relevant • Independent • Objective www.ceri.ca 2
Canadian Energy Research Institute Overview
Founded in 1975, the Canadian Energy Research Institute (CERI) is an independent, non-profit research Institute specializing in the analysis of energy economics and related environmental policy issues in the energy production, transportation, and consumption sectors. Our mission is to provide relevant, independent, and objective economic research of energy and environmental issues to benefit business, government, academia and the public.
Relevant • Independent • Objective www.ceri.ca 3
Current Sponsors
Supporters include: In-kind support is also provided:
Relevant • Independent • Objective www.ceri.ca 4
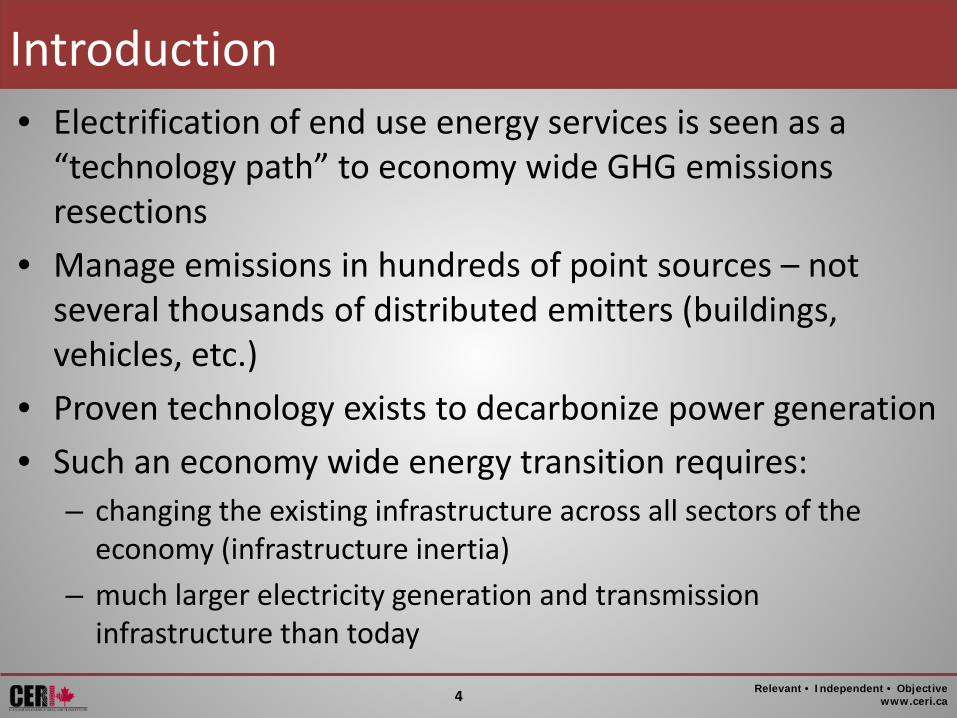
Introduction • Electrification of end use energy services is seen as a
“technology path” to economy wide GHG emissions resections
• Manage emissions in hundreds of point sources – not several thousands of distributed emitters (buildings, vehicles, etc.)
• Proven technology exists to decarbonize power generation • Such an economy wide energy transition requires:
– changing the existing infrastructure across all sectors of the economy (infrastructure inertia)
– much larger electricity generation and transmission infrastructure than today
Relevant • Independent • Objective www.ceri.ca 5
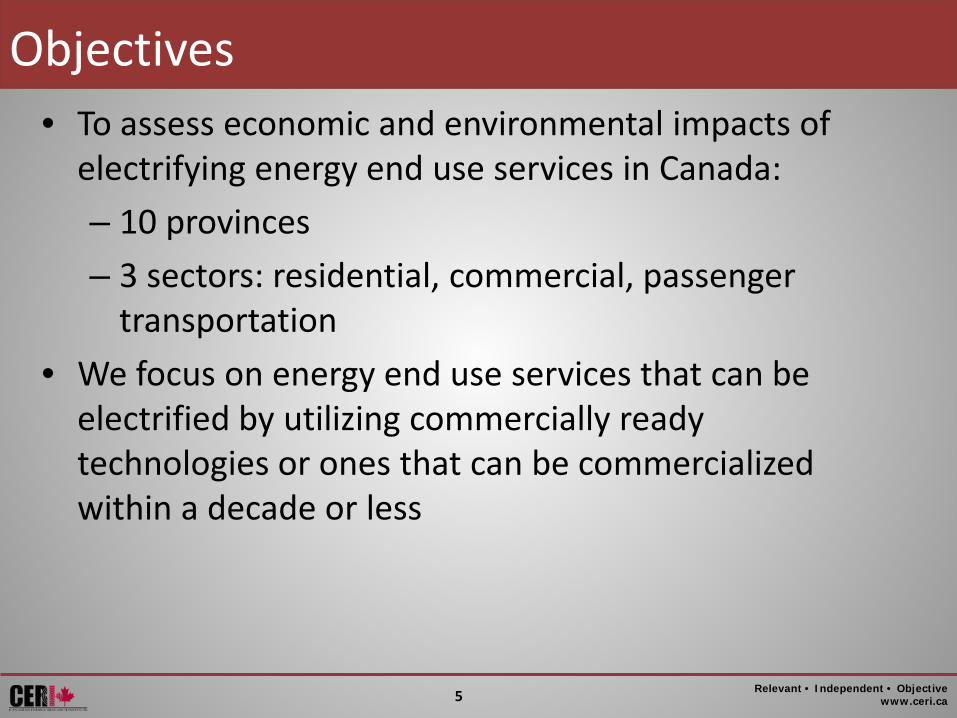
Objectives • To assess economic and environmental impacts of
electrifying energy end use services in Canada: – 10 provinces – 3 sectors: residential, commercial, passenger
transportation • We focus on energy end use services that can be
electrified by utilizing commercially ready technologies or ones that can be commercialized within a decade or less
Relevant • Independent • Objective www.ceri.ca 6
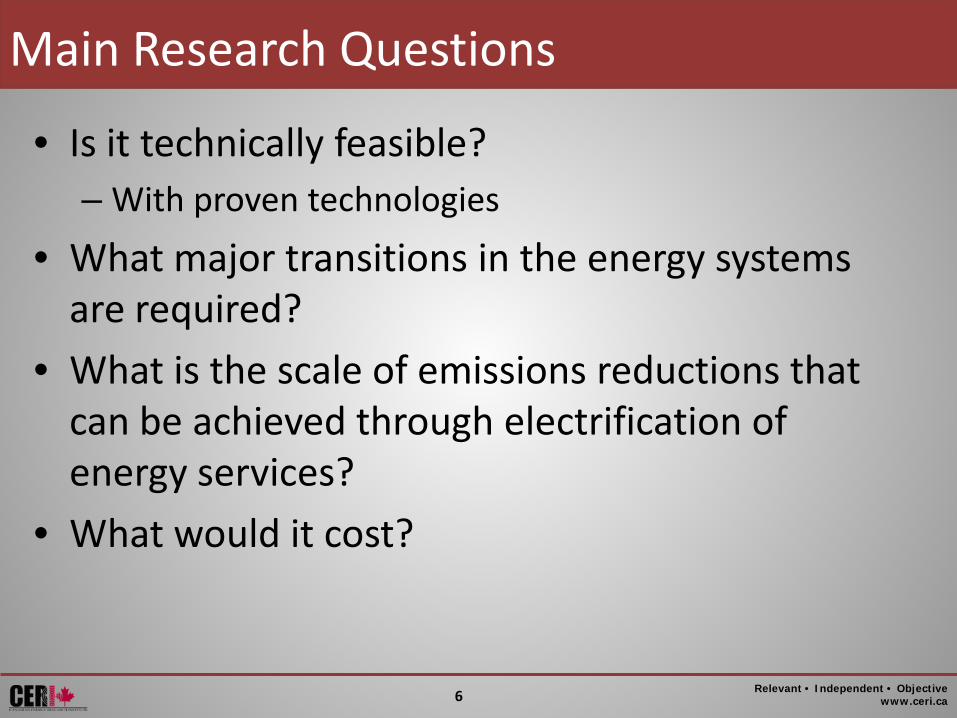
Main Research Questions
• Is it technically feasible? – With proven technologies
• What major transitions in the energy systems are required?
• What is the scale of emissions reductions that can be achieved through electrification of energy services?
• What would it cost?
Relevant • Independent • Objective www.ceri.ca 7
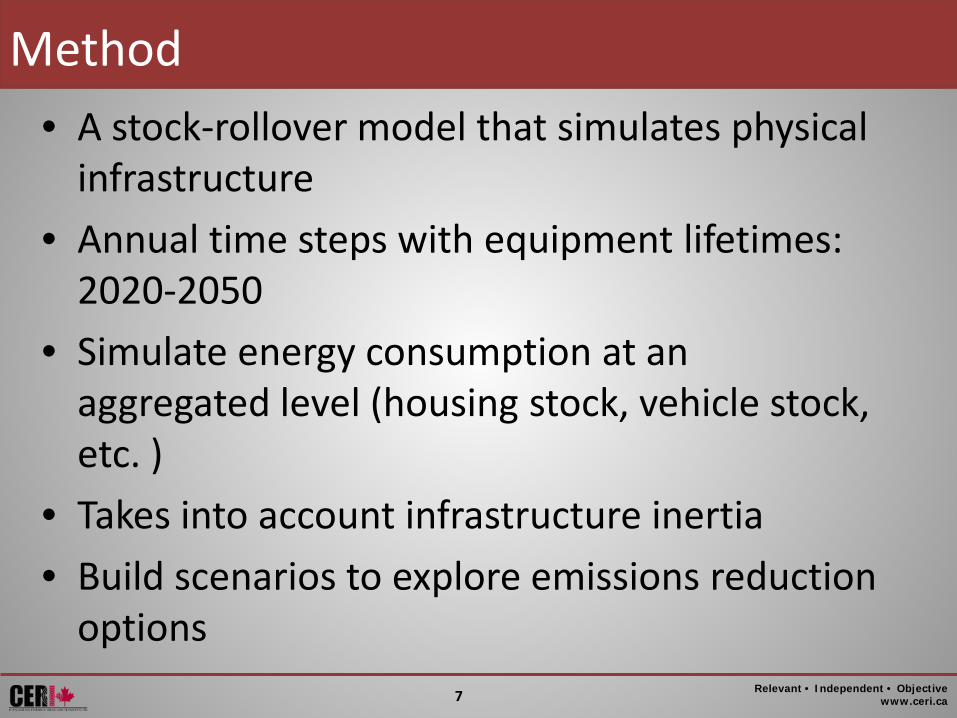
Method • A stock-rollover model that simulates physical
infrastructure • Annual time steps with equipment lifetimes:
2020-2050 • Simulate energy consumption at an
aggregated level (housing stock, vehicle stock, etc. )
• Takes into account infrastructure inertia • Build scenarios to explore emissions reduction
options
Relevant • Independent • Objective www.ceri.ca 8
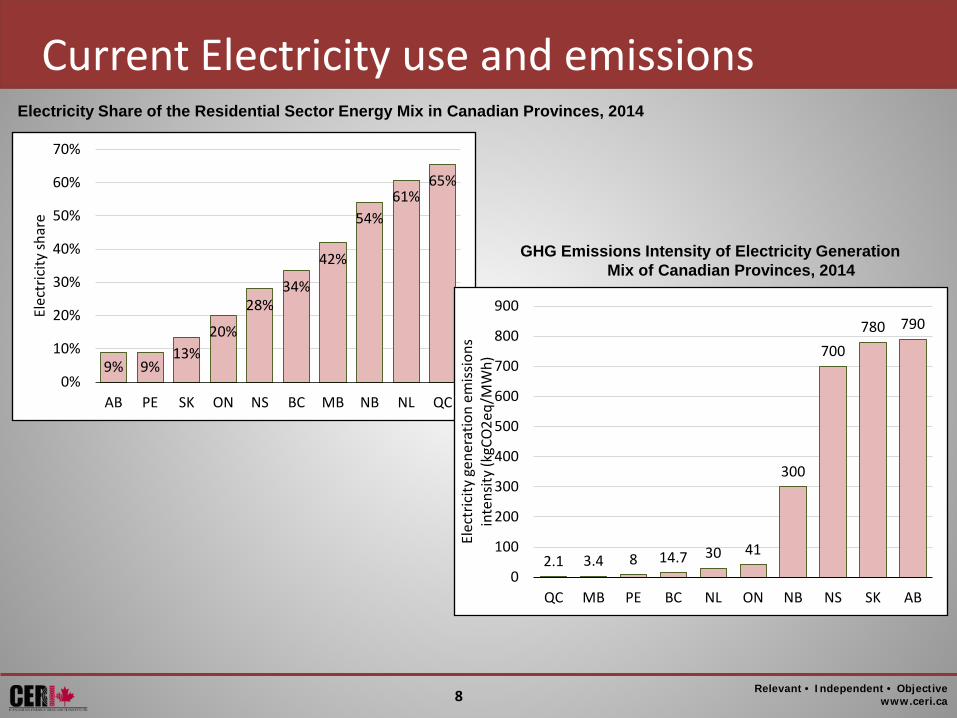
Electricity Share of the Residential Sector Energy Mix in Canadian Provinces, 2014
9% 9% 13%
20%
28% 34%
42%
54% 61%
65%
0%
10%
20%
30%
40%
50%
60%
70%
AB PE SK ON NS BC MB NB NL QC
Elec
tric
ity sh
are
GHG Emissions Intensity of Electricity Generation Mix of Canadian Provinces, 2014
2.1 3.4 8 14.7 30 41
300
700 780 790
0
100
200
300
400
500
600
700
800
900
QC MB PE BC NL ON NB NS SK AB
Elec
tric
ity g
ener
atio
n em
issio
ns
inte
nsity
(kgC
O2e
q/M
Wh)
Current Electricity use and emissions
Relevant • Independent • Objective www.ceri.ca 9
9
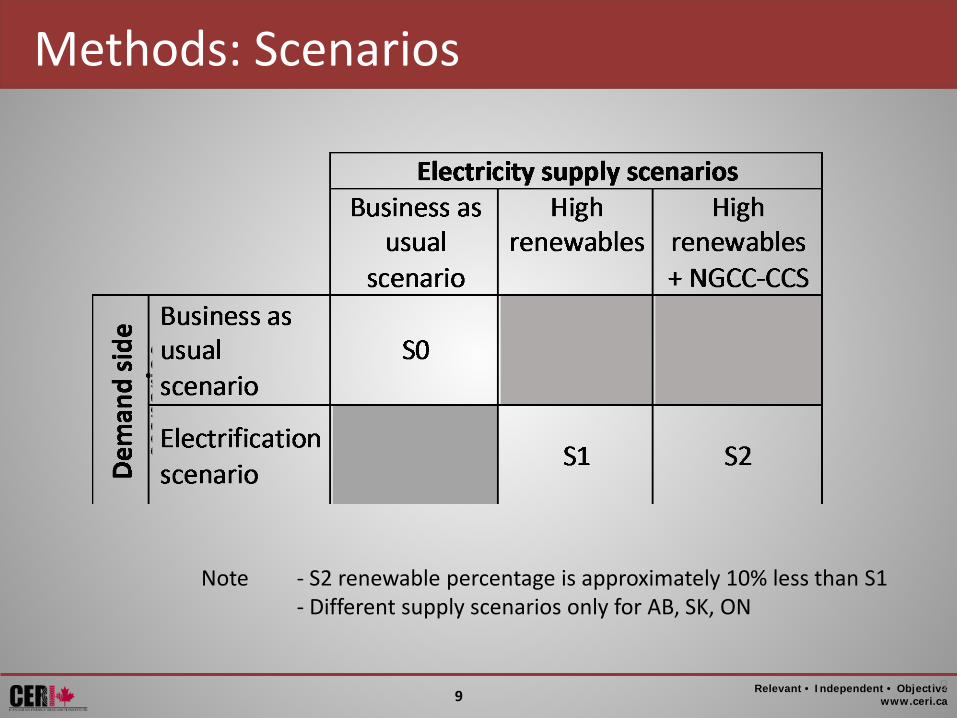
Methods: Scenarios
Note - S2 renewable percentage is approximately 10% less than S1 - Different supply scenarios only for AB, SK, ON

Results
Relevant • Independent • Objective www.ceri.ca 11
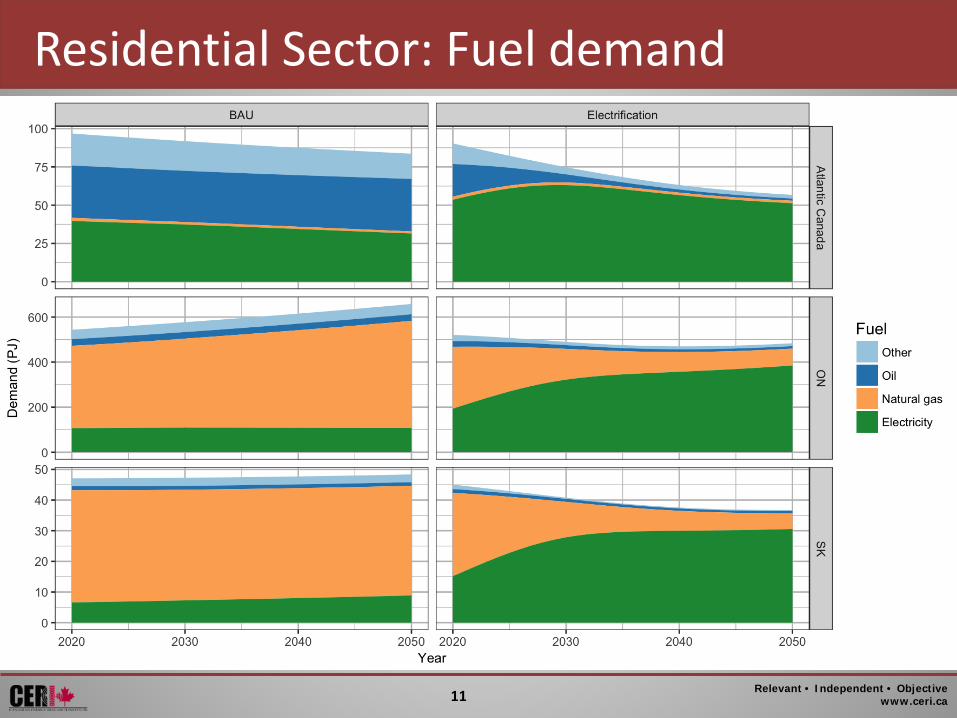
Residential Sector: Fuel demand
Relevant • Independent • Objective www.ceri.ca 12
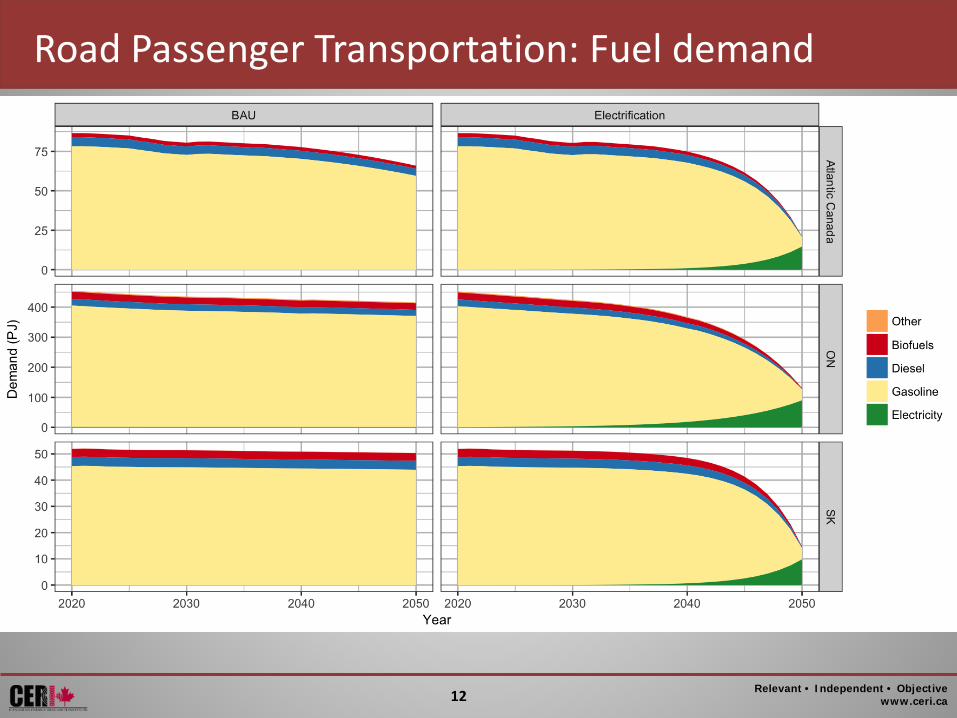
Road Passenger Transportation: Fuel demand
Relevant • Independent • Objective www.ceri.ca 13
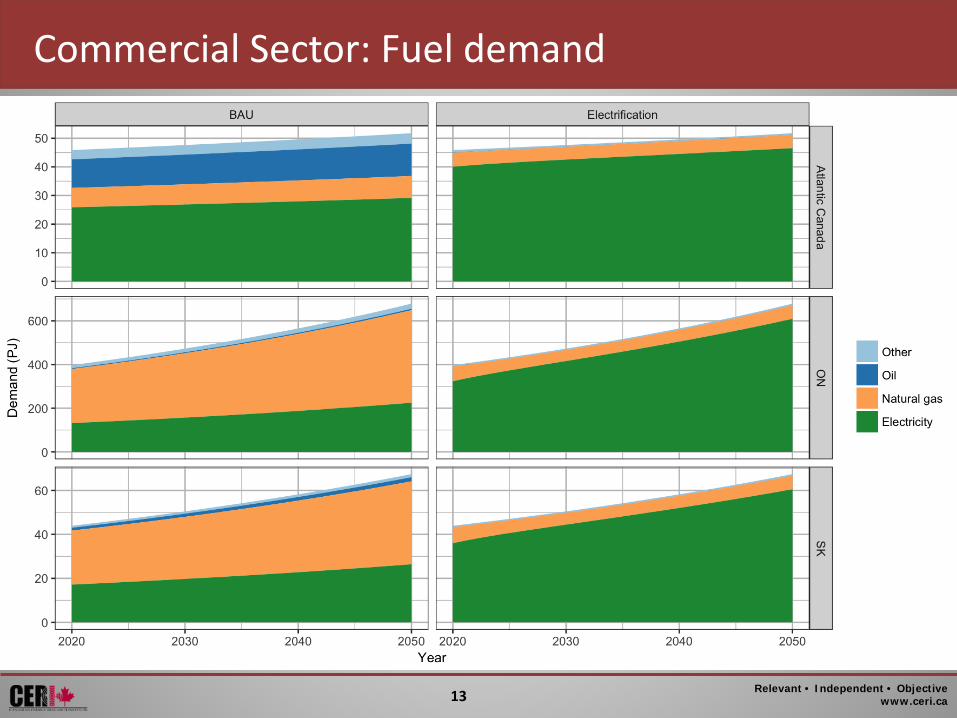
Commercial Sector: Fuel demand
Relevant • Independent • Objective www.ceri.ca 14
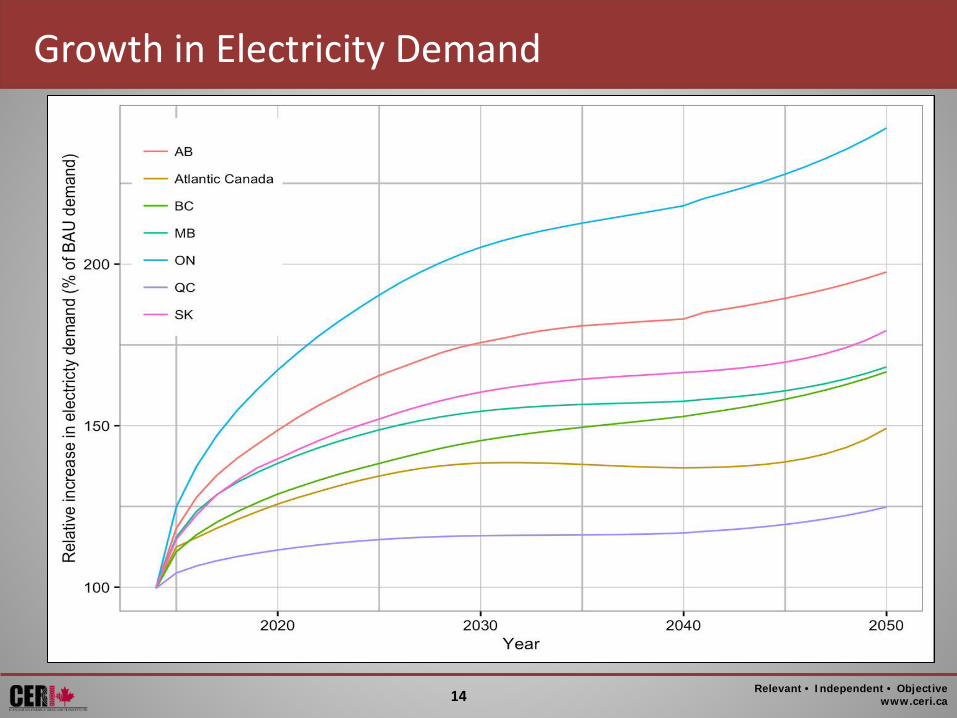
Growth in Electricity Demand
Relevant • Independent • Objective www.ceri.ca 15
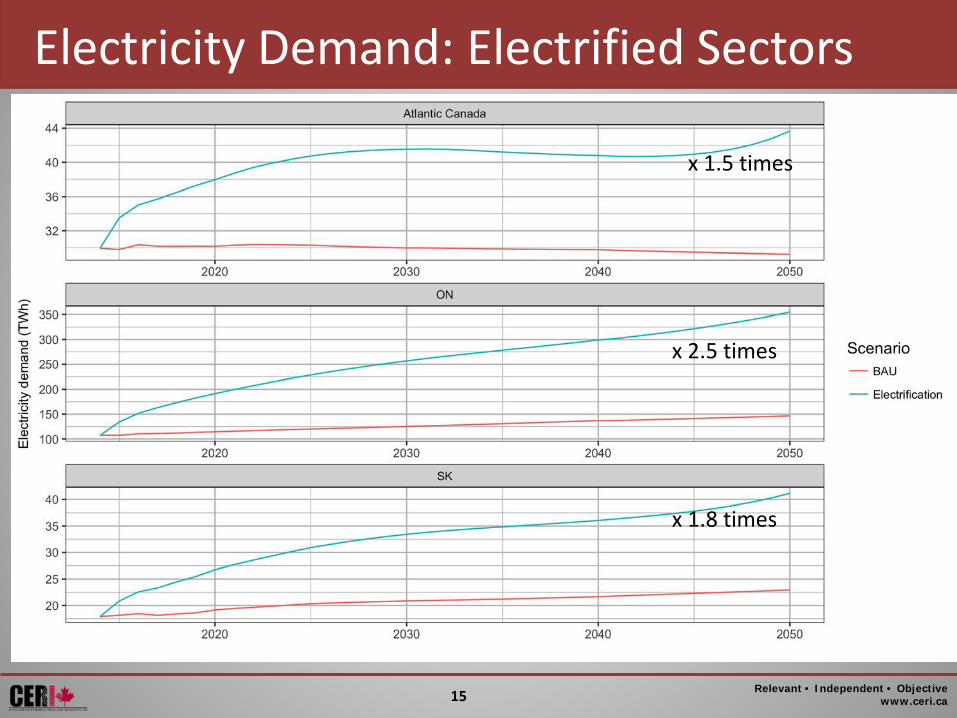
Electricity Demand: Electrified Sectors
x 1.5 times
x 2.5 times
x 1.8 times
Relevant • Independent • Objective www.ceri.ca 16
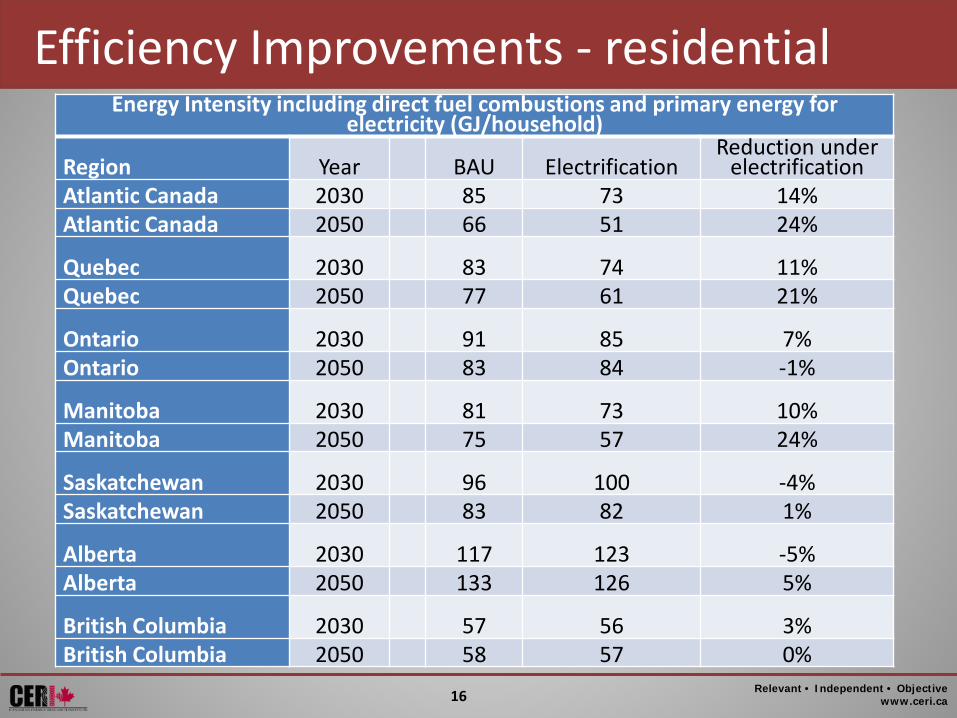
Efficiency Improvements - residential Energy Intensity including direct fuel combustions and primary energy for
electricity (GJ/household)
Region Year BAU Electrification Reduction under
electrification Atlantic Canada 2030 85 73 14% Atlantic Canada 2050 66 51 24% Quebec 2030 83 74 11% Quebec 2050 77 61 21% Ontario 2030 91 85 7% Ontario 2050 83 84 -1% Manitoba 2030 81 73 10% Manitoba 2050 75 57 24% Saskatchewan 2030 96 100 -4% Saskatchewan 2050 83 82 1% Alberta 2030 117 123 -5% Alberta 2050 133 126 5% British Columbia 2030 57 56 3% British Columbia 2050 58 57 0%
Relevant • Independent • Objective www.ceri.ca 17
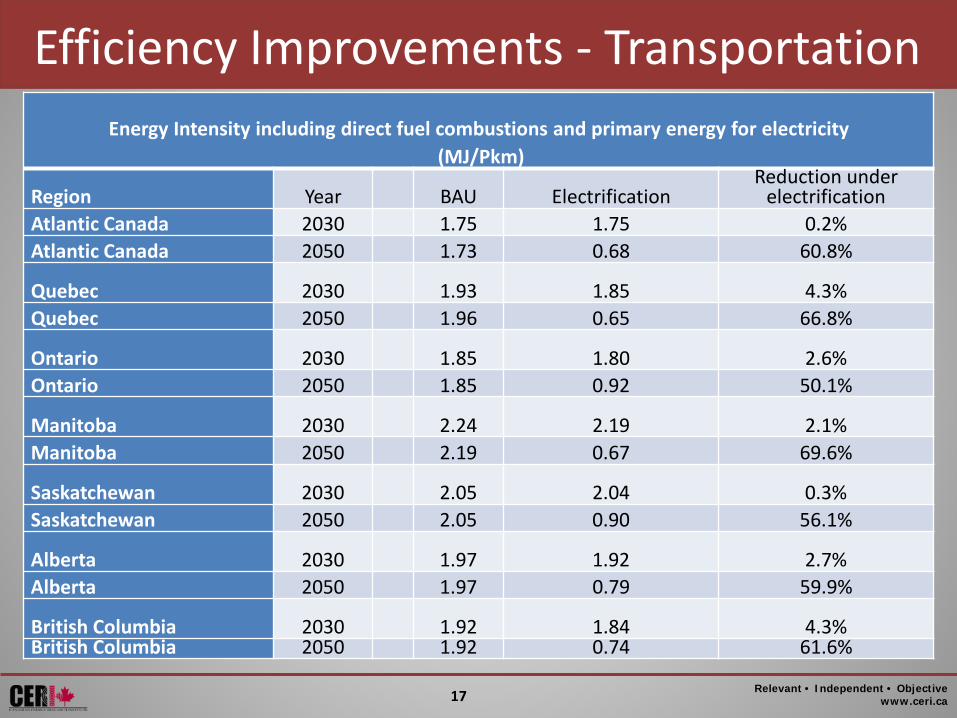
Efficiency Improvements - Transportation
Energy Intensity including direct fuel combustions and primary energy for electricity (MJ/Pkm)
Region Year BAU Electrification Reduction under
electrification Atlantic Canada 2030 1.75 1.75 0.2% Atlantic Canada 2050 1.73 0.68 60.8% Quebec 2030 1.93 1.85 4.3% Quebec 2050 1.96 0.65 66.8% Ontario 2030 1.85 1.80 2.6% Ontario 2050 1.85 0.92 50.1% Manitoba 2030 2.24 2.19 2.1% Manitoba 2050 2.19 0.67 69.6% Saskatchewan 2030 2.05 2.04 0.3% Saskatchewan 2050 2.05 0.90 56.1% Alberta 2030 1.97 1.92 2.7% Alberta 2050 1.97 0.79 59.9% British Columbia 2030 1.92 1.84 4.3% British Columbia 2050 1.92 0.74 61.6%
Emissions & Cost
Relevant • Independent • Objective www.ceri.ca 19
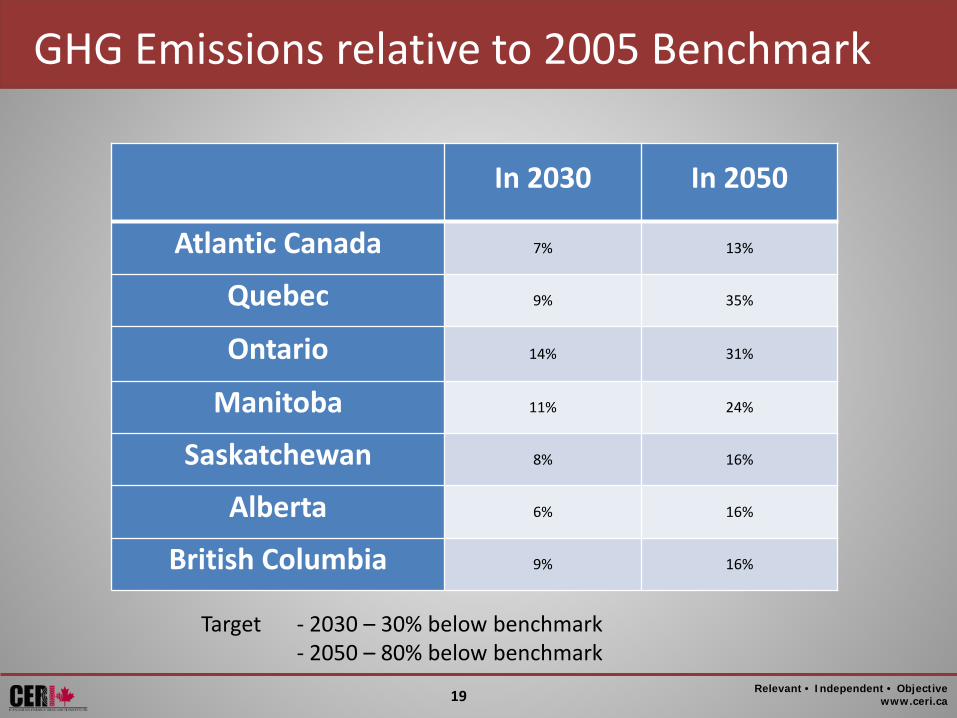
GHG Emissions relative to 2005 Benchmark
In 2030 In 2050
Atlantic Canada 7% 13%
Quebec 9% 35%
Ontario 14% 31%
Manitoba 11% 24%
Saskatchewan 8% 16%
Alberta 6% 16%
British Columbia 9% 16%
Target - 2030 – 30% below benchmark - 2050 – 80% below benchmark
Relevant • Independent • Objective www.ceri.ca 20
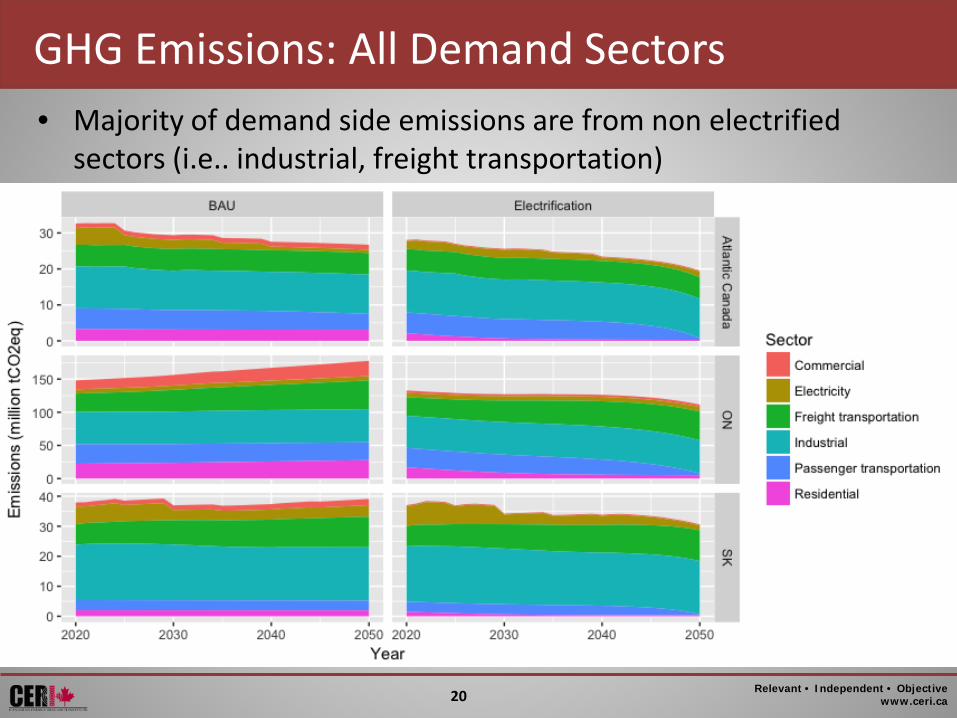
GHG Emissions: All Demand Sectors • Majority of demand side emissions are from non electrified
sectors (i.e.. industrial, freight transportation)
Relevant • Independent • Objective www.ceri.ca 21
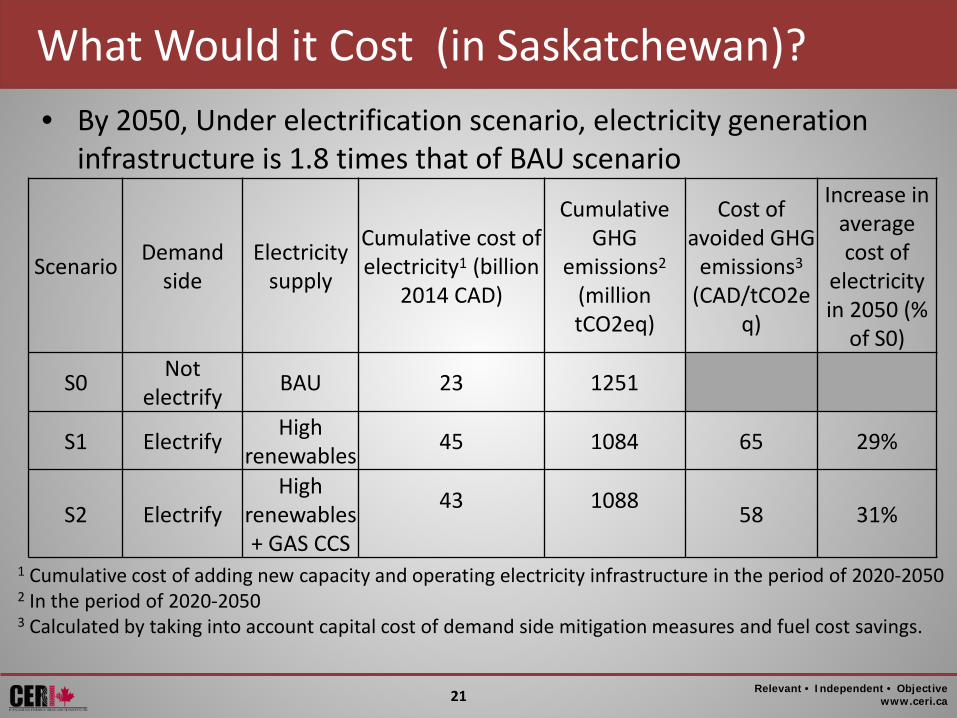
• By 2050, Under electrification scenario, electricity generation infrastructure is 1.8 times that of BAU scenario
Scenario Demand side
Electricity supply
Cumulative cost of electricity1 (billion
2014 CAD)
Cumulative GHG
emissions2 (million tCO2eq)
Cost of avoided GHG
emissions3 (CAD/tCO2e
q)
Increase in average cost of
electricity in 2050 (%
of S0)
S0 Not electrify BAU 23 1251
S1 Electrify High renewables 45 1084 65 29%
S2 Electrify High
renewables + GAS CCS
43
1088 58 31%
What Would it Cost (in Saskatchewan)?
1 Cumulative cost of adding new capacity and operating electricity infrastructure in the period of 2020-2050 2 In the period of 2020-2050 3 Calculated by taking into account capital cost of demand side mitigation measures and fuel cost savings.
Relevant • Independent • Objective www.ceri.ca 22
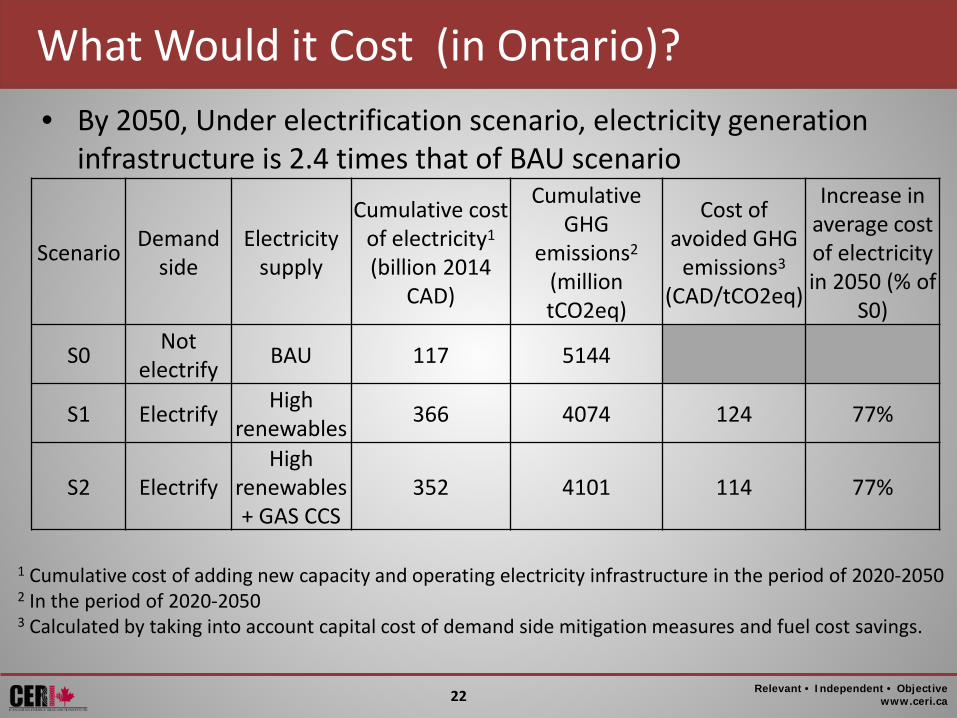
• By 2050, Under electrification scenario, electricity generation infrastructure is 2.4 times that of BAU scenario
Scenario Demand side
Electricity supply
Cumulative cost of electricity1 (billion 2014
CAD)
Cumulative GHG
emissions2 (million tCO2eq)
Cost of avoided GHG
emissions3 (CAD/tCO2eq)
Increase in average cost of electricity in 2050 (% of
S0)
S0 Not electrify BAU 117 5144
S1 Electrify High renewables 366 4074 124 77%
S2 Electrify High
renewables + GAS CCS
352 4101 114 77%
1 Cumulative cost of adding new capacity and operating electricity infrastructure in the period of 2020-2050 2 In the period of 2020-2050 3 Calculated by taking into account capital cost of demand side mitigation measures and fuel cost savings.
What Would it Cost (in Ontario)?
Relevant • Independent • Objective www.ceri.ca 23
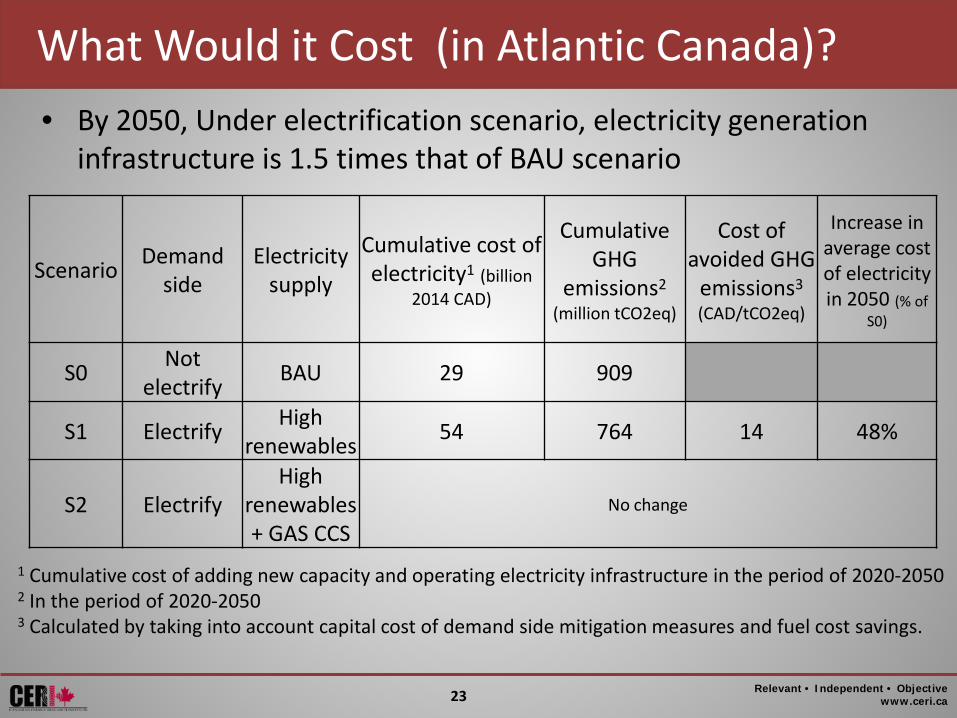
What Would it Cost (in Atlantic Canada)? • By 2050, Under electrification scenario, electricity generation
infrastructure is 1.5 times that of BAU scenario
Scenario Demand side
Electricity supply
Cumulative cost of electricity1 (billion
2014 CAD)
Cumulative GHG
emissions2 (million tCO2eq)
Cost of avoided GHG
emissions3 (CAD/tCO2eq)
Increase in average cost of electricity in 2050 (% of
S0)
S0 Not electrify BAU 29 909
S1 Electrify High renewables 54 764 14 48%
S2 Electrify High
renewables + GAS CCS
No change
1 Cumulative cost of adding new capacity and operating electricity infrastructure in the period of 2020-2050 2 In the period of 2020-2050 3 Calculated by taking into account capital cost of demand side mitigation measures and fuel cost savings.
Relevant • Independent • Objective www.ceri.ca 24
Concluding Remarks
• Electrification provides a viable option to decarbonize residential, commercial, and passenger transportation sectors with current technologies
• Industrial sector remains the most significant contributor – we did not assess mitigation measures
• Electrification will profoundly transform the physical energy system
• Level of end-use energy services remains relatively unchanged
Relevant • Independent • Objective www.ceri.ca 25
Concluding Remarks
• Viability of electrification as an emissions reduction measure depends largely on decarbonizing the power sector – Coal to standard gas transition is not sufficient
• Availability Gas CCS lowered the abatement cost and total cost in Saskatchewan and Alberta
• Deeper reductions require mitigation measures in the industrial sector, freight transportation and further decarburization of the electricity sector

Relevant • Independent • Objective www.ceri.ca 26
Canadian Energy Research Institute
Thank you for your time
www.ceri.ca
Canadian Energy Research Institute on LinkedIn
Twitter @ceri_canada
Check out this and our other studies
on CERI’s website Allan Fogwill
[email protected] 587.225.7605