Embed Size (px)
Citation preview
chemview DocumentationRelease 0.6
Gabriele Lanaro
Dec 19, 2017


Contents
1 Installation and Quick Start 31.1 Quick Start . . . . . . . . . . . . . . . . . . . . . . . . . . . . . . . . . . . . . . . . . . . . . . . . 4
2 Cookbook 192.1 Syncronizing cameras across multiple widgets . . . . . . . . . . . . . . . . . . . . . . . . . . . . . 192.2 Plotting molecular orbitals . . . . . . . . . . . . . . . . . . . . . . . . . . . . . . . . . . . . . . . . 20
3 Credits 21
4 Indices and tables 23
i
ii
chemview Documentation, Release 0.6
chemview is an interactive molecular viewer designed for the IPython notebook. With chemview you can:
• Display molecules and systems in an easy and efficient manner.
• Look at those systems evolve in time. chemview is fast by design, updates on the properties are performed onlywhen necessary.
• Perform interactive data visualization in the IPython notebook.
• Create new ways to visualize your data by using the flexible low-level API.
chemview is implemented using web technologies such as WebGL and three.js, giving chemview an excellent multi-platform support.
Excited? Try it out (it works on smartphones too):
• Left Click: Rotate
• Wheel: Zoom
• Right Click: Pan
Go ahead with the Installation and Quick Start.
Contents:
Contents 1

chemview Documentation, Release 0.6
2 Contents
CHAPTER 1
Installation and Quick Start
Installing chemview with conda is fairly easy. First download anaconda (or miniconda):
http://continuum.io/downloads
To install chemview using conda you can first create an environment (optional):
$ conda create -p /path/to/new/environment python$ source activate /path/to/new/environment
then, you can install chemview directly from the binstar channel.
$ conda install -c http://conda.binstar.org/gabrielelanaro
or, for the development version you can manually install the dependencies:
$ conda install notebook numpy numba$ git clone https://github.com/gabrielelanaro/chemview$ cd chemview$ pip install .
It is also possible to install chemview using pip:
pip install notebook numpy numba # Jupyter 4.x
# Download and install chemviewgit clone https://github.com/gabrielelanaro/chemviewcd chemviewpip install .
Chemview has an optional <povray http://www.povray.org/>_ backend for rendering high quality images. For thisyou’ll need to install the povray software and the vapory bindings:
pip install vapory
3
chemview Documentation, Release 0.6
1.1 Quick Start
In this section we’ll see how to visualize a benzene molecule with chemview. To start, let’s launch IPython notebookand start a new notebook.
To import chemview you can write and execute the following code in a cell:
from chemview import MolecularViewer
The function enable_notebook will load the necessary files to display the molecular viewer in the browser. To displaya benzene molecule we need at least two pieces of information:
1. The atomic types
2. The atomic coordinates
3. The bonds between atoms
For the scope of this tutorial, the information were extracted from here. You can use chemical package (like mdtraj orchemlab) to read the coordinates of your molecules.
We define the coordinates as a numpy array, the atomic types as a list of strings and the bonds as a list of start, endtuples.
import numpy as npcoordinates = np.array([[0.00, 0.13, 0.00], [0.12, 0.07, 0.00], [0.12,-0.07, 0.00],
[0.00,-0.14, 0.00], [-0.12,-0.07, 0.00],[-0.12, 0.07, 0.00],[ 0.00, 0.24, 0.00], [ 0.21, 0.12, 0.00], [ 0.21,-0.12, 0.00],[ 0.00,-0.24, 0.00], [-0.21,-0.12, 0.00],[-0.21, 0.12, 0.00]])
atomic_types = ['C', 'C', 'C', 'C', 'C', 'C', 'H', 'H', 'H', 'H', 'H', 'H']bonds = [(0, 6), (1, 7), (2, 8), (3, 9), (4, 10), (5, 11),
(0, 1), (1, 2), (2, 3), (3, 4), (4, 5), (5, 0)]
We can pass those to the class MolecularViewer and call the method lines to render the molecule as a wireframe:
mv = MolecularViewer(coordinates, topology={'atom_types': atomic_types,'bonds': bonds})
mv.lines()mv
You can rotate (left click), pan(right click) and zoom (wheel) to visualize your molecules.
Congratulation for finishing the first tutorial! You can now move on more advanced topics:
1.1.1 Viewing Molecules
Using the MolecularViewer
MolecularViewer is a library-agnostic tool to display molecules in chemview. In this section we will see how to use it,and what representations are currently available.
To create a MolecularViewer instance we need the positions of the atoms, as an array of x, y, z coordinates, and adescription of the features and connectivity of the system (also called topology).
The topology is a nested dictionary with the following fields:
atom_types (required field) A list of strings, each representing an atom symbol.
Example: ["H", "C", "N", "O", ..]
4 Chapter 1. Installation and Quick Start
chemview Documentation, Release 0.6
bonds A list of tuples indicating the index of the bond extrema.
Example: [(0, 1), (1, 2), ...]
atom_names A list of atom names, like the ones used in pdb files
Example: ["HA", "CA", "N", ...]
residue_indices A nested list of indices (as tuples) for each residue present in the molecule.
Example: [(0, 1, 2, 3, 4, 5), (6, 7, 8, 9, 10), ... ]
residue_types A list of strings corresponding to residue types.
Example: ["ALA", "GLY", ...]
secondary_structure A list of strings representing the secondary structure of each residue, H for helix, E for sheet,C for coil.
Example: ["H", "H", "H", "C", "C", "E", "E" ...]
Note: As the description of the topology is quite involved, you can combine chemview with another library thatprovides the topology directly from the chemical data files (such as chemlab and mdtraj).
Once you create your molecular viewer, you can display the molecule in a variety of ways:
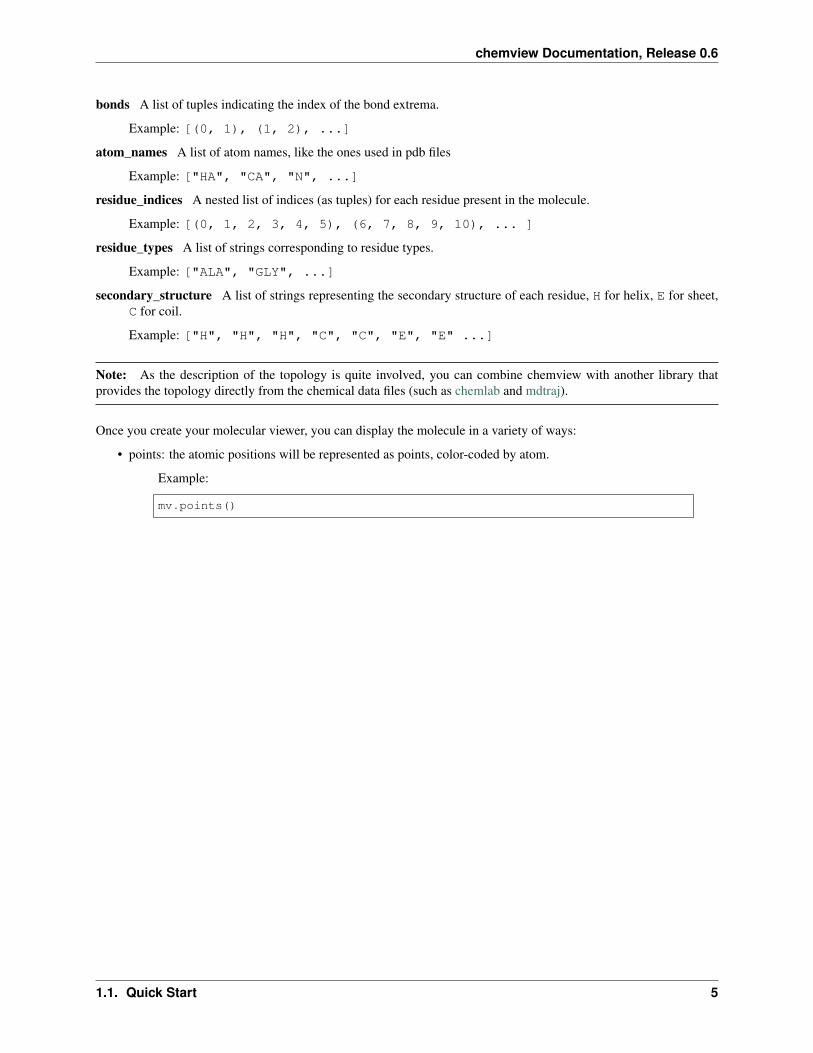
• points: the atomic positions will be represented as points, color-coded by atom.
Example:
mv.points()
1.1. Quick Start 5
chemview Documentation, Release 0.6
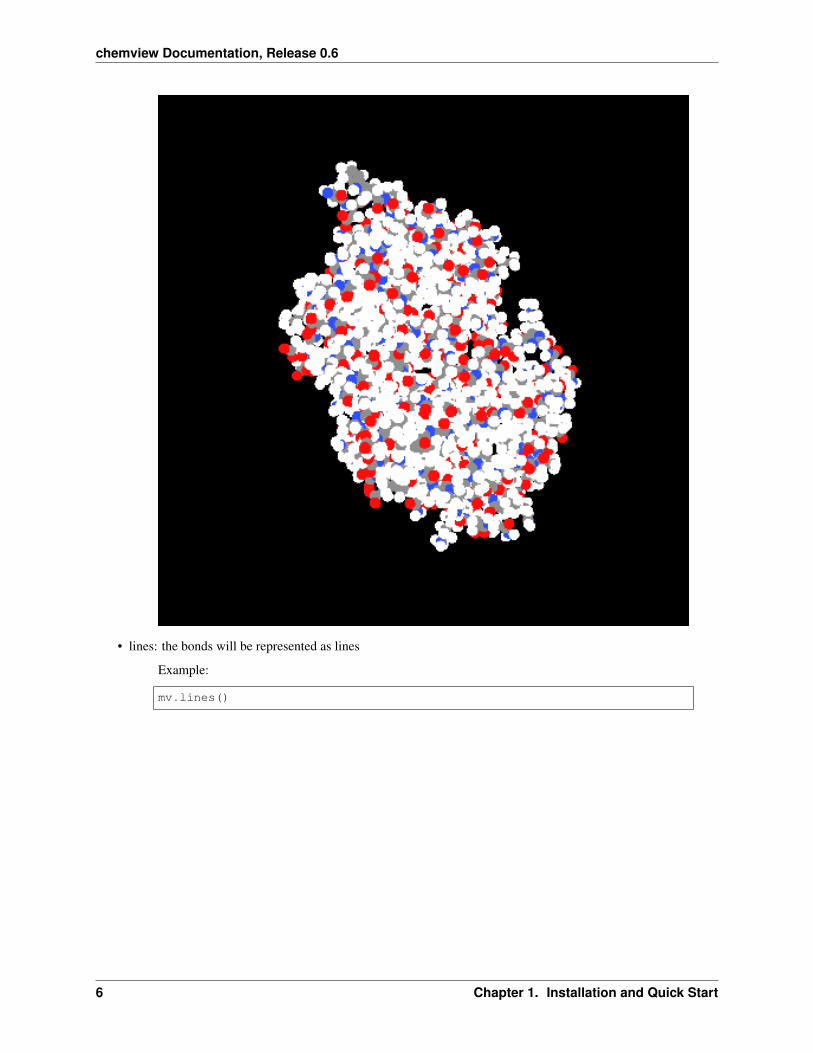
• lines: the bonds will be represented as lines
Example:
mv.lines()
6 Chapter 1. Installation and Quick Start

chemview Documentation, Release 0.6
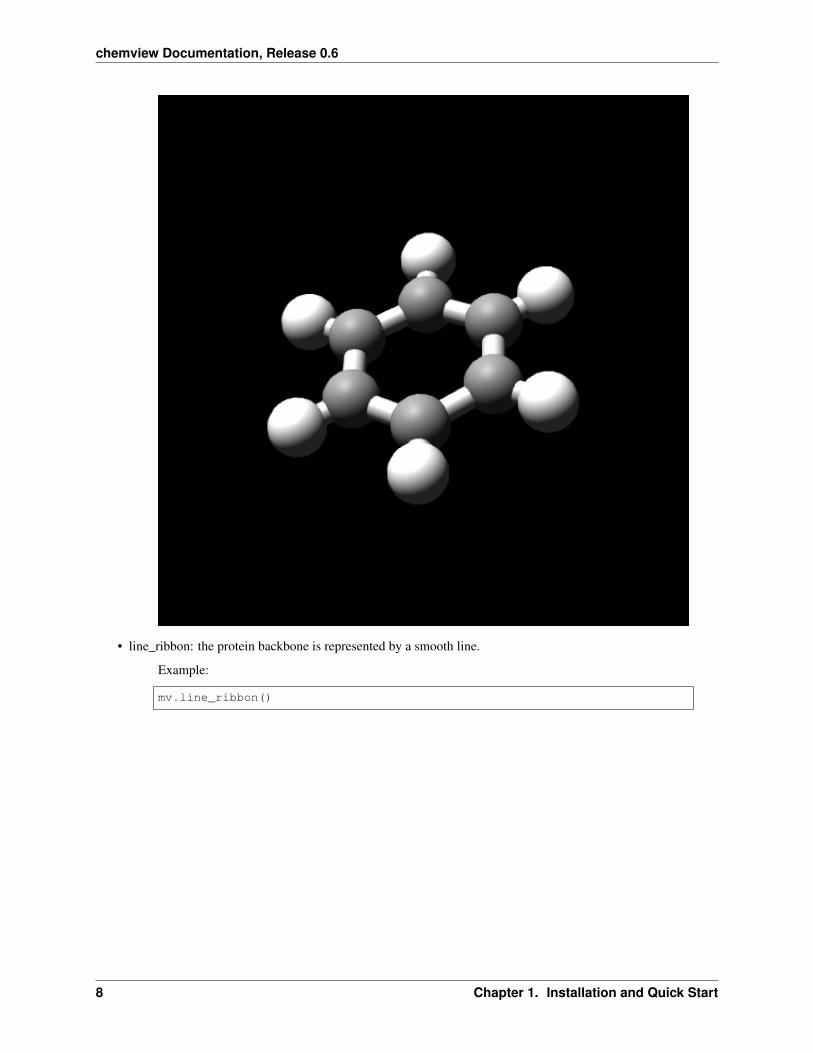
• ball_and_sticks: the classical ball and stick representation. Atom are spheres, bonds are cylinders. At themoment this representation is not suitable for very large molecules and animations.
Example:
mv.ball_and_sticks()
1.1. Quick Start 7
chemview Documentation, Release 0.6
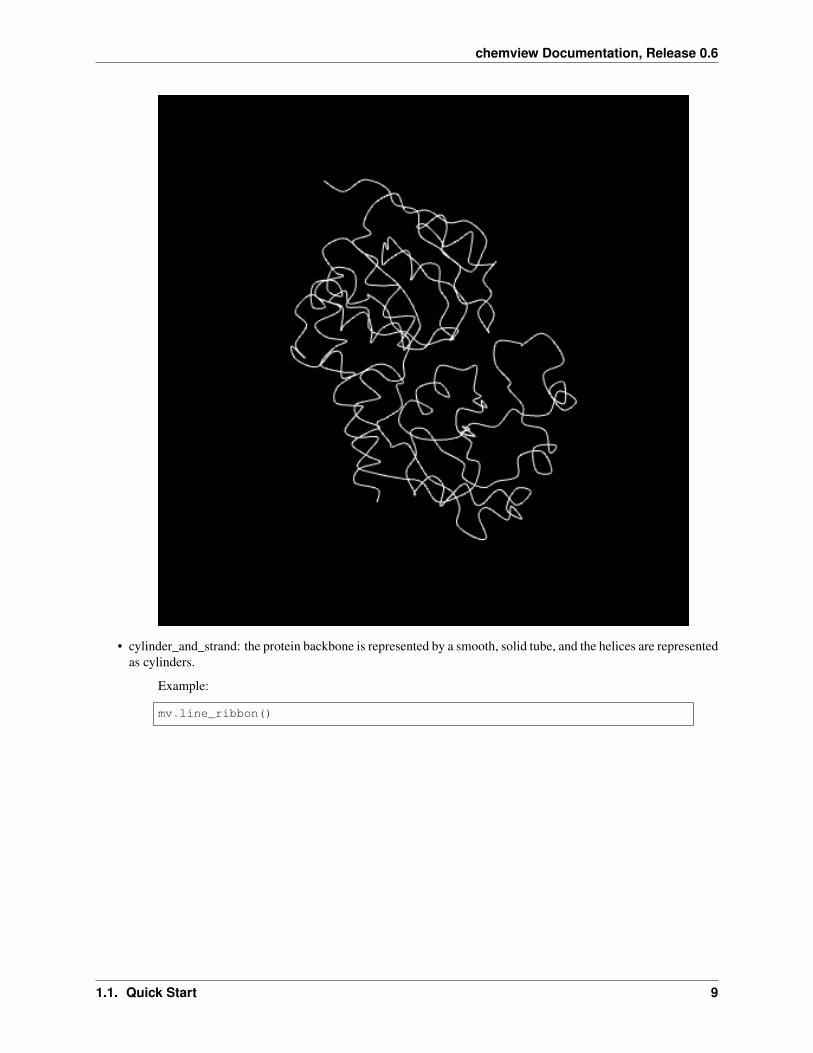
• line_ribbon: the protein backbone is represented by a smooth line.
Example:
mv.line_ribbon()
8 Chapter 1. Installation and Quick Start
chemview Documentation, Release 0.6
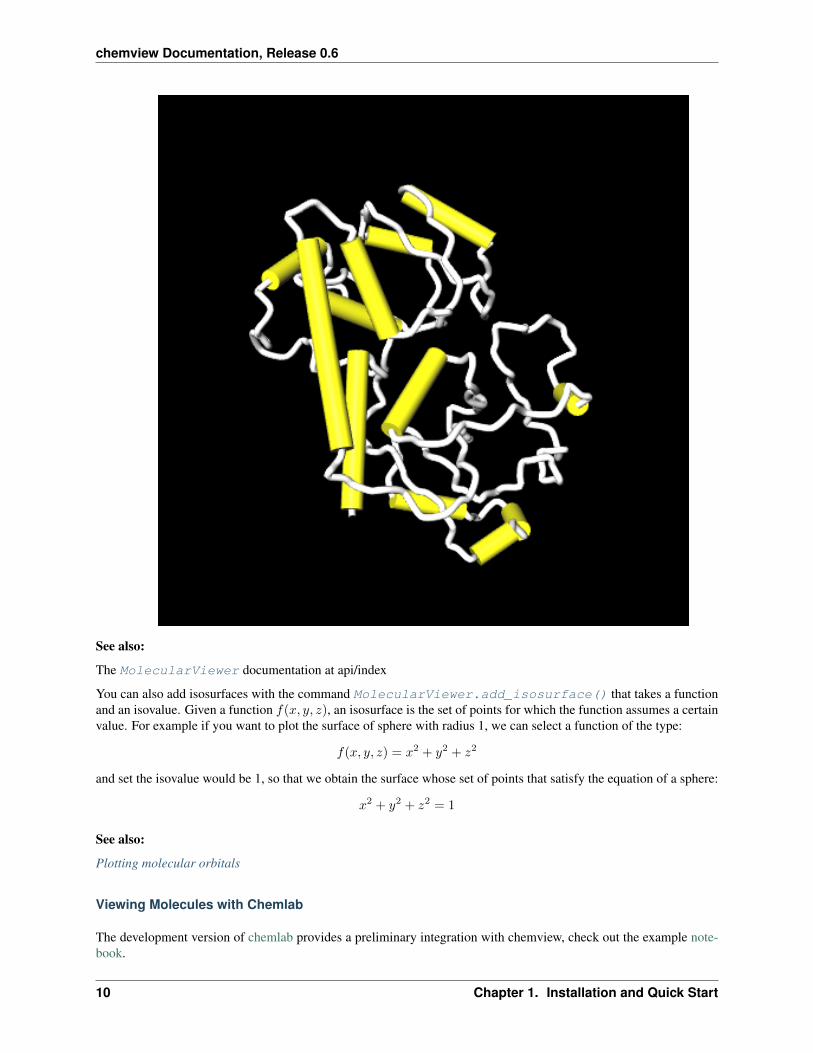
• cylinder_and_strand: the protein backbone is represented by a smooth, solid tube, and the helices are representedas cylinders.
Example:
mv.line_ribbon()
1.1. Quick Start 9
chemview Documentation, Release 0.6
See also:
The MolecularViewer documentation at api/index
You can also add isosurfaces with the command MolecularViewer.add_isosurface() that takes a functionand an isovalue. Given a function 𝑓(𝑥, 𝑦, 𝑧), an isosurface is the set of points for which the function assumes a certainvalue. For example if you want to plot the surface of sphere with radius 1, we can select a function of the type:
𝑓(𝑥, 𝑦, 𝑧) = 𝑥2 + 𝑦2 + 𝑧2
and set the isovalue would be 1, so that we obtain the surface whose set of points that satisfy the equation of a sphere:
𝑥2 + 𝑦2 + 𝑧2 = 1
See also:
Plotting molecular orbitals
Viewing Molecules with Chemlab
The development version of chemlab provides a preliminary integration with chemview, check out the example note-book.
10 Chapter 1. Installation and Quick Start

chemview Documentation, Release 0.6
Viewing Molecules with MDTraj
In the near future, mdtraj will provide integration.
While you wait, take a look at the docs and learn about mdtraj.
Making custom representations
chemview provides an easy-to-use API to create new ways to display your data and build novel tools. The classRepresentationViewer contains methods to display common 3D shapes.
To create a RepresentationViewer instance, type:
rv = RepresentationViewer()rv
This will display an empty viewer. To add objects, we can use the method RepresentationViewer.add_representation(). The method takes two parameters: the name of the representation to display, and adictionary of options, that are specific for each representation.
For example, to add three points on the screen we will use the following parameters:
rv.add_representation('points', {'coordinates', np.array([[0.0, 0.0, 0.0],1.0, 0.0, 0.0],2.0, 0.0, 0.0])})
Warning: The RepresentationViewer communicates directly with the Javascript layer and, being outside of therealm of Python doesn’t provide nice exception tracebacks. Be rigorous with parameter types.
For more examples (with pictures) you can check the test notebook.
Below reference of the available representations, along with their options:
points display a set of coordinates as points with different colors and sizes.
Options:
• coordinates numpy array of 3D coordinates (float32)
• sizes python list of floats representing the size of each point
• colors python list of 32 bit integers representing the color of each point.
Example using HEX representation: [0xffffff, 0x00ffff, 0xff0000, ...]
lines display a set of lines with different colors.
Options:
• startCoords numpy array of 3D coordinates representing the starting point of each line
• endCoords numpy array of 3D coordinates representing the ending point of each line
• startColors list of 32 bit integers corresponding to the color of the starting point
• endColors list of 32 bit integers corresponding to the color of the ending point
cylinders display a set of cylinders. This is a slow primitive, avoid using it for animations; use lines instead.
Options:
• startCoords numpy array of 3D coordinates representing the starting point of each cylinder
1.1. Quick Start 11
chemview Documentation, Release 0.6
• endCoords numpy array of 3D coordinates representing the ending point of each cylinder
• colors list of 32 bit integers corresponding to the color of each cylinder
• radii list of float corresponding to the radius of each cylinder
smoothline display a smooth line that passes through a set of points.
Options:
• coordinates numpy array of 3D coordinates representing the control points of the smooth line.
• color 32 bit integer (hex) color of the line
• resolution int, number of subdivision along the path between control points. Controls the smoothness
smoothtube display a smooth tube that passes through a set of points. This is a slow primitive, not suitable foranimating very large objects; use smoothline instead.
Options:
• coordinates numpy array of 3D coordinates representing the control points of the smooth tube.
• color 32 bit integer (hex) color of the tube
• radius float representing the radius of the tube
• resolution int, number of subdivision along the path between control points. Controls the smoothness
spheres display a set of spheres. This primitive is slow, avoid using it for animations; use points instead.
Options:
• coordinates numpy array of 3D coordinates representing the position of the spheres.
• colors list of 32 bit integers representing the color of each sphere
• radii list of float, radius of each sphere
• resolution int, number of vertical and horizontal subdivisions to make the sphere: high resolution meansslow performance.
1.1.2 Animation
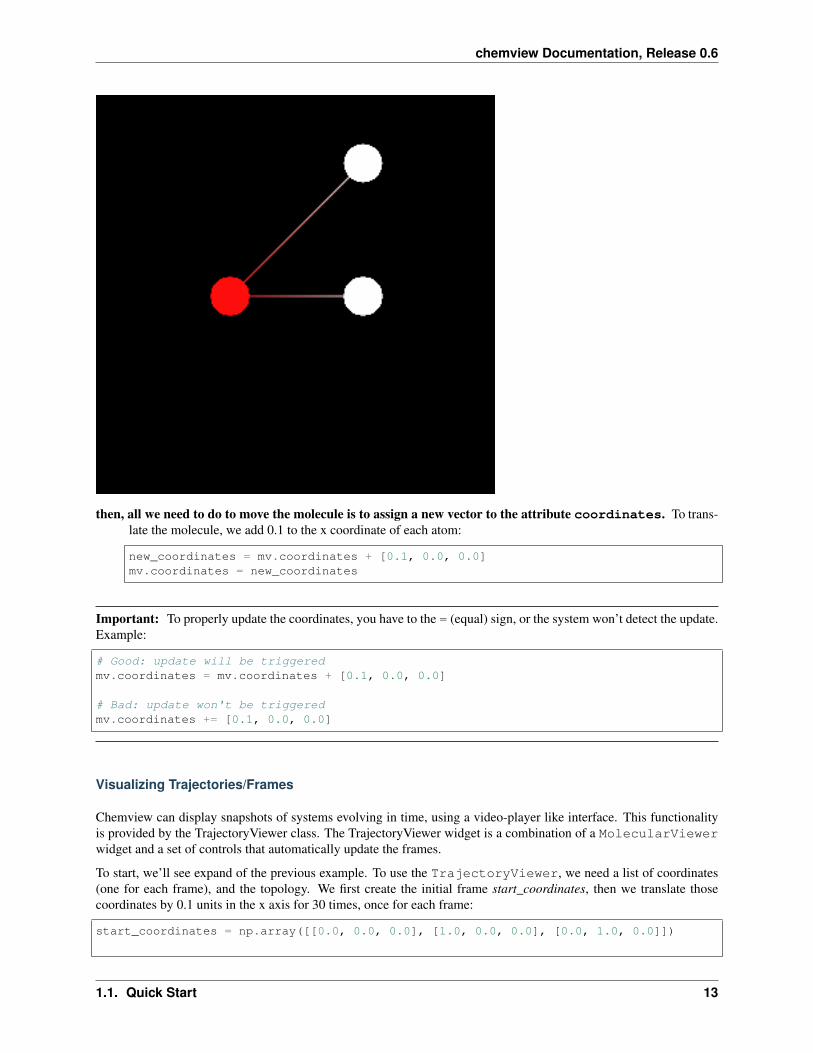
In this section we’ll see how to update the molecular viewer. We’ll start by creating a water molecule using theMolecularViewer:
import numpy as npfrom chemview import MolecularViewer
# Draw a water moleculemv = MolecularViewer(np.array([[0.0, 0.0, 0.0], [1.0, 0.0, 0.0], [0.0, 1.0, 0.0]]),
{'atom_types': ['H', 'O', 'H'],'bonds': [[0, 1], [1, 2]]},
width = 300,height = 300)
mv.points()mv.lines()mv
12 Chapter 1. Installation and Quick Start
chemview Documentation, Release 0.6
then, all we need to do to move the molecule is to assign a new vector to the attribute coordinates. To trans-late the molecule, we add 0.1 to the x coordinate of each atom:
new_coordinates = mv.coordinates + [0.1, 0.0, 0.0]mv.coordinates = new_coordinates
Important: To properly update the coordinates, you have to the = (equal) sign, or the system won’t detect the update.Example:
# Good: update will be triggeredmv.coordinates = mv.coordinates + [0.1, 0.0, 0.0]
# Bad: update won't be triggeredmv.coordinates += [0.1, 0.0, 0.0]
Visualizing Trajectories/Frames
Chemview can display snapshots of systems evolving in time, using a video-player like interface. This functionalityis provided by the TrajectoryViewer class. The TrajectoryViewer widget is a combination of a MolecularViewerwidget and a set of controls that automatically update the frames.
To start, we’ll see expand of the previous example. To use the TrajectoryViewer, we need a list of coordinates(one for each frame), and the topology. We first create the initial frame start_coordinates, then we translate thosecoordinates by 0.1 units in the x axis for 30 times, once for each frame:
start_coordinates = np.array([[0.0, 0.0, 0.0], [1.0, 0.0, 0.0], [0.0, 1.0, 0.0]])
1.1. Quick Start 13
chemview Documentation, Release 0.6
frames = []for i in range(30):
frames.append(start_coordinates + [0.1, 0.0, 0.0])start_coordinates += [0.1, 0.0, 0.0]
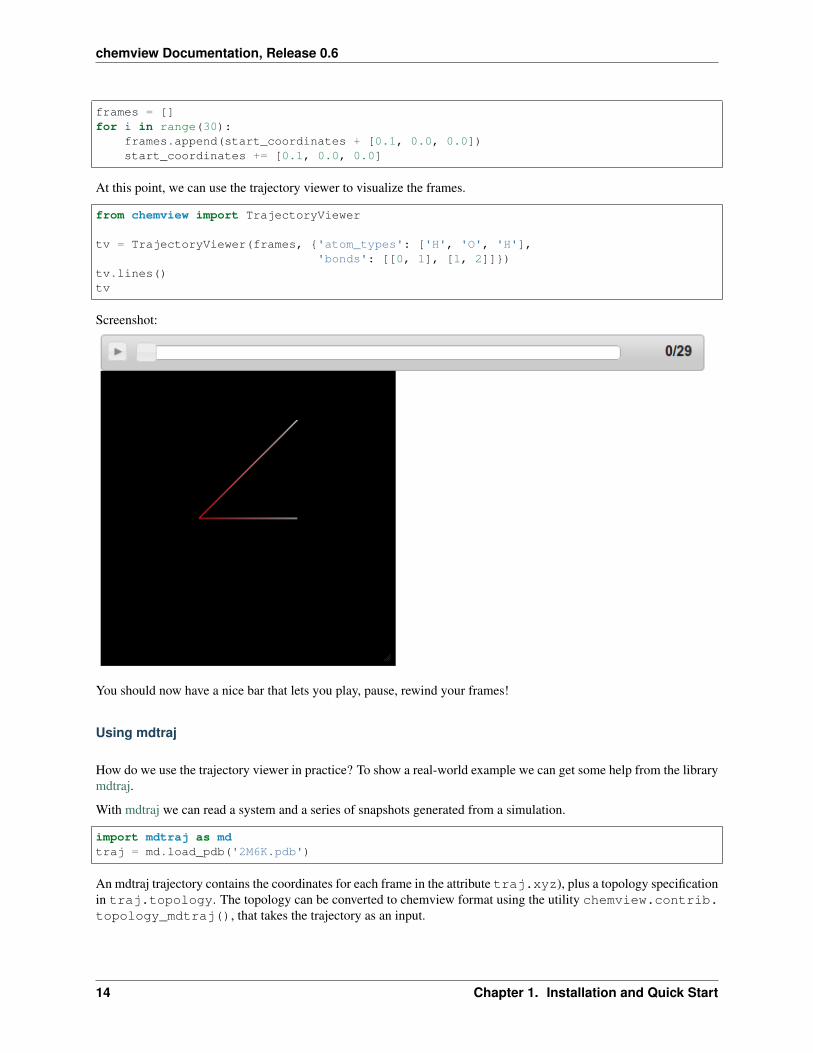
At this point, we can use the trajectory viewer to visualize the frames.
from chemview import TrajectoryViewer
tv = TrajectoryViewer(frames, {'atom_types': ['H', 'O', 'H'],'bonds': [[0, 1], [1, 2]]})
tv.lines()tv
Screenshot:
You should now have a nice bar that lets you play, pause, rewind your frames!
Using mdtraj
How do we use the trajectory viewer in practice? To show a real-world example we can get some help from the librarymdtraj.
With mdtraj we can read a system and a series of snapshots generated from a simulation.
import mdtraj as mdtraj = md.load_pdb('2M6K.pdb')
An mdtraj trajectory contains the coordinates for each frame in the attribute traj.xyz), plus a topology specificationin traj.topology. The topology can be converted to chemview format using the utility chemview.contrib.topology_mdtraj(), that takes the trajectory as an input.
14 Chapter 1. Installation and Quick Start

chemview Documentation, Release 0.6
from chemview.contrib import topology_mdtraj
tv = TrajectoryViewer(traj.xyz, topology_mdtraj(traj))tv.line_ribbon()tv
Screenshot:
Tip: When animating trajectories of big molecules and systems, use simple representations such as lines, pointsand line_ribbon because they are much faster than their “solid” counterparts vdw, ball_and_stick andstrand.
1.1. Quick Start 15
chemview Documentation, Release 0.6
1.1.3 Low Level API
API Reference
Module chemview.widget
class RepresentationViewer(self, width=500, height=500)RepresentationViewer is an IPython notebook widget useful to display 3d scenes through webgl.
Example:
from IPython.display import display
rv = RepresentationViewer()rv.add_representation('point', {'coordinates': coordinates, 'colors': colors,→˓'sizes': sizes})display(rv)
add_representation(self, rep_type, options)Add a 3D representation to the viewer. See User Guide for a complete description of the representationsavailable.
Returns An unique hexadecimal identifier for the representation.
Return type str
remove_representation(self, rep_id)Remove a representation from the viewer
Parameters rep_id (str) – the unique identifier generated by Representation-Viewer.add_representation
update_representation(self, rep_id, options)Update a representation with new data.
Parameters
• rep_id (str) – the unique identifier returned by Representation-Viewer.add_representation
• options (dict) – dictionary containing the updated data.
class TrajectoryControls(self, n_frames, fps=30)Play/Pause controls useful for playing trajectories.
Example:
You can connect a callback to be executed every time the frame changes.
from IPython.display import display
controls = TrajectoryControls(10) # 10 frames
def callback(frame):print("Current frame %d" % frame)
controls.on_frame_change(callback)display(controls)
frameCurrent frame
16 Chapter 1. Installation and Quick Start
chemview Documentation, Release 0.6
n_framesTotal number of frames
fpsFrames per second (defaults to 30)
on_frame_change(self, callback)Connect a callback to be executed every time the frame attribute changes.
Module chemview.viewer
class MolecularViewer(self, coordinates, topology, width=500, height=500)Create a Molecular Viewer widget to be displayed in IPython notebook.
Parameters
• coordinates (np.ndarray) – A numpy array containing the 3D coordinates of theatoms to be displayed
• topology (dict) – A dict specifying the topology as described in the User Guide.
points(self, size=1.0)Display the system as points.
Parameters size (float) – the size of the points.
lines(self)Display the system bonds as lines.
wireframe(self, pointsize=0.2)Display atoms as points of size pointsize and bonds as lines.
ball_and_sticks(self, ball_radius=0.05, stick_radius=0.02)Display the system using a ball and stick representation.
line_ribbon(self)Display the protein secondary structure as a white lines that passes through the backbone chain.
cylinder_and_strand(self)Display the protein secondary structure as a white, solid tube and the alpha-helices as yellow cylinders.
add_isosurface(self, function, isolevel=0.3, resolution=32, style=’wireframe’, color=16777215)Add an isosurface to the current scene.
Parameters
• function (callable) – A function that takes x, y, z coordinates as input and is broad-castable using numpy. Typically simple functions that involve standard arithmetic op-erations and functions such as x**2 + y**2 + z**2 or np.exp(x**2 + y**2+ z**2) will work. If not sure, you can first pass the function through numpy.vectorize. Example: mv.add_isosurface(np.vectorize(f))
• isolevel (float) – The value for which the function should be constant.
• resolution (int) – The number of grid point to use for the surface. An high valuewill give better quality but lower performance.
• style (str) – The surface style, choose between solid, wireframe andtransparent.
• color (int) – The color given as an hexadecimal integer. Example: 0xffffff iswhite.
1.1. Quick Start 17
chemview Documentation, Release 0.6
Module chemview.trajectory
class TrajectoryViewer(self, coordinate_frames, topology, width=500, height=500)Display a trajectory in the IPython notebook.
Parameters
• coordinate_frames (list) – A list containing the positions of the atoms (asnp.ndarray) for each frame.
• topology (dict) – A dictionary specifying the topology
See also:
MolecularViewer
Module chemview.utils
encode_numpy(array)Encode a numpy array as a base64 encoded string, to be JSON serialized.
Returns a dictionary containing the fields: - data: the base64 string - type: the array type - shape:the array shape
get_atom_color(atom_name)
18 Chapter 1. Installation and Quick Start
CHAPTER 2
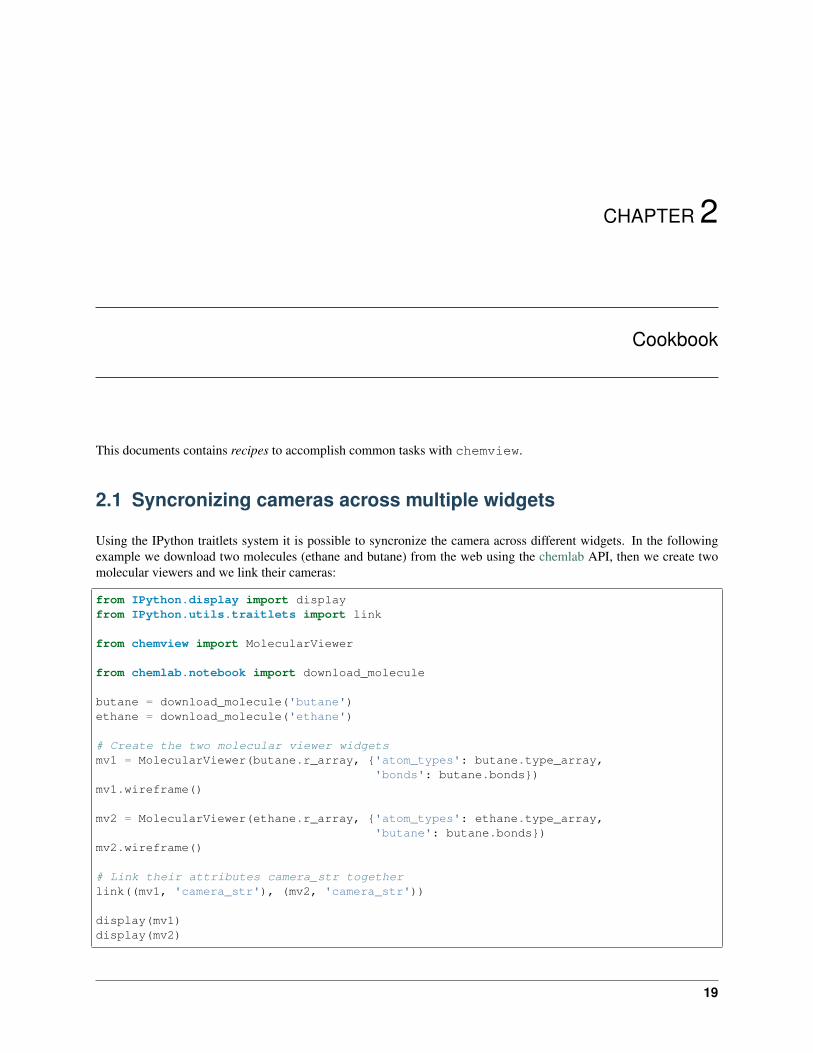
Cookbook
This documents contains recipes to accomplish common tasks with chemview.
2.1 Syncronizing cameras across multiple widgets
Using the IPython traitlets system it is possible to syncronize the camera across different widgets. In the followingexample we download two molecules (ethane and butane) from the web using the chemlab API, then we create twomolecular viewers and we link their cameras:
from IPython.display import displayfrom IPython.utils.traitlets import link
from chemview import MolecularViewer
from chemlab.notebook import download_molecule
butane = download_molecule('butane')ethane = download_molecule('ethane')
# Create the two molecular viewer widgetsmv1 = MolecularViewer(butane.r_array, {'atom_types': butane.type_array,
'bonds': butane.bonds})mv1.wireframe()
mv2 = MolecularViewer(ethane.r_array, {'atom_types': ethane.type_array,'butane': butane.bonds})
mv2.wireframe()
# Link their attributes camera_str togetherlink((mv1, 'camera_str'), (mv2, 'camera_str'))
display(mv1)display(mv2)
19
chemview Documentation, Release 0.6
2.2 Plotting molecular orbitals
chemview is licensed under the LGPL2 and is hosted on github at http://github.com/gabrielelanaro/chemview.
20 Chapter 2. Cookbook
CHAPTER 3
Credits
chemview branched from the mdtraj project in an effort to make trajectory viewing possible in the browser. It isdeveloped mainly by Gabriele Lanaro. While the code is original work, the idea was inspired by iview.
21
chemview Documentation, Release 0.6
22 Chapter 3. Credits
CHAPTER 4
Indices and tables
• genindex
• modindex
• search
23
chemview Documentation, Release 0.6
24 Chapter 4. Indices and tables
Index
Aadd_isosurface() (MolecularViewer method), 17add_representation() (RepresentationViewer method), 16atom_names, 5atom_types, 4
Bball_and_sticks() (MolecularViewer method), 17bonds, 5
Ccylinder_and_strand() (MolecularViewer method), 17cylinders, 11
Eencode_numpy() (built-in function), 18
Ffps (TrajectoryControls attribute), 17frame (TrajectoryControls attribute), 16
Gget_atom_color() (built-in function), 18
Lline_ribbon() (MolecularViewer method), 17lines, 11lines() (MolecularViewer method), 17
MMolecularViewer (built-in class), 17
Nn_frames (TrajectoryControls attribute), 16
Oon_frame_change() (TrajectoryControls method), 17
Ppoints, 11points() (MolecularViewer method), 17
Rremove_representation() (RepresentationViewer method),
16RepresentationViewer (built-in class), 16residue_indices, 5residue_types, 5
Ssecondary_structure, 5smoothline, 12smoothtube, 12spheres, 12
TTrajectoryControls (built-in class), 16TrajectoryViewer (built-in class), 18
Uupdate_representation() (RepresentationViewer method),
16
Wwireframe() (MolecularViewer method), 17
25