Embed Size (px)
Citation preview

April, 2014
For Financial Representatives’ General Information only. Not for inspection by, distribution or quotation to the general public. This document reflects the views of AllianceBernstein and sources
believed by AllianceBernstein L.P. to be reliable as of the dates cited. No representation or warranty is made concerning the accuracy of cited data. Nor is there any guarantee that any projection, forecast or
opinion will be realized. The views expressed may change at any time. References to stocks, securities or investments should not be considered recommendations to buy or sell. The value of investments,
and the income from them, can fall as well as rise and you may not get back the original amount invested. Past performance is not a guide to future performance. The value of overseas securities will be
subject to exchange-rate fluctuations. Under no circumstances should this information be construed as investment advice nor should it be construed as sales or marketing material for any financial
instrument, product or service sponsored or provided by AllianceBernstein or its affiliates or agents.
©2014 AllianceBernstein L.P.
Relatively Stable Value in a Relatively Unstable World AllianceBernstein Fixed Income
Hayden Briscoe
Senior Vice President—Director Asia Pacific Fixed Income

AllianceBernstein.com For financial representative use only. Not for inspection by, distribution or quotation to the general public 1
Video

AllianceBernstein.com For financial representative use only. Not for inspection by, distribution or quotation to the general public
Despite Bad Press, China Provides Stability to the Region
2

AllianceBernstein.com For financial representative use only. Not for inspection by, distribution or quotation to the general public
China Reform: Rebalancing, Not Hard Landing
3
20
25
30
35
40
45
50
55
79 83 87 91 95 99 03 07 11 15 19
(% of GDP)
Investment Rate
Consumption Ratio
Saving Rate
3
Current analysis does not guarantee future results
As of September 30, 2013
Source: CEIC Data, AllianceBernstein and Bernstein Research
0
10
20
30
40
50
60
70
80
90
60 65 70 75 80 85 90 95 00 05 10 15 20 25 30 35 40
(%)
China
South Korea
Taiwan
Japan
Economic Structure Evolvement
Rural Workers’ Share of Total
Employment

AllianceBernstein.com For financial representative use only. Not for inspection by, distribution or quotation to the general public
China Big Trend: Urbanization and Construction
4
The project is on the street ! Jinmao Palace(金茂府) Near Park Hyatt in Beijing Best-selling project last year, by Franshion
2015
2005
2025

AllianceBernstein.com For financial representative use only. Not for inspection by, distribution or quotation to the general public
Vanke 3%
Greenland 2%
Wanda 2%
POLY Real Estate 2%
China Overseas 2%
Country Garden 2%
Evergrande 2%
China Resources Land 1%
Shimao 1%
Greentown 1%
Other 20,000+ 83%
Predictable Path in a Maturing Market
5
Xingrun is a private developer.
90% of Xingrun’s development
is in Fenghua or surrounding
counties.
Only 0.1% share of CNY
6,769.5 billion market.
Source: CEIC, Alliance Bernstein, as of January 30, 2014
Other 20,000+,
83%
Chinese Developers and % Share of Market
Headline: “China Developer Xingrun Can’t Pay Debt”
Top 10 Developers, 17%

AllianceBernstein.com For financial representative use only. Not for inspection by, distribution or quotation to the general public
China’s Role is Changing from a World Manufacturer to a World Banker
6
* Based on data year-to-Oct 2013
As of 17 March 2014.
Source: : ANZ Bank, PBOC Monetary Policy Report, SWIFT and AllianceBernstein
RMB as an International (and Ultimately Reserve) Currency
Central Banks
Announced Plans
to Hold CNY Assets
22 Countries
CNY Bilateral
Cross Currency
Swap Lines
24 banks
CNY2,568 billion
Offshore RMB’s
Role as a “Trade
Currency”
Starting to Grow
Transactions*
8.7%

AllianceBernstein.com For financial representative use only. Not for inspection by, distribution or quotation to the general public
China: On the Road to Becoming a Big World Consumer Market
7
China’s Share of Total Exports of Key Trading Partners
As of 17 March 2014
Source: CEIC and AllianceBernstein
2001 2013
0
5
10
15
20
25
30
35
40
World IN ID KR MY PH SG TW TH AU JP
Pe
rcen
t o
f im
po
rts to
Chin
a

AllianceBernstein.com For financial representative use only. Not for inspection by, distribution or quotation to the general public
History Repeats Itself
8
From Bank of England… …to the Fed… …to PBOC?

AllianceBernstein.com For financial representative use only. Not for inspection by, distribution or quotation to the general public 9
Asian Countries are Relatively Stable

AllianceBernstein.com For financial representative use only. Not for inspection by, distribution or quotation to the general public
The Biggest Risks In Emerging Markets Are Political
10
What does the future hold for Ukraine and
Russia?
Will Maduro maintain his iron
grip on Venezuela?
Will Argentina
ever reform?
Will scandal push Turkey
in a new direction?
Will World Cup 2014 be a
success or failure for Brazil?

AllianceBernstein.com For financial representative use only. Not for inspection by, distribution or quotation to the general public
Asia Lessons Learnt From Their Own Crisis
11
Historical analysis and current estimates do not guarantee future results.
As of 31 December 2013
Source: IMF and AllianceBernstein
(10)
(5)
0
5
10
15
20
Bela
rus
Tu
rkey
Ukra
ine
Moro
cco
Georg
ia
South
Afr
ica
Peru
Sri
Lan
ka
Ch
ile
India
Indo
nesia
Bra
zil
Co
lom
bia
Pola
nd
US
Egypt
Rom
ania
Mexic
o
Arg
entina
Th
aila
nd
Alg
eria
Hu
ng
ary
Chin
a
Phili
ppin
es
Vene
zuela
Russia
Mala
ysia
Kore
a
Vie
tnam
Ta
iwan
Sin
gapore
% GDP
US EEMEA
Latam Asia
Asian Countries Tend to have Current Account Surpluses

AllianceBernstein.com For financial representative use only. Not for inspection by, distribution or quotation to the general public
Which Countries Are Better Off Today Than 10 Years Ago?
12
Comm. Exporters Comm. Importers
Ch
an
ges i
n F
un
dam
en
tals
Better
Colombia
Peru
Indonesia
Mexico
Kazakhstan
Brazil
Turkey
Thailand
Poland
Romania
Philippines
Korea
Hungary
Singapore
No
Change
Chile
China, India, Taiwan
Worse
Russia
Malaysia
South Africa
Argentina
Venezuela
Ukraine
Egypt
Pakistan
Czech Republic
Based on a weighted average of indicators showing improvement or deterioration during 2003-13 in trend growth, national savings rate, net public debt to GDP, GEFR to FX reserves, institutional
quality and ease of doing business.
Source: AllianceBernstein

AllianceBernstein.com For financial representative use only. Not for inspection by, distribution or quotation to the general public
Asia Currency Basket Is Remarkably Stable
13
40
50
60
70
80
90
100
110
120
130
0
50
100
150
200
250
300
350
400
450
03 04 05 06 07 08 09 10 11 12 13 14
Currency Index and Commodity Price 2003–2014
Asia
LatAm
EMEA
Commodity Price (Left Scale)
Asia Currency
Moves in a Range
Historical analysis and current estimates do not guarantee future results.
As of 28 February 2014. Asia Currency index and LatAm Currency index are respectively represented by JP Morgan Asia and Latin America Currency Index. EMEA index is represented by
BOAML EMEA Currency Index.
Source: Bloomberg and AllianceBernstein

AllianceBernstein.com For financial representative use only. Not for inspection by, distribution or quotation to the general public
Currency Butterfly Strategy—to Further Manage the Volatility
14
Lower Beta
• CNH
• TWD
• HKD
Middle
• MYR
• THB
• SGD
• KRW
• PHP
Higher Beta
• IDR
• INR
Past analysis does not guarantee future results.
As of 13 March 2014
Source: Bloomberg and AllianceBernstein
Asia Currency Index 2012-2014
Reduce
Neutral
Take
104
106
108
110
112
114
116
118
120
122
Jun09 Dec09 Jun10 Dec10 Jun11 Dec11 Jun12 Dec12 Jun13 Dec13

AllianceBernstein.com For financial representative use only. Not for inspection by, distribution or quotation to the general public
0
2
4
6
8
10
12
US
Sin
gap
ore
Ho
ng
Ko
ng
Ta
iwa
n
Au
str
alia
Ne
w Z
ea
land
Ma
laysia
So
uth
Ko
rea
Chin
a
Th
aila
nd
Ph
ilip
pin
es M
id
Ind
ia
Ind
on
esia
Sri L
an
ka
Pa
kis
tan
Vie
tna
m
0.0%
0.5%
1.0%
1.5%
2.0%
2.5%
3.0%
Jan11 Jul11 Jan12 Jul12 Jan13 Jul13 Jan14
Annualiz
ed Y
ield
Asia Local Market Strategy: Positive Carry Is a Sweetener
15
Interest Rate Differentials: Asia Pacific vs. US
FX Forwards: Implied Annualized Interest Carry
Past analysis does not guarantee future results.
As of 28 February 2014
Source: Bloomberg and AllianceBernstein
FX Forward Annualized Yield
(Carry) Rolling 2 years
Carry from Interest
rate differentials
Historical Average

AllianceBernstein.com For financial representative use only. Not for inspection by, distribution or quotation to the general public
0
100
200
300
400
500A
AA
AA
+
AA
AA
–
A+ A
A–
BB
B+
BB
B
BB
B–
BB
+
BB
BB
–
B+ B
B–
CC
C+
CC
C
CC
C–
South Korea
Asia Is Not an Emerging Market Any Longer
16
1 basis point = 1/100 of a percent
Pre-Crisis data is as of 31 Dec. 2005.
The rating is calculated as the highest of the S&P and Moody’s ratings.
Source: Bloomberg, S&P and Moody’s
Indonesia
Pre-Crisis Credit Spreads and Ratings
Indonesia
Malaysia
China
Thailand
Philippines
Australia
Japan
Russia
Turkey
5 Y
ear
CD
S in B
asis
Poin
ts
Ireland Germany US Spain
France The Netherlands UK
Austria
Portugal Italy
Hungary Greece
Mexico Poland
India
Hong Kong
Developed Markets Emerging Markets

AllianceBernstein.com For financial representative use only. Not for inspection by, distribution or quotation to the general public
0
100
200
300
400
500A
AA
AA
+
AA
AA
–
A+ A
A–
BB
B+
BB
B
BB
B–
BB
+
BB
BB
–
B+ B
B–
CC
C+
CC
C
CC
C–
Australia
Russia
Turkey
5 Y
ear
CD
S in B
asis
Poin
ts
Ireland Germany US Spain
France The Netherlands UK
Austria
Portugal Italy
Hungary Greece
Mexico Poland
Thailand
Asia Is Not an Emerging Market Any Longer
17
Today’s data is as of 13 Mar. 2014.
The rating is calculated as the lowest of the S&P and Moody’s ratings.
Source: Bloomberg, S&P and Moody’s
Credit Spreads and Ratings Today
5 Y
ear
CD
S in B
asis
Poin
ts
Developed Markets Emerging Markets
Indonesia
Malaysia
China South Korea
Australia
Russia
Turkey
Ireland Germany US Spain
France The Netherlands UK
Austria
Portugal Italy
Hungary Greece
Mexico Poland
Philippines
Japan
Hong Kong
India

AllianceBernstein.com For financial representative use only. Not for inspection by, distribution or quotation to the general public 18
Capturing Asian Opportunities in an Unstable World
AllianceBernstein.com For financial representative use only. Not for inspection by, distribution or quotation to the general public
0
1
2
3
4
5
6
08 09 10 11 12 13
Yie
ld
Japan
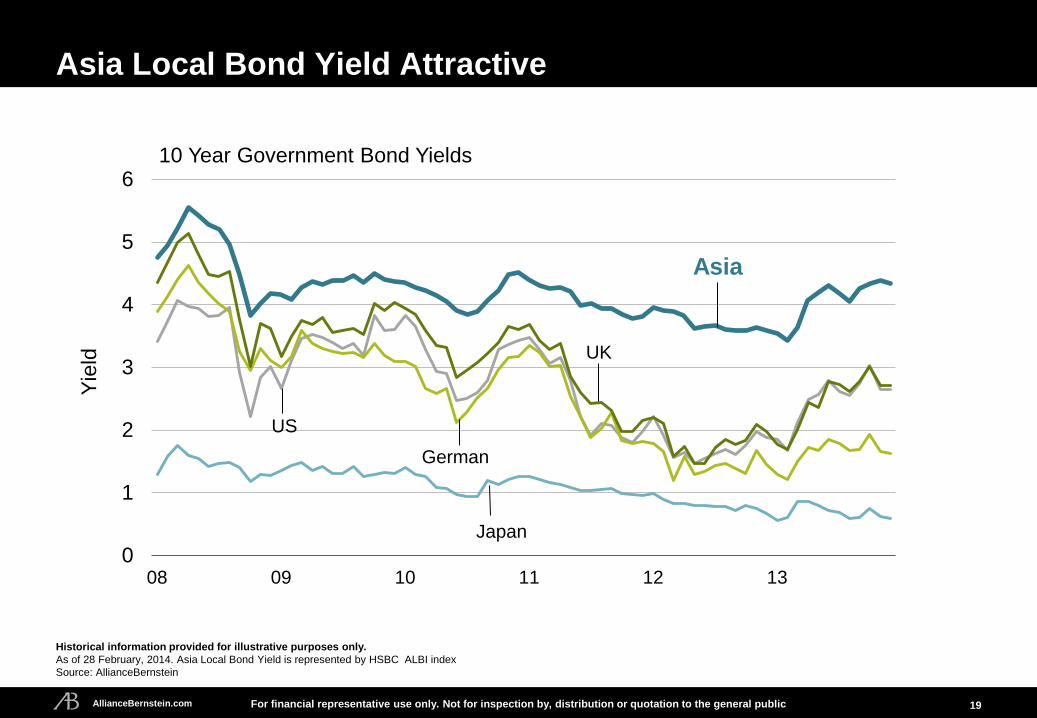
Asia Local Bond Yield Attractive
19
Historical information provided for illustrative purposes only.
As of 28 February, 2014. Asia Local Bond Yield is represented by HSBC ALBI index
Source: AllianceBernstein
10 Year Government Bond Yields
Asia
US
UK
German

AllianceBernstein.com For financial representative use only. Not for inspection by, distribution or quotation to the general public
3
4
5
6
7
8
9
10 11 12 13 14
Asian Local Bond Opportunity: Indonesia
20
Drastic Swing in Trade Account to
Surplus Position Trade Balance
Historical analysis and current forecasts do not guarantee future results.
As of 21 February 2014
Source: CEIC and AllianceBernstein
-3
-2
-1
0
1
2
3
4
09 10 11 12 13
CPI Correction Will Provide
Room for Rate Easing Policy Rate vs. CPI
US
D B
illio
ns
Perc
ent
Policy Rate
CPI
Forecast

AllianceBernstein.com For financial representative use only. Not for inspection by, distribution or quotation to the general public
Asian Investment Grade Credit: Underappreciated Government and Corporate Linkages
21
1 basis point = 1/100 of a percent
Past performance does not guarantee future results.
As of 21 March 21 2014
Global Investment Grade Credit is Barclays Global Aggregate Credit Index, Asia Investment Grade Credit is J.P. Morgan JACI Investment Grade
Source: Barclays, J.P. Morgan, Moody’s, Morgan Stanley and AllianceBernstein
Investment Grade Credit Spread Historical Average 10 Year
Cumulative Default Rates
2 3 7
19
36
54
0 1 2 6
16
35
Aa A Baa Ba B Caa–C
Global 1920–2011 APAC 1993–2011
0
100
200
300
400
500
600
700
800
05 06 07 08 09 10 11 12 13
Spre
ad (
Basis
Poin
ts)
Barclays Global Agg Corp
JACI Corp IG

AllianceBernstein.com For financial representative use only. Not for inspection by, distribution or quotation to the general public
5.9
6.0
6.1
6.2
6.3
6.4
6.5Ja
n-1
2
Mar
-12
May
-12
Jul-
12
Sep
-12
No
v-1
2
Jan
-13
Mar
-13
May
-13
Jul-
13
Sep
-13
No
v-1
3
Jan
-14
Mar
-14
Spot Rate
Lower Band
Upper Band
USD/CNY
Band Widening in 2012
(from +/-0.5% to +/-1%) Band Widening in 2014
(from +/-1% to +/-2%)
China Exchange Rates: If History Is A Guide, The Change in Fixing Will Reverse To Appreciation
22
As of March 18, 2014
Source: CEIC, Alliance Bernstein

AllianceBernstein.com For financial representative use only. Not for inspection by, distribution or quotation to the general public
0
5
10
15
20
25
30
35
40
45
0
500
1,000
1,500
2,000
2,500
3,000
3,500
05 06 07 08 09 10 11 12 13 14
Perc
ent C
hange
US
D B
illio
n
FX Reserves*
RMB/USD*
(right scale)
China RMB Currency Appreciation 33%, BUT FX Reserves Up +500% Since 2005
23
Historical analysis does not guarantee future results.
*China changed FX regime to a managed float from a 10-year straight peg in July 2005. As of 31 December 2013
**As of 31 January 2014.
Source: CEIC Data and AllianceBernstein
Current Account Surplus** Cumulative Change of FX
Reserves and RMB/USD
China Trade surplus
(12-month rolling sum)
100
150
200
250
300
350
06 07 08 09 10 11 12 13 14
US
D B
illio
n

AllianceBernstein.com For financial representative use only. Not for inspection by, distribution or quotation to the general public
0
1
2
3
4
5
Dec 10 Apr 11 Aug 11 Dec 11 Apr 12 Jul 12 Nov 12 Mar 13 Jul 13 Oct 13 Feb 14
Yie
ld
China Bond Strategy: Dim Sum Market Yields Normalization
24
China Onshore Government Bond Yield
Dim Sum Government Bond Yield
As of 21 March 2014
Source: HSBC , Bloomberg
Today’s Challenge: Dim Sum yields low relative to onshore

AllianceBernstein.com For financial representative use only. Not for inspection by, distribution or quotation to the general public
* China Income Portfolio Characteristics 3 Years Duration, Government & Policy Bank Exposure
Yield 5.20%
0.0%
1.0%
2.0%
3.0%
4.0%
5.0%
6.0%
7.0%
JG
B's
US
Govt
bo
nds
Euro
Agg
.(g
ovt/cre
dit)
US
Ag
g. (g
ovt/cre
dit)
UK
Ag
g. (g
ovt/cre
dit)
Asia
n L
oca
l B
on
ds
CH
INA
Inco
me
US
Hig
h Y
ield
EM
Bon
ds (
Plu
s)
Build Income in China
0
1
2
3
4
5
6
2008 2009 2010 2011 2012 2013
Yie
ld
US Japanese German
UK Chinese
Chinese Onshore Bonds: Attractive Yields and You’re Not Invested!
25
Erin
Fuller
* A model portfolio for illustration purpose only.
Historical analysis does not guarantee future results.
Through 31 March 2014. Emerging Market Bonds (Plus) is represented by JP Morgan EMBI+ index. Others bond index are represented by responding Barclays bond index.
Source: Barclays, JPMorgan, Alliance Bernstein, Bloomberg and Citi Group
Yields Are Attractively Priced: 5 Year Government Bond Yields
0
1
2
3
4
5
6
2008 2009 2010 2011 2012 2013
Yie
ld
Build Income in China
0.0%
1.0%
2.0%
3.0%
4.0%
5.0%
6.0%
7.0%
JG
B's
US
Govt
bo
nds
Euro
Agg
.(g
ovt/cre
dit)
US
Ag
g. (g
ovt/cre
dit)
UK
Ag
g. (g
ovt/cre
dit)
Asia
n L
oca
l B
on
ds
CH
INA
Inco
me
US
Hig
h Y
ield
EM
Bon
ds (
Plu
s)

AllianceBernstein.com For financial representative use only. Not for inspection by, distribution or quotation to the general public 26
A Word About Risk
Fixed-Income Securities Risk. Investment in the fixed-income portfolios entails certain risks. Past performance is
not a guide to future performance. Investment returns and principal value of these funds will fluctuate so that an
investor’s shares, when redeemed, may be worth more or less than their original cost. The value of underlying
fixed-income investments of a portfolio can vary dramatically, in response to the activities and results of individual
companies or because of general market and economic conditions and changes in currency exchange rates. The
value of a portfolio’s investments may decline over short- or long-term periods. Specific fixed-income risks include
interest rate risk, lower-rated and unrated investments risk, prepayment risk, sovereign debt obligations risk,
corporate debt risk. These and other risks are described in a fund’s prospectus. Prospective investors should read
the prospectus carefully and discuss risk and the portfolio’s fees and charges with their financial adviser to
determine if the investment is appropriate for them.
This document is provided for informational purposes only and is not intended to be an offer or solicitation, or the
basis for any contract to purchase or sell any security or other instrument, or for AllianceBernstein to enter into or
arrange any type of transaction as a consequence of any information contained herein. Under no circumstances
may any information contained herein be construed as investment advice.
The information herein reflects prevailing market conditions and our judgments as of the date of the presentation,
which are subject to change. In preparing this presentation, we have relied upon and assumed, without
independent verification, the accuracy and completeness of all information available from public sources. No
representation or warranty is made concerning the accuracy of cited data. Opinions and estimates may be
changed without notice and involve a number of assumptions which may not prove valid. In addition, there can be
no guarantee that any projection, forecast or opinion in these materials will be realised. Neither this presentation
nor any of its contents may be used for any purpose without the consent of AllianceBernstein.

AllianceBernstein.com For financial representative use only. Not for inspection by, distribution or quotation to the general public
Disclosures and Important Information
27
Past performance is not a guide to future performance. The value of investments and the income from them can fall as well as rise and you may not get back the original amount invested. The value of non-domestic securities may be subject to exchange-rate fluctuations. The views and opinions expressed in this presentation are based on AllianceBernstein’s internal forecasts and should not be relied upon as an indication of future market performance or any guarantee of return from an investment in any AllianceBernstein services. Disclosure on Security Examples References to specific securities are presented to illustrate the application of our investment philosophy only and are not to be considered recommendations by AllianceBernstein. The specific securities identified and described in this presentation do not represent all of the securities purchased, sold or recommended for the portfolio, and it should not be assumed that investments in the securities identified were or will be profitable. AllianceBernstein® and the AB logo are registered trademarks and service marks used by permission of the owner, AllianceBernstein L.P. ©2014 AllianceBernstein L.P. www.alliancebernstein.com

AllianceBernstein ® and the AB logo are registered trademarks and service marks used by permission of the owner, AllianceBernstein L.P.
© 2014 AllianceBernstein L.P.
www.alliancebernstein.com 14-0022