Embed Size (px)
Citation preview
CARDIOVASCULAR ULTRASOUND
Ishihara et al. Cardiovascular Ultrasound 2012, 10:32http://www.cardiovascularultrasound.com/content/10/1/32
RESEARCH Open Access
Relationship among coronary plaque compliance,coronary risk factors and tissue characteristicsevaluated by integrated backscatter intravascularultrasoundYoshiyuki Ishihara, Masanori Kawasaki*, Arihiro Hattori, Hajime Imai, Shigekiyo Takahashi, Hironobu Sato,Tomoki Kubota, Munenori Okubo, Shinsuke Ojio, Kazuhiko Nishigaki, Genzou Takemura, Hisayoshi Fujiwaraand Shinya Minatoguchi
Abstract
Background: The purpose of the present study was to evaluate the mechanical properties of coronary plaques andplaque behavior, and to elucidate the relationship among tissue characteristics of coronary plaques, mechanicalproperties and coronary risk factors using integrated backscatter intravascular ultrasound (IB-IVUS).
Methods: Non-targeted plaques with moderate stenosis (plaque burden at the minimal lumen site: 50-70%)located proximal to the site of the percutaneous coronary intervention target lesions were evaluated by IB-IVUS.Thirty-six plaques (less calcified group: an arc of calcification ≤10°) in 36 patients and 22 plaques (moderatelycalcified group: 10° < an arc of calcification ≤60°) in 22 patients were evaluated. External elastic membrane volume(EEMV) compliance, lumen volume (LV) compliance, plaque volume (PV) response (difference between PV in systoleand diastole), EEM area stiffness index were measured at the minimal lumen site. Relative lipid volume (lipidvolume/internal elastic membrane volume) was calculated by IB-IVUS.
Results: In the less calcified group, there was a significant correlation between EEMV compliance and the relative lipidvolume (r = 0.456, p = 0.005). There was a significant inverse correlation between EEM area stiffness index and therelative lipid volume (p = 0.032, r = −0.358). The LV compliance and EEM area stiffness index were significantly differentin the diabetes mellitus (DM) group than in the non-DM group (1.32 ± 1.49 vs. 2.47 ± 1.79%/10 mmHg, p =0.014 and28.3 ± 26.0 vs. 15.7 ± 17.2, p =0.020). The EEMV compliance and EEM area stiffness index were significantly different inthe hypertension (HTN) group than in the non-HTN group (0.77 ± 0.68 vs. 1.57 ± 0.95%/10 mmHg, p =0.012 and26.5 ± 24.3 vs. 13.0 ± 16.7, p =0.020). These relationships were not seen in the moderately calcified group.
Conclusion: The present study provided new findings that there was a significant correlation between mechanicalproperties and tissue characteristics of coronary arteries. In addition, our results suggested that the EEMV complianceand the LV compliance were independent and the compliance was significantly impaired in the patients with DM and/or HTN. Assessment of coronary mechanical properties during PCI may provide us with useful information regardingthe risk stratification of patients with coronary heart disease.
Keywords: Coronary artery disease, Intravascular ultrasound, Plaque, Stiffness, Tissue
* Correspondence: [email protected] of Cardiology, Gifu University Graduate School of Medicine, 1-1Yanagido, Gifu 501-1194, Japan
© 2012 Ishihara et al.; licensee BioMed Central Ltd. This is an Open Access article distributed under the terms of the CreativeCommons Attribution License (http://creativecommons.org/licenses/by/2.0), which permits unrestricted use, distribution, andreproduction in any medium, provided the original work is properly cited.
Ishihara et al. Cardiovascular Ultrasound 2012, 10:32 Page 2 of 10http://www.cardiovascularultrasound.com/content/10/1/32
IntroductionAtherosclerotic changes consist of both a structural(atherosis) and functional (sclerosis) component. Apathological study in elastic arteries such as the carotidartery has shown that sclerotic changes are reflected bya decrease in vessel extensibility due to the degenerationof elastic and collagen fibers, whereas atherotic changesare reflected by an increase in plaque volume [1]. How-ever, relationship between tissue components and themechanical properties of coronary arteries with ather-omatous changes have not been adequately investigated.Intravascular ultrasound (IVUS) allows cross-sectional
imaging of coronary arteries and provides a comprehen-sive assessment of atherosclerotic plaques in vivo [2,3].We previously reported that integrated backscatter (IB)-IVUS had high sensitivity and specificity (90-95%) forthe tissue characterization of coronary plaques usinghistology as a gold standard [3-6]. In those studies, weconstructed two-dimensional (2D) or three-dimensional(3D) color-coded maps of plaque components based onthe IB values [4-9].The purpose of the present study was to evaluate the
mechanical properties of coronary arteries and plaquebehavior, and to elucidate the relationship among mech-anical properties, tissue characteristics of coronary pla-ques and coronary risk factors using IB-IVUS.
MethodsSubjected patients and coronary plaquesWe enrolled 150 consecutive patients with stable anginapectoris that underwent percutaneous coronary inter-vention (PCI) to the left anterior descending arteries andleft circumflex arteries. Right coronary arteries wereexcluded because they often have ectasia that resultsfrom medial replacement of smooth muscle cells withhyalinized collagen and this is not typical coronary ath-erosclerotic lesions [10]. Patients were excluded if theyhad unstable angina or myocardial infarction within theprevious 3 months, an ejection fraction ≤30%, atrial fib-rillation or frequent ventricular premature beat. Patientswith low systolic pressure (≤100 mmHg) duringcatheterization were also excluded. Non-targeted pla-ques with moderate stenosis (plaque burden at the min-imal lumen site: 50-70%) located proximal to the site ofthe PCI target lesions were evaluated, because previousIVUS studies demonstrated that there is a significant re-lationship between plaque burden and arterial luminalcompliance [11,12].Proximal lesions in the left anterior descending arter-
ies and left circumflex arteries (#6 and #11) wereselected, since the previous study demonstrated thatproximal and distal pressures in atheromatous coronaryarteries without clinically significant stenosis vary inpressure by 5 mmHg [13]. Plaques with an arc of
calcification >60° were excluded because acoustic shadowdue to calcification affected rigorous measurement ofplaque and vessel area. Plaques which imaging quality wasnot adequate for analysis were also excluded. Finally,thirty-six plaques (less calcified group: an arc of calcifica-tion ≤10°) with moderate stenosis (plaque burden at min-imal lumen site: 50-70%) in 36 patients and 22 plaques(moderately calcified group: 10° < an arc of calcification≤60°) with moderate stenosis (plaque burden at minimallumen site: 50-70%) in 22 patients were analyzed(Figure 1). Risk factors for coronary artery disease wereevaluated in enrolled patients, including hypertension(HTN) (medication-dependent or systolic BP ≥140 and/or diastolic BP ≥90 mmHg), type 2 diabetes mellitus(DM) (medication-dependent or hemoglobin (Hb) A1c ≥6.5%), dyslipidemia (DL) (medication-dependent, LDLcholesterol ≥140 mg/dl and/or HDL cholesterol <40 mg/dl) and current smoking. The protocol was approved bythe institutional ethics committees, and informed con-sent was obtained from each patient.
Integrated backscatter intravascular ultrasound systemand data acquisitionAn IVUS imaging system (VISIWAVE, Terumo, Japan)was used to obtain cross-sectional IB-IVUS images. Ultra-sound backscattered signals were acquired using a 38 MHzmechanically-rotating IVUS catheter (ViewIT, Terumo,Tokyo, Japan). The details of the system and its clinicalusefulness have been reported previously [6-9,14]. Electro-cardiographic (ECG) data were continuously displayed onconventional IVUS images. The values for systemic pres-sure were obtained from the tip of the guiding catheter(6–7 Fr) in the ostium of the left main coronary trunkand were continuously displayed on the monitor. Allvasoactive medications were discontinued at least 12hours before catheterization.We administered an optimal dose of intracoronary iso-
sorbide dinitrate before the measurements for the pre-vention of coronary spasm. The IVUS catheter wasadvanced into the coronary artery and IB-IVUS imageswere acquired at the site of plaques which plaque bur-den at the minimal lumen site was within 50-70%. Allmeasurements were performed 3–5 minutes after theadministration of isosorbide dinitrate, since vasoactivemedication can affect coronary distensibility for at leasttwo minutes [15,16].The position and axis of IVUS might have slightly
changed during the cardiac cycle, preventing rigorousmeasurement of coronary compliance. Therefore, weperformed volumetric analysis using three cross-sections(0.5 mm proximally, and distally to the site of minimallumen diameter). That is, thickness of analyzed lesionwas one millimeter. Cross-sectional images were quanti-fied for lumen volume (LV), external elastic membrane
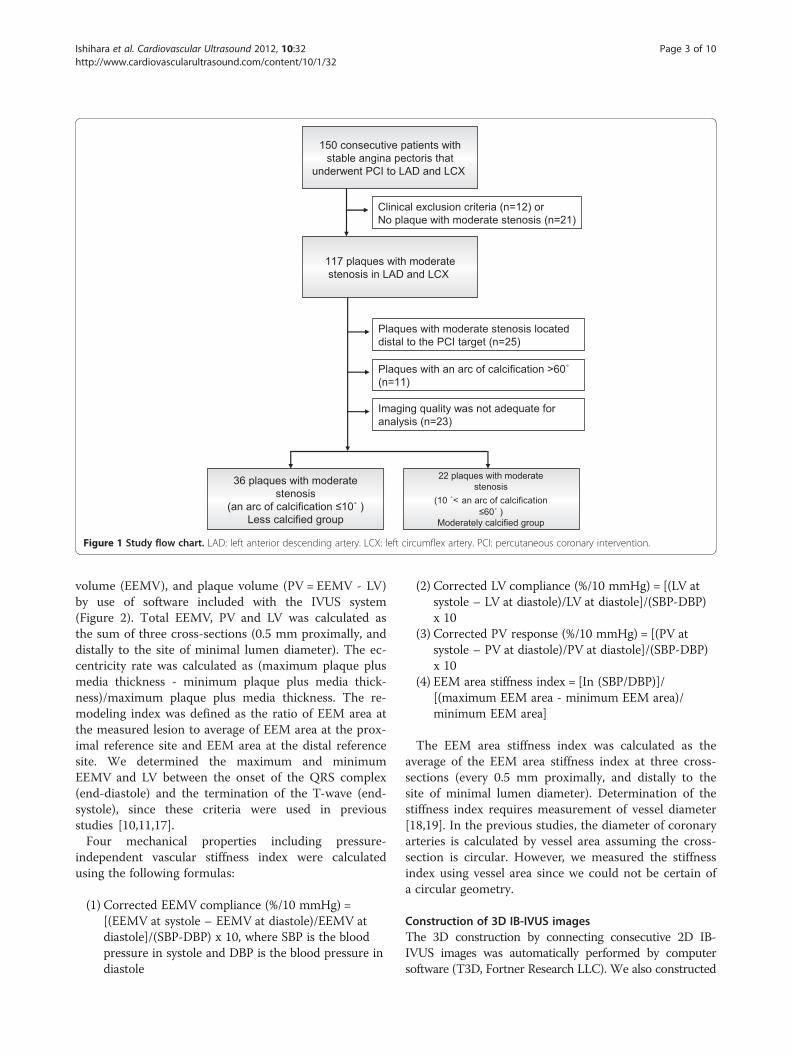
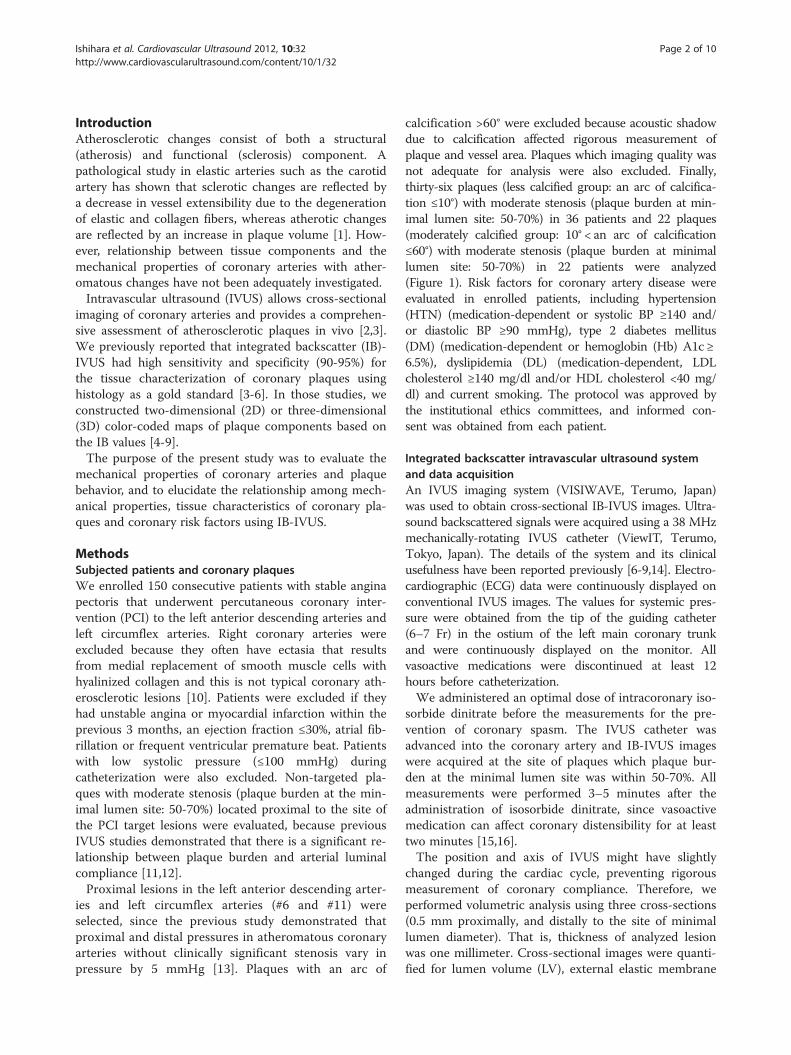
Figure 1 Study flow chart. LAD: left anterior descending artery. LCX: left circumflex artery. PCI: percutaneous coronary intervention.
Ishihara et al. Cardiovascular Ultrasound 2012, 10:32 Page 3 of 10http://www.cardiovascularultrasound.com/content/10/1/32
volume (EEMV), and plaque volume (PV = EEMV - LV)by use of software included with the IVUS system(Figure 2). Total EEMV, PV and LV was calculated asthe sum of three cross-sections (0.5 mm proximally, anddistally to the site of minimal lumen diameter). The ec-centricity rate was calculated as (maximum plaque plusmedia thickness - minimum plaque plus media thick-ness)/maximum plaque plus media thickness. The re-modeling index was defined as the ratio of EEM area atthe measured lesion to average of EEM area at the prox-imal reference site and EEM area at the distal referencesite. We determined the maximum and minimumEEMV and LV between the onset of the QRS complex(end-diastole) and the termination of the T-wave (end-systole), since these criteria were used in previousstudies [10,11,17].Four mechanical properties including pressure-
independent vascular stiffness index were calculatedusing the following formulas:
(1) Corrected EEMV compliance (%/10 mmHg) =[(EEMV at systole – EEMV at diastole)/EEMV atdiastole]/(SBP-DBP) x 10, where SBP is the bloodpressure in systole and DBP is the blood pressure indiastole
(2) Corrected LV compliance (%/10 mmHg) = [(LV atsystole – LV at diastole)/LV at diastole]/(SBP-DBP)x 10
(3) Corrected PV response (%/10 mmHg) = [(PV atsystole – PV at diastole)/PV at diastole]/(SBP-DBP)x 10
(4) EEM area stiffness index = [In (SBP/DBP)]/[(maximum EEM area - minimum EEM area)/minimum EEM area]
The EEM area stiffness index was calculated as theaverage of the EEM area stiffness index at three cross-sections (every 0.5 mm proximally, and distally to thesite of minimal lumen diameter). Determination of thestiffness index requires measurement of vessel diameter[18,19]. In the previous studies, the diameter of coronaryarteries is calculated by vessel area assuming the cross-section is circular. However, we measured the stiffnessindex using vessel area since we could not be certain ofa circular geometry.
Construction of 3D IB-IVUS imagesThe 3D construction by connecting consecutive 2D IB-IVUS images was automatically performed by computersoftware (T3D, Fortner Research LLC). We also constructed
Figure 2 Intravascular ultrasound images of coronary arteries. (A) Gray scale images in systole. (B) Gray scale images in diastole at the samesite as (A). (C) Integrated backscatter intravascular ultrasound images at the same site as (A) and (B). (Upper) Representative cross-sectionalimages that showed reduction of plaque area from diastole to systole. (Lower) Representative cross-sectional images that showed increment ofplaque area from diastole to systole.
Ishihara et al. Cardiovascular Ultrasound 2012, 10:32 Page 4 of 10http://www.cardiovascularultrasound.com/content/10/1/32
a 3D plaque response map by changing color range of the3D IB-IVUS color-coded maps. Of the 36 lesions evaluated,3D color-coded maps were constructed for five plaqueswhich plaque burden of 17 cross-sections (every 1 mm axialinterval for 8 mm proximally, and distally to the site of min-imal lumen diameter) were within 50-70% by connectingthe results of 17 cross-sections.
Reproducibility and reliability of HU measurementsWe determined the interobserver variability of LV using20 randomly-selected LV and EEMV that were measuredby two observers in a blinded way. Likewise, we deter-mined the intraobserver variability of LV and EEMVusing 20 randomly-selected cross-sections that weremeasured twice by one observer with a 7-day intervalbetween the two measurements. We determined thestandard deviation of relative lipid area during the car-diac cycle using 20 randomly-selected cross-sections.
Statistical analysesData are reported as mean ± standard deviation (SD). Nor-mality of distribution was tested using the Kolmogorov-
Smirnov test. The significance of the differences betweengroups that were normally distributed and had similar var-iances was tested by an unpaired Student’s t test. Other-wise, Mann–Whitney U test was used to compare thedifference between groups. Categorical data were summar-ized as percentages and compared using a Chi-square testor Fisher exact test. The relationships between the mech-anical properties and the relative lipid pool were tested forsignificance by linear regression analysis. A p value <0.05was considered statistically significant. Statistical analyseswere performed using Stat View version 5.0 (SAS InstituteInc, Cray, NC).
ResultsPatient characteristicsAll patients underwent IB-IVUS analysis in non-targetlesions without any complications. The patients’ charac-teristics are shown in Table 1. Age and medication withstatin in the moderately calcified group were signifi-cantly higher than in the less calcified group. The totalcholesterol level and LDL cholesterol level in the lesscalcified group was significantly higher than those in the
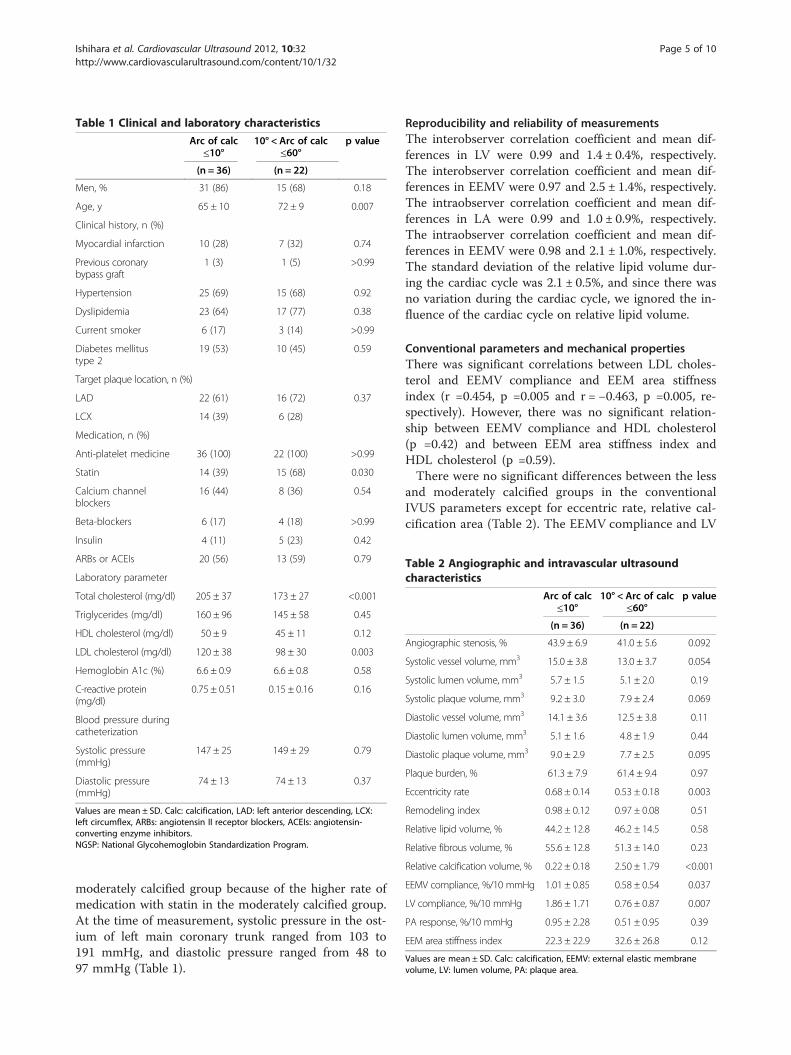
Table 1 Clinical and laboratory characteristics
Arc of calc≤10°
10° < Arc of calc≤60°
p value
(n = 36) (n = 22)
Men, % 31 (86) 15 (68) 0.18
Age, y 65 ± 10 72 ± 9 0.007
Clinical history, n (%)
Myocardial infarction 10 (28) 7 (32) 0.74
Previous coronarybypass graft
1 (3) 1 (5) >0.99
Hypertension 25 (69) 15 (68) 0.92
Dyslipidemia 23 (64) 17 (77) 0.38
Current smoker 6 (17) 3 (14) >0.99
Diabetes mellitustype 2
19 (53) 10 (45) 0.59
Target plaque location, n (%)
LAD 22 (61) 16 (72) 0.37
LCX 14 (39) 6 (28)
Medication, n (%)
Anti-platelet medicine 36 (100) 22 (100) >0.99
Statin 14 (39) 15 (68) 0.030
Calcium channelblockers
16 (44) 8 (36) 0.54
Beta-blockers 6 (17) 4 (18) >0.99
Insulin 4 (11) 5 (23) 0.42
ARBs or ACEIs 20 (56) 13 (59) 0.79
Laboratory parameter
Total cholesterol (mg/dl) 205 ± 37 173 ± 27 <0.001
Triglycerides (mg/dl) 160 ± 96 145 ± 58 0.45
HDL cholesterol (mg/dl) 50 ± 9 45 ± 11 0.12
LDL cholesterol (mg/dl) 120 ± 38 98 ± 30 0.003
Hemoglobin A1c (%) 6.6 ± 0.9 6.6 ± 0.8 0.58
C-reactive protein(mg/dl)
0.75 ± 0.51 0.15 ± 0.16 0.16
Blood pressure duringcatheterization
Systolic pressure(mmHg)
147 ± 25 149 ± 29 0.79
Diastolic pressure(mmHg)
74 ± 13 74 ± 13 0.37
Values are mean ± SD. Calc: calcification, LAD: left anterior descending, LCX:left circumflex, ARBs: angiotensin II receptor blockers, ACEIs: angiotensin-converting enzyme inhibitors.NGSP: National Glycohemoglobin Standardization Program.
Table 2 Angiographic and intravascular ultrasoundcharacteristics
Arc of calc≤10°
10° < Arc of calc≤60°
p value
(n = 36) (n = 22)
Angiographic stenosis, % 43.9 ± 6.9 41.0 ± 5.6 0.092
Systolic vessel volume, mm3 15.0 ± 3.8 13.0 ± 3.7 0.054
Systolic lumen volume, mm3 5.7 ± 1.5 5.1 ± 2.0 0.19
Systolic plaque volume, mm3 9.2 ± 3.0 7.9 ± 2.4 0.069
Diastolic vessel volume, mm3 14.1 ± 3.6 12.5 ± 3.8 0.11
Diastolic lumen volume, mm3 5.1 ± 1.6 4.8 ± 1.9 0.44
Diastolic plaque volume, mm3 9.0 ± 2.9 7.7 ± 2.5 0.095
Plaque burden, % 61.3 ± 7.9 61.4 ± 9.4 0.97
Eccentricity rate 0.68 ± 0.14 0.53 ± 0.18 0.003
Remodeling index 0.98 ± 0.12 0.97 ± 0.08 0.51
Relative lipid volume, % 44.2 ± 12.8 46.2 ± 14.5 0.58
Relative fibrous volume, % 55.6 ± 12.8 51.3 ± 14.0 0.23
Relative calcification volume, % 0.22 ± 0.18 2.50 ± 1.79 <0.001
EEMV compliance, %/10 mmHg 1.01 ± 0.85 0.58 ± 0.54 0.037
LV compliance, %/10 mmHg 1.86 ± 1.71 0.76 ± 0.87 0.007
PA response, %/10 mmHg 0.95 ± 2.28 0.51 ± 0.95 0.39
EEM area stiffness index 22.3 ± 22.9 32.6 ± 26.8 0.12
Values are mean ± SD. Calc: calcification, EEMV: external elastic membranevolume, LV: lumen volume, PA: plaque area.
Ishihara et al. Cardiovascular Ultrasound 2012, 10:32 Page 5 of 10http://www.cardiovascularultrasound.com/content/10/1/32
moderately calcified group because of the higher rate ofmedication with statin in the moderately calcified group.At the time of measurement, systolic pressure in the ost-ium of left main coronary trunk ranged from 103 to191 mmHg, and diastolic pressure ranged from 48 to97 mmHg (Table 1).
Reproducibility and reliability of measurementsThe interobserver correlation coefficient and mean dif-ferences in LV were 0.99 and 1.4 ± 0.4%, respectively.The interobserver correlation coefficient and mean dif-ferences in EEMV were 0.97 and 2.5 ± 1.4%, respectively.The intraobserver correlation coefficient and mean dif-ferences in LA were 0.99 and 1.0 ± 0.9%, respectively.The intraobserver correlation coefficient and mean dif-ferences in EEMV were 0.98 and 2.1 ± 1.0%, respectively.The standard deviation of the relative lipid volume dur-ing the cardiac cycle was 2.1 ± 0.5%, and since there wasno variation during the cardiac cycle, we ignored the in-fluence of the cardiac cycle on relative lipid volume.
Conventional parameters and mechanical propertiesThere was significant correlations between LDL choles-terol and EEMV compliance and EEM area stiffnessindex (r =0.454, p =0.005 and r = −0.463, p =0.005, re-spectively). However, there was no significant relation-ship between EEMV compliance and HDL cholesterol(p =0.42) and between EEM area stiffness index andHDL cholesterol (p =0.59).There were no significant differences between the less
and moderately calcified groups in the conventionalIVUS parameters except for eccentric rate, relative cal-cification area (Table 2). The EEMV compliance and LV
Ishihara et al. Cardiovascular Ultrasound 2012, 10:32 Page 6 of 10http://www.cardiovascularultrasound.com/content/10/1/32
compliance were significantly greater in the less calci-fied group than those in the moderately calcified group.There were no significant differences in the PV responseand EEM area stiffness index between the less calcifiedgroup and the moderately calcified group.
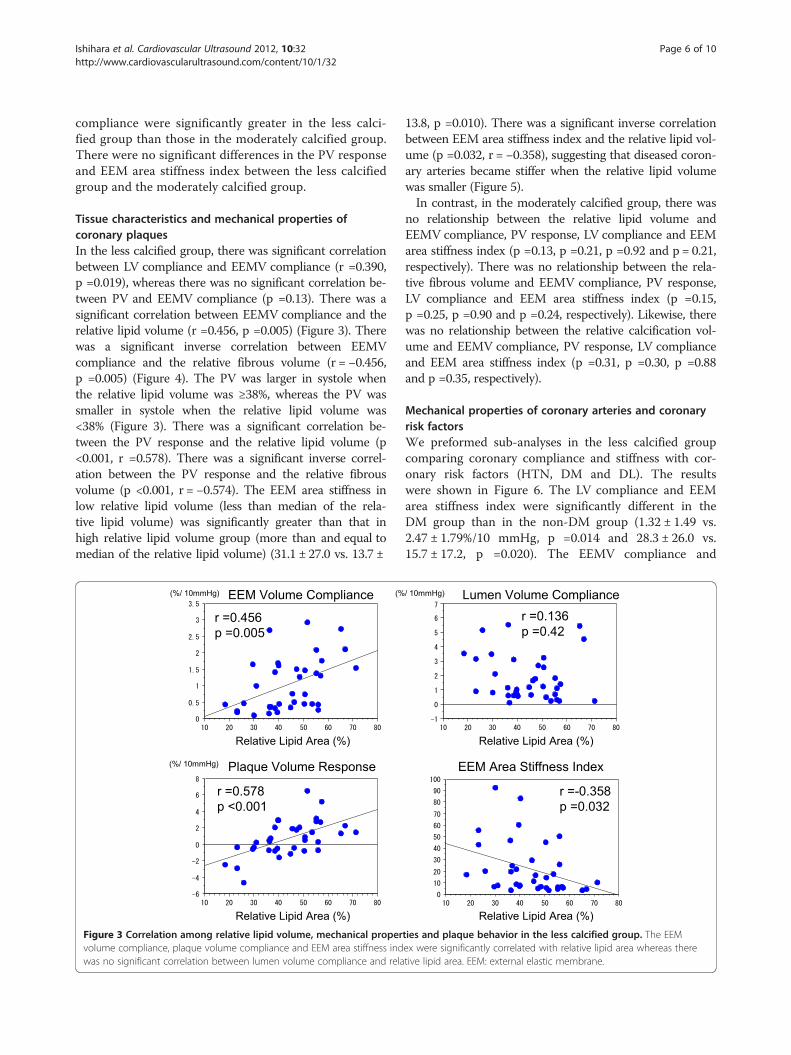
Tissue characteristics and mechanical properties ofcoronary plaquesIn the less calcified group, there was significant correlationbetween LV compliance and EEMV compliance (r =0.390,p =0.019), whereas there was no significant correlation be-tween PV and EEMV compliance (p =0.13). There was asignificant correlation between EEMV compliance and therelative lipid volume (r =0.456, p =0.005) (Figure 3). Therewas a significant inverse correlation between EEMVcompliance and the relative fibrous volume (r = −0.456,p =0.005) (Figure 4). The PV was larger in systole whenthe relative lipid volume was ≥38%, whereas the PV wassmaller in systole when the relative lipid volume was<38% (Figure 3). There was a significant correlation be-tween the PV response and the relative lipid volume (p<0.001, r =0.578). There was a significant inverse correl-ation between the PV response and the relative fibrousvolume (p <0.001, r = −0.574). The EEM area stiffness inlow relative lipid volume (less than median of the rela-tive lipid volume) was significantly greater than that inhigh relative lipid volume group (more than and equal tomedian of the relative lipid volume) (31.1 ± 27.0 vs. 13.7 ±
Figure 3 Correlation among relative lipid volume, mechanical propervolume compliance, plaque volume compliance and EEM area stiffness indwas no significant correlation between lumen volume compliance and rela
13.8, p =0.010). There was a significant inverse correlationbetween EEM area stiffness index and the relative lipid vol-ume (p =0.032, r = −0.358), suggesting that diseased coron-ary arteries became stiffer when the relative lipid volumewas smaller (Figure 5).In contrast, in the moderately calcified group, there was
no relationship between the relative lipid volume andEEMV compliance, PV response, LV compliance and EEMarea stiffness index (p =0.13, p =0.21, p =0.92 and p = 0.21,respectively). There was no relationship between the rela-tive fibrous volume and EEMV compliance, PV response,LV compliance and EEM area stiffness index (p =0.15,p =0.25, p =0.90 and p =0.24, respectively). Likewise, therewas no relationship between the relative calcification vol-ume and EEMV compliance, PV response, LV complianceand EEM area stiffness index (p =0.31, p =0.30, p =0.88and p =0.35, respectively).
Mechanical properties of coronary arteries and coronaryrisk factorsWe preformed sub-analyses in the less calcified groupcomparing coronary compliance and stiffness with cor-onary risk factors (HTN, DM and DL). The resultswere shown in Figure 6. The LV compliance and EEMarea stiffness index were significantly different in theDM group than in the non-DM group (1.32 ± 1.49 vs.2.47 ± 1.79%/10 mmHg, p =0.014 and 28.3 ± 26.0 vs.15.7 ± 17.2, p =0.020). The EEMV compliance and
ties and plaque behavior in the less calcified group. The EEMex were significantly correlated with relative lipid area whereas theretive lipid area. EEM: external elastic membrane.
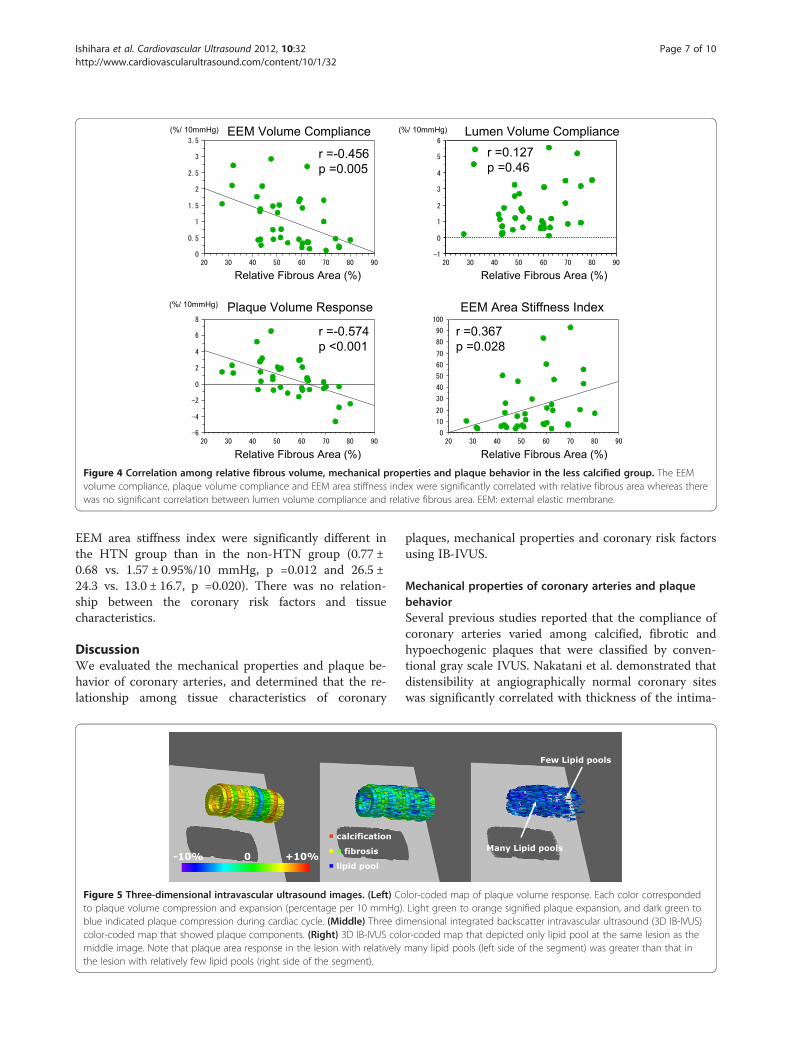
Figure 4 Correlation among relative fibrous volume, mechanical properties and plaque behavior in the less calcified group. The EEMvolume compliance, plaque volume compliance and EEM area stiffness index were significantly correlated with relative fibrous area whereas therewas no significant correlation between lumen volume compliance and relative fibrous area. EEM: external elastic membrane.
Ishihara et al. Cardiovascular Ultrasound 2012, 10:32 Page 7 of 10http://www.cardiovascularultrasound.com/content/10/1/32
EEM area stiffness index were significantly different inthe HTN group than in the non-HTN group (0.77 ±0.68 vs. 1.57 ± 0.95%/10 mmHg, p =0.012 and 26.5 ±24.3 vs. 13.0 ± 16.7, p =0.020). There was no relation-ship between the coronary risk factors and tissuecharacteristics.
DiscussionWe evaluated the mechanical properties and plaque be-havior of coronary arteries, and determined that the re-lationship among tissue characteristics of coronary
Figure 5 Three-dimensional intravascular ultrasound images. (Left) Coto plaque volume compression and expansion (percentage per 10 mmHg)blue indicated plaque compression during cardiac cycle. (Middle) Three dicolor-coded map that showed plaque components. (Right) 3D IB-IVUS colmiddle image. Note that plaque area response in the lesion with relativelythe lesion with relatively few lipid pools (right side of the segment).
plaques, mechanical properties and coronary risk factorsusing IB-IVUS.
Mechanical properties of coronary arteries and plaquebehaviorSeveral previous studies reported that the compliance ofcoronary arteries varied among calcified, fibrotic andhypoechogenic plaques that were classified by conven-tional gray scale IVUS. Nakatani et al. demonstrated thatdistensibility at angiographically normal coronary siteswas significantly correlated with thickness of the intima-
lor-coded map of plaque volume response. Each color corresponded. Light green to orange signified plaque expansion, and dark green tomensional integrated backscatter intravascular ultrasound (3D IB-IVUS)or-coded map that depicted only lipid pool at the same lesion as themany lipid pools (left side of the segment) was greater than that in
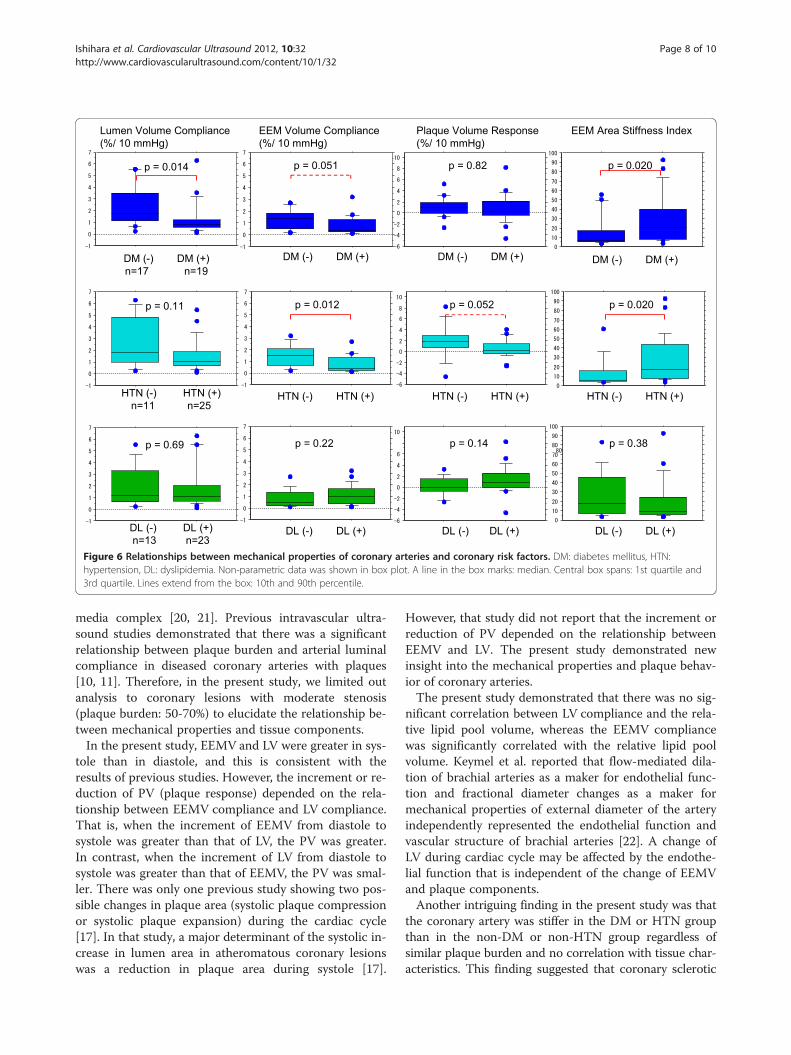
Figure 6 Relationships between mechanical properties of coronary arteries and coronary risk factors. DM: diabetes mellitus, HTN:hypertension, DL: dyslipidemia. Non-parametric data was shown in box plot. A line in the box marks: median. Central box spans: 1st quartile and3rd quartile. Lines extend from the box: 10th and 90th percentile.
Ishihara et al. Cardiovascular Ultrasound 2012, 10:32 Page 8 of 10http://www.cardiovascularultrasound.com/content/10/1/32
media complex [20, 21]. Previous intravascular ultra-sound studies demonstrated that there was a significantrelationship between plaque burden and arterial luminalcompliance in diseased coronary arteries with plaques[10, 11]. Therefore, in the present study, we limited outanalysis to coronary lesions with moderate stenosis(plaque burden: 50-70%) to elucidate the relationship be-tween mechanical properties and tissue components.In the present study, EEMV and LV were greater in sys-
tole than in diastole, and this is consistent with theresults of previous studies. However, the increment or re-duction of PV (plaque response) depended on the rela-tionship between EEMV compliance and LV compliance.That is, when the increment of EEMV from diastole tosystole was greater than that of LV, the PV was greater.In contrast, when the increment of LV from diastole tosystole was greater than that of EEMV, the PV was smal-ler. There was only one previous study showing two pos-sible changes in plaque area (systolic plaque compressionor systolic plaque expansion) during the cardiac cycle[17]. In that study, a major determinant of the systolic in-crease in lumen area in atheromatous coronary lesionswas a reduction in plaque area during systole [17].
However, that study did not report that the increment orreduction of PV depended on the relationship betweenEEMV and LV. The present study demonstrated newinsight into the mechanical properties and plaque behav-ior of coronary arteries.The present study demonstrated that there was no sig-
nificant correlation between LV compliance and the rela-tive lipid pool volume, whereas the EEMV compliancewas significantly correlated with the relative lipid poolvolume. Keymel et al. reported that flow-mediated dila-tion of brachial arteries as a maker for endothelial func-tion and fractional diameter changes as a maker formechanical properties of external diameter of the arteryindependently represented the endothelial function andvascular structure of brachial arteries [22]. A change ofLV during cardiac cycle may be affected by the endothe-lial function that is independent of the change of EEMVand plaque components.Another intriguing finding in the present study was that
the coronary artery was stiffer in the DM or HTN groupthan in the non-DM or non-HTN group regardless ofsimilar plaque burden and no correlation with tissue char-acteristics. This finding suggested that coronary sclerotic
Ishihara et al. Cardiovascular Ultrasound 2012, 10:32 Page 9 of 10http://www.cardiovascularultrasound.com/content/10/1/32
change due to DM or HTN is diffuse sclerotic process andindependent of the change of tissue components that islocal atherotic process. A previous study demonstratedthat endothelial function and mechanical property of bra-chial arteries were impaired in patients with DM compar-ing with patients without DM [22]. Another study showedthat aortic stiffness was augmented in phases according tothe severity of HTN [23]. However, there have been fewstudies that demonstrated the relationship between theimpairment of mechanical property of coronary arteriesand the coronary risk factors. This is the first clinical dem-onstration of the relationship among mechanical proper-ties, tissue characteristics of coronary plaques andcoronary risk factors.In the moderately calcified group, there was no rela-
tionship between the relative lipid volume and EEMVcompliance, PV response, LV compliance and EEM areastiffness index. Previous study reported that coronaryvessel expansion from diastole to systole in calcifiedlesions (arc of calcification >25%) was less than that innon-calcified lesions [12]. This is consistent with theresults of the present study.
Clinical implicationsThe findings in the present study have important clinicalimplications. It is possible that the plaque response(compression or expansion) demonstrated in the presentstudy could be an alternative index for the dynamicstress on coronary plaques at risk of rupture. Imbalancein these properties within the same coronary plaquesmight trigger acute coronary syndrome because repeti-tive plaque deformation during the cardiac cycleincreases the dynamic stress on plaques [16,24]. In thepresent study, LV compliance was significantly impairedand EEM area stiffness increased in the DM group thanin the non-DM group. Previous studies demonstratedthat coronary endothelial vasodilator dysfunction pre-dicted long-term atherosclerotic disease progression andcardiovascular event rates in the patients with coronaryheart disease or hypertension [25,26]. Thus, the assess-ment of coronary mechanical properties during PCI mayprovide us with useful information regarding the riskstratification of patients with coronary heart disease.
Study limitationsThere are several limitations of the present study. First,we substituted systemic pressures that were obtainedfrom the tip of the guiding catheter in the ostium of theleft main coronary trunk for intracoronary pressures.This substitution may hinder rigorous measurement ofcoronary compliance. However, we evaluated onlylesions in the left anterior descending and left circumflexcoronary arteries that were proximal to the PCI targetlesions to minimize the pressure difference between the
left main coronary trunk and the intracoronary pres-sures. In addition, the position and axis of IVUS mighthave slightly changed during the cardiac cycle, prevent-ing rigorous measurement of coronary compliance, al-though we performed volumetric analysis using threecross-sections. Second, all measurement were performed3–5 minutes after the administration of isosorbide dini-trate, because the effects of vasoactive medication oncoronary distensibility last for at least two minutes [15].It is possible that other oral medications that patientswere on at the time of the study may have influencedcoronary compliance. Other factors such as calcificationand patient age that might influence coronary compli-ance should also be considered. Finally, circumferentialregional differences in compliance were not consideredin the present study because of technical difficulties. Cir-cumferential differences may influence plaque deform-ation that causes physical stress on plaques resulting inplaque rupture. For the evaluation of regional differencesin compliance, elastography is useful [27].
ConclusionsThe present study provided new findings that there was asignificant correlation between mechanical properties andtissue characteristics of coronary arteries. In addition, ourresults suggested that the EEMV compliance and the LVcompliance were independent and the compliance wassignificantly impaired in the patients with DM and/orHTN. Assessment of coronary mechanical propertiesduring PCI may provide us with useful informationregarding the risk stratification of patients with coronaryheart disease.
AbbreviationsIB-IVUS: integrated backscatter intravascular ultrasound; LV: lumen volume;EEMV: external elastic membrane volume; PV: plaque volume;HTN: hypertension; DM: diabetes mellitus; DL: dyslipidemia.
Competing interestsThe authors declare that they have no competing interests.
Authors’ contributionsYI and AH carried out subject recruitment and analyzed data. MK analyzeddata and wrote the manuscript. HI, ST, HS, TK, MO and SO performedintegrated backscatter ultrasound analysis. KN, GT, HF and SM analyzed data.All authors read and approved the final manuscript.
AcknowledgementsThis study was supported, in part, by a Grant-in-Aid for Scientific Research(C), Ministry of Education, Culture, Sports, Science and Technology of Japan(24591043) (2012–2014).
Received: 19 June 2012 Accepted: 21 July 2012Published: 30 July 2012
References1. Kawasaki M, Ito Y, Yokoyama H, Arai M, Takemura G, Hara A, Ichiki Y, Takatsu
H, Minatoguchi S, Fujiwara H: Assessment of arterial medial characteristicsin human carotid arteries using integrated backscatter ultrasound andits histological implications. Atherosclerosis 2005, 180:145–154.
Ishihara et al. Cardiovascular Ultrasound 2012, 10:32 Page 10 of 10http://www.cardiovascularultrasound.com/content/10/1/32
2. Nissen SE, Yock P: Intravascular ultrasound: novel pathophysiologicalinsight and current clinical applications. Circulation 2001, 103:604–616.
3. Mintz GS, Nissen SE, Anderson WD, Bailey SR, Erbel R, Fitzgerald PJ, Pinto FJ,Rosenfield K, Siegel RJ, Tuzcu EM, Yock PG: American College ofCardiology clinical expert consensus document on standards foracquisition, measurement and reporting of intravascular ultrasoundstudies (ivus). A report of the american college of cardiology task forceon clinical expert consensus documents developed in collaboration withthe european society of cardiology endorsed by the society of cardiacangiography and interventions. J Am Coll Cardiol 2001, 37:1478–1492.
4. Kawasaki M, Sano K, Okubo M, Yokoyama H, Ito Y, Murata I, Tsuchiya K,Minatoguchi S, Zhou X, Fujita H, Fujiwara H: Volumetric quantitativeanalysis of tissue characteristics of coronary plaques after statin therapyusing three dimensional integrated backscatter intravascular ultrasound.J Am Coll Cardiol 2005, 45:1946–1953.
5. Kawasaki M, Takatsu H, Noda T, Sano K, Ito Y, Hayakawa K, Tsuchiya K, Arai M,Nishigaki K, Takemura G, Minatoguchi S, Fujiwara T, Fujiwara H: In vivoquantitative tissue characterization of human coronary arterial plaquesby use of integrated backscatter intravascular ultrasound andcomparison with angioscopic findings. Circulation 2002, 105:2487–2492.
6. Amano T, Matsubara T, Uetani T, Nanki M, Marui N, Kato M, Arai K, Yokoi K,Ando H, Ishii H, Izawa H, Murohara T: Impact of metaboric syndrome ontissue charactreristics of angiographically mild to moderate coronarylesions. Integrated backscatter intravascular ultrasound study. J Am CollCardiol 2007, 49:1149–1156.
7. Sano K, Kawasaki M, Ishihara Y, Okubo M, Tsuchiya K: NishigakiK, Zhou X,Minatoguchi S, Fujita H, Fujiwara H: Assessment of vulnerable plaquescausing acute coronary syndrome using integrated backscatterintravascular ultrasound. J Am Coll Cardiol 2006, 47:734–741.
8. Okubo M, Kawasaki M, Ishihara Y, Takeyama U, Kubota T, Yamaki T, Ojio S,Nishigaki K, Takemura G, Saio M, Takami T, Minatoguchi S, Fujiwara H:Development of integrated backscatter intravascular ultrasound fortissue characterization of coronary plaques. Ultrasound in Med & Biol 2008,34:655–663.
9. Okubo M, Kawasaki M, Ishihara Y, Takeyama U, Yasuda S, Kubota T, Tanaka S,Yamaki T, Ojio S, Nishigaki K, Takemura G, Saio M, Takami T, Fujiwara H,Minatoguchi S: Tissue characterization of coronary plaques. Comparison ofintegrated backscatter intravascular ultrasound with Virtual Histologyintravascular ultrasound. Circ J 2008, 72:1631–1639.
10. Virmani R, Robinowitz M, Atkinson JB, Forman MB, Silver MD, McAllister HA:Acquired coronary arterial aneurysms. Hum Pathol 1986, 17:575–583.
11. Reddy KG, Suneja R, Nair RN, Dhawale P, Hodson JM: Measurement byintracoronary ultrasound of in vivo arterial compliance withinatherosclerotic lesions. Am J Cardiol 1993, 72:1232–1237.
12. Weissman NJ, Palacios IF, Weyman AE: Dynamic expansion of coronaryarteries: Implications for intravascular ultrasound measurements. AmHeart J 1995, 130:46–51.
13. De Bruyne B, Hersbach F, Pijls N, Bartunek J, Bech JW, Heyndrickx GR,Gould KL, Wijns W: Abnormal epicardial coronary resistance in patientswith diffuse atheromatous but “normal” coronary angiography.Circulation 2002, 104:2401–2406.
14. Kawasaki M, Hattori A, Ishihara Y, Okubo M, Nishigaki K, Takemura G, Saio M,Takami T, Minatoguchi S: Tissue characterization of coronary plaques andassessment of thickness of fibrous cap using integrated backscatterintravascular ultrasound. Comparison with histology and optical coherencetomography. Circ J 2010, 74:2641–8.
15. Akima T, Makkar R, Nishioka T, Dohad S, Iida K, Goland S, Kar S, Luo H,Siegel RJ: Impact of nitroglycerin and verapamil on coronary arterialdistensibility as assessed by intravascular ultrasound. J Invasive Cardiol2009, 21:162–167.
16. Yamagishi M, Nissen SE, Booth DC, Gurley JC, Koyama J, Kawano S,DeMaria AN: Coronary reactivity to nitroglycerin: intravascularultrasound evidence for the importance of plaque distribution. J AmColl Cardiol 1995, 25:224–230.
17. Shaw JA, Kingwell BA, Walton AS, Cameron JD, Pillay P, Gatzka CD, Dart AM:Determinants of coronary artery compliance in subjects with andwithout angiographic coronary artery disease. J Am Coll Cardiol 2002,39:1637–1643.
18. Hayashi K, Handa H, Nagasawa S, Okumura A, Moritake K: Stiffness andelastic behavior of human intracranial and exracranial arteries. J Biomech1980, 13:175–184.
19. Hirai T, Sasayama S, Kawasaki T, Yagi S: Stiffness of systemic arteries inpatients with myocadial infarction. A noninvasive method to predict severityof coronary atherosclerosis. Circulation 1989, 80:78–86.
20. Alfonso F, Macaya C, Goicolea J, Hernandez R, Segovia J, Zamorano J,Bañuelos C, Zarco P: Determinants of coronary compliance in patientswith coronary artery disease: An Intravascular ultrasound study. J Am CollCardiol 1994, 23:879–884.
21. Nakatani S, Yamagishi M, Tamai J, Goto Y, Umeno T, Kawaguchi A, Yutani C,Miyatake K: Assessment of coronary artery distensibility by intravascularultrasound. Application of simultaneous measurements of luminal area andpressure. Circulation 1995, 91:2904–2910.
22. Keymel S, Heinen Y, Balzer J, Rassaf T, Kelm M, Lauer T, Heiss C:Characterization of macro-and microvascular function and structure inpatients with type 2 diabetes mellitus. Am J Cardiovasc Dis 2011, 1:68–75.
23. Tomiyama H, Arai T, Koji Y, Yambe M, Motobe K, Zaydun G, Yamamoto Y,Hori S, Yamashina A: The age-related increase in arterial stiffness isaugmented in phases according to the severity of hypertension.Hypertens Res 2004, 27:465–470.
24. Rothwell PM, Villagra R, Gibson R, Donders RC, Warlow CP: Evidence of achronic systemic cause of instability of atherosclerotic plaques. Lancet2000, 355:19–24.
25. Schächinger V, Britten MB, Zeiher AM: Prognostic impact of coronaryvasodilator dysfunction on adverse long-term outcome of coronaryheart disease. Circulation 2000, 101:1899–1906.
26. Perticone F, Ceravolo R, Pujia A, Ventura G, Iacopino S, Scozzafava A,Ferraro A, Chello M, Mastroroberto P, Verdecchia P, Schillaci G:Prognostic significance of endothelial dysfunction in hypertensivepatients. Circulation 2001, 104:191–196.
27. Schaar JA, de Korte CL, Mastik F, Strijder C, Pasterkamp G, Boersma E,Serruys PW, van der Steen AFW: Characterizing vulnerable plaque featureswith intravascular elastography. Circulation 2003, 108:2636–2641.
doi:10.1186/1476-7120-10-32Cite this article as: Ishihara et al.: Relationship among coronary plaquecompliance, coronary risk factors and tissue characteristics evaluated byintegrated backscatter intravascular ultrasound. Cardiovascular Ultrasound2012 10:32.
Submit your next manuscript to BioMed Centraland take full advantage of:
• Convenient online submission
• Thorough peer review
• No space constraints or color figure charges
• Immediate publication on acceptance
• Inclusion in PubMed, CAS, Scopus and Google Scholar
• Research which is freely available for redistribution
Submit your manuscript at www.biomedcentral.com/submit