Embed Size (px)
Citation preview
RELATIONSSection 1.6
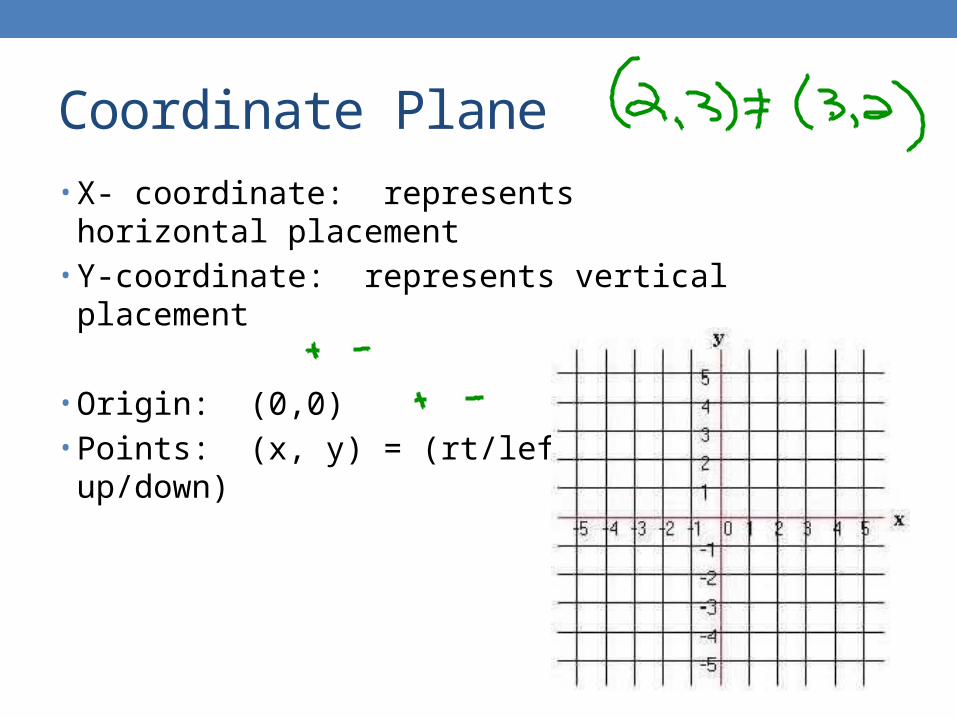
Coordinate Plane• X- coordinate: represents horizontal placement• Y-coordinate: represents vertical placement
• Origin: (0,0)• Points: (x, y) = (rt/left , up/down)
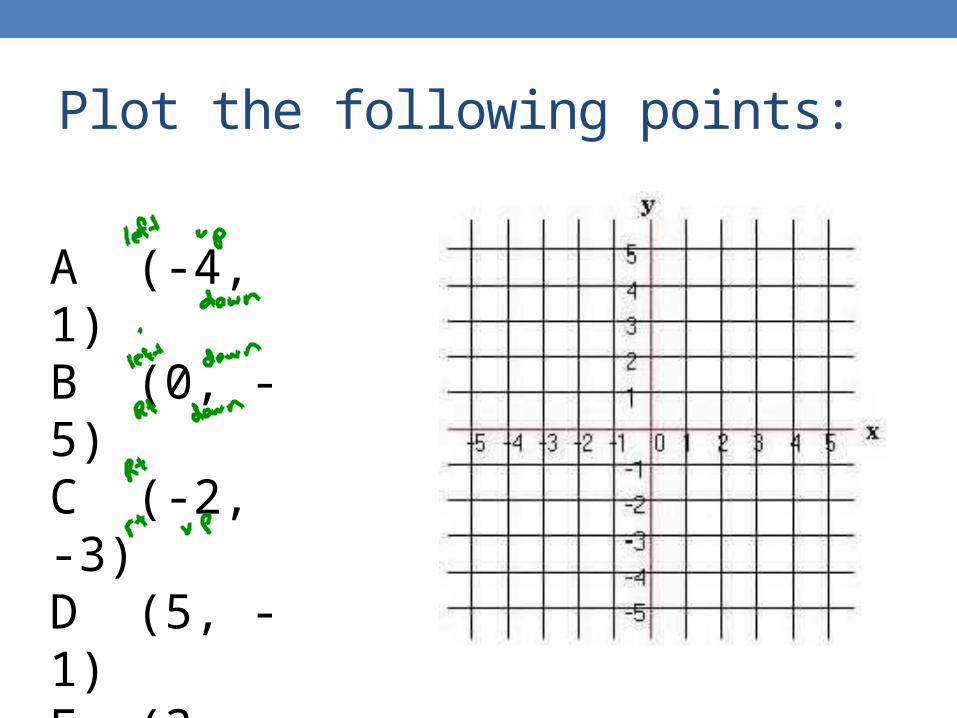
Plot the following points:
A (-4, 1)B (0, -5)C (-2, -3)D (5, -1)E (3, 0)F (2, 1)
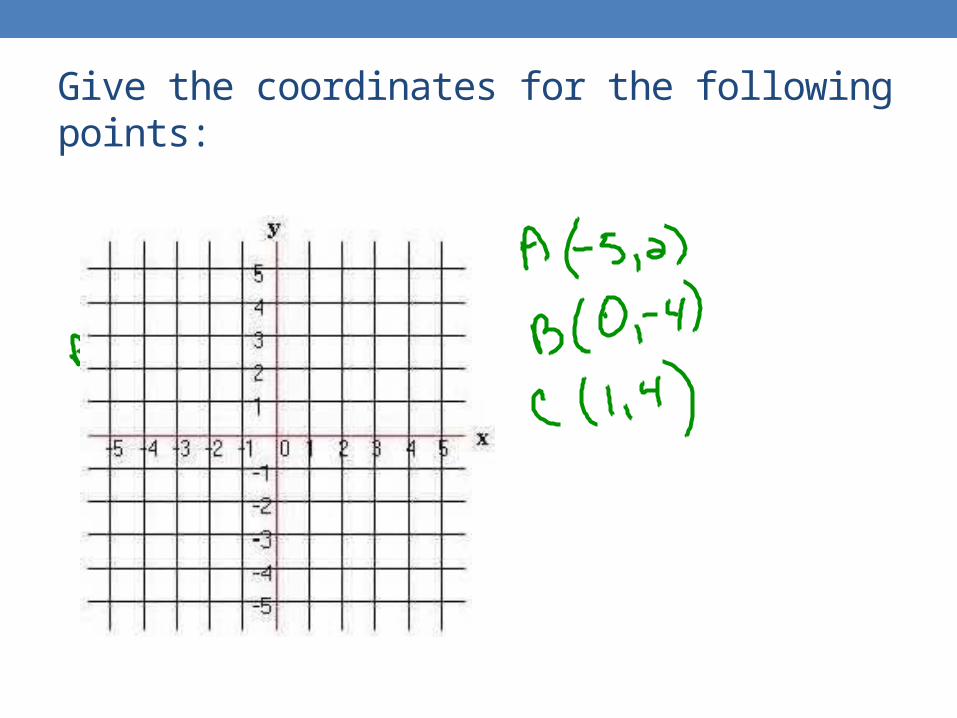
Give the coordinates for the following points:
Relation• A set of ordered pairs.
• Can be represented in several ways:• Equation• Graph• Table• Mapping
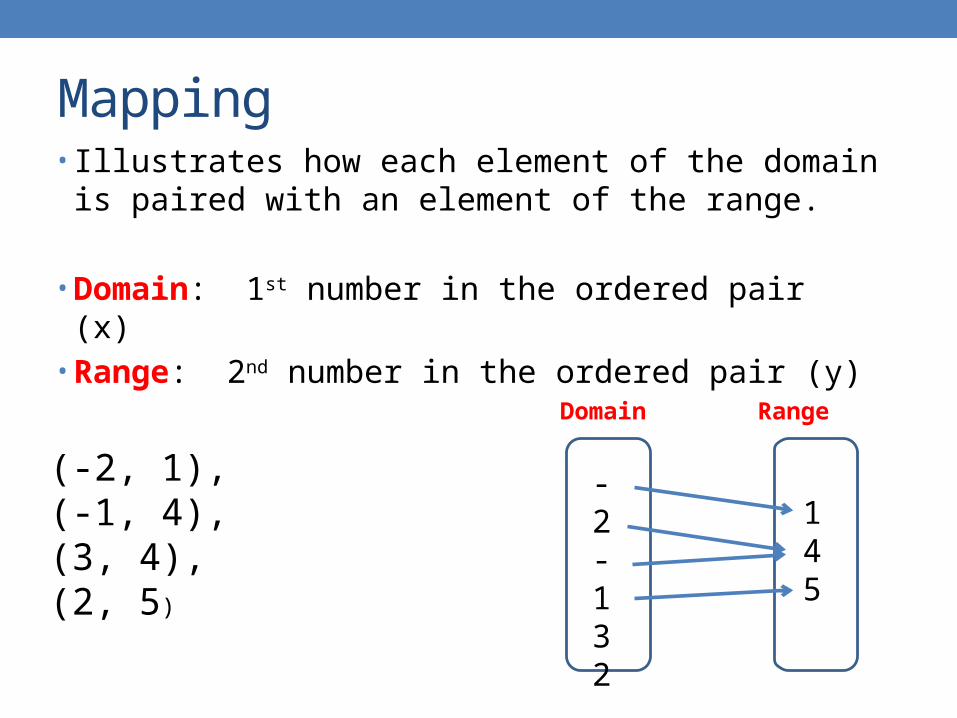
Mapping• Illustrates how each element of the domain is paired with
an element of the range.
• Domain: 1st number in the ordered pair (x)• Range: 2nd number in the ordered pair (y)
(-2, 1), (-1, 4), (3, 4), (2, 5)
Domain Range
-2-132
145
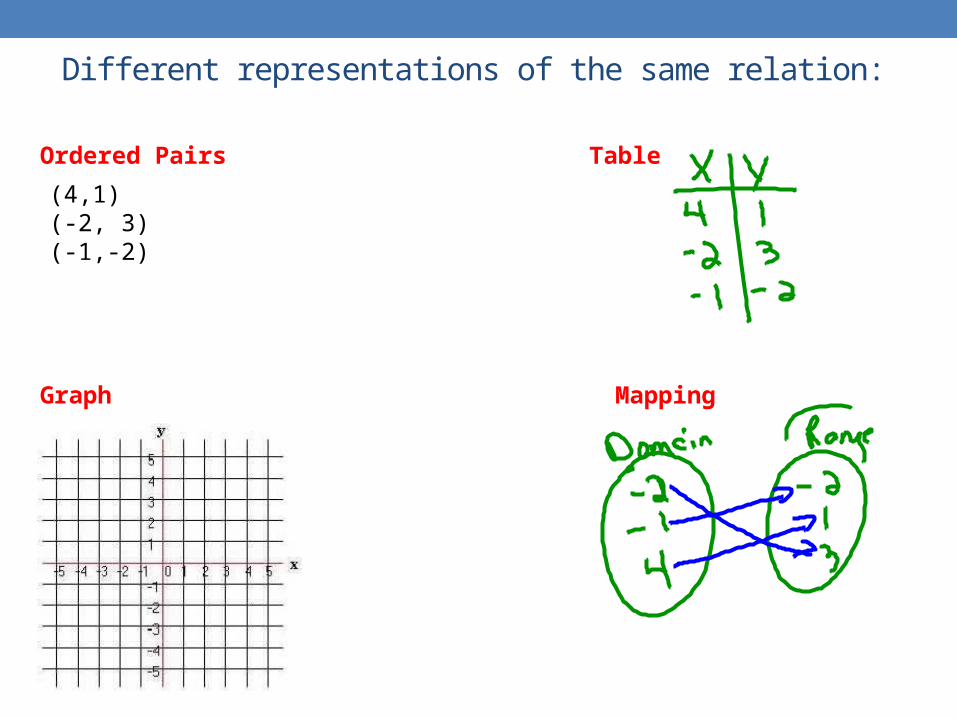
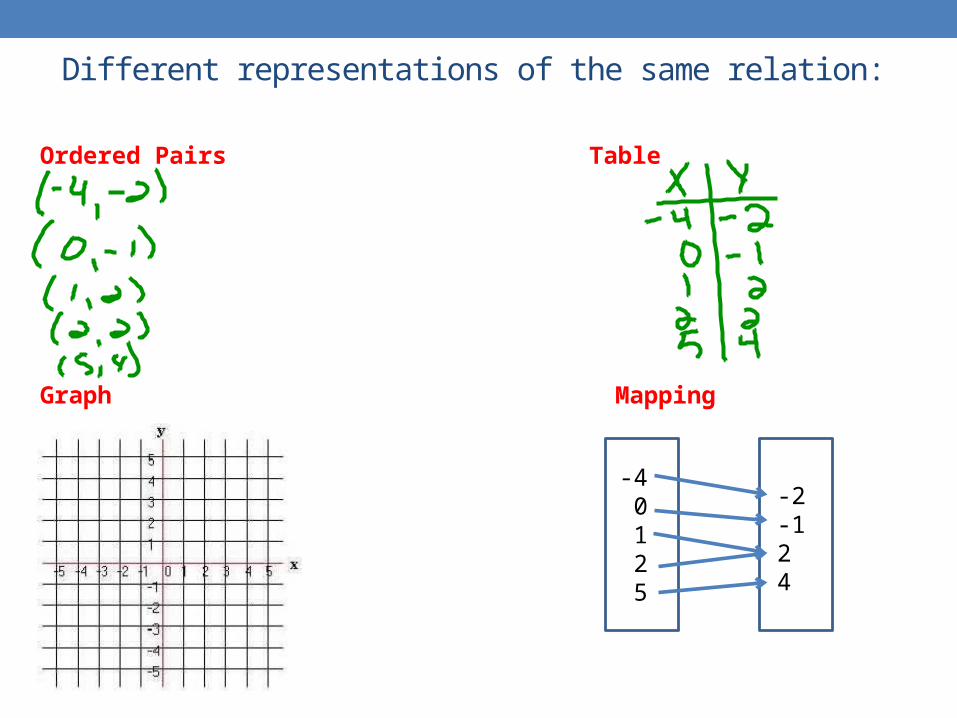
Different representations of the same relation:
Ordered Pairs Table
Graph Mapping
(4,1)(-2, 3)(-1,-2)
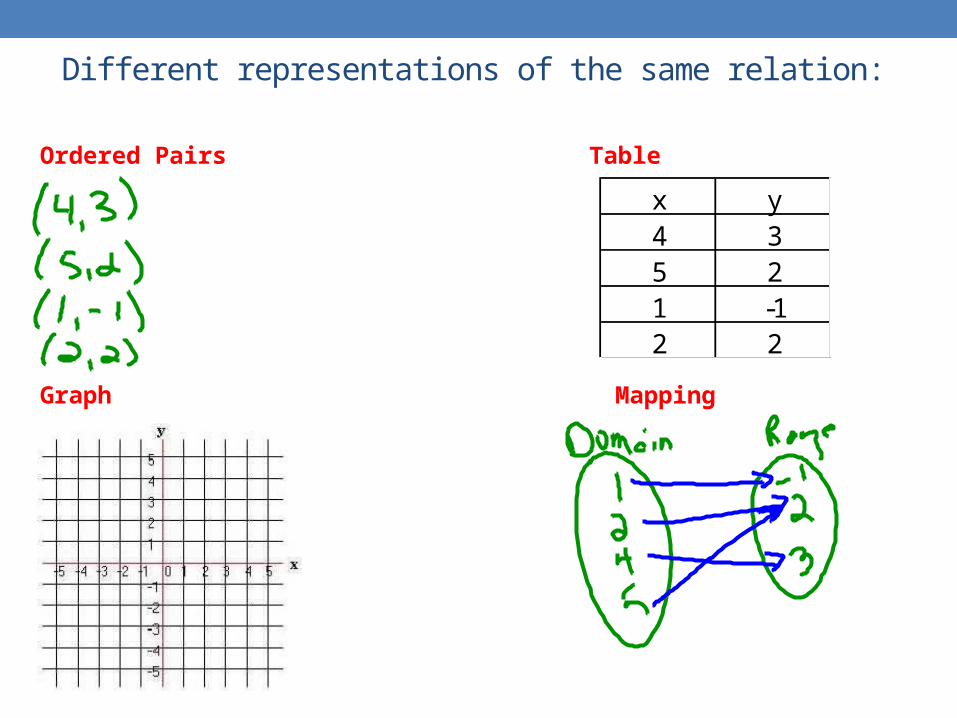
Different representations of the same relation:
Ordered Pairs Table
Graph Mapping
x y4 35 21 -12 2
Different representations of the same relation:
Ordered Pairs Table
Graph Mapping
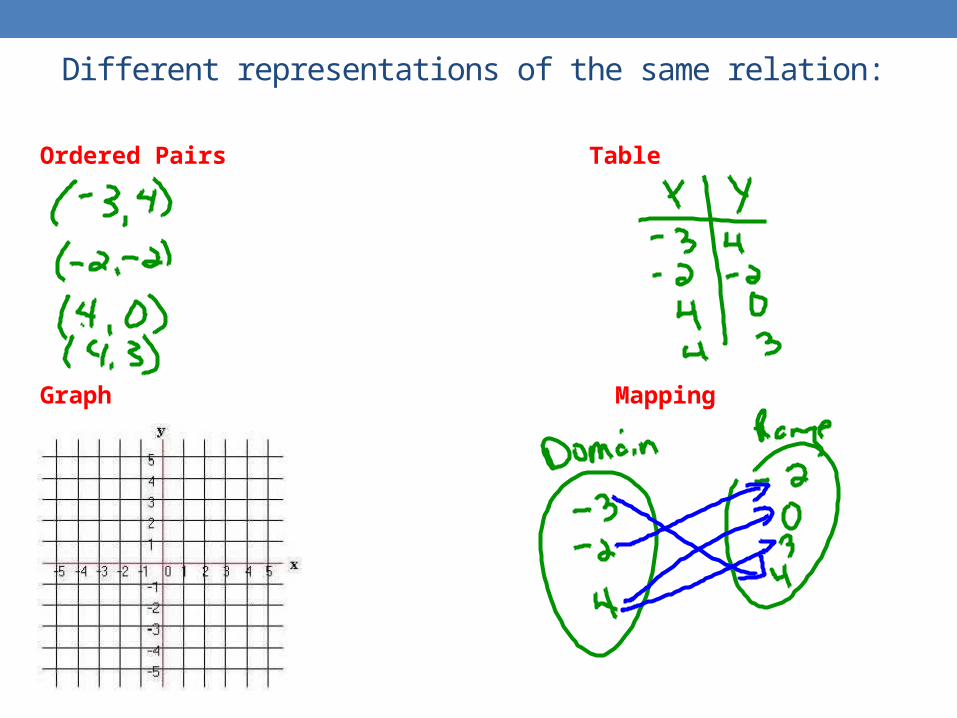
Different representations of the same relation:
Ordered Pairs Table
Graph Mapping
-4 0 1 2 5
-2-124
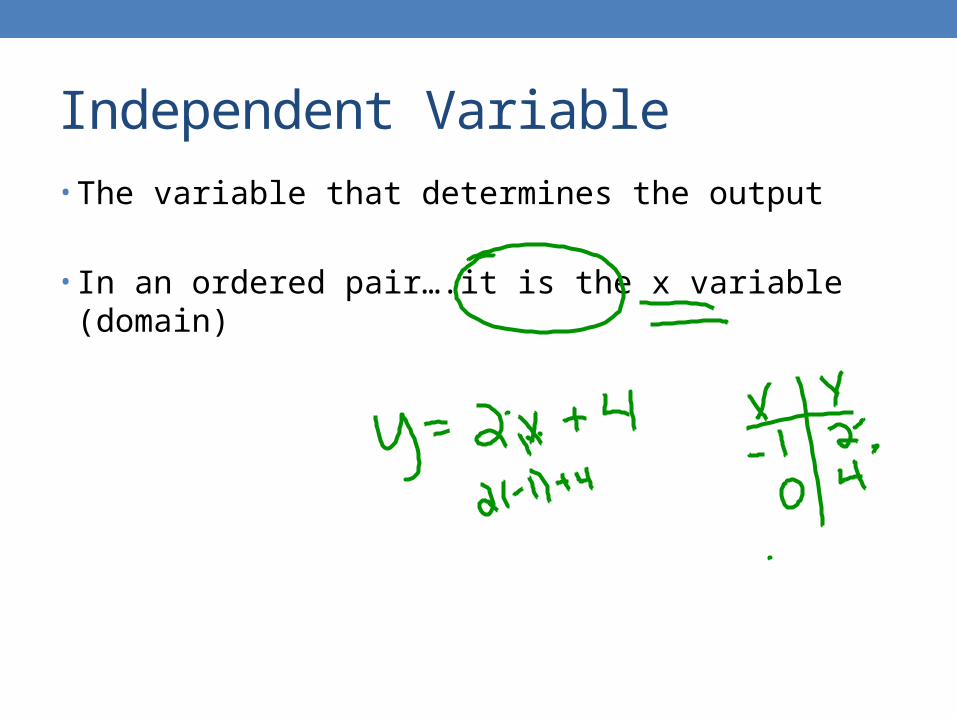
Independent Variable• The variable that determines the output
• In an ordered pair….it is the x variable (domain)
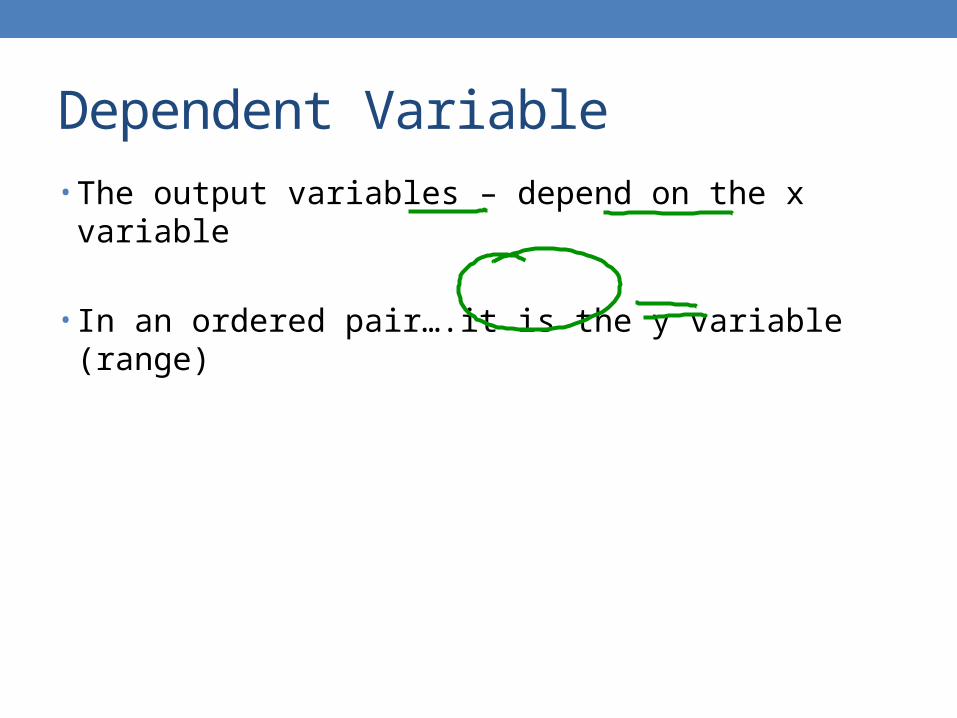
Dependent Variable• The output variables – depend on the x variable
• In an ordered pair….it is the y variable (range)
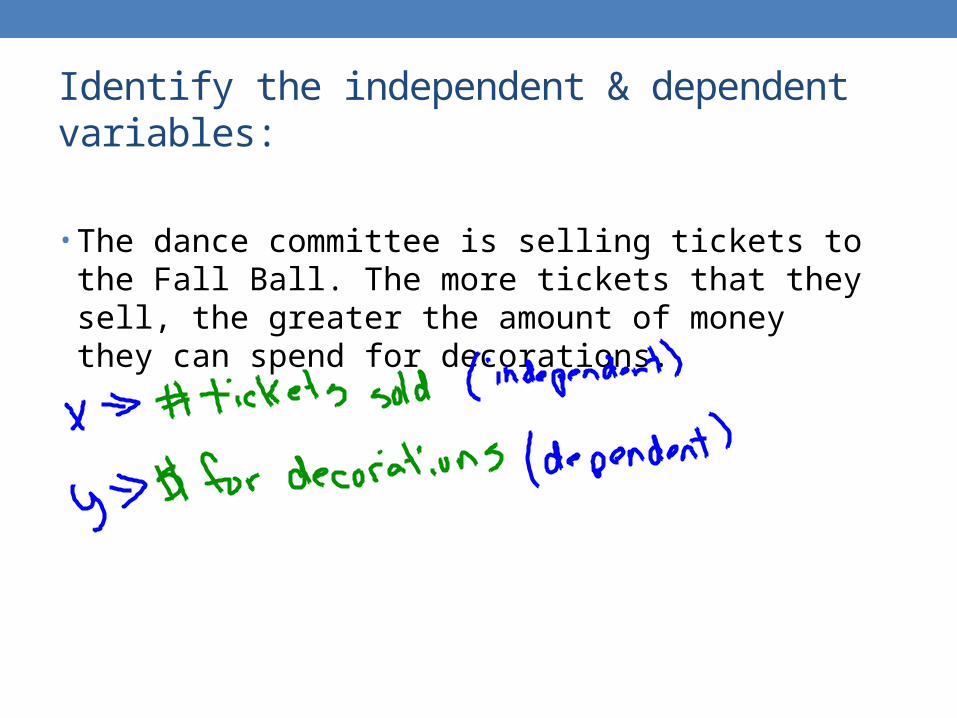
Identify the independent & dependent variables:
• The dance committee is selling tickets to the Fall Ball. The more tickets that they sell, the greater the amount of money they can spend for decorations.
Identify the independent & dependent variables:
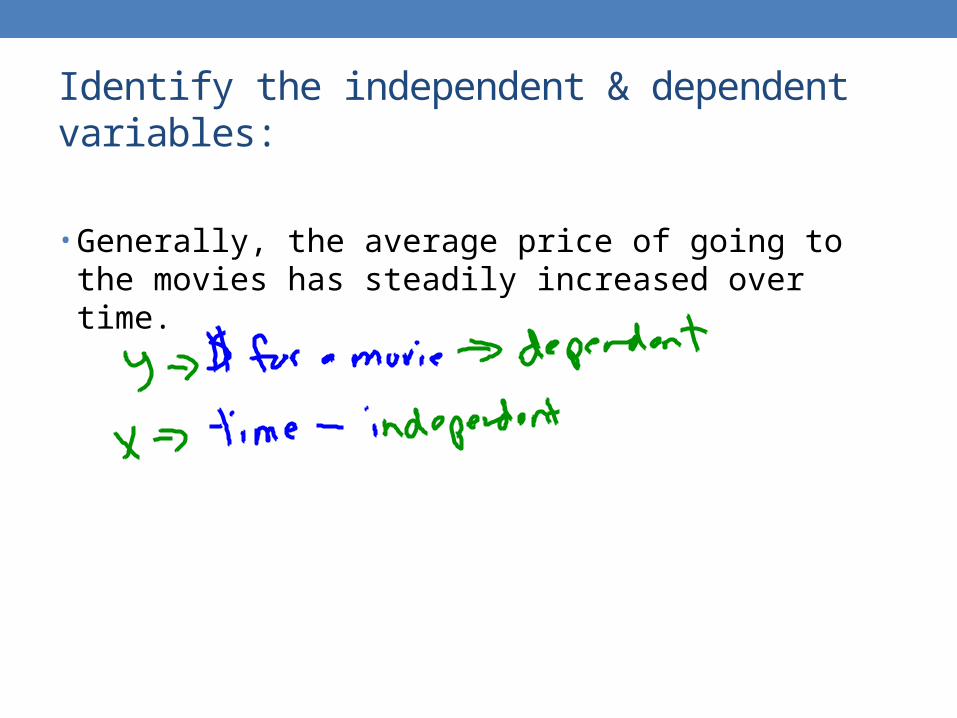
• Generally, the average price of going to the movies has steadily increased over time.
Identify the independent & dependent variables:
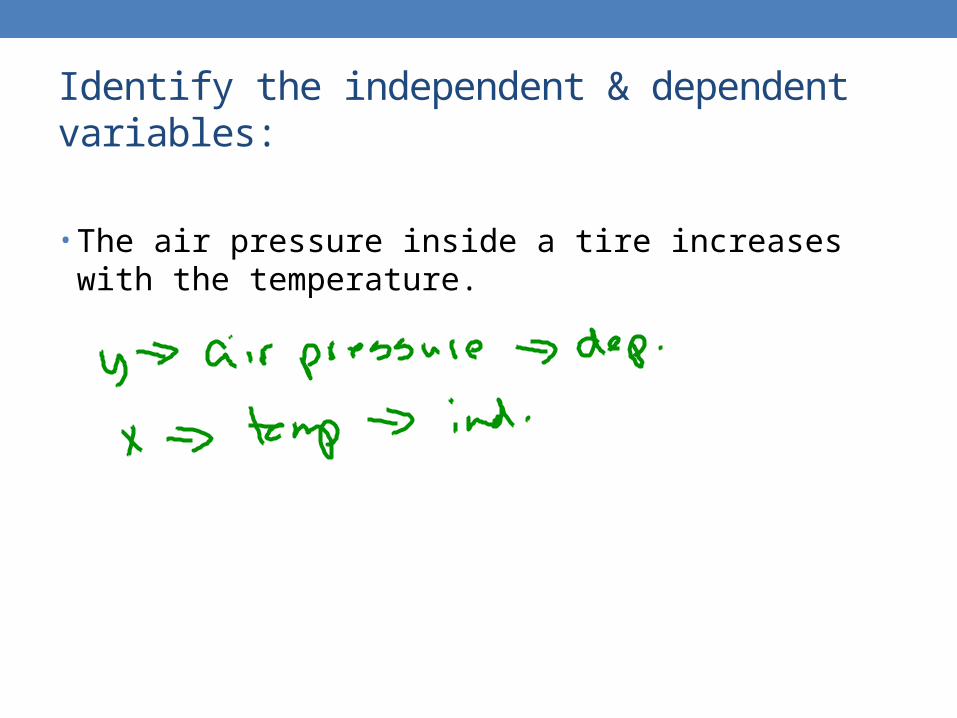
• The air pressure inside a tire increases with the temperature.
Identify the independent & dependent variables:
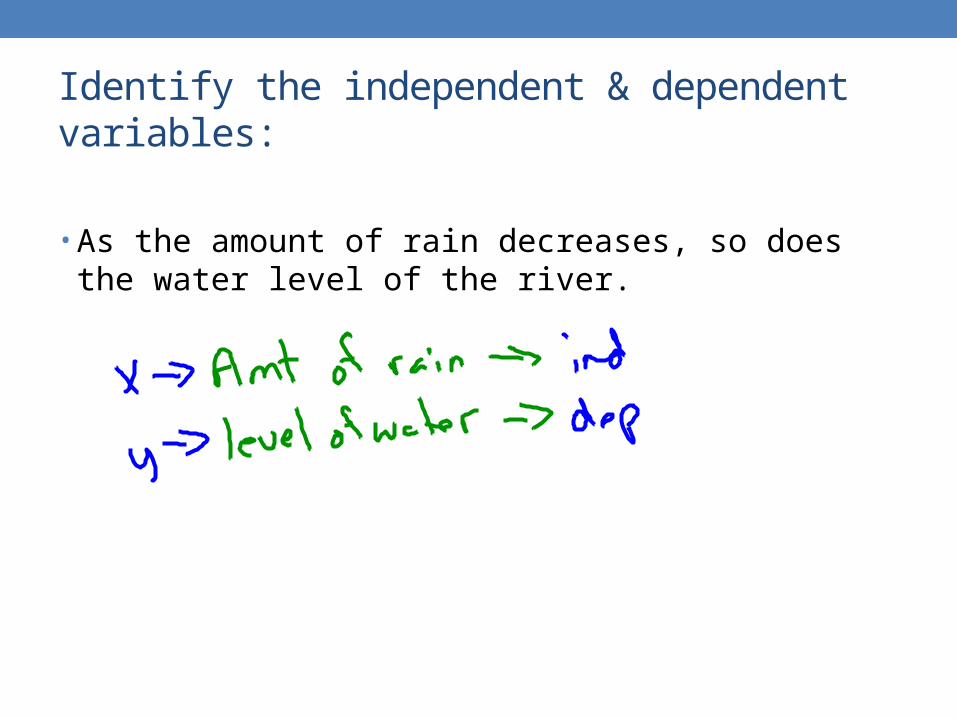
• As the amount of rain decreases, so does the water level of the river.
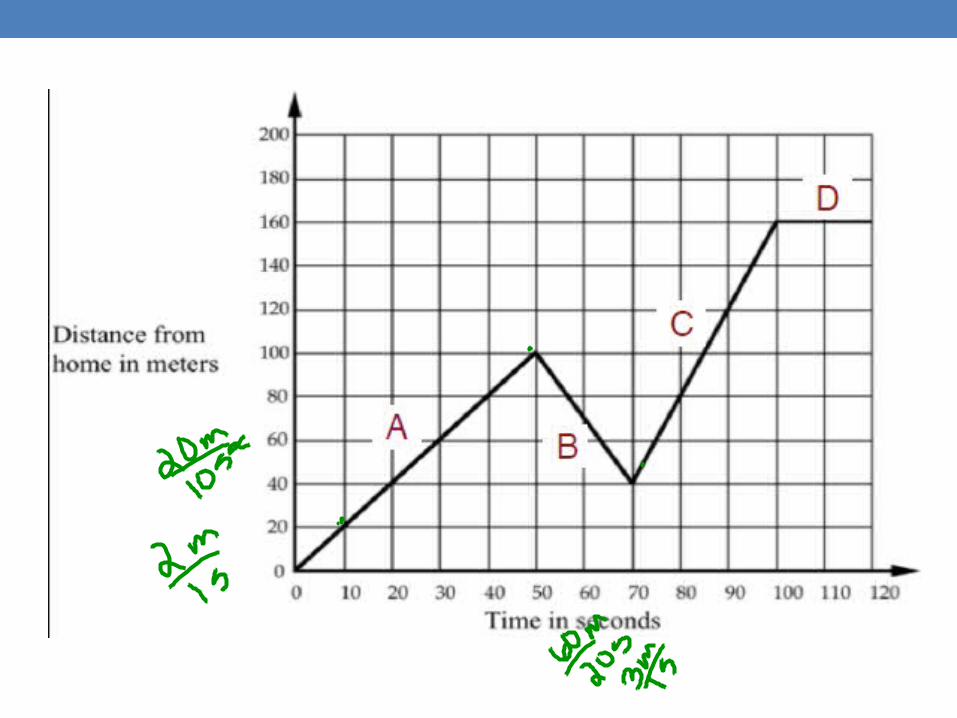
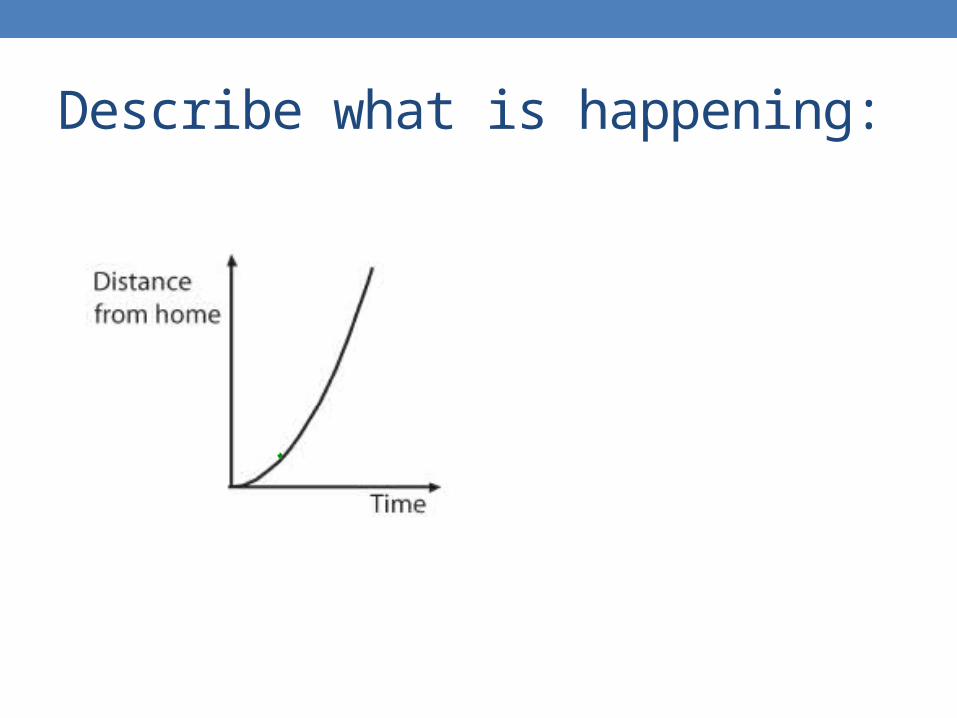
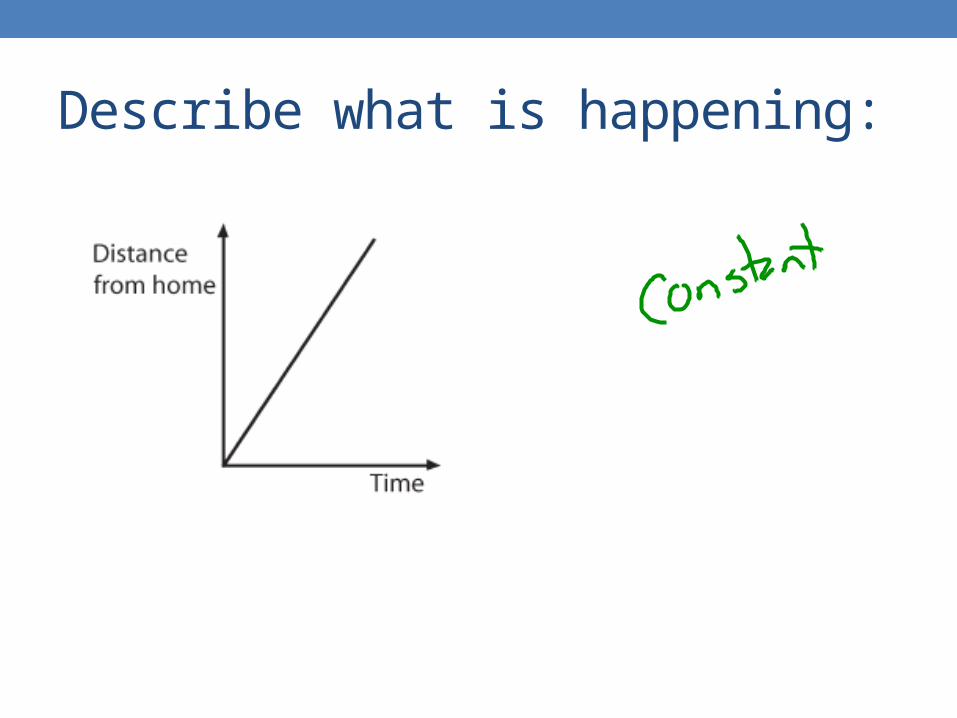
Describe what is happening:
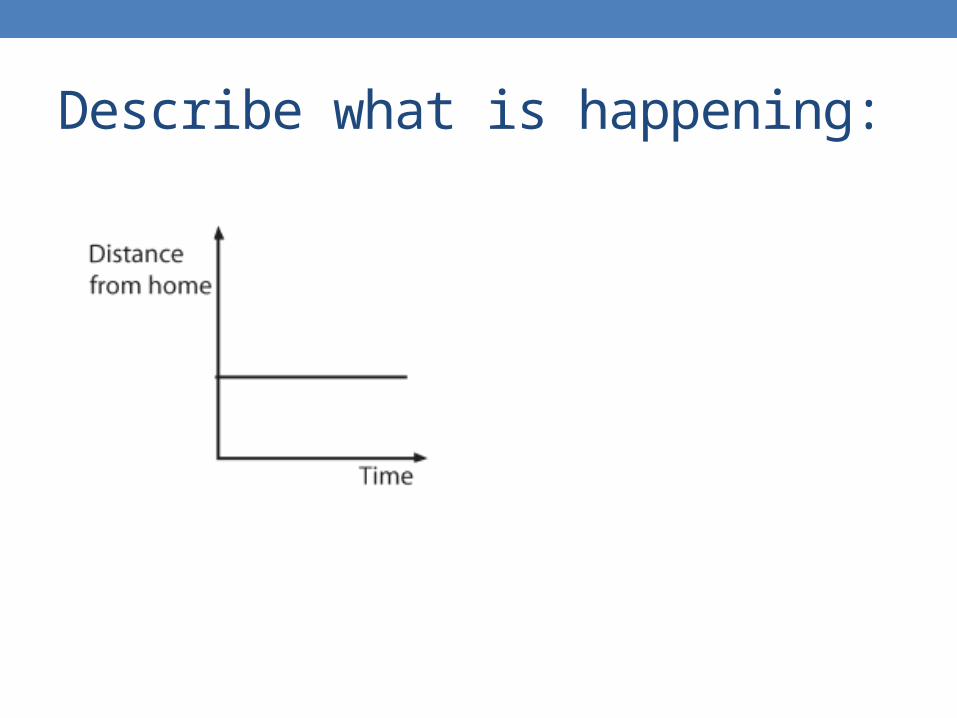
Describe what is happening:
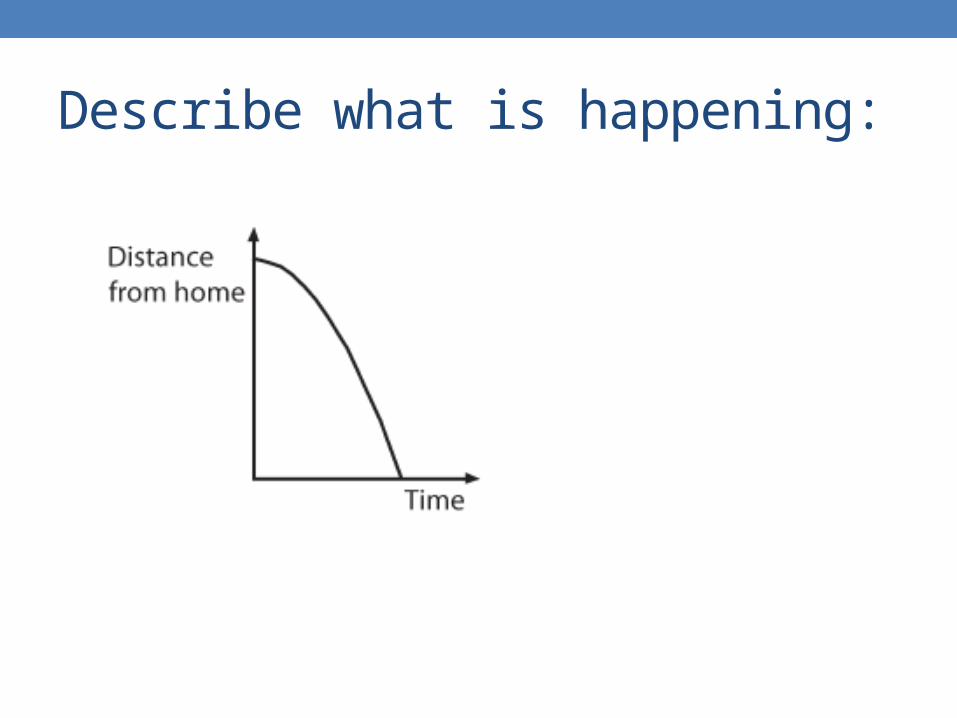
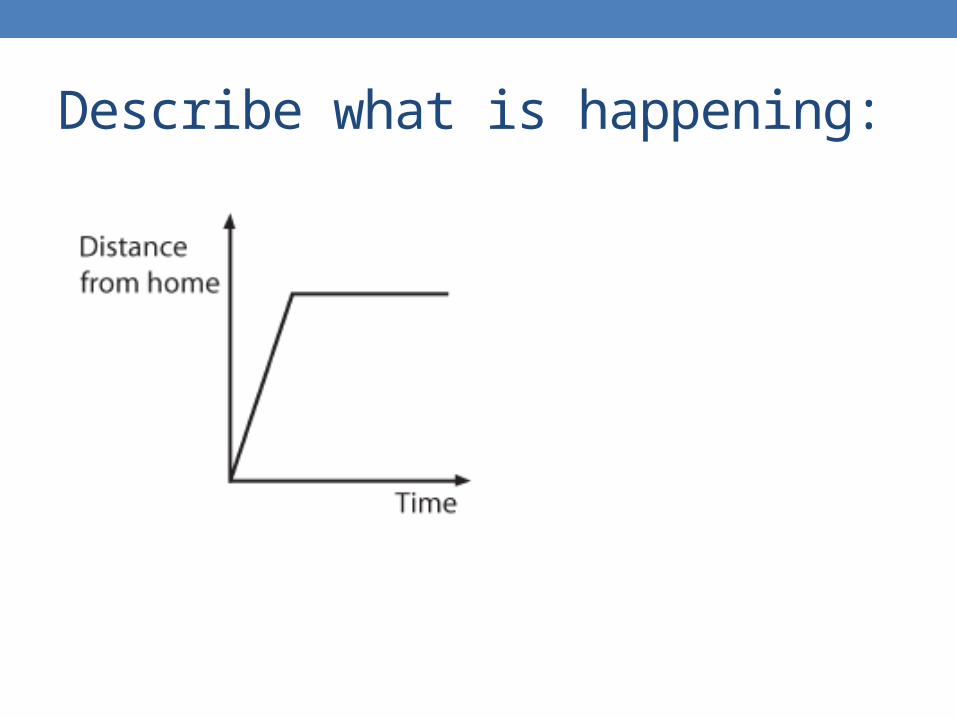
Describe what is happening:
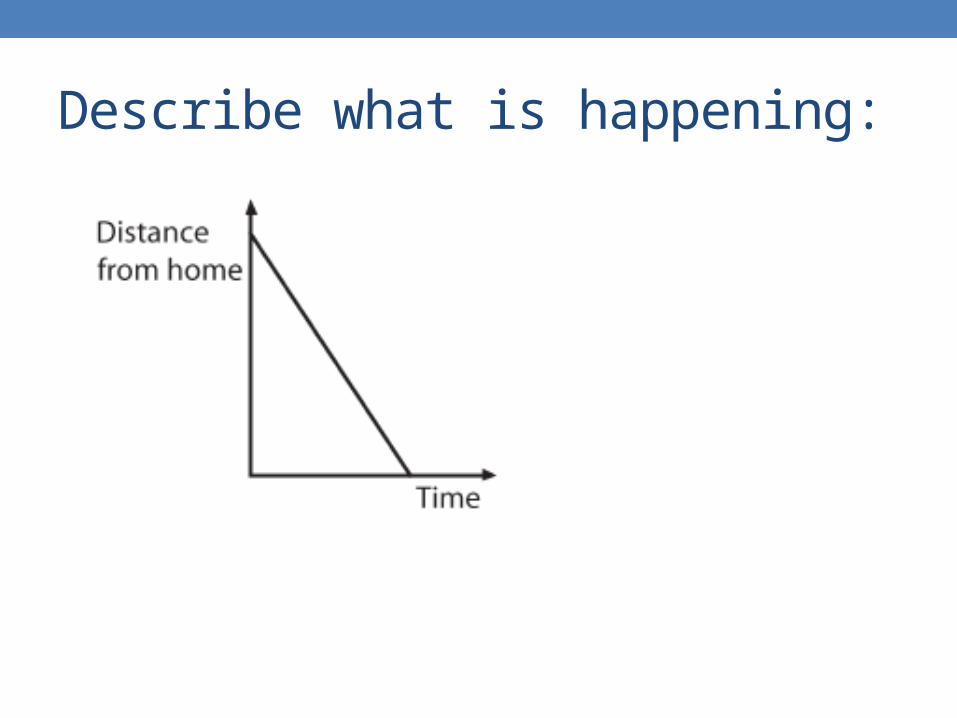
Describe what is happening:
Describe what is happening:
Describe what is happening:
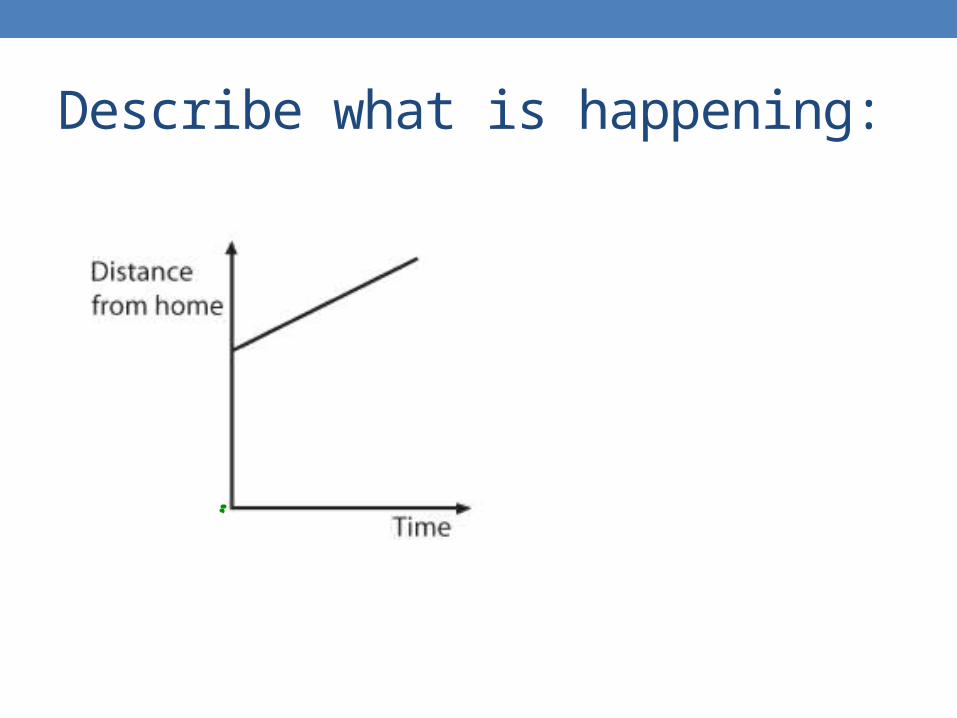
Describe what is happening:
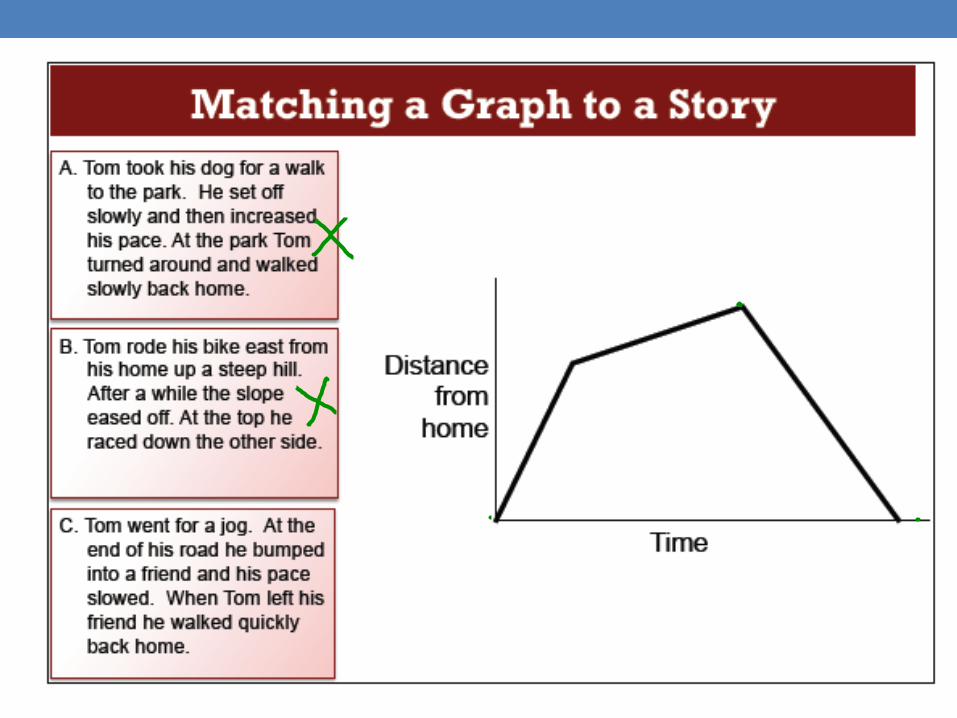
Classwork• Match the graphs with the correct story
Homework• Worksheet