Embed Size (px)
Citation preview
Math 8 NAME: __________________ PERIOD: _____
Unit 4: Chapter 4
Functions and Interpreting Graphs
Essential Question: How can we model relationships between quantities?
Lesson 4.1 – Representing Relationships (CCSS 8.F.4)
I can translate tables and graphs into linear equations.
Lesson 4.2 – Relations (CCSS 8.F.1) I can represent relations using tables and graphs.
Inquiry Lab – Relations and Functions (CCSS 8.F.1) I can determine if a relation is a function.
Lesson 4.3 – Functions (CCSS 8.F.1, 8.F.4) I can use function tables to determine the domain and range of a function.
Lesson 4.4 – Linear Functions (CCSS 8.F.1, 8.F.3, 8.F.4) I can represent linear functions using function tables and graphs.
Lesson 4.5 – Compare Properties of Functions (CCSS 8.F.2, 8.F.4) I can use different representations of two functions to compare the functions.
Lesson 4.7 – Linear and Nonlinear Functions (CCSS 8.F.1, 8.F.3, 8.F.5) I can determine whether a function is linear or nonlinear.
Lesson 4.8 – Quadratic Functions (CCSS 8.F.3, 8.F.5)
I can graph quadratic functions.
Lesson 4.9 – Qualitative Graphs (CCSS 8.F.5)
I can analyze qualitative graphs.
2
3
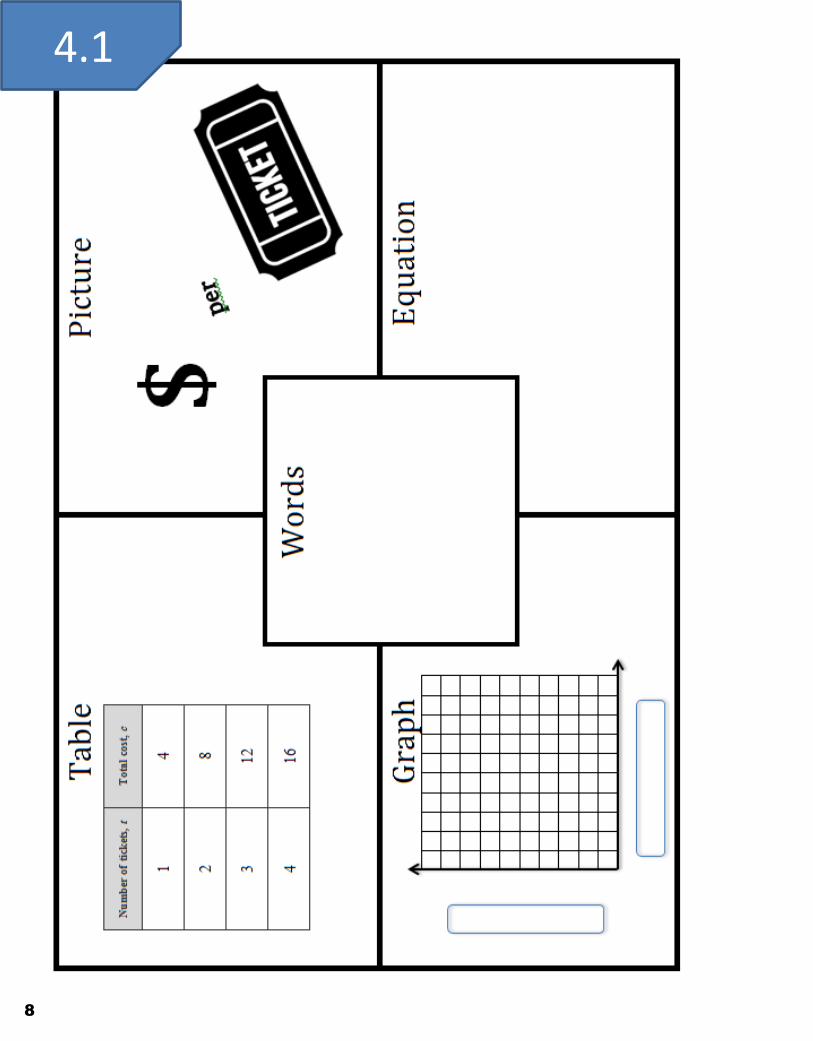
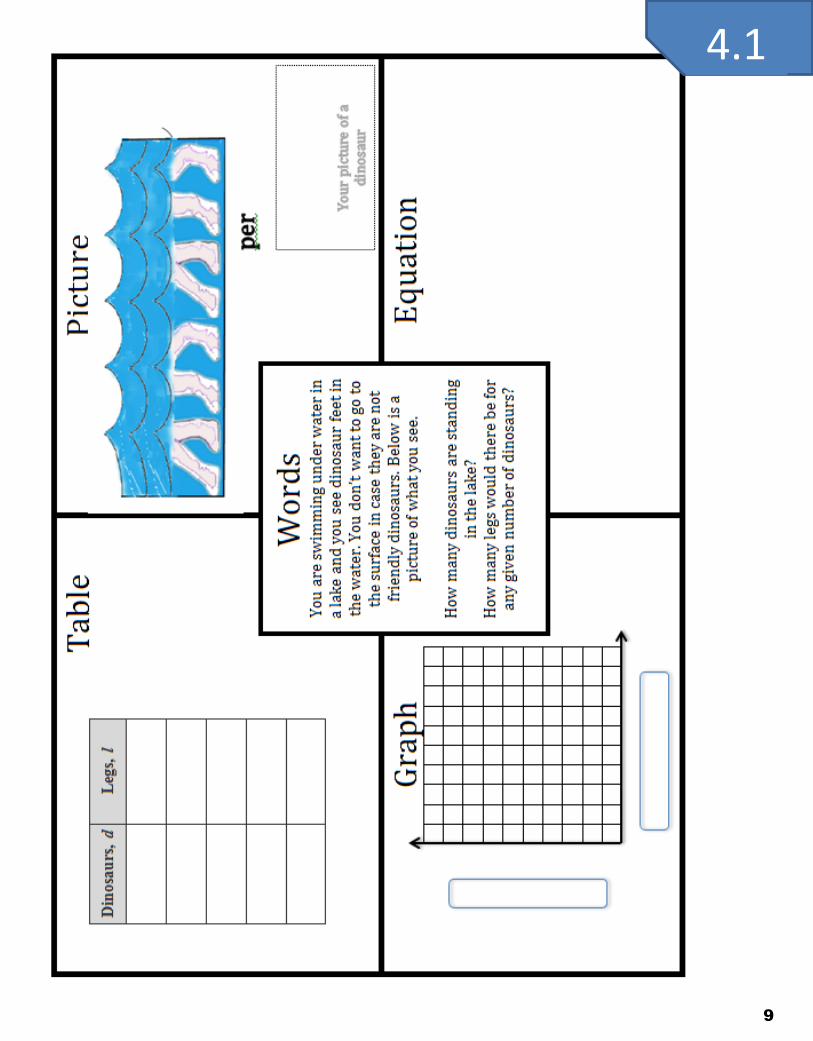
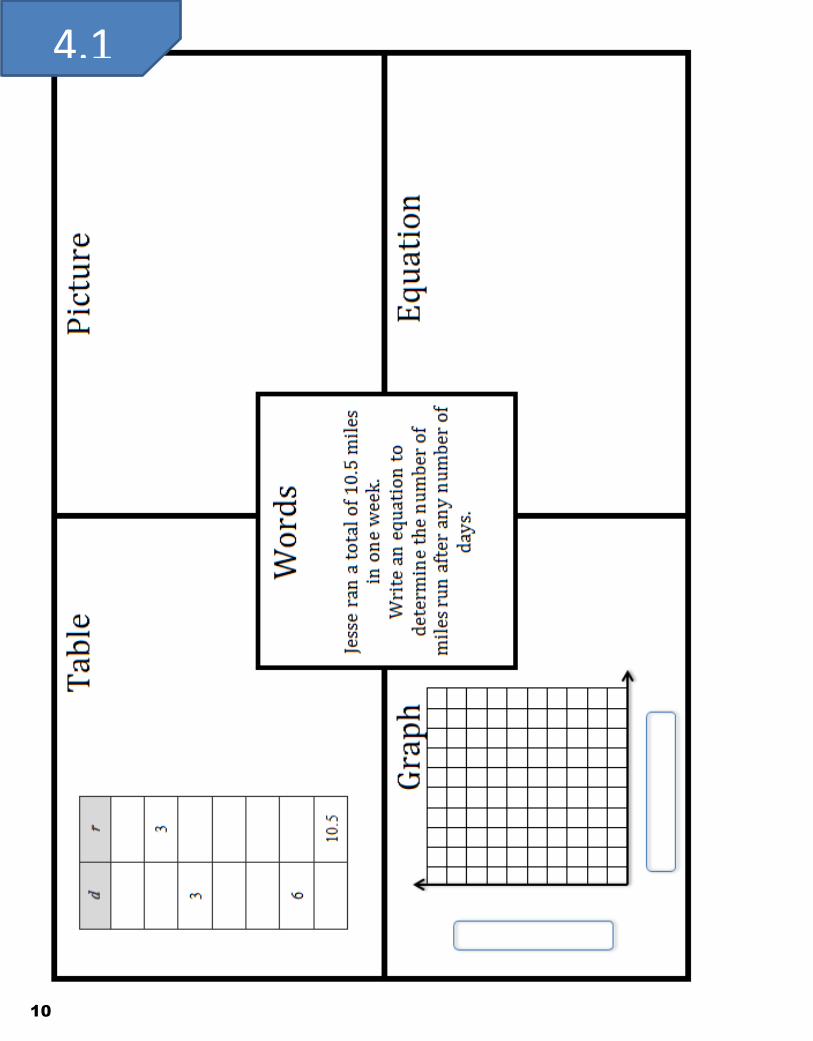
UNIT 4 Lesson 1 Representing Relationships
A Linear Equation can be represented ____ ways:
1. ______ ____ 2. ___________ 3. ______________ 4. _________
Linear Equation:
.
To be considered LINEAR – there MUST be a consistent pattern in the x-values AND y-values.
This is called ___________________________.
o To find Rate of Change:
1. Find the pattern in the ___________________.
2. Find the pattern in the ___________________.
3. Write it as a fraction:
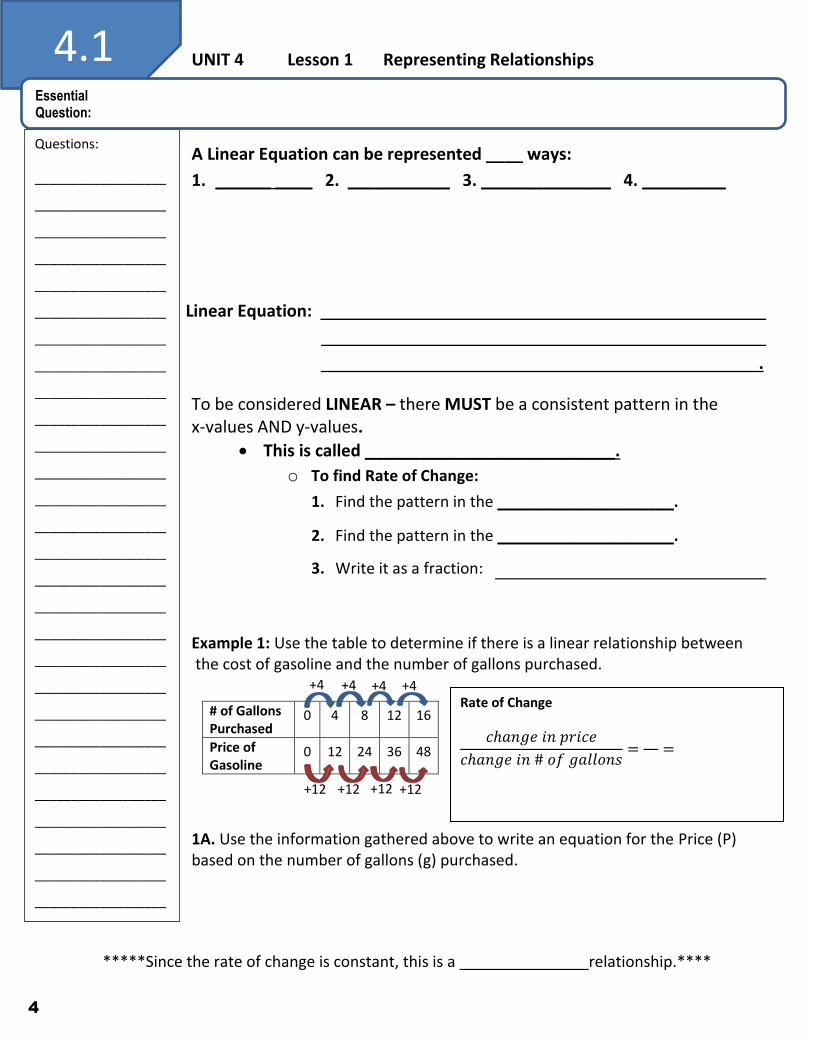
Example 1: Use the table to determine if there is a linear relationship between the cost of gasoline and the number of gallons purchased.
# of Gallons Purchased
0 4 8 12 16
Price of Gasoline
0 12 24 36 48
1A. Use the information gathered above to write an equation for the Price (P) based on the number of gallons (g) purchased.
*****Since the rate of change is constant, this is a relationship.****
4.1
+4
Questions:
__________________
__________________
__________________
__________________
__________________
__________________
__________________
__________________
__________________
__________________
__________________
__________________
__________________
__________________
__________________
__________________
__________________
__________________
__________________
__________________
__________________
__________________
__________________
__________________
__________________
__________________
__________________
__________________
Essential Question:
+4 +4
4
+4
+12
+12 +12 +12
Rate of Change
𝑐ℎ𝑎𝑛𝑔𝑒 𝑖𝑛 𝑝𝑟𝑖𝑐𝑒
𝑐ℎ𝑎𝑛𝑔𝑒 𝑖𝑛 # 𝑜𝑓 𝑔𝑎𝑙𝑙𝑜𝑛𝑠= =
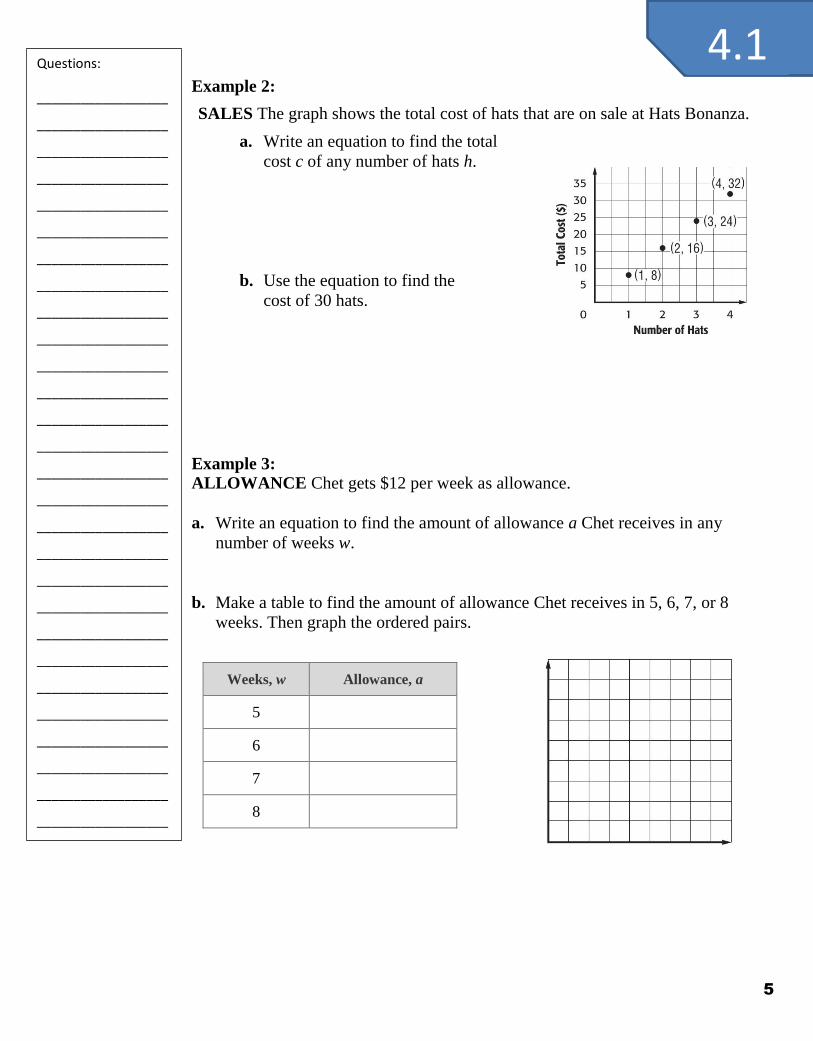
Example 2:
SALES The graph shows the total cost of hats that are on sale at Hats Bonanza.
a. Write an equation to find the total
cost c of any number of hats h.
b. Use the equation to find the
cost of 30 hats.
Example 3:
ALLOWANCE Chet gets $12 per week as allowance.
a. Write an equation to find the amount of allowance a Chet receives in any
number of weeks w.
b. Make a table to find the amount of allowance Chet receives in 5, 6, 7, or 8
weeks. Then graph the ordered pairs.
Weeks, w Allowance, a
5
6
7
8
4.1
5
Questions:
__________________
__________________
__________________
__________________
__________________
__________________
__________________
__________________
__________________
__________________
__________________
__________________
__________________
__________________
__________________
__________________
__________________
__________________
__________________
__________________
__________________
__________________
__________________
__________________
__________________
__________________
__________________
__________________
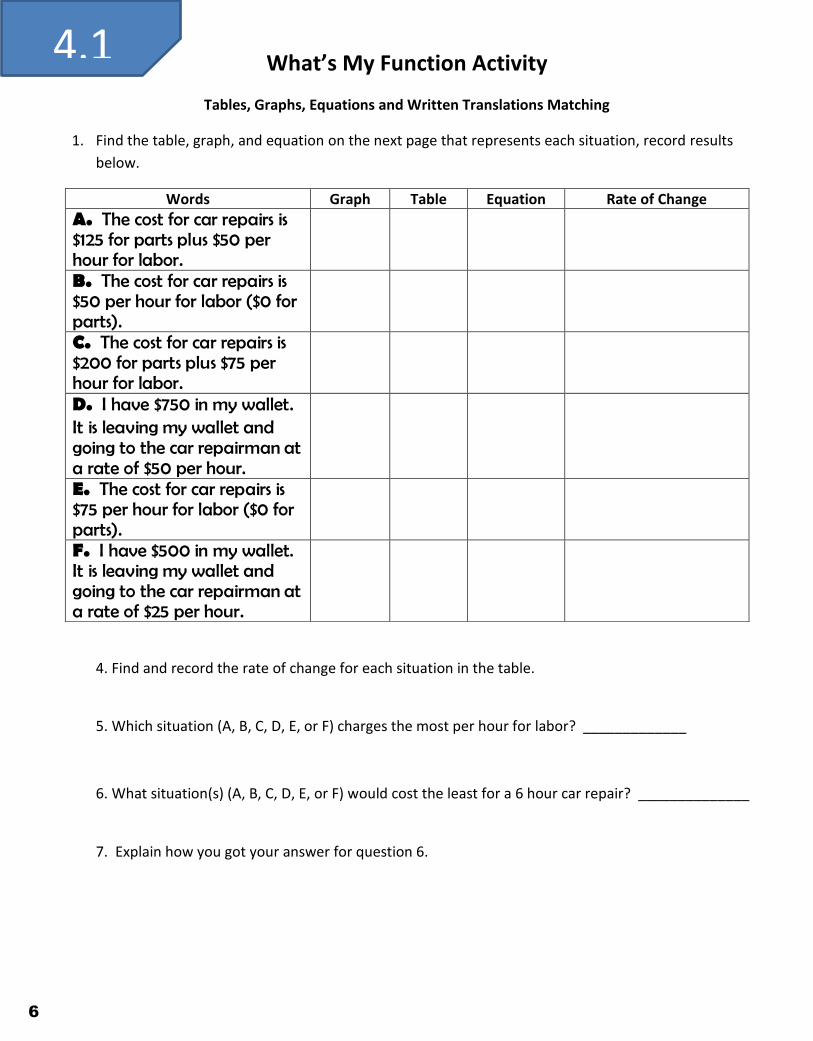
What’s My Function Activity
Tables, Graphs, Equations and Written Translations Matching
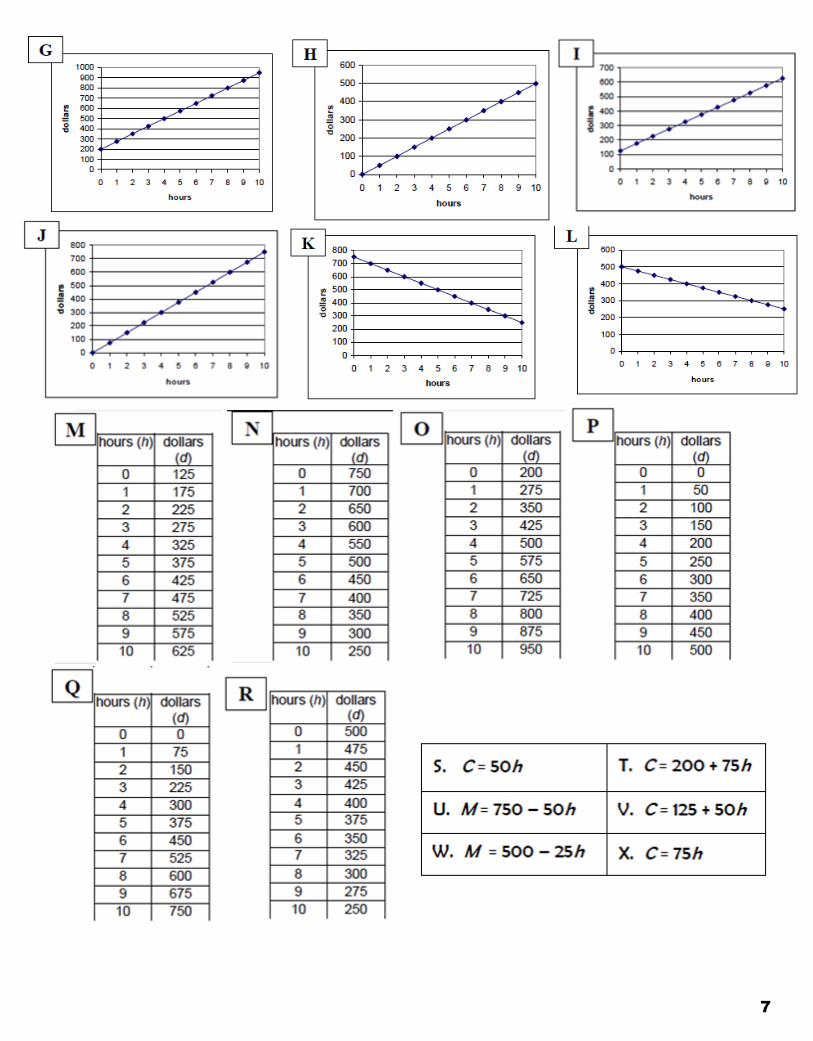
1. Find the table, graph, and equation on the next page that represents each situation, record results
below.
4. Find and record the rate of change for each situation in the table.
5. Which situation (A, B, C, D, E, or F) charges the most per hour for labor? _____________
6. What situation(s) (A, B, C, D, E, or F) would cost the least for a 6 hour car repair? ______________
7. Explain how you got your answer for question 6.
Words Graph Table Equation Rate of Change
A. The cost for car repairs is $125 for parts plus $50 per hour for labor.
B. The cost for car repairs is $50 per hour for labor ($0 for parts).
C. The cost for car repairs is $200 for parts plus $75 per hour for labor.
D. I have $750 in my wallet. It is leaving my wallet and going to the car repairman at a rate of $50 per hour.
E. The cost for car repairs is $75 per hour for labor ($0 for parts).
F. I have $500 in my wallet. It is leaving my wallet and going to the car repairman at a rate of $25 per hour.
4.1
6
7
4.1
8
4.1
9
4.1
10
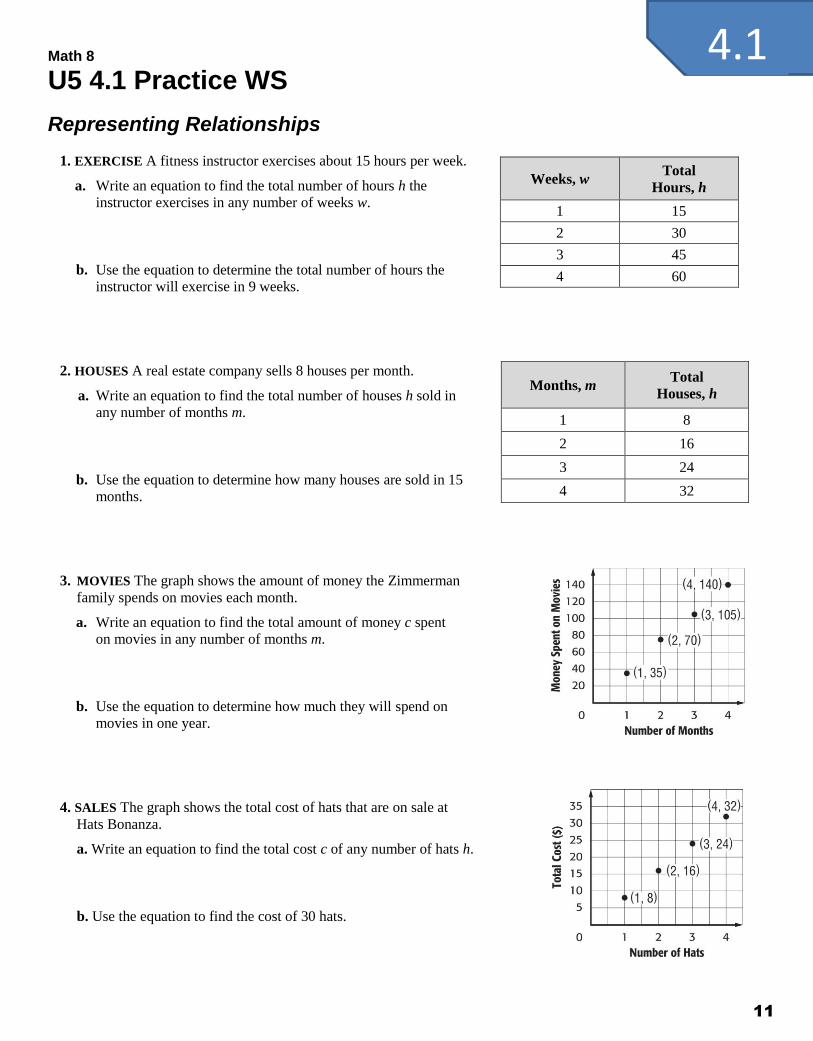
Math 8
U5 4.1 Practice WS
Representing Relationships
1. EXERCISE A fitness instructor exercises about 15 hours per week.
a. Write an equation to find the total number of hours h the
instructor exercises in any number of weeks w.
b. Use the equation to determine the total number of hours the
instructor will exercise in 9 weeks.
2. HOUSES A real estate company sells 8 houses per month.
a. Write an equation to find the total number of houses h sold in
any number of months m.
b. Use the equation to determine how many houses are sold in 15
months.
3. MOVIES The graph shows the amount of money the Zimmerman
family spends on movies each month.
a. Write an equation to find the total amount of money c spent
on movies in any number of months m.
b. Use the equation to determine how much they will spend on
movies in one year.
4. SALES The graph shows the total cost of hats that are on sale at
Hats Bonanza.
a. Write an equation to find the total cost c of any number of hats h.
b. Use the equation to find the cost of 30 hats.
Weeks, w Total
Hours, h
1 15
2 30
3 45
4 60
Months, m Total
Houses, h
1 8
2 16
3 24
4 32
4.1
11
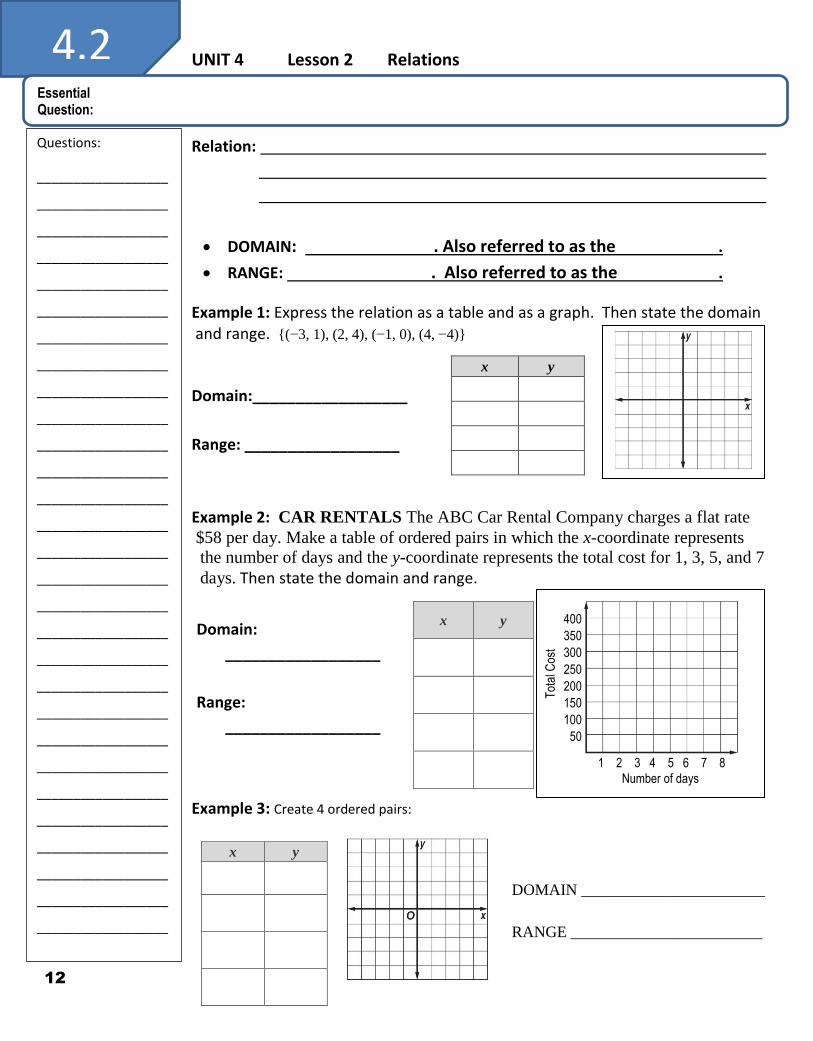
UNIT 4 Lesson 2 Relations
Relation:
DOMAIN: . Also referred to as the .
RANGE: . Also referred to as the .
Example 1: Express the relation as a table and as a graph. Then state the domain and range. {(−3, 1), (2, 4), (−1, 0), (4, −4)}
Domain:__________________
Range: __________________
Example 2: CAR RENTALS The ABC Car Rental Company charges a flat rate
$58 per day. Make a table of ordered pairs in which the x-coordinate represents
the number of days and the y-coordinate represents the total cost for 1, 3, 5, and 7
days. Then state the domain and range.
Example 3: Create 4 ordered pairs:
x y
x y
1 2 3 4 5 6 7 8
Number of days
400
350
300
250
200
150
100
50
Tot
al C
ost
Domain:
__________________
Range:
__________________
4.2
12
Essential Question:
DOMAIN _______________________
RANGE ________________________
x y
Questions:
__________________
__________________
__________________
__________________
__________________
__________________
__________________
__________________
__________________
__________________
__________________
__________________
__________________
__________________
__________________
__________________
__________________
__________________
__________________
__________________
__________________
__________________
__________________
__________________
__________________
__________________
__________________
__________________
__________________
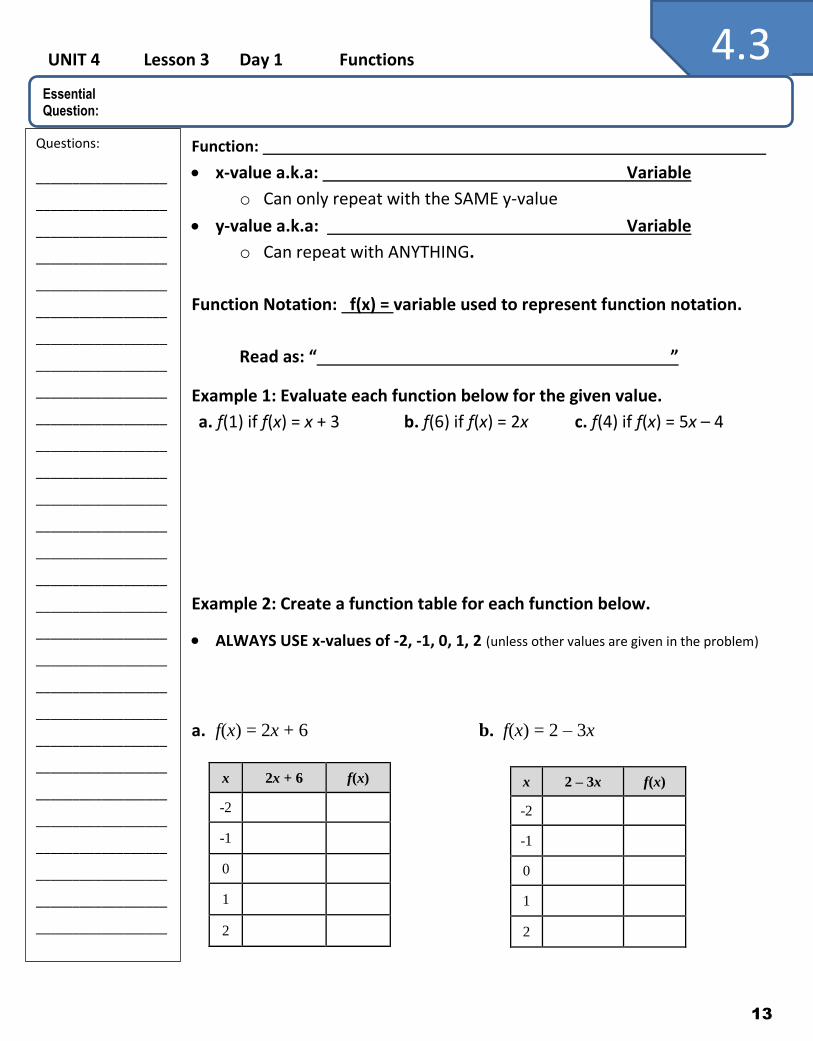
UNIT 4 Lesson 3 Day 1 Functions
Function:
x-value a.k.a: Variable
o Can only repeat with the SAME y-value
y-value a.k.a: Variable
o Can repeat with ANYTHING.
Function Notation: f(x) = variable used to represent function notation.
Read as: “ ”
Example 1: Evaluate each function below for the given value.
a. f(1) if f(x) = x + 3 b. f(6) if f(x) = 2x c. f(4) if f(x) = 5x – 4
Example 2: Create a function table for each function below.
ALWAYS USE x-values of -2, -1, 0, 1, 2 (unless other values are given in the problem)
a. f(x) = 2x + 6 b. f(x) = 2 – 3x
x 2x + 6 f(x)
-2
-1
0
1
2
x 2 – 3x f(x)
-2
-1
0
1
2
4.3
13
Essential Question:
Questions:
__________________
__________________
__________________
__________________
__________________
__________________
__________________
__________________
__________________
__________________
__________________
__________________
__________________
__________________
__________________
__________________
__________________
__________________
__________________
__________________
__________________
__________________
__________________
__________________
__________________
__________________
__________________
__________________
__________________
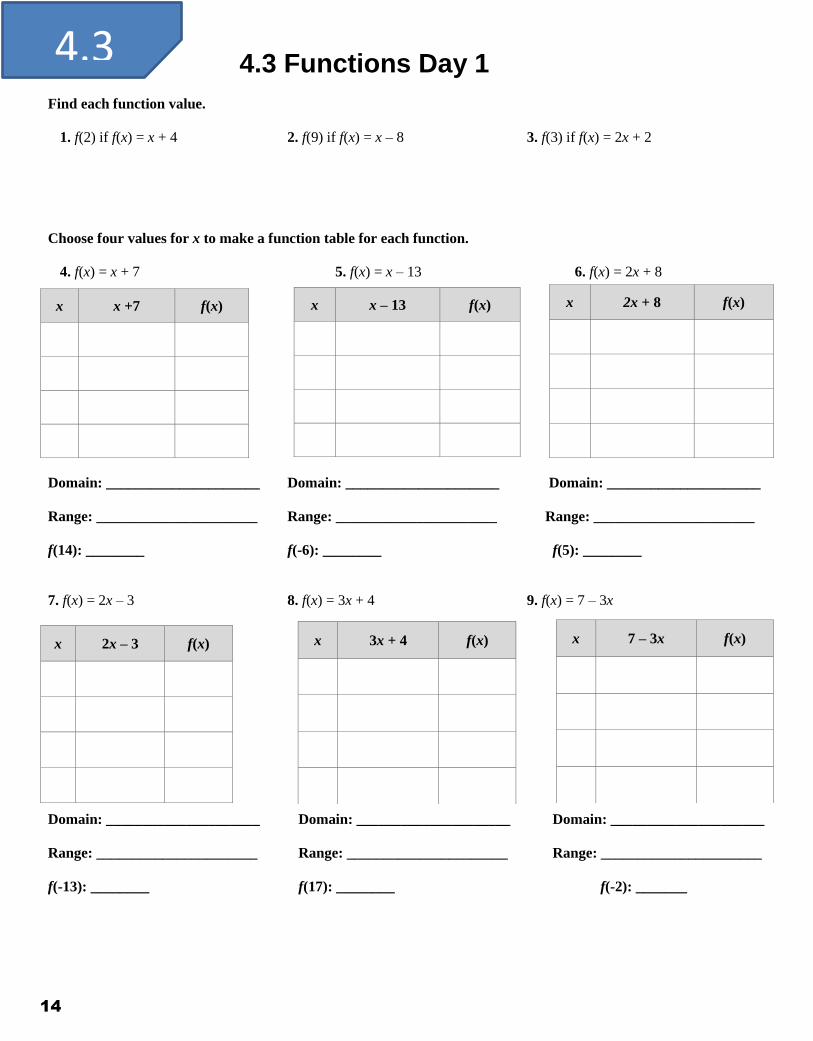
4.3 Functions Day 1
Find each function value.
1. f(2) if f(x) = x + 4 2. f(9) if f(x) = x – 8 3. f(3) if f(x) = 2x + 2
Choose four values for x to make a function table for each function.
4. f(x) = x + 7 5. f(x) = x – 13 6. f(x) = 2x + 8
Domain: _____________________ Domain: _____________________ Domain: _____________________
Range: ______________________ Range: ______________________ Range: ______________________
f(14): ________ f(-6): ________ f(5): ________
7. f(x) = 2x – 3 8. f(x) = 3x + 4 9. f(x) = 7 – 3x
Domain: _____________________ Domain: _____________________ Domain: _____________________
Range: ______________________ Range: ______________________ Range: ______________________
f(-13): ________ f(17): ________ f(-2): _______
x x +7 f(x)
x x – 13 f(x)
x 2x + 8 f(x)
x 7 – 3x f(x)
x 2x – 3 f(x)
x 3x + 4 f(x)
4.3
14
4.3
15
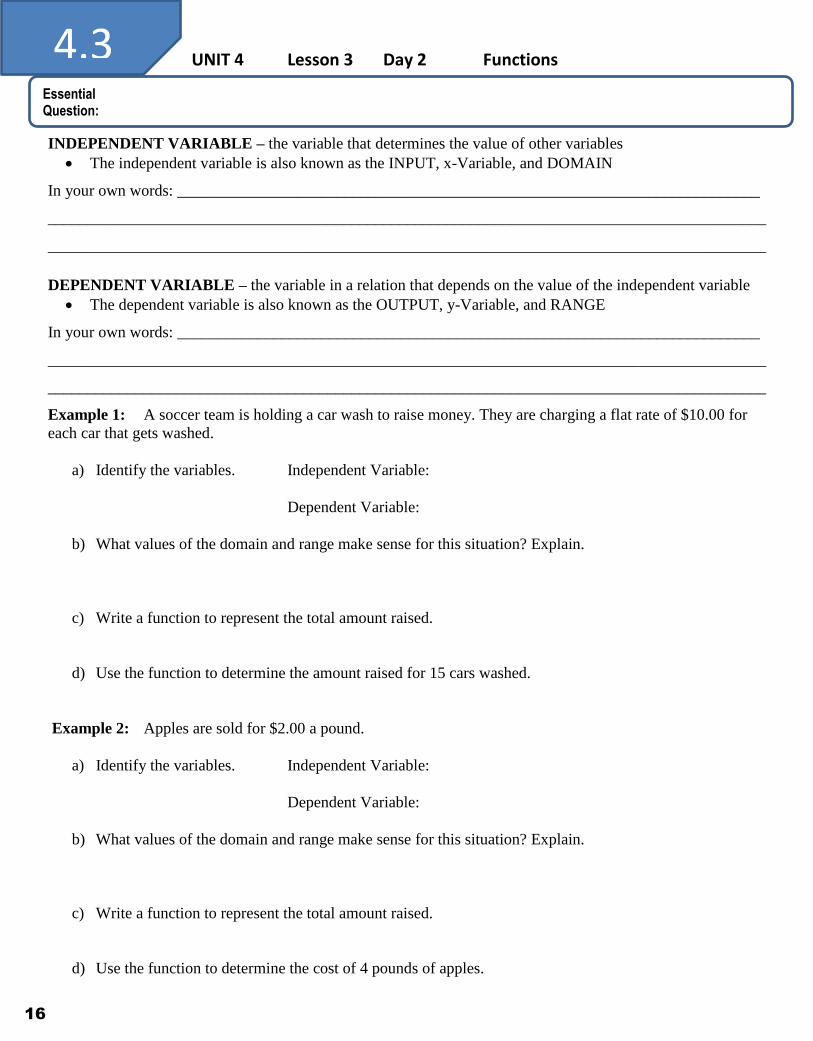
UNIT 4 Lesson 3 Day 2 Functions
INDEPENDENT VARIABLE – the variable that determines the value of other variables
The independent variable is also known as the INPUT, x-Variable, and DOMAIN
In your own words: _________________________________________________________________________
__________________________________________________________________________________________
__________________________________________________________________________________________
DEPENDENT VARIABLE – the variable in a relation that depends on the value of the independent variable
The dependent variable is also known as the OUTPUT, y-Variable, and RANGE
In your own words: _________________________________________________________________________
__________________________________________________________________________________________
__________________________________________________________________________________________
Example 1: A soccer team is holding a car wash to raise money. They are charging a flat rate of $10.00 for
each car that gets washed.
a) Identify the variables. Independent Variable:
Dependent Variable:
b) What values of the domain and range make sense for this situation? Explain.
c) Write a function to represent the total amount raised.
d) Use the function to determine the amount raised for 15 cars washed.
Example 2: Apples are sold for $2.00 a pound.
a) Identify the variables. Independent Variable:
Dependent Variable:
b) What values of the domain and range make sense for this situation? Explain.
c) Write a function to represent the total amount raised.
d) Use the function to determine the cost of 4 pounds of apples.
4.3
16
Essential Question:

Math 8 U4.1-U4.3 Review
Use the table to complete problems 1 – 3
1. A marathon runner runs about 25 hours per week. Write an equation to find the total number of hours h the runner runs in any number of weeks w. Then complete the table at the right.
2. Use the equation to determine the total number of hours the
runner will run in 9 weeks.
3. State the Domain and Range for the table given above.
4. Express the relation as a table and a graph. Then state the domain and range. {(1, −2), (0, 2), (−4, −5), (2, −2)}
Domain: _____________________
Range: ______________________
Evaluate the functions for f(6).
5. f(x) = 5x + 7 6. f(x) = −2x – 6 For Exercises 7-9, complete the function table given. Then state the domain and range for each function. Show your
work.
7. 8. Domain: ___________________ Domain: ___________________
Range: ____________________ Range: ____________________
x f(x) = -3x + 2 f(x)
-3
-2
-1
0
1
x f(x) = 4x f(x)
-2
-1
0
1
2
Weeks, w Total
Hours, h
1
3
6
12
x y
4.1-4.3 Review
17
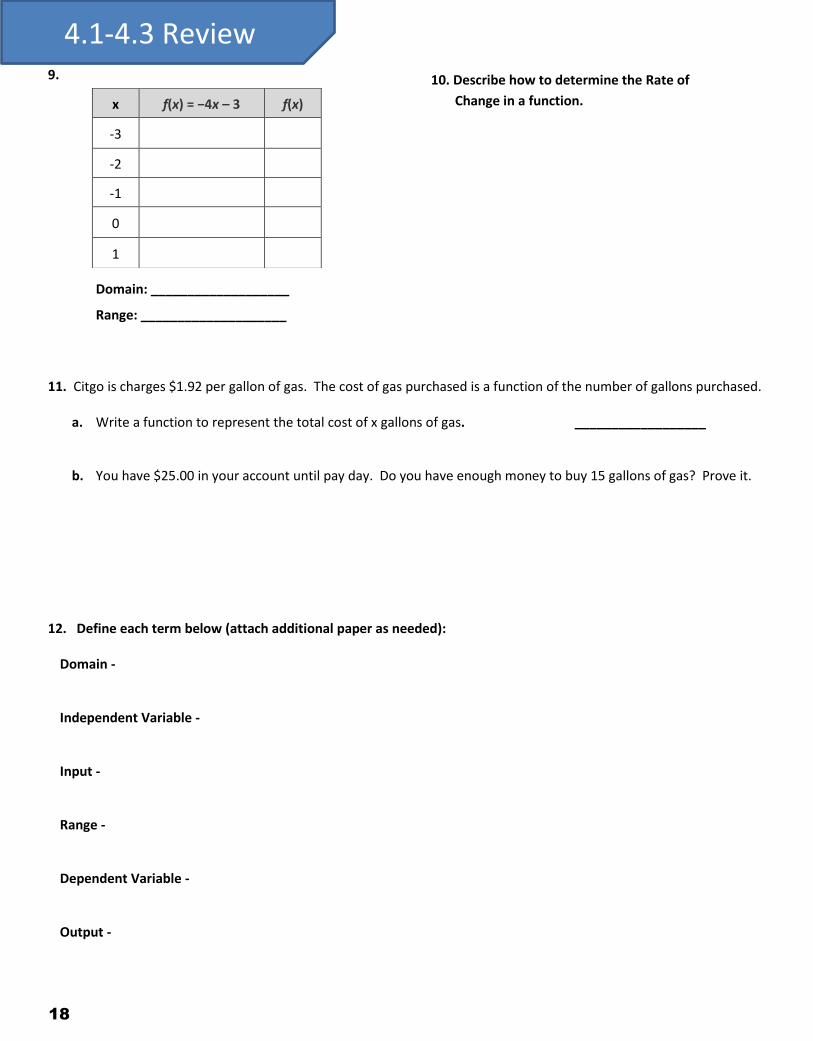
9. Domain: ___________________
Range: ____________________ 11. Citgo is charges $1.92 per gallon of gas. The cost of gas purchased is a function of the number of gallons purchased.
a. Write a function to represent the total cost of x gallons of gas. __________________
b. You have $25.00 in your account until pay day. Do you have enough money to buy 15 gallons of gas? Prove it.
12. Define each term below (attach additional paper as needed): Domain - Independent Variable - Input - Range - Dependent Variable - Output -
x f(x) = −4x – 3 f(x)
-3
-2
-1
0
1
10. Describe how to determine the Rate of
Change in a function.
4.1-4.3 Review
18

UNIT 4 Lesson 4 Linear Functions
Linear Function: line. Discrete Data: It is for data outcomes to be between
the values in your table. The graph is represented by that are NOT connected.
Examples: number of kids in a class, number of desks
Continuous Data:
. The graph is a line.
Examples: Ounces in a glass, weight of a person, hours spent working
Graphing a Linear Function:
a) Write Equation ( )
b) Create using input values of -2, -1, 0, 1, 2.
a. Unless given .
c) Complete Table using your equation.
d) Write out
e) Create a to fit the ordered pairs.
f) P______ the points
a. C s Data: C t the points
b. D Data: D connect the points.
Example 1: Graph the functions given below.
a. y = x + 3
b. y = 2x – 1
x x + 3 y (x, y)
–2
-1
0
1
2
x 2x - 1 y (x, y)
–2
-1
0
1
2
4.4
19
Essential Question:
Questions:
__________________
__________________
__________________
__________________
__________________
__________________
__________________
__________________
__________________
__________________
__________________
__________________
__________________
__________________
__________________
__________________
__________________
__________________
__________________
__________________
__________________
__________________
__________________
__________________
__________________
__________________
__________________
__________________
__________________
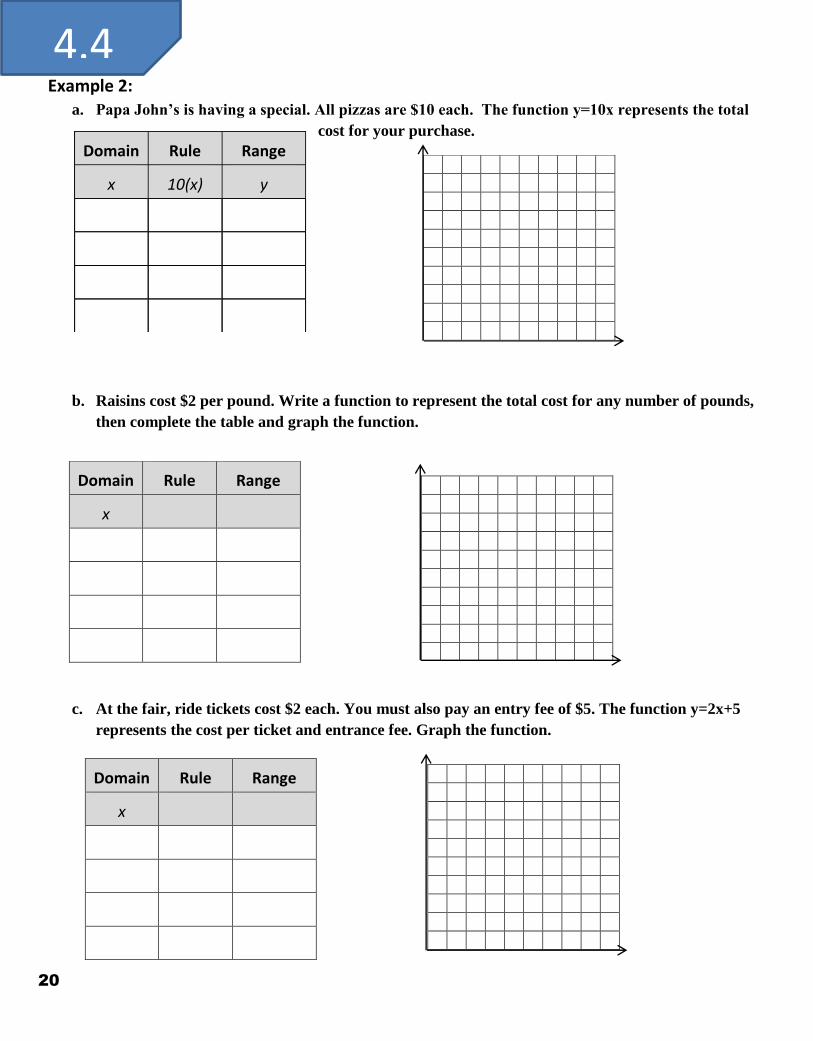
Example 2: a. Papa John’s is having a special. All pizzas are $10 each. The function y=10x represents the total
cost for your purchase.
b. Raisins cost $2 per pound. Write a function to represent the total cost for any number of pounds,
then complete the table and graph the function.
c. At the fair, ride tickets cost $2 each. You must also pay an entry fee of $5. The function y=2x+5
represents the cost per ticket and entrance fee. Graph the function.
Domain Rule Range
x 10(x) y
Domain Rule Range
x 10(x) y
Domain Rule Range
x 10(x) y
Domain Rule Range
x
Domain Rule Range
x
4.4
20
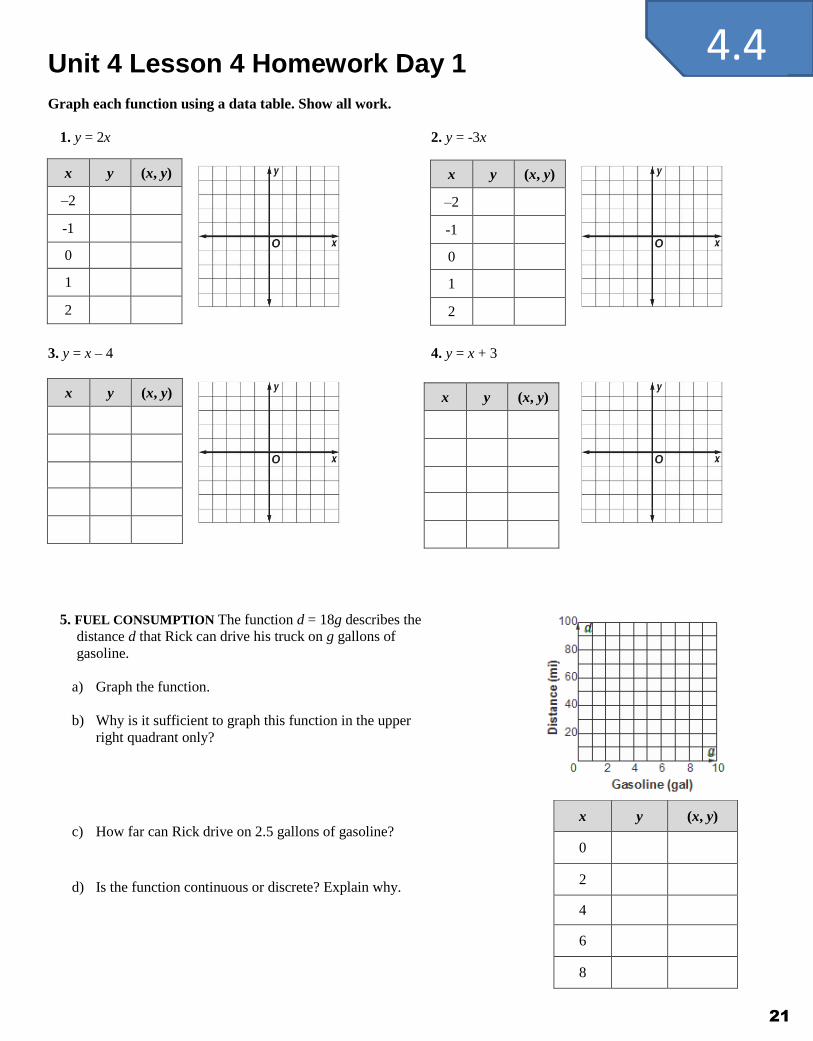
Unit 4 Lesson 4 Homework Day 1 Graph each function using a data table. Show all work.
1. y = 2x 2. y = -3x
3. y = x – 4 4. y = x + 3
5. FUEL CONSUMPTION The function d = 18g describes the
distance d that Rick can drive his truck on g gallons of
gasoline.
a) Graph the function.
b) Why is it sufficient to graph this function in the upper
right quadrant only?
c) How far can Rick drive on 2.5 gallons of gasoline?
d) Is the function continuous or discrete? Explain why.
x y (x, y)
–2
-1
0
1
2
x y (x, y)
–2
-1
0
1
2
x y (x, y)
x y (x, y)
x y (x, y)
0
2
4
6
8
4.4
21
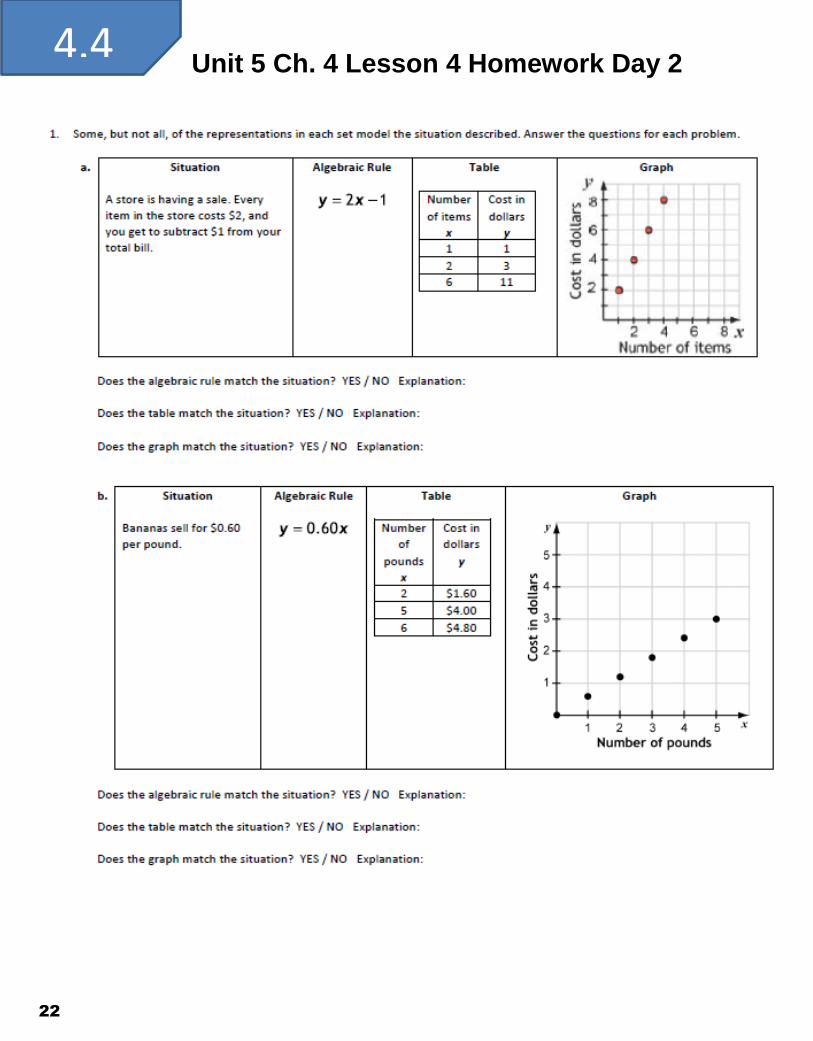
Unit 5 Ch. 4 Lesson 4 Homework Day 2
4.4
22
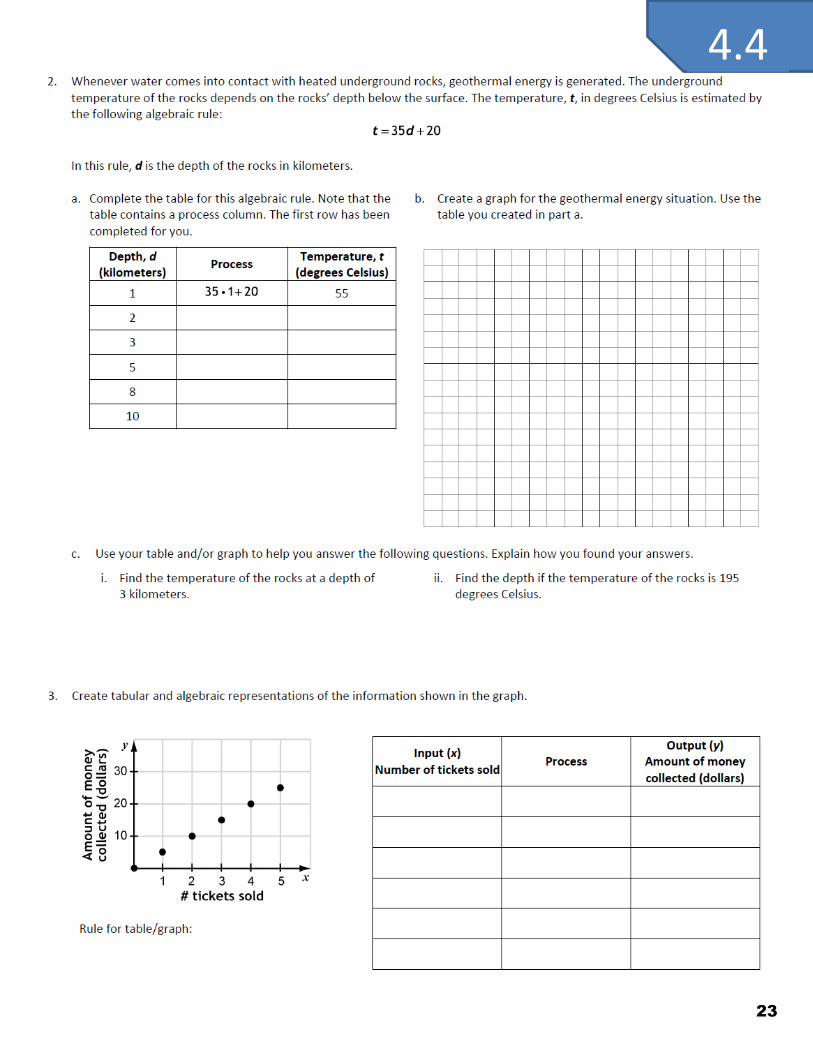
4.4
23
UNIT 4 Lesson 5 Compare Properties of Functions
To compare , find and compare the
of one function to the of the other function.
Recall that can be given using an ,
, , or .
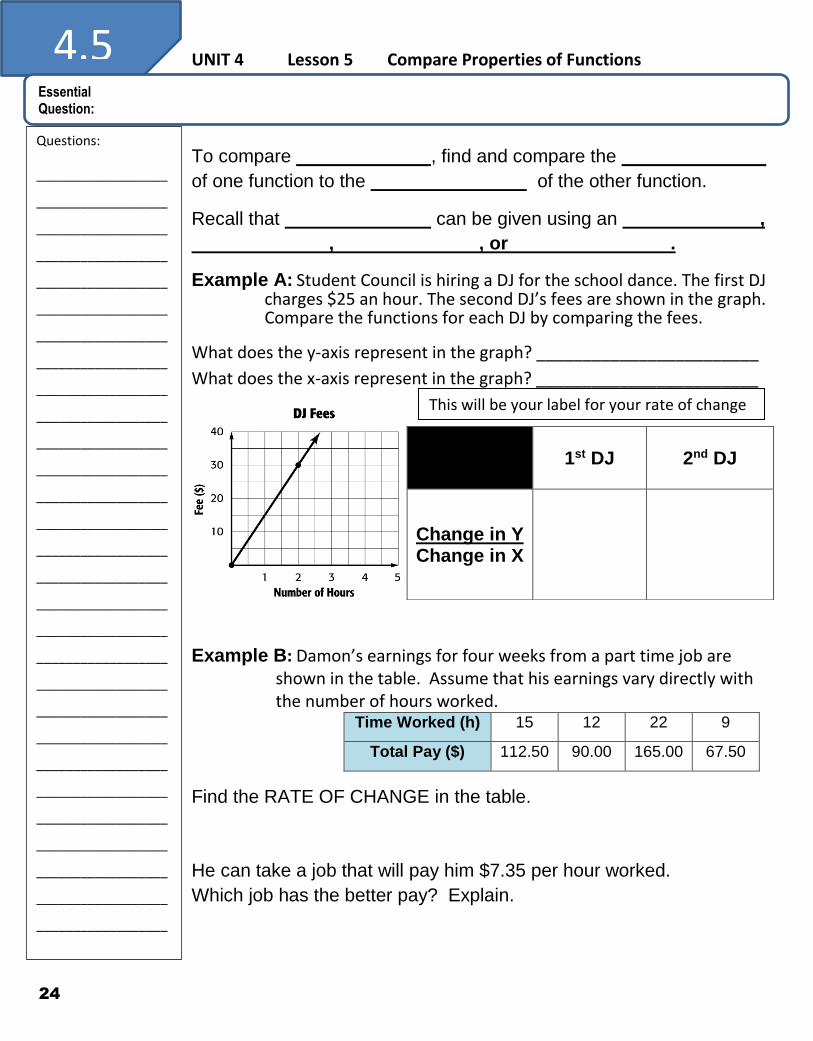
Example A: Student Council is hiring a DJ for the school dance. The first DJ charges $25 an hour. The second DJ’s fees are shown in the graph. Compare the functions for each DJ by comparing the fees.
What does the y-axis represent in the graph? ________________________
What does the x-axis represent in the graph? ________________________
Example B: Damon’s earnings for four weeks from a part time job are shown in the table. Assume that his earnings vary directly with the number of hours worked.
Time Worked (h) 15 12 22 9
Total Pay ($) 112.50 90.00 165.00 67.50
Find the RATE OF CHANGE in the table.
He can take a job that will pay him $7.35 per hour worked.
Which job has the better pay? Explain.
1st DJ 2nd DJ
Change in Y Change in X
This will be your label for your rate of change
4.5
24
Essential Question:
Questions:
__________________
__________________
__________________
__________________
__________________
__________________
__________________
__________________
__________________
__________________
__________________
__________________
__________________
__________________
__________________
__________________
__________________
__________________
__________________
__________________
__________________
__________________
__________________
__________________
__________________
__________________
__________________
__________________
__________________
PRACTICE
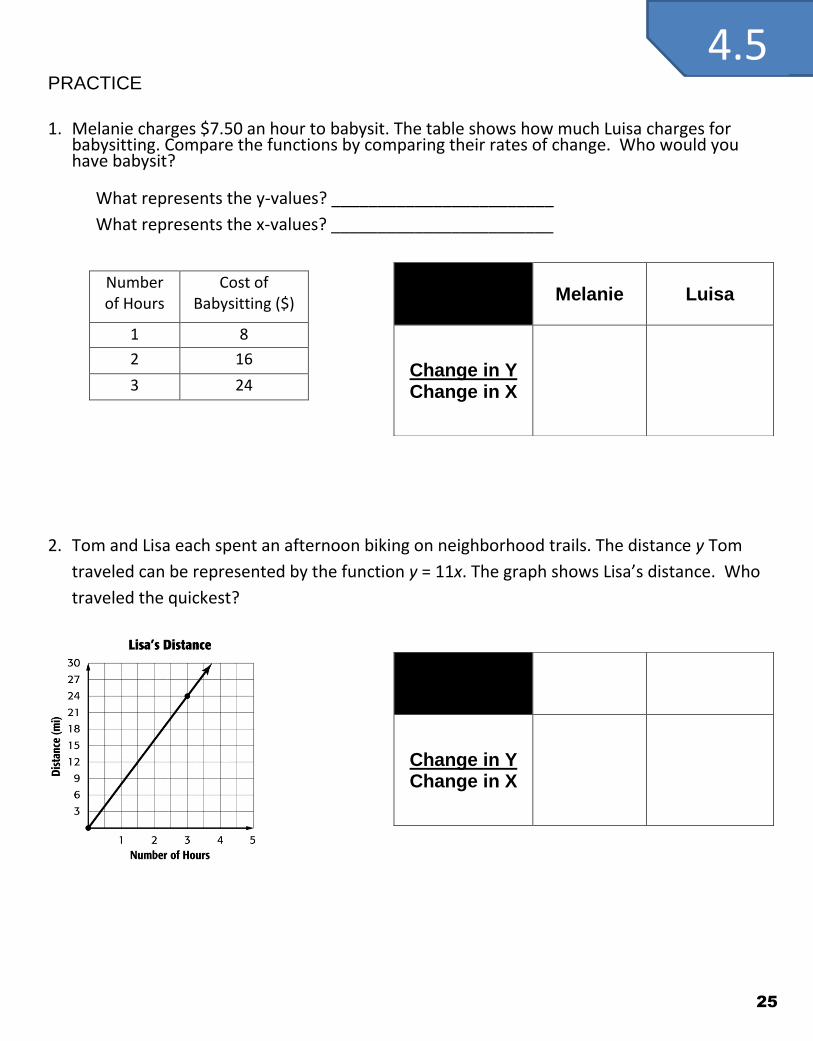
1. Melanie charges $7.50 an hour to babysit. The table shows how much Luisa charges for
babysitting. Compare the functions by comparing their rates of change. Who would you have babysit?
What represents the y-values? ________________________
What represents the x-values? ________________________
Number of Hours
Cost of Babysitting ($)
1 8
2 16
3 24
2. Tom and Lisa each spent an afternoon biking on neighborhood trails. The distance y Tom
traveled can be represented by the function y = 11x. The graph shows Lisa’s distance. Who
traveled the quickest?
Melanie Luisa
Change in Y Change in X
Change in Y Change in X
4.5
25
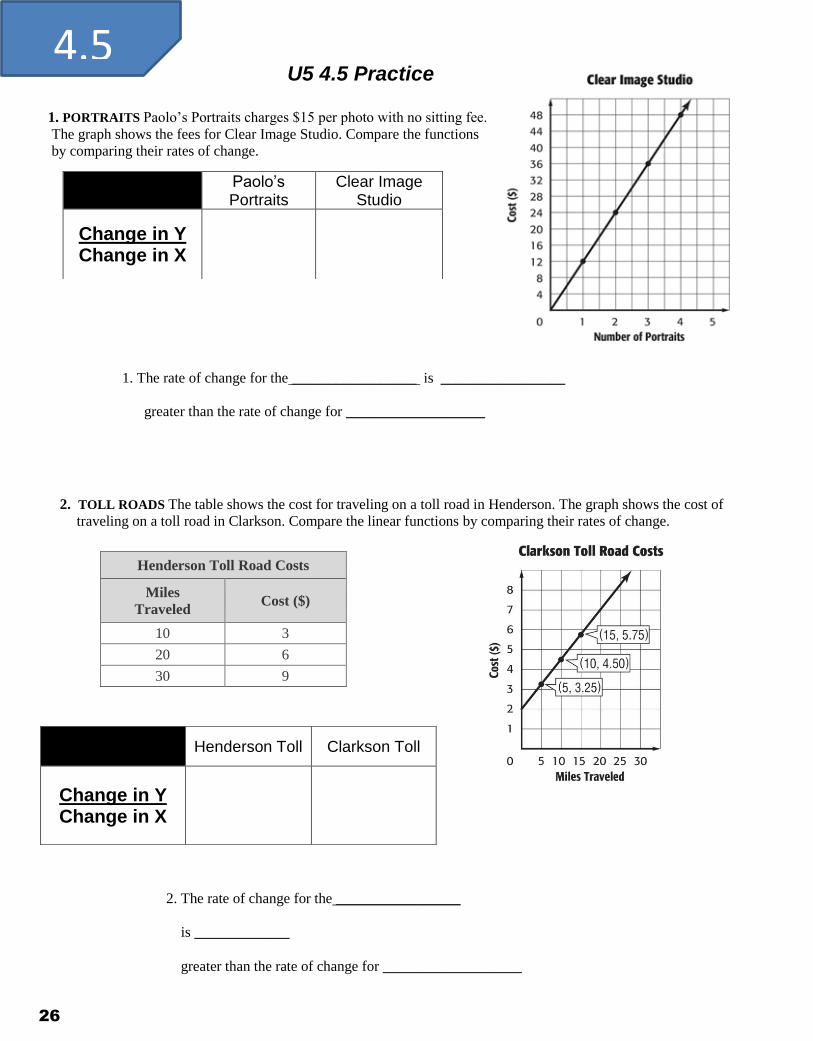
U5 4.5 Practice 1. PORTRAITS Paolo’s Portraits charges $15 per photo with no sitting fee.
The graph shows the fees for Clear Image Studio. Compare the functions
by comparing their rates of change.
2. TOLL ROADS The table shows the cost for traveling on a toll road in Henderson. The graph shows the cost of
traveling on a toll road in Clarkson. Compare the linear functions by comparing their rates of change.
Paolo’s Portraits
Clear Image Studio
Change in Y Change in X
Henderson Toll Clarkson Toll
Change in Y Change in X
Henderson Toll Road Costs
Miles
Traveled Cost ($)
10 3
20 6
30 9
1. The rate of change for the _________________ is _________________
greater than the rate of change for ___________________
2. The rate of change for the _________________
is _____________
greater than the rate of change for ___________________
4.5
26
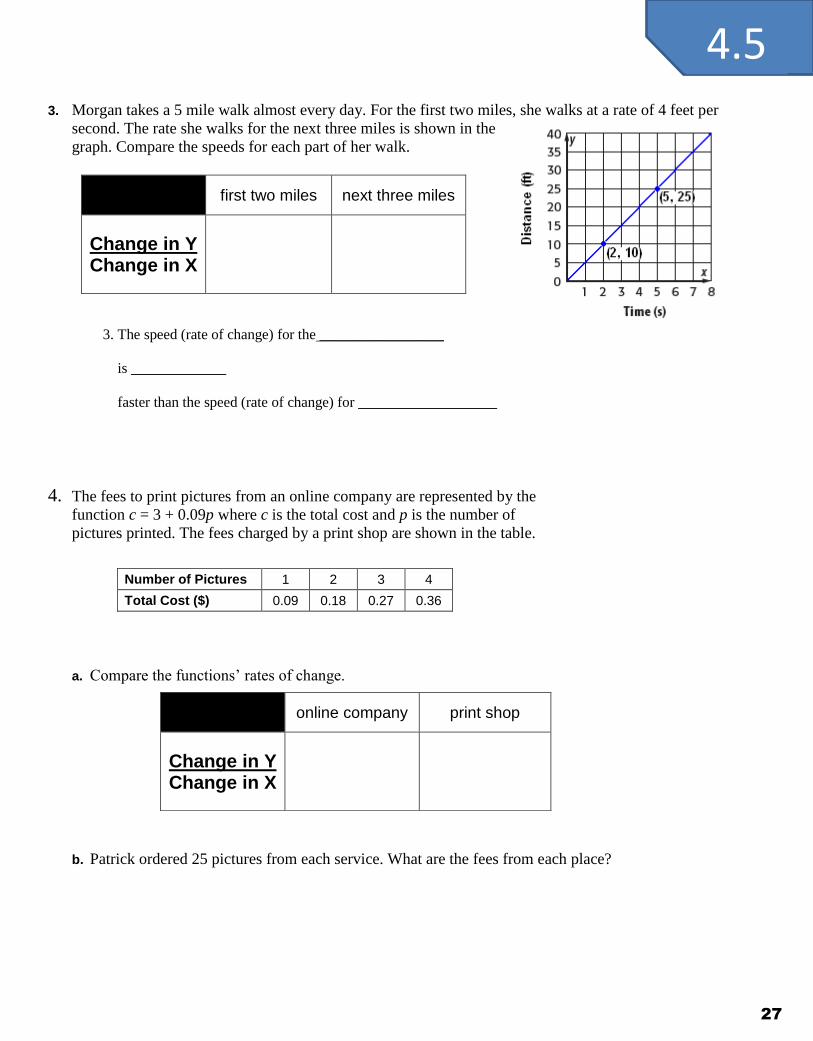
3. Morgan takes a 5 mile walk almost every day. For the first two miles, she walks at a rate of 4 feet per
second. The rate she walks for the next three miles is shown in the
graph. Compare the speeds for each part of her walk. First part: 4 feet per second part: 5 feet per second. The rate for
the last
three miles is greater by one foot per second.
4. The fees to print pictures from an online company are represented by the
function c = 3 + 0.09p where c is the total cost and p is the number of
pictures printed. The fees charged by a print shop are shown in the table.
Number of Pictures 1 2 3 4
Total Cost ($) 0.09 0.18 0.27 0.36
a. Compare the functions’ rates of change. Online company: $0.09 per picture;
Print shop: $0.09 per picture; Both have the same rate of change, but the print shop has a y-intercept of 0 and the online company has a y-
intercept of 3.
b. Patrick ordered 25 pictures from each service. What are the fees from each place? online company: $5.25; print shop: $2.25
first two miles next three miles
Change in Y Change in X
online company print shop
Change in Y Change in X
3. The speed (rate of change) for the _________________
is _____________
faster than the speed (rate of change) for ___________________
4.5
27
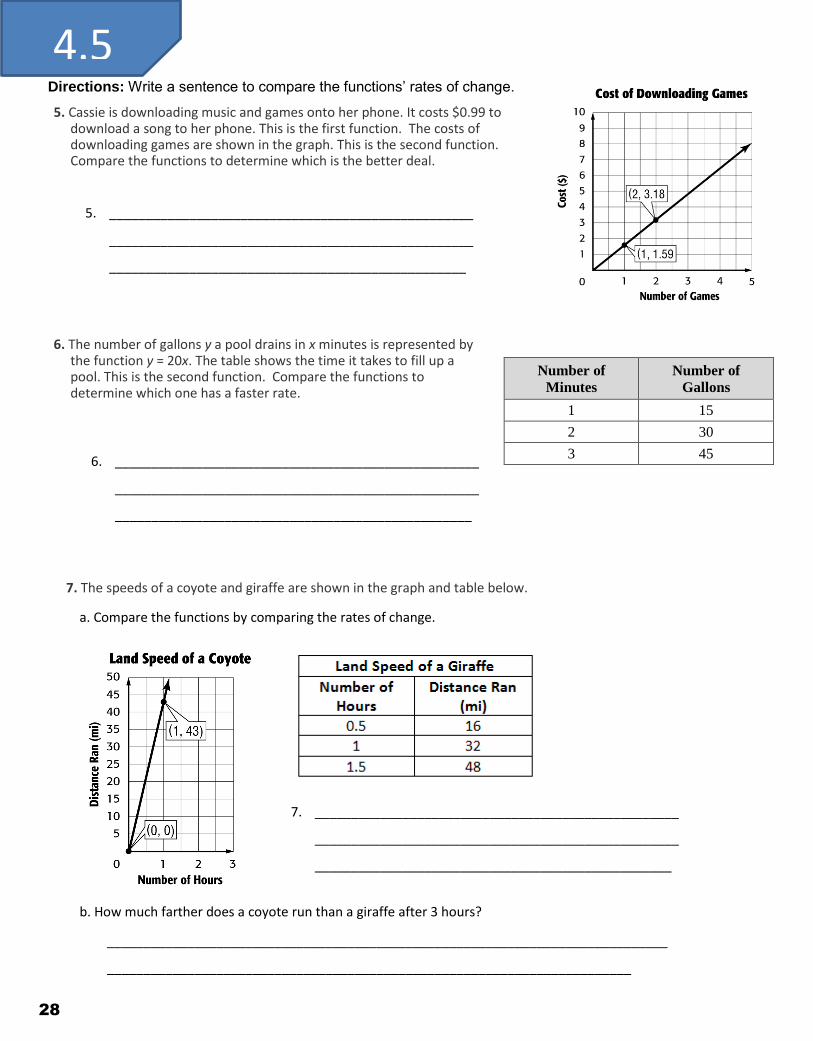
5. Cassie is downloading music and games onto her phone. It costs $0.99 to download a song to her phone. This is the first function. The costs of downloading games are shown in the graph. This is the second function. Compare the functions to determine which is the better deal.
6. The number of gallons y a pool drains in x minutes is represented by the function y = 20x. The table shows the time it takes to fill up a pool. This is the second function. Compare the functions to determine which one has a faster rate.
7. The speeds of a coyote and giraffe are shown in the graph and table below.
a. Compare the functions by comparing the rates of change.
b. How much farther does a coyote run than a giraffe after 3 hours?
Directions: Write a sentence to compare the functions’ rates of change.
Number of
Minutes
Number of
Gallons
1 15
2 30
3 45 6. __________________________________________________
__________________________________________________
_________________________________________________
5. __________________________________________________
__________________________________________________
_________________________________________________
7. __________________________________________________
__________________________________________________
_________________________________________________
_____________________________________________________________________________
________________________________________________________________________
4.5
28
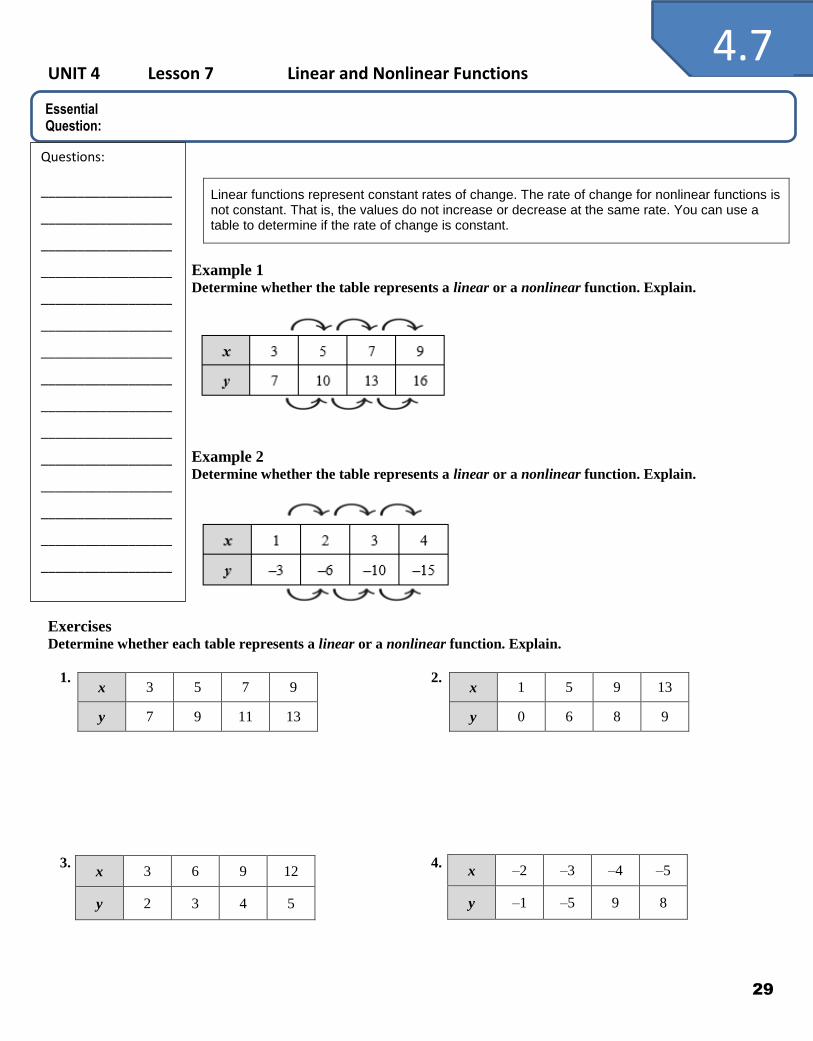
UNIT 4 Lesson 7 Linear and Nonlinear Functions
Linear functions represent constant rates of change. The rate of change for nonlinear functions is not constant. That is, the values do not increase or decrease at the same rate. You can use a table to determine if the rate of change is constant.
Example 1 Determine whether the table represents a linear or a nonlinear function. Explain.
Example 2 Determine whether the table represents a linear or a nonlinear function. Explain.
Exercises Determine whether each table represents a linear or a nonlinear function. Explain.
1. 2.
3. 4.
x 3 5 7 9
y 7 9 11 13
x 1 5 9 13
y 0 6 8 9
x 3 6 9 12
y 2 3 4 5
x –2 –3 –4 –5
y –1 –5 9 8
4.7
29
Essential Question:
Questions:
__________________
__________________
__________________
__________________
__________________
__________________
__________________
__________________
__________________
__________________
__________________
__________________
__________________
__________________
__________________
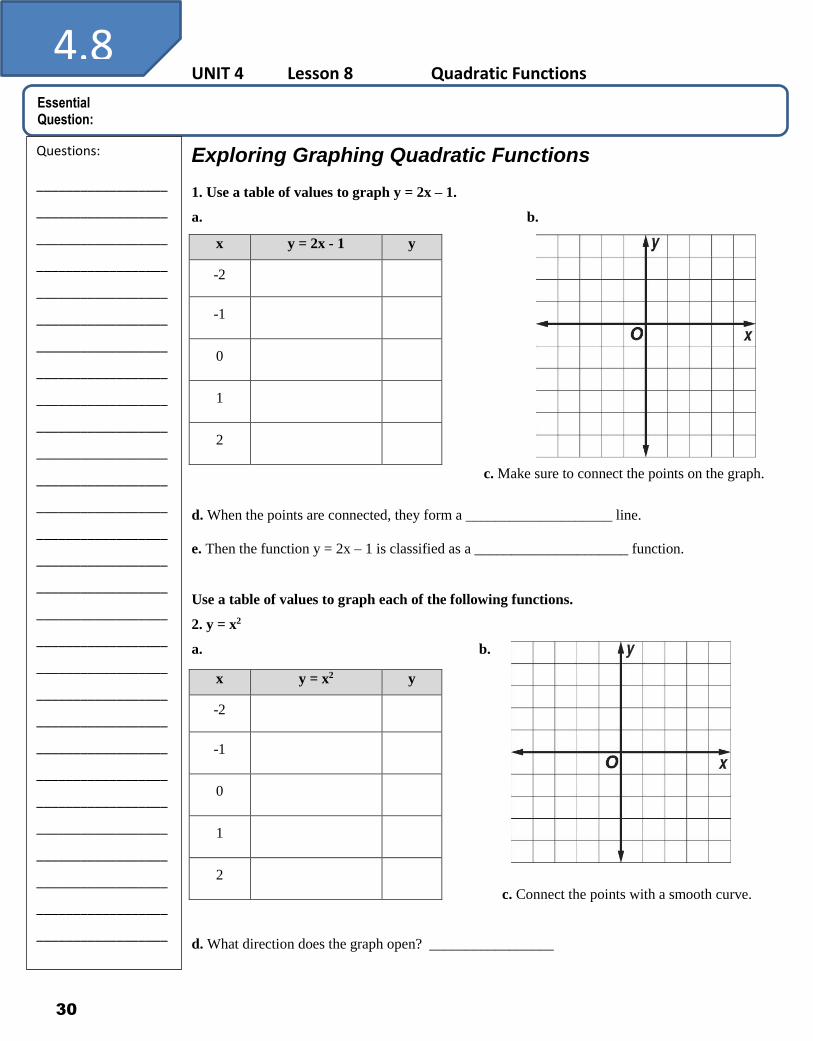
UNIT 4 Lesson 8 Quadratic Functions
Exploring Graphing Quadratic Functions
1. Use a table of values to graph y = 2x – 1.
a. b.
c. Make sure to connect the points on the graph.
d. When the points are connected, they form a ____________________ line.
e. Then the function y = 2x – 1 is classified as a _____________________ function.
Use a table of values to graph each of the following functions.
2. y = x2
a. b.
c. Connect the points with a smooth curve.
d. What direction does the graph open? _________________
x y = 2x - 1 y
-2
-1
0
1
2
x y = x2 y
-2
-1
0
1
2
4.8
30
Essential Question:
Questions:
__________________
__________________
__________________
__________________
__________________
__________________
__________________
__________________
__________________
__________________
__________________
__________________
__________________
__________________
__________________
__________________
__________________
__________________
__________________
__________________
__________________
__________________
__________________
__________________
__________________
__________________
__________________
__________________
__________________
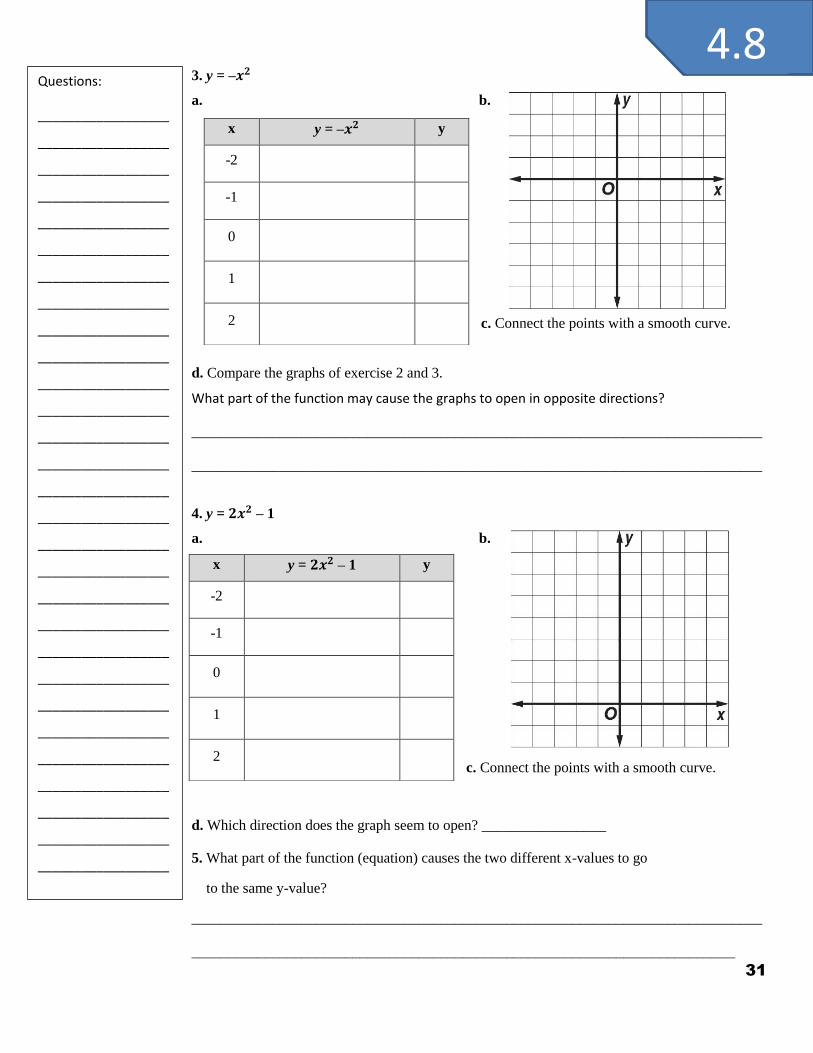
3. y = –𝒙𝟐
a. b.
c. Connect the points with a smooth curve.
d. Compare the graphs of exercise 2 and 3.
What part of the function may cause the graphs to open in opposite directions?
______________________________________________________________________________
______________________________________________________________________________
4. y = 𝟐𝒙𝟐 – 1
a. b.
c. Connect the points with a smooth curve.
d. Which direction does the graph seem to open? _________________
5. What part of the function (equation) causes the two different x-values to go
to the same y-value?
______________________________________________________________________________
____________________________________________________________________________
x y = –𝒙𝟐 y
-2
-1
0
1
2
x y = 𝟐𝒙𝟐 – 1 y
-2
-1
0
1
2
4.8
31
Questions:
__________________
__________________
__________________
__________________
__________________
__________________
__________________
__________________
__________________
__________________
__________________
__________________
__________________
__________________
__________________
__________________
__________________
__________________
__________________
__________________
__________________
__________________
__________________
__________________
__________________
__________________
__________________
__________________
__________________
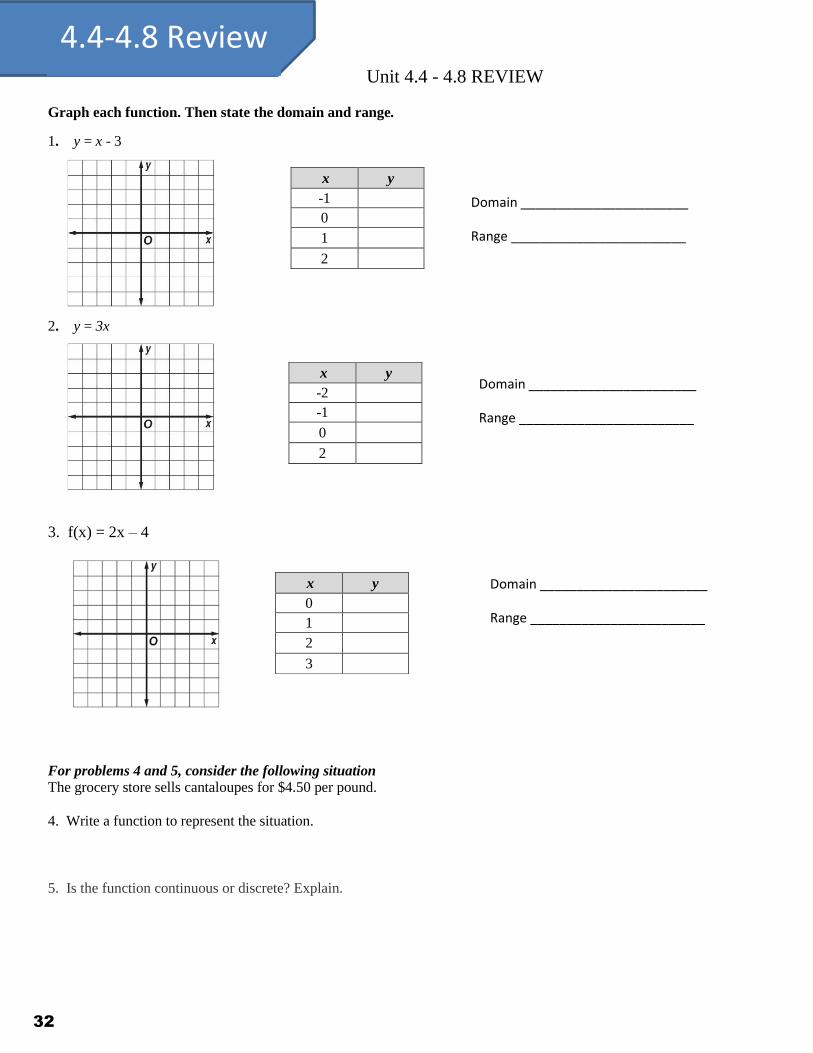
Unit 4.4 - 4.8 REVIEW
Graph each function. Then state the domain and range.
1. y = x - 3
2. y = 3x
3. f(x) = 2x – 4
For problems 4 and 5, consider the following situation The grocery store sells cantaloupes for $4.50 per pound.
4. Write a function to represent the situation.
5. Is the function continuous or discrete? Explain.
x y
-1
0
1
2
x y
-2
-1
0
2
x y
0
1
2
3
Domain _______________________
Range ________________________
Domain _______________________
Range ________________________
Domain _______________________
Range ________________________
4.4-4.8 Review
32
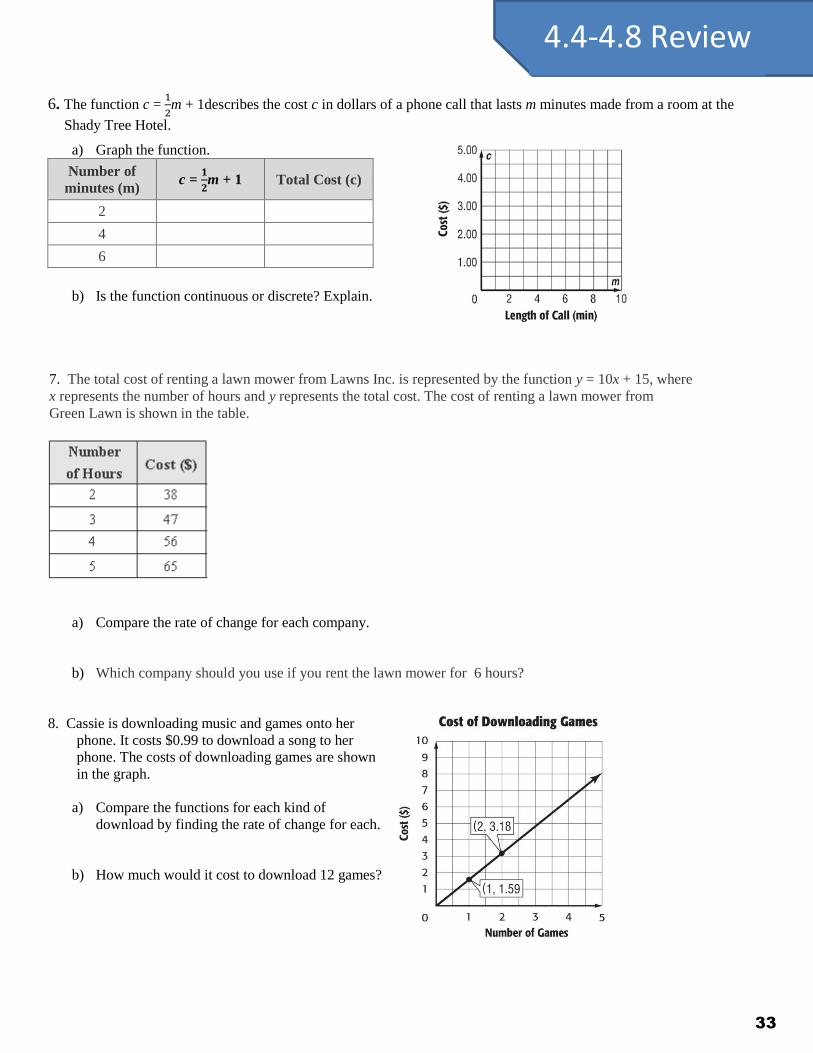
6. The function c = 1
2m + 1describes the cost c in dollars of a phone call that lasts m minutes made from a room at the
Shady Tree Hotel.
a) Graph the function.
Number of
minutes (m) c =
𝟏
𝟐m + 1 Total Cost (c)
2
4
6
b) Is the function continuous or discrete? Explain.
7. The total cost of renting a lawn mower from Lawns Inc. is represented by the function y = 10x + 15, where
x represents the number of hours and y represents the total cost. The cost of renting a lawn mower from
Green Lawn is shown in the table.
a) Compare the rate of change for each company.
b) Which company should you use if you rent the lawn mower for 6 hours?
8. Cassie is downloading music and games onto her
phone. It costs $0.99 to download a song to her
phone. The costs of downloading games are shown
in the graph.
a) Compare the functions for each kind of
download by finding the rate of change for each.
b) How much would it cost to download 12 games?
4.4-4.8 Review
33
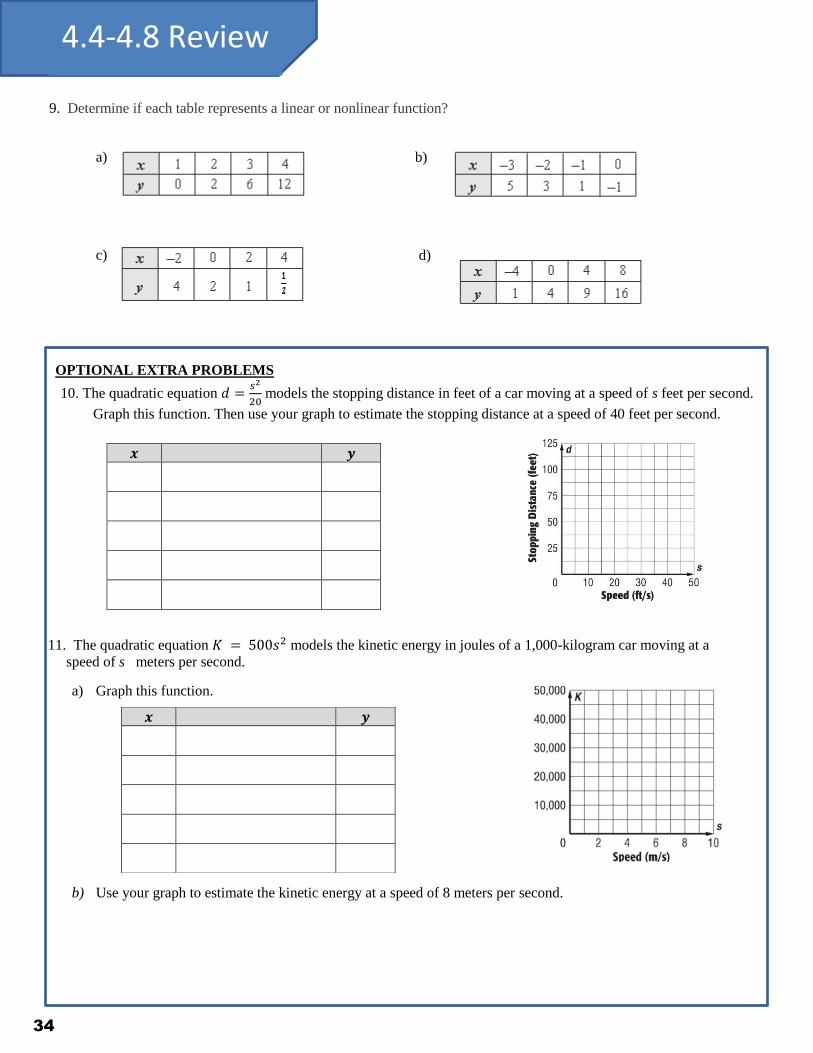
9. Determine if each table represents a linear or nonlinear function?
a) b)
c) d)
OPTIONAL EXTRA PROBLEMS
10. The quadratic equation 𝑑 =𝑠2
20 models the stopping distance in feet of a car moving at a speed of s feet per second.
Graph this function. Then use your graph to estimate the stopping distance at a speed of 40 feet per second.
11. The quadratic equation 𝐾 = 500𝑠2 models the kinetic energy in joules of a 1,000-kilogram car moving at a
speed of s meters per second.
a) Graph this function.
b) Use your graph to estimate the kinetic energy at a speed of 8 meters per second.
𝒙 𝒚
4.4-4.8 Review
34
𝒙 𝒚
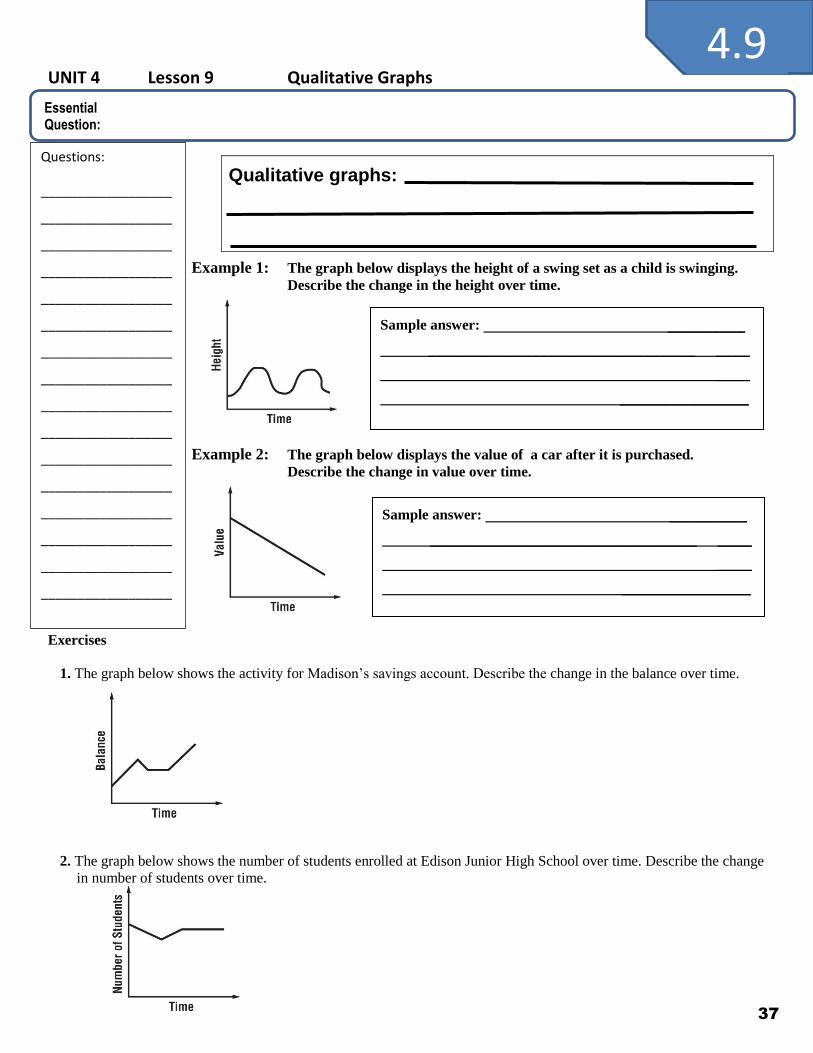
UNIT 4 Lesson 9 Qualitative Graphs
Example 1: The graph below displays the height of a swing set as a child is swinging.
Describe the change in the height over time.
Example 2: The graph below displays the value of a car after it is purchased.
Describe the change in value over time.
Exercises
1. The graph below shows the activity for Madison’s savings account. Describe the change in the balance over time.
2. The graph below shows the number of students enrolled at Edison Junior High School over time. Describe the change
in number of students over time.
Qualitative graphs:
Sample answer: _________
_______________________________ ____
____
_______________
Sample answer: _________
_______________________________ ____
____
_______________
4.9
37
Essential Question:
Questions:
__________________
__________________
__________________
__________________
__________________
__________________
__________________
__________________
__________________
__________________
__________________
__________________
__________________
__________________
__________________
__________________
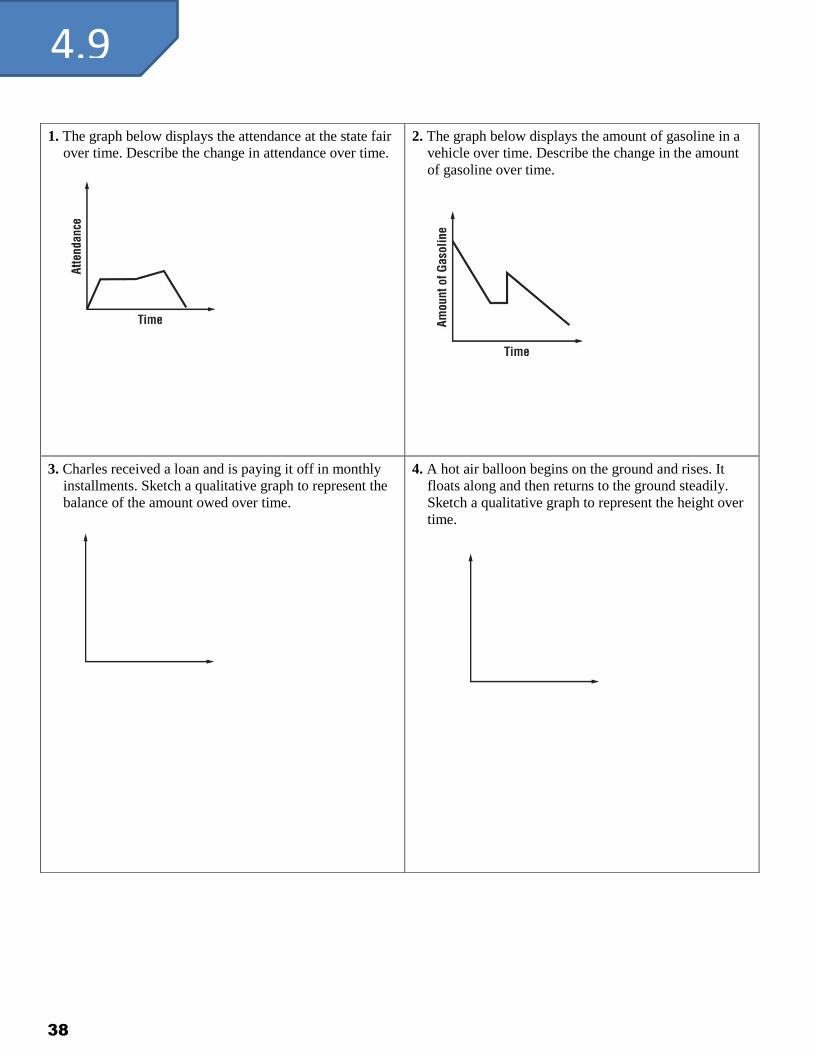
1. The graph below displays the attendance at the state fair
over time. Describe the change in attendance over time.
2. The graph below displays the amount of gasoline in a
vehicle over time. Describe the change in the amount
of gasoline over time.
3. Charles received a loan and is paying it off in monthly
installments. Sketch a qualitative graph to represent the
balance of the amount owed over time.
4. A hot air balloon begins on the ground and rises. It
floats along and then returns to the ground steadily.
Sketch a qualitative graph to represent the height over
time.
4.9
38
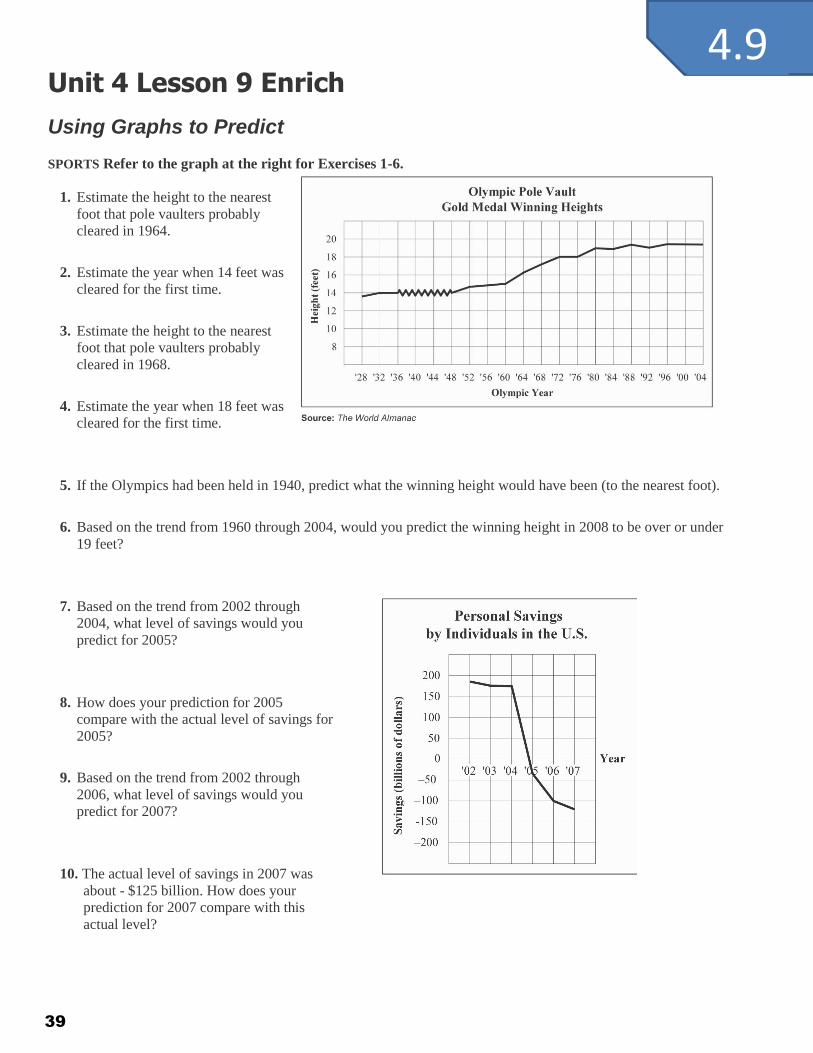
Unit 4 Lesson 9 Enrich
Using Graphs to Predict
SPORTS Refer to the graph at the right for Exercises 1-6.
1. Estimate the height to the nearest
foot that pole vaulters probably
cleared in 1964.
2. Estimate the year when 14 feet was
cleared for the first time.
3. Estimate the height to the nearest
foot that pole vaulters probably
cleared in 1968.
4. Estimate the year when 18 feet was
cleared for the first time.
5. If the Olympics had been held in 1940, predict what the winning height would have been (to the nearest foot).
6. Based on the trend from 1960 through 2004, would you predict the winning height in 2008 to be over or under
19 feet?
7. Based on the trend from 2002 through
2004, what level of savings would you
predict for 2005?
8. How does your prediction for 2005
compare with the actual level of savings for
2005?
9. Based on the trend from 2002 through
2006, what level of savings would you
predict for 2007?
10. The actual level of savings in 2007 was
about - $125 billion. How does your
prediction for 2007 compare with this
actual level?
4.9
39