Embed Size (px)
Citation preview

Cover Title 26/29 45 Light BlackCover Subtitle 12/15 — 65 Medium Black
Reinsurance Market ReportResults for Year-End 2016
April 2017

April 2017
Contents
Key Findings ................................................................................................................................................. 1 Summary ....................................................................................................................................................... 2
Capital........................................................................................................................................................ 2 Return of Capital ........................................................................................................................................ 3 Return on Equity ........................................................................................................................................ 3 Underwriting .............................................................................................................................................. 4 Expense Ratios ......................................................................................................................................... 5 Catastrophe Loss ...................................................................................................................................... 5
Capital ........................................................................................................................................................... 6 Highlights for the INDEX............................................................................................................................ 6 Active Capital Management ...................................................................................................................... 7 Summary and Outlook ............................................................................................................................... 8
Earnings ........................................................................................................................................................ 9 Underwriting Performance .......................................................................................................................... 10
Premium Volumes ................................................................................................................................... 10 Combined Ratios ..................................................................................................................................... 11
Prior Year Loss Development .............................................................................................................. 12 Catastrophe Losses ............................................................................................................................. 13 Accident Year Performance, ex Catastrophe ...................................................................................... 15
Expense Ratios for the SUBSET ............................................................................................................. 15 Modest Investment Returns .................................................................................................................... 16
Appendices ................................................................................................................................................. 18

Reinsurance Market Report – Year-End 2016
April 2017 1
Key Findings For the Willis Reinsurance Index* (INDEX):
■ Shareholders’ funds increased by 4.4% to USD 344.1B.
■ Aggregate net income for FY 2016 reduced to USD 26.6B (FY 2015: USD 30.3B).
■ Majority of net income was returned through dividends and buybacks of USD 16.4B.
■ Net income has been supported by realised investment gains of USD 7.0B (FY 2015: USD 7.7B).
■ Growth of shareholders’ funds was supported by USD 10.1B of unrealised investment gains which were not reported within net income. This compares to unrealised investment losses of USD 9.3B in 2015.
■ 2016 headline return on equity (RoE) of 8.0% for the INDEX, down from 9.3% at FY 2015.
■ The reported combined ratio for the INDEX at FY 2016 increased to 94.4% (FY 2015: 91.4%).
For the SUBSET** within the INDEX that breaks out the relevant disclosure:
■ Reported RoE of 8.2% at FY 2016 for the SUBSET, down from 10.2% at FY 2015.
■ Underlying RoE for the SUBSET of 3.3% at FY 2016, down from 3.4% at FY 2015.
■ The FY 2016 reported combined ratio for the SUBSET increased to 92.9% (FY 2015: 89.3%).
■ Over the last 9 years, the aggregate expense ratio for the SUBSET has risen by 4.0 percentage points to 33.2% at FY 2016.
■ Profitability continues to be reliant on releases of prior year reserves which represent around 49% of net income.
Alternative capital increased to USD 75B*** from USD 70B at FY 2015.
Year-end 2017 results may be impacted by macro-economic volatility due to potential changes in the US tax framework, the implementation of the EU-US Covered Agreement and the Brexit negotiations.
*- INDEX relates to those companies listed within Appendix 1 of this report. Merger and acquisition activity has resulted in the exclusion of HCC Insurance Group and White Mountains from the INDEX. White Mountains has been replaced by Sirius.
**- SUBSET is defined as those companies that make the relevant disclosure in relation to cat losses and prior year reserve releases. All constituents of the SUBSET are publicly listed groups that compose 58% of the aggregate capital INDEX
***- Capital Markets commentary provided by Willis Towers Watson Securities http://www.willis.com/client_solutions/services/wcma/

Reinsurance Market Report – Year-End 2016
2 April 2017
Summary Capital For the INDEX:
■ Aggregate shareholders’ funds increased by 4.4% to USD 344.1B (FY 2015: USD 329.7B).
* As per latest financial statements issued since date of previous Willis Re report, generally as at year end December 31,
2015.
** Removal of HCC Insurance Group and White Mountains from INDEX. White Mountains has been replaced by Sirius.
*** Net income of USD 26.6B includes a significant level of realised investment gains (USD 7.0B).
**** Unrealised investment appreciation that is not reported within net income.
***** As per latest financial statements issued by March 31, 2017 generally as at year end December 31, 2016. Amlin and CCR were yet to report their Year-End 2016 financial results as at the time of this publication; we include their year-end 2015 shareholders' equity within our INDEX total at the start and end of 2016.
■ Growth in shareholders’ funds was supported by net income of USD 26.6B (FY 2015: USD 30.3B).
■ Active capital management continues with USD 16.4B being returned through share buybacks and dividends (FY 2015: USD 23.3B). The decrease was driven by a reduction in dividends upstreamed by National Indemnity Co to USD 2.5B (FY 2015: USD 8.2B).
■ The USD 14.4B increase in shareholders’ funds was largely due to unrealised investment gains of USD 10.1B which were not reported within net income.
■ The USD 3.5B adjustment is made to reflect the removal of HCC Insurance Group and White Mountains from the INDEX. White Mountains has been replaced by Sirius.
■ Including other major regional and local reinsurers, and a pro-rated portion of capital within major groups whose reinsurance portfolio is <10% of their total premium, we derive an estimate of USD 374B of aggregate shareholders’ equity for the traditional reinsurance market.
■ Including capital from alternative markets the figure of USD 374B increases by USD 75B to approximately USD 449B (Year-end 2015: USD 427B).
■ If 100% of the capital within the major groups above is included the figure is estimated at USD 593B.
■ Including capital from alternative markets the figure of USD 593B increases by USD 75B to approximately USD 668B (Year-end 2015: USD 623B).
329.7
344.1
(3.5)
+26.6
(16.4)
+10.1 (2.4)
300
310
320
330
340
350
360
Shareholders' Equity brought forward*
Adjustment ** Net income*** Buy backs /Dividends
Unrealised investmentappreciation****
Other (includingFX movement)
Shareholders' Equitycarried forward*****

Reinsurance Market Report – Year-End 2016
April 2017 3
Return of Capital For the INDEX:
■ Share buybacks returned USD 5.8B of capital, equivalent to 1.8% of aggregate opening shareholders’ equity (FY 2015: USD 5.5B, 1.6%).
■ USD 10.6B returned through ordinary or special dividends, or 3.2% of aggregate opening shareholders’ funds (FY 2015: USD 17.8B, 5.2%).
■ A total of USD 16.4B was returned to shareholders, accounting for approximately 62% of net income (FY 2015: 23.3B, 77%).
For the SUBSET:
■ Share buybacks returned USD 5.8B of capital, equivalent to 3.0% of aggregate opening shareholders’ equity (FY 2015: USD 5.5B, 2.7%).
■ USD 6.0B returned through ordinary or special dividends, or 3.0% of aggregate opening shareholders’ funds (FY 2015, USD 7.4B, 3.6%).
■ A total of USD 11.8B was returned to shareholders’, accounting for 78% of FY net income (FY 2015, USD 12.9B, 65%).
Reinsurers within both the INDEX and SUBSET continue to actively manage their capital, including through new share buyback authorisations.
Return on Equity For the INDEX:
■ Aggregate RoE of 8.0% for the INDEX, down from 9.3% at FY 2015.
■ The further deterioration in reported RoEs was driven by higher incidence of Natural Catastrophe losses.
■ Investment yields were broadly flat at approximately 2.9%.
For the SUBSET:
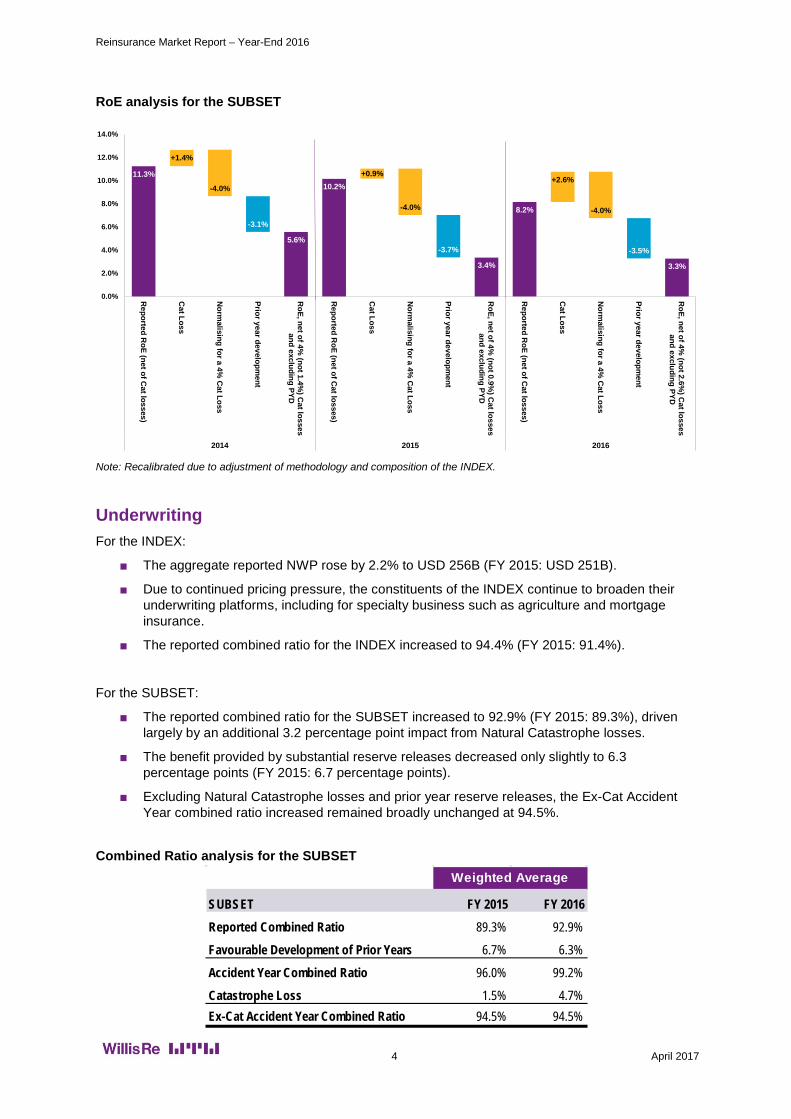
■ As the RoE analysis for the SUBSET shows, the reported RoE was 8.2% (FY 2015: 10.2%).
■ If we normalise for a more typical catastrophe load (equivalent to a c. 4% impact on RoE) and exclude the benefit provided by reserve releases, underlying profitability declines marginally to 3.3% from 3.4% at FY 2015.
Reinsurance Market Report – Year-End 2016
4 April 2017
SUBSET FY 2015 FY 2016Reported Combined Ratio 89.3% 92.9%
Favourable Development of Prior Years 6.7% 6.3%
Accident Year Combined Ratio 96.0% 99.2%
Catastrophe Loss 1.5% 4.7%Ex-Cat Accident Year Combined Ratio 94.5% 94.5%
Weighted Average
RoE analysis for the SUBSET
Note: Recalibrated due to adjustment of methodology and composition of the INDEX.
Underwriting For the INDEX:
■ The aggregate reported NWP rose by 2.2% to USD 256B (FY 2015: USD 251B).
■ Due to continued pricing pressure, the constituents of the INDEX continue to broaden their underwriting platforms, including for specialty business such as agriculture and mortgage insurance.
■ The reported combined ratio for the INDEX increased to 94.4% (FY 2015: 91.4%).
For the SUBSET:
■ The reported combined ratio for the SUBSET increased to 92.9% (FY 2015: 89.3%), driven largely by an additional 3.2 percentage point impact from Natural Catastrophe losses.
■ The benefit provided by substantial reserve releases decreased only slightly to 6.3 percentage points (FY 2015: 6.7 percentage points).
■ Excluding Natural Catastrophe losses and prior year reserve releases, the Ex-Cat Accident Year combined ratio increased remained broadly unchanged at 94.5%.
Combined Ratio analysis for the SUBSET
11.3%
5.6%
10.2%
3.4%
8.2%
3.3%
+1.4%
-4.0%
+0.9%
-4.0%
+2.6%
-4.0%
-3.1%
-3.7% -3.5%
0.0%
2.0%
4.0%
6.0%
8.0%
10.0%
12.0%
14.0%
Reported R
oE (net of Cat losses)
Cat Loss
Norm
alising for a 4% C
at Loss
Prior year development
RoE, net of 4%
(not 1.4%) C
at lossesand excluding PYD
Reported R
oE (net of Cat losses)
Cat Loss
Norm
alising for a 4% C
at Loss
Prior year development
RoE, net of 4%
(not 0.9%) C
at lossesand excluding PYD
Reported R
oE (net of Cat losses)
Cat Loss
Norm
alising for a 4% C
at Loss
Prior year development
RoE, net of 4%
(not 2.6%) C
at losses and excluding PYD
2014 2015 2016

Reinsurance Market Report – Year-End 2016
April 2017 5
Expense Ratios Impact of Expense Ratio Movement on RoE for the SUBSET (Base Year – 2007)
Source: SNL Financial and Willis Towers Watson Market Security
If each of the constituents of the SUBSET had been able to maintain an expense ratio at their respective 2007 levels, the aggregate RoE of 8.2% reported at FY 2016 would have been approximately 2.5 percentage points higher.
Catastrophe Loss ■ Global insured catastrophe losses increased to USD 54B (FY 2015: USD 38B), due to an
uptick in Natural Catastrophe losses to USD 46B (2015: USD 28B). (Swiss Re Sigma figures).
■ Following several periods of below average incidence, global insured Natural Catastrophe losses have returned to a more normalised level in line with the 10 year average of USD 46B.
■ (Swiss Re Sigma figure).
■ Natural Catastrophe losses for the SUBSET increased by 179% to USD 5.4B.
■ This equates to 4.7% of aggregate net earned premium (NEP) (FY 2015: 1.5%) or approximately a 2.6 percentage point impact after tax on the aggregate annualised RoE (FY 2015: 0.9 percentage points).
Note: For the purposes of this report the term catastrophe loss reflects generally large single event claims as reported by the companies themselves. A catastrophe related loss may therefore not appear in our numbers as ‘Cat Loss’ unless it reaches a value that exceeds the company’s own threshold for disclosure.
16.2%
1.6%
13.3%
10.0%
3.4%
11.7% 11.8% 11.5%10.2%
8.2%
0.2%
0.3%
0.8%
0.8%
1.0% 1.2% 1.7%2.4%
2.5%
0.0%
2.0%
4.0%
6.0%
8.0%
10.0%
12.0%
14.0%
16.0%
18.0%
2007 2008 2009 2010 2011 2012 2013 2014 2015 2016
Reported RoE Expense Ratio Impact

Reinsurance Market Report – Year-End 2016
6 April 2017
Capital Highlights for the INDEX
■ Due to continued strong net income and significant unrealised investment gains, shareholders’ equity increased to USD 344.1B, a 4.4% increase from USD 329.7B at year-end 2015.
■ Reinsurers continue to actively manage capital levels, returning USD 16.4B to shareholders through buy-backs and dividends.
■ A USD 3.5B adjustment is made to reflect the removal of HCC Insurance Group and White Mountains from the INDEX. White Mountains has been replaced by Sirius.
■ The reported RoE for the INDEX decreased to 8.0% compared to 9.3% at FY 2015.
As Chart 1 shows for the INDEX, there was considerable variation in shareholders’ equity movements on a company by company basis.
Chart 1: Movement in consolidated shareholders’ equity, reported as at FY 2016 for the INDEX
The 4.4% increase in shareholders’ equity was driven by continued strong net income of USD 26.6B, albeit reduced from USD 30.3B at FY 2015 due to increased Natural Catastrophe losses. However, this level of profitability continues to be dependent on substantial releases from prior year reserves. In addition, significant support was provided by realised investment gains of USD 7.0B (FY 2015: USD 7.7B). Aggregate shareholders’ funds also benefited from a USD 10.1B increase in unrealised investment gains which were not reported within net income. This increase in unrealised investment gains was driven largely by a rise in the market value of National Indemnity Co’s US equity portfolio.
Partially offsetting these positive contributions, the adjustment of USD 3.5B reflected the removal of HCC Insurance Group and White Mountains from the INDEX. White Mountains has been replaced by Sirius. Reinsurers continued to return capital through share buybacks and dividends of USD 16.4B (FY 2015: USD 23.3B).
33.0
%
19.0
%
15.6
%
12.8
%
11.5
%
9.7%
8.0%
7.5%
7.5%
6.9%
6.7%
6.4%
6.3%
6.1%
5.9%
5.5%
5.2%
5.1%
4.9%
4.8%
2.9%
2.8%
2.8%
1.4%
1.2%
0.5%
0.5%
-1.1
%
-3.1
%
-3.5
%
-4.5
%
-6.3
%
-6.3
%
-6.3
%
-8.2
%
-9.3
%
-15%
-10%
-5%
0%
5%
10%
15%
20%
25%
30%
35%
40%
FY 2015
FY 2016

Reinsurance Market Report – Year-End 2016
April 2017 7
Active Capital Management Due to continued weak pricing, reinsurers have further broadened their underwriting platforms in order to deploy capital to classes of business which they view as being more favourably rated. Reinsurers have continued to moderate their exposure to catastrophe exposed business and increased capital allocation to other classes of business which include primary, life and health and certain specialty lines of business such as agriculture and mortgage insurance. Active capital management has continued due to the persistent challenge of significant excess capacity.
Chart 2: Capital returned through share buybacks and ordinary and special dividends for the INDEX
The constituents of our INDEX returned USD 16.4B of capital through share buybacks and dividends compared to USD 23.3B at FY 2015. Ordinary and special dividends accounted for USD 10.6B (FY 2015: USD 17.8B). The decrease was driven by a reduction in dividends upstreamed by National Indemnity Co to USD 2.5B compared to the substantial USD 8.2B at FY 2015 which was attributable to a one-off intragroup dividend paid by National Indemnity Co to its parent. Share buybacks increased marginally to USD 5.8B (FY 2015: USD 5.5B).
As shown in Table 1, new authorisations for large share buyback programs continued in 2016. In the remainder of 2017 we expect share buybacks to remain an important part of capital management for the constituents of our INDEX due to the continued challenge of fully deploying capital at acceptable levels of profitability.
14.7%
14.7%
14.8%
10.9%
12.3% 10.0% 9.0% 8.2%
7.6%
7.6%
7.8%
7.3%
7.6%
7.1%
6.9%
7.5%
7.2%
5.0%
4.7%
4.4%
4.4% 3.5% 2.8%
2.8%
2.2%
2.1%
1.5%
1.2%
0.9%
0.9%
0.9%
0.3%
0.4%
23.3%
12.2%
9.7%
6.8%
7.8%
9.4%
10.4% 8.9% 8.1%
7.7% 6.0%
8.9% 7.7% 6.8%
6.1%
6.3%
6.0% 5.0%
4.7%
5.0% 3.2%
6.7%
7.7%
8.7%
2.3%
2.5% 1.7%
2.4%
3.3%
0.5%
0.4%
8.7%
2.7%
2.2%
0.0%
5.0%
10.0%
15.0%
20.0%
25.0%
FY 2016
FY 2015

Reinsurance Market Report – Year-End 2016
8 April 2017
Table 1: Recent announcements of share repurchase programs for the INDEX
Note: A number of other reinsurers have significant older authorisations with capacity still remaining including: Arch (USD 447M, 5.4%); Markel (USD 229M, 2.7%).
Summary and Outlook In the remainder of 2017 the constituents of the INDEX face the continued challenge of substantial excess capacity which has been further exacerbated by a USD 14.4B increase in shareholders’ equity at FY 2016.
Reported RoEs decreased further due to the return to a normalised level of global insured Natural Catastrophe losses. However, the impact on profitability was modest due to continued reliance on substantial reserve releases in addition to the one-off support provided by significant realised investment gains. Profitability also benefited from a reduction in insured Man-made Catastrophe losses to USD 8B compared to USD 10B at FY 2015. (Swiss Re Sigma figures).
Looking ahead, RoEs may come under further pressure if reinsurers are unable to sustain the quantum of reserve releases from which they have benefited in recent periods.
Company Date Action
Capacity outstanding as % of Shareholders' Equity, Dec 31, 2016
Everest Re Nov 19, 2014Approved an increase in the share repurchase authorization by a further 5 million shares (3 million utilised). 4.94%
Validus Feb 3, 2015 Announced a USD 750M repurchase authorization (USD 430M utilised). 8.34%
SCOR Apr 30, 2015
AGM authorized a share repurchase program to repurchase up to 6.11% of its issued share capital, such SCOR's treasury stock does not exceed 10% of it share capital. SCOR held 7.2 million treasury shares at Dec 31, 2016 = 3.7% of outstanding 6.26%
Lancashire Apr 30, 2015
Approved the renewal of the repurchase programme for up to 20 million shares (none utilised). The repurchase programme is subject to renewal at the 2017 AGM for up to 10% of the then issued common share capital. 10.00%
WR Berkley Jun 2, 2015 Increased its share repurchase authorization to 10 million shares (3.15 million utilised). 5.65%
Alleghany Nov 1, 2015As of December 31, 2016, Alleghany had $379.2 million remaining under its share repurchase authorization. 4.78%
Allied World Apr 15, 2016
Commenced an authorization to repurchase up to USD 500M of its shares, anticipated to occur through to April 19, 2018. The company has since repurchased 2.7 million shares (3.1% ) USD 100M. 11.27%
Argo May 3, 2016Authorized a buyback plan without ffixed expiration for up to USD 150M of common stock. USD 130.3M remained outstanding as at December 31, 2016 7.27%
Fairfax Sep 23, 2016Authorized a one year buyback plan on September 23, 2016 to repurchase up to 800,000 of its subordinate voting shares. It had repurchased 30,732 shares by December 31. 3.33%
Swiss Re Nov 4, 2016
Commenced share repurchases under the CHF 1.0B program mandated by its AGM on April 22, 2016. The full buyback, representing 3.2% of its stock, was concluded on February 9, 2017. 1.50%
Axis Dec 9, 2016Authorized a buyback plan that was initiated on January 1, 2017, for up to USD 1.0B of common stock by December 31, 2017 15.94%
RGA Re Jan 20, 2017Announced a share repurchase program without expiration date for up to USD 400M of common stock. 5.64%
Aspen Feb 8, 2017Authorized a buyback plan to repurchase up to USD 250M of shares, through to February 8, 2009 6.85%
XL Catlin Feb 17, 2017 Announces a share repurchase program for up to USD 1.0B of ordinary shares. 9.14%RenaissanceRe Feb 22, 2017
Announced a share repurchase program without expiration date for up to to USD 500M of common stock. 10.27%
Munich Re Mar 15, 2017
Announced a share repurchase program, for up to 11 million shares (3.5% of its share capital) for a total consideration of EUR 1.0B. The program requires the authorization of it AGM on 27 April 2016, and would be vaild for a period of one year thereafer. 3.50%

Reinsurance Market Report – Year-End 2016
April 2017 9
Earnings For the INDEX:
■ Despite continued support from substantial reserve releases, the RoE for the INDEX, as show in chart 3, weakened further to 8.0% (FY 2015: 9.3%) due to higher incidence of Natural Catastrophe losses.
■ Investment yields for the INDEX remained broadly flat at 2.9%. However, Chart 12 shows that the investment yields for a substantial portion of the INDEX were somewhat weaker than this average.
■ The aggregate reported combined ratio for the INDEX increased to 94.4% (FY 2015: 91.4%).
■ Earnings were also supported by the one off benefit of realised investment gains of USD 7.0B (FY 2015: USD 7.7B).
Chart 3: FY 2016 net income as % of average shareholders’ equity (RoE) for the INDEX
For the SUBSET:
■ Due to higher Natural Catastrophe losses, the reported RoE of the SUBSET weakened further to 8.2% compared with 10.2% at FY 2015.
■ This result continued to rely on substantial reserve releases which provided a 3.5 percentage point uplift to RoE (FY 2015: 3.7 percentage points).
■ Reported RoEs benefited from substantial realised investment gains which were driven by strong increases in the market value of equities. Going forward, RoEs may come under further pressure if realised investment gains reduce from this high level.
■ Although global insured Natural Catastrophe losses have returned to a normalised level, they remained within the aggregate budgeted Natural Catastrophe loss for the year.
Due to continued pricing pressure, reinsurers continue to broaden their underwriting platforms, including for specialty business such as agriculture and mortgage insurance.
8.0%
26.7%
20.2% 17.5%
13.7%
13.7%
12.6%
12.4%
12.2% 10.5%
10.1%
9.9%
9.9%
9.5%
9.4%
8.8%
8.5%
8.4%
8.2%
7.9%
7.8%
7.3%
7.3%
7.3%
7.2%
7.1%
6.8%
6.4%
6.2%
5.8%
5.6%
5.5% 4.0%
3.8% 3.0%
-4.7%
-4.9%
-10%
-5%
0%
5%
10%
15%
20%
25%
30%FY 2016
FY 2015
FY 2016 INDEX

Reinsurance Market Report – Year-End 2016
10 April 2017
Underwriting Performance For the INDEX:
■ Achieving profitable growth remains challenging due to continued rate pressures. Portfolio re-balancing continued with reinsurers increasing capital allocation to primary, life and health and certain specialty lines of business such as agriculture and mortgage insurance.
■ The premium levels for some of the constituents of the INDEX continue to benefit from large tailored transactions.
■ Despite support provided by continued substantial reserve releases, combined ratios have increased due to a return to a normalised level of Natural Catastrophe losses.
■ Reinsurers continued to moderate their capital allocation to catastrophe exposed business, including for their U.S. business.
■ The challenge of increasing expense bases continues to add further pressure to earnings.
■ Nevertheless, profitability benefited from a reduction in insured Man-made Catastrophe losses to USD 8B compared to USD 10B at FY 2015. (Swiss Re Sigma figures).
For the SUBSET:
■ Excluding Natural Catastrophe losses and prior year reserve releases, the Ex-Cat Accident Year combined ratio remained broadly unchanged at 94.5%.
■ The expense ratio has increased marginally to 33.2% (FY 2015: 33.1%).
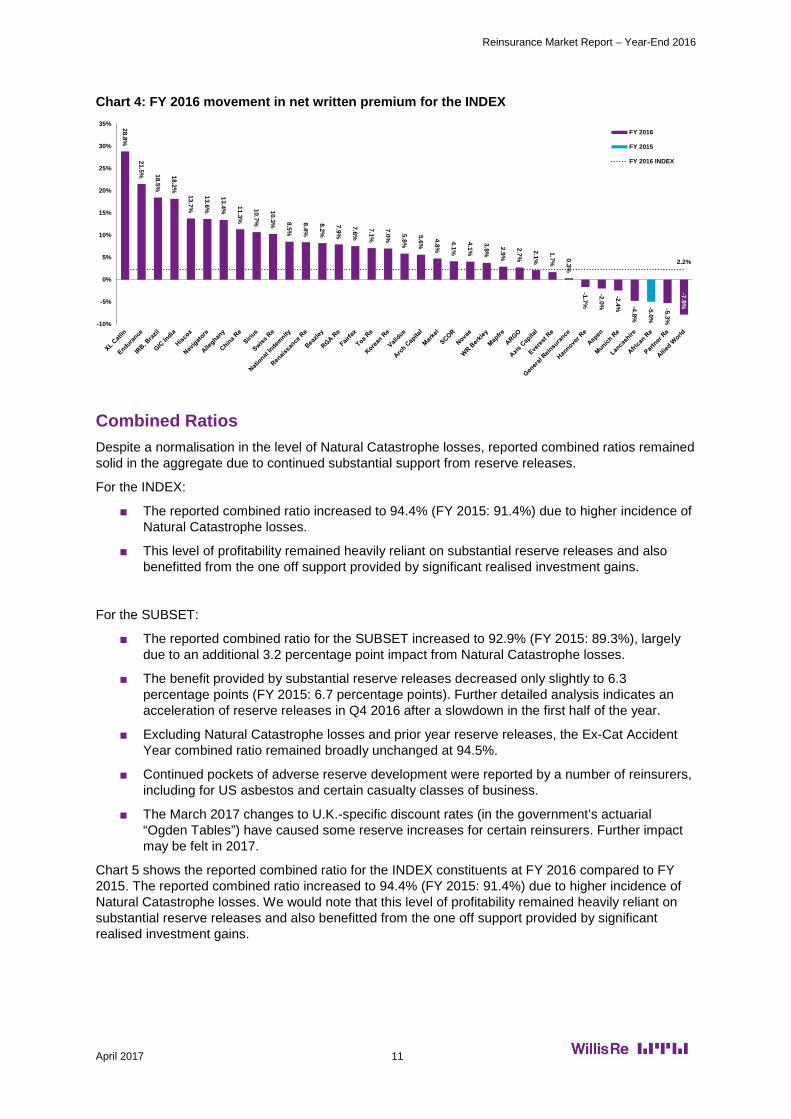
Premium Volumes Chart 4 shows that FY 2016 net written premium (NWP) for the INDEX increased by approximately 2.2% from FY 2015. We continue to see significant variation between the constituents of the INDEX.
Factors influencing this growth include:
■ A number of the INDEX constituents have reported significant growth as a result of mergers or acquisitions over the year, including XL Catlin (acquired Catlin), Endurance (Montpelier Re), Fairfax (Brit) and Renaissance Re (Platinum).
■ We have continued to see some of the larger constituents of the INDEX achieving premium growth through significant individual transactions, including whole account quota shares and retrospective transactions for certain casualty lines of business.
■ The continued challenge of achieving profitable growth has seen some reinsurers reduce their top line, including through reduced net exposure to U.S. catastrophe business.
■ The INDEX constituents continue to broaden their underwriting platforms to target growth in certain classes of business which include primary, life and health and certain specialty lines of business such as agriculture and mortgage insurance.
■ A number of reinsurers reported reduced premium volumes including Munich Re, Lancashire, Partner Re and Allied World.
SUBSET FY 2014 FY 2015 FY 2016Reported Combined Ratio 88.5% 89.3% 92.9%Favourable Development of Prior Years 5.7% 6.7% 6.3%Accident Year Combined Ratio 94.2% 96.0% 99.2%Catastrophe Loss 2.6% 1.5% 4.7%Ex-Cat Accident Year Combined Ratio 91.6% 94.5% 94.5%
Weighted Average
Reinsurance Market Report – Year-End 2016
April 2017 11
Chart 4: FY 2016 movement in net written premium for the INDEX
Combined Ratios Despite a normalisation in the level of Natural Catastrophe losses, reported combined ratios remained solid in the aggregate due to continued substantial support from reserve releases.
For the INDEX:
■ The reported combined ratio increased to 94.4% (FY 2015: 91.4%) due to higher incidence of Natural Catastrophe losses.
■ This level of profitability remained heavily reliant on substantial reserve releases and also benefitted from the one off support provided by significant realised investment gains.
For the SUBSET:
■ The reported combined ratio for the SUBSET increased to 92.9% (FY 2015: 89.3%), largely due to an additional 3.2 percentage point impact from Natural Catastrophe losses.
■ The benefit provided by substantial reserve releases decreased only slightly to 6.3 percentage points (FY 2015: 6.7 percentage points). Further detailed analysis indicates an acceleration of reserve releases in Q4 2016 after a slowdown in the first half of the year.
■ Excluding Natural Catastrophe losses and prior year reserve releases, the Ex-Cat Accident Year combined ratio remained broadly unchanged at 94.5%.
■ Continued pockets of adverse reserve development were reported by a number of reinsurers, including for US asbestos and certain casualty classes of business.
■ The March 2017 changes to U.K.-specific discount rates (in the government’s actuarial “Ogden Tables”) have caused some reserve increases for certain reinsurers. Further impact may be felt in 2017.
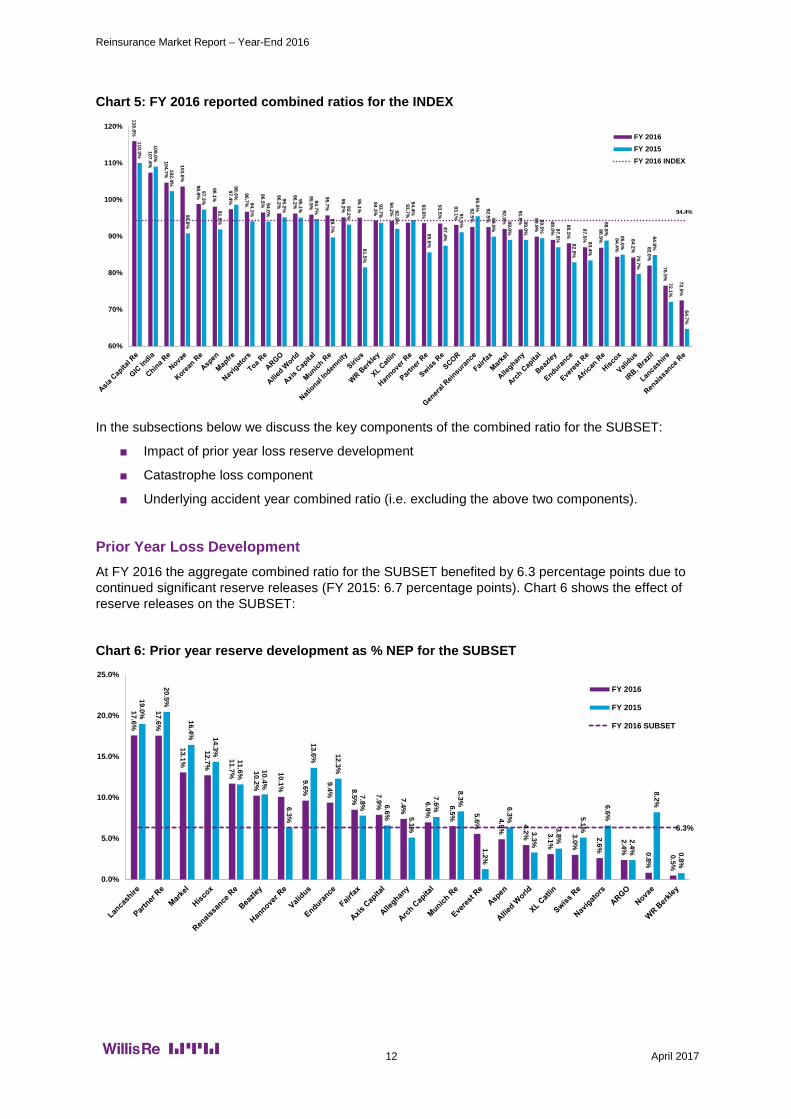
Chart 5 shows the reported combined ratio for the INDEX constituents at FY 2016 compared to FY 2015. The reported combined ratio increased to 94.4% (FY 2015: 91.4%) due to higher incidence of Natural Catastrophe losses. We would note that this level of profitability remained heavily reliant on substantial reserve releases and also benefitted from the one off support provided by significant realised investment gains.
2.2%
28.8%
21.5% 18.5%
18.2%
13.7%
13.6%
13.4% 11.3%
10.7%
10.3% 8.5%
8.4%
8.2%
7.9%
7.6%
7.1%
7.0% 5.8%
5.6%
4.8%
4.1%
4.1%
3.8%
2.9%
2.7%
2.1%
1.7% 0.3%
-1.7%
-2.0%
-2.4% -4.8%
-5.0%
-5.3%
-7.9%
-10%
-5%
0%
5%
10%
15%
20%
25%
30%
35%FY 2016
FY 2015
FY 2016 INDEX
Reinsurance Market Report – Year-End 2016
12 April 2017
Chart 5: FY 2016 reported combined ratios for the INDEX
In the subsections below we discuss the key components of the combined ratio for the SUBSET:
■ Impact of prior year loss reserve development
■ Catastrophe loss component
■ Underlying accident year combined ratio (i.e. excluding the above two components).
Prior Year Loss Development At FY 2016 the aggregate combined ratio for the SUBSET benefited by 6.3 percentage points due to continued significant reserve releases (FY 2015: 6.7 percentage points). Chart 6 shows the effect of reserve releases on the SUBSET:
Chart 6: Prior year reserve development as % NEP for the SUBSET
116.0%
107.4% 104.7%
103.6%
98.8%
98.1%
97.4%
96.7%
96.5%
96.2%
96.2%
95.9%
95.7%
95.2%
95.1%
94.3%
94.2%
93.7%
93.6%
93.5%
93.1%
92.5%
92.5%
92.0%
91.9% 89.9%
89.0%
88.1%
87.0%
86.9% 84.4%
84.2% 82.0%
76.5%
72.5%
110.0%
109.0%
102.4%
90.8%
97.3%
91.9%
98.6%
94.1%
94.0%
95.2%
95.1%
94.7%
89.7%
93.2%
81.5%
93.7% 92.0%
94.4%
85.6%
87.4%
91.1%
95.5%
89.9%
89.0%
89.0%
89.5% 87.0%
82.9%
83.4%
88.8%
85.0%
79.7%
84.9%
72.1%
64.7%
94.4%
60%
70%
80%
90%
100%
110%
120%FY 2016FY 2015FY 2016 INDEX
17.6%
17.6%
13.1%
12.7%
11.7% 10.2%
10.1%
9.6%
9.4% 8.5% 7.9%
7.4%
6.9%
6.5% 5.6% 4.9% 4.2% 3.1%
3.0%
2.6%
2.4% 0.8%
0.5%
19.0%
20.5%
16.4% 14.3%
11.6% 10.4%
6.3%
13.6% 12.3%
7.8% 6.6% 5.1%
7.6%
8.3%
1.2%
6.3%
3.3%
3.8%
5.1%
6.6%
2.4%
8.2%
0.8%
6.3%
0.0%
5.0%
10.0%
15.0%
20.0%
25.0%
FY 2016
FY 2015
FY 2016 SUBSET

Reinsurance Market Report – Year-End 2016
April 2017 13
Although the trend for substantial reserve releases continued, further pockets of adverse reserve development were reported by a number of reinsurers at FY 2016, including for US asbestos and certain casualty classes of business.
Significant reserve releases from Munich Re and Hannover Re (owing to specific local requirements) made a significant contribution to total reserve releases for the SUBSET.
The SUBSET constituents have generated over 49% of net income through reserve releases. Further detailed analysis indicates an acceleration of reserve releases in Q4 2016 after a slowdown in the first half of the year.
Chart 7: Reserve Release Development across the SUBSET
Note: Aggregate reserve release calculated before tax. (H1 2016 reserve release estimate was 29.0% of aggregate net income on an after-tax basis accelerating to 42% for FY 2016).
Catastrophe Losses Global insured catastrophe losses increased to USD 54B (2015: USD 38B), due to an uptick in Natural Catastrophe losses to USD 46B (2015: USD 28B). (Swiss Re Sigma figures). Following several periods of below average incidence, global insured Natural Catastrophe losses have returned to a normalised level in line with the 10 year average of USD 46B. Man-made Catastrophe losses reduced to USD 8B compared to USD 10B at FY 2015. Although global insured Natural Catastrophe losses have returned to a normalised level, they remained within the aggregate budgeted Natural Catastrophe loss for the year.
As shown in Table 2, the costliest events included the Kumamoto earthquake in Japan, hurricane Matthew, flooding in Belgium, France and Germany, and the Fort McMurray fires in Canada.
4,357
5,303
6,853 6,861
7,631
6,837
7,885 7,385
22.7%32.2%
125.0%
33.5% 35.5% 31.7%41.8%
49.2%
0%
40%
80%
120%
160%
200%
-
1,000
2,000
3,000
4,000
5,000
6,000
7,000
8,000
2009 2010 2011 2012 2013 2014 2015 2016
Aggregate Amount of Reserve Release (USDM) PYD as % of Net Income

Reinsurance Market Report – Year-End 2016
14 April 2017
Table 2: Major Losses FY 2016
Loss estimates shown are taken from public sources and should not be taken as confirmation by Willis Towers Watson of reported losses
As shown in Chart 8, the weighted average combined ratio of the SUBSET included 4.7 percentage points due to catastrophe losses (FY 2015: 1.5 percentage points).
Chart 8: Catastrophe loss component of combined ratio as % NEP for the SUBSET
Date Description Estimate14-16 April Japan Earthquake – Kumamoto Prefecture 5,000 1-8 October Hurricane Matthew, US, Caribbean 4,000 12 - 14 August South Louisiana Flooding, US 3,100 10 - 12 April Severe hailstorm in San Antonio, Texas 3,000 28 May - 3 June Floods – France, Belgium, Germany 2,100 – 2,9001 May - 13 June Fort McMurray wildfires, Canada 2,000 – 2,70013 November Earthquake in Kaikoura, New Zealand 1,700 – 2,40023 -24 March North Texas hailstorm, US 1,700 23-24 February Tornadoes – U.S. Southern & Mid-Atlantic states 767 29 April – 3 May Thunderstorms – U.S. Texas, Louisiana, Arkansas, Oklahoma and Mississippi 753 13-18 March Hail Storms – U.S. Southern, Central & European states 692 14 April Ecuador Earthquake – Esmeraldas province 500 7-14 March U.S. Floods – Louisiana, Texas, Arkansas and Mississippi 295
Date Description Estimate17 October Explosion at one of BASF's major chemical plants in Germany 400 20 April Pemex – Mexico petrochemical plant explosion 386 13 May Tullow’s Jubilee Oil field technical fault 345 1 September SpaceX Falcon 9 rocket explosion 285 3 August Emirates Flight 521 crash-landed at Dubai International Airport 96 22 April The RoomPlace's warehouse fire in Chicago 70 19 March FlyDubai Flight 981 crash over Russia 49
(Insured loss estimate USD millions)Natural Catastrophe Losses
Large Man-Made Losses
8.7%
8.7%
7.3% 7.0% 6.7% 6.2% 5.5%
5.5%
5.5% 5.2% 4.6%
4.5%
4.5%
4.4%
4.3% 4.1%
3.9% 3.2%
2.4%
2.2% 1.7%
5.0%
6.7%
1.8% 1.3%
2.7%
3.7%
2.2% 1.9%
0.9%
2.5% 1.9% 1.5%
1.8%
0.0%
0.0%
1.2%
1.7%
1.0%
1.0%
1.5% 1.0%
4.7%
0.0%
1.0%
2.0%
3.0%
4.0%
5.0%
6.0%
7.0%
8.0%
9.0%
10.0%FY 2016
FY 2015
FY 2016 SUBSET

Reinsurance Market Report – Year-End 2016
April 2017 15
Accident Year Performance, ex Catastrophe Excluding Natural Catastrophe losses and prior year reserve releases, the accident year combined ratio remained broadly unchanged at 94.5%.
Chart 9: Ex Catastrophe accident year combined ratios for the SUBSET
Expense Ratios for the SUBSET The expense ratio has increased marginally to 33.2% (FY 2015: 33.1%). The aggregate expense ratio for the SUBSET has risen by 4.0 percentage points over the last 9 years.
Chart 10: Weighted Average Expense Ratio for the SUBSET
Source: SNL Financial and Willis Towers Watson Market Security
■ The factors outlined in our year-end 2015 report remain relevant with overall expense ratios increasing based upon the upward pressure in expenses and the continued reduction in reinsurance premiums.
■ If each of the constituents of the SUBSET had been able to maintain an expense ratio at their respective 2007 levels, the aggregate RoE of 8.2% reported at FY 2016 would have been approximately 2.5 percentage points higher.
106.8%
105.1%
99.2%
98.6%
98.3%
97.2%
96.9%
96.8%
96.7%
96.4%
95.7%
94.8%
94.7%
94.1%
94.0%
93.2%
93.1%
92.4%
90.5%
90.5%
89.5%
87.6%
85.3%
75.5%
106.1%
105.4%
97.4%
98.2%
99.4%
97.4%
99.7% 94.6%
97.1%
95.8% 92.3%
92.6%
95.6% 91.1%
95.7%
97.6% 93.5%
91.3%
93.1%
93.9%
93.3% 88.9%
82.8%
71.3%
94.5%
60%
70%
80%
90%
100%
110%
120%FY 2016
FY 2015
FY 2016 SUBSET
29.2%29.6%
29.9%
30.7% 30.7% 30.8%31.2%
32.1%
33.1% 33.2%
28.0%
29.0%
30.0%
31.0%
32.0%
33.0%
34.0%
2007 2008 2009 2010 2011 2012 2013 2014 2015 2016

Reinsurance Market Report – Year-End 2016
16 April 2017
Chart 11: Impact of Expense Ratio Movement on RoE (Base Year – 2007) for the SUBSET
Source: SNL Financial and Willis Towers Watson Market Security
Modest Investment Returns As shown in Chart 12, the weighted average investment return for the INDEX, excluding realised and unrealised gains, remained unchanged at 2.9%. This yield benefits from higher than average returns from RGA and Mapfre whose investment portfolios reflect their significant Life business, and from certain reinsurers with significant emerging markets exposure. We would note that with the exception of WR Berkley and the Berkshire Hathaway subsidiaries, the investment yield achieved by the non-Life focused reinsurers in the U.S. and Europe was below the INDEX average at approximately 2.0%.
A number of reinsurers with shorter tail portfolios have seen an uptick in their investment income yields. However, the investment returns of those reinsurers with longer duration portfolios remained under greater pressure as they continued to replace maturing investments with lower yielding bonds. The latter part of 2016 was notable for a strong increase in equity markets which resulted in significant realised gains for certain reinsurers with higher than average exposure to equities. In addition, much of the increase in unrealised gains for the INDEX was also due to rising equity values. A large proportion of these unrealised gains were due to a rise in value of National Indemnity’s equity holdings.
Looking ahead, investment yields remain under pressure due to a continuation of the prolonged period of low interest rates since the financial crisis. However, some relief will be provided by the increases in US interest rates in December 2016 and March 2017. As weak pricing continues to pressurise underwriting returns, it remains to be seen if constituents of the INDEX will seek to increase investment risk materially.
16.2%
1.6%
13.3%
10.0%
3.4%
11.7% 11.8% 11.5%10.2%
8.2%
0.2%
0.3%
0.8%
0.8%
1.0% 1.2% 1.7%2.4%
2.5%
0.0%
2.0%
4.0%
6.0%
8.0%
10.0%
12.0%
14.0%
16.0%
18.0%
2007 2008 2009 2010 2011 2012 2013 2014 2015 2016
Reported RoE Expense Ratio Impact

Reinsurance Market Report – Year-End 2016
April 2017 17
Chart 12: Investment yield (net investment income as % of cash and invested assets) for the INDEX
13.7%
4.4% 4.2% 3.9%
3.9% 3.7% 3.3%
3.3%
3.2% 3.0% 2.7%
2.7%
2.7%
2.7%
2.6%
2.5%
2.4%
2.4%
2.4%
2.3% 2.1%
2.1%
2.0%
2.0%
2.0%
2.0%
1.9%
1.9%
1.8%
1.8%
1.7%
1.6%
1.6%
1.5%
1.4%
1.4%
13.7%
4.4% 4.2% 4.0%
3.9% 3.7%
3.2%
3.9%
3.9%
2.8%
3.1%
2.0%
2.6%
2.6%
2.9%
2.4% 2.1%
2.6% 2.3% 1.9%
2.2%
2.1% 1.9%
2.2%
1.5%
1.9%
2.0% 1.7%
2.1%
1.3%
1.5%
2.1%
1.5%
2.8%
1.4% 1.2%
2.9%
0.0%
1.0%
2.0%
3.0%
4.0%
5.0%
6.0%
7.0%
FY 2016
FY 2015
FY 2016 INDEX

Reinsurance Market Report – Year-End 2016
18 April 2017
Appendices 1. Full Year 2016 results summary for the Willis Reinsurance Index
* Full year Net Income as % of Average Shareholders Equity. ** General Reinsurance and National Indemnity: Numbers are sourced from unconsolidated financial statements. *** Aggregate = Total of numbers reported, converted to USD at exchange rates prevailing at end of reporting period. (1) NWP includes both Life and Non-Life business. (2) GIC India, Toa Re: Each has a March 31 financial year end. Data for the year ended March 31, 2016 is included in the
column headed Dec 31, 2015 (and similar for prior years). (3) Figures for net premiums are Net Earned Premium, not Net Written Premiums. (4) CCR: Figures for net premiums are Gross Written Premiums, not Net Written Premiums, and include both State-backed
and Open Market business (5) Annual information for 2016 not released at time of publication (6) Everest Re 2015 Combined ratio as originally reported (subsequently restated to 85.1%) (7) GIC India: Shareholders Equity as reported by GIC, parent company. (8) Combined ratios are Willis Market Security Calculations. (9) Munich Re: Combined Ratios are in respect of the P&C Reinsurance division only. Shareholders' Equity at Dec 31, 2014
are as originally reported. (10) Swiss Re: Combined Ratios are in respect of the P&C Reinsurance division only. The information compiled in this report by Willis Towers Watson is compiled from third party sources we consider to be reliable However we do not guarantee and are not responsible for its accuracy or completeness and no warranty or representation of accuracy or completeness is given
Dec-31 Dec-31 Dec-31 ∆ FY FY FY ∆ FY FY FY ∆ FY FY FY ∆2016 2015 2014 FY 2016 2015 2014 FY 2016 2015 2014 FY FY 2016 FY 2015 2016 2015 2014 FY
African Re USD - 780 737 - 593 624 - 104 119 - 13.7% - 86.9% 88.8%
Alleghany USD 7,940 7,555 7,473 5.1% 5,092 4,489 4,498 13.4% 457 560 679 -18.5% 5.9% 7.5% 91.9% 89.0% 88.8% +2.9%
Allied World USD 3,552 3,533 3,778 0.5% 2,256 2,448 2,322 -7.9% 255 84 490 204.3% 7.2% 2.3% 96.2% 95.1% 85.2% +1.1%
Amlin (5) GBP 1,846 1,783 2,445 2,296 237 237 13.0% - 89.0% 89.0%
Arch Capital USD 8,254 6,205 6,130 33.0% 4,031 3,818 3,892 5.6% 693 538 834 28.8% 9.6% 8.7% 89.9% 89.5% 87.2% +0.4%
ARGO USD 1,793 1,668 1,647 7.5% 1,440 1,402 1,368 2.7% 147 163 183 -10.1% 8.5% 9.8% 96.2% 95.2% 96.2% +1.0%
Asia Capital Re (5) USD 791 844 124 373 -38 20 - -4.7% - 112.0% 108.0%
Aspen USD 3,647 3,419 3,419 6.7% 2,594 2,646 2,515 -2.0% 203 323 356 -37.0% 5.8% 9.5% 98.1% 91.9% 91.7% +6.2%
Ax is Capital USD 6,272 5,867 5,821 6.9% 3,753 3,675 3,907 2.1% 513 642 811 -20.0% 8.5% 11.0% 95.9% 94.7% 91.6% +1.2%
Beazley (1) USD 1,484 1,441 1,343 2.9% 1,854 1,713 1,733 8.2% 251 249 218 0.8% 17.2% 17.9% 89.0% 87.0% 89.0% +2.0%
CCR, France (1)(4)(5) EUR 2,085 1,969 1,287 1,323 216 193 - 10.7% - 76.8% 82.6%
China Re (1) CNY 71,182 70,187 53,893 1.4% 83,140 74,679 69,561 11.3% 5,146 7,579 5,404 -32.1% 7.3% 12.2% 104.7% 102.4% 99.0% +2.3%
Endurance USD 4,882 4,856 3,185 0.5% 2,370 1,950 1,934 21.5% 357 344 348 3.8% 7.3% 8.6% 88.1% 82.9% 86.0% +5.2%
Ev erest Re (6) USD 8,075 7,609 7,451 6.1% 5,271 5,378 5,257 -2.0% 996 978 1,199 1.9% 12.7% 13.0% 87.0% 83.4% 82.8% +3.6%
Fairfax USD 9,820 10,287 9,526 -4.5% 8,088 7,521 6,302 7.6% -513 568 1,633 -190.3% -5.1% 5.7% 92.5% 89.9% 90.8% +2.6%
General Reinsurance** USD 10,661 11,051 11,707 -3.5% 550 548 593 0.3% 742 571 538 30.0% 6.8% 5.0% 92.5% 95.5% 86.5% -2.9%
GIC India (1)(2)(7) INR 392,826 419,405 163,748 138,570 28,485 26,938 - 7.0% - 107.4% 109.0%
Hannov er Re (1) EUR 8,997 8,068 7,551 11.5% 14,604 14,850 12,581 -1.7% 1,171 1,151 986 1.8% 13.7% 14.7% 93.7% 94.4% 94.7% -0.7%
Hiscox GBP 1,818 1,528 1,453 19.0% 1,788 1,572 1,343 13.7% 337 210 216 60.5% 20.1% 14.1% 84.4% 85.0% 83.9% -0.6%
IRB, Brazil (3)(8) BRL 3,328 3,175 2,954 4.8% 3,543 2,457 1,946 44.2% 850 764 602 11.3% 26.1% 24.9% 82.0% 83.8% 88.8% -1.8%
Korean Re (1) KRWbn 2,115 2,015 1,839 4.9% 4,676 4,369 3,929 7.0% 163 186 116 -12.3% 7.9% 9.7% 98.8% 97.3% 99.4% +1.5%
Lancashire USD 1,207 1,220 1,357 -1.1% 459 482 743 -4.8% 154 181 229 -15.1% 12.7% 14.1% 76.5% 72.1% 68.7% +4.4%
Mapfre (3) EUR 9,127 8,574 9,153 6.4% 19,038 17,988 18,458 5.8% 776 709 845 9.4% 8.8% 8.0% 97.4% 98.6% 95.7% -1.2%
Markel USD 8,461 7,834 7,595 8.0% 4,001 3,819 3,917 4.8% 456 583 321 -21.8% 5.6% 7.6% 92.0% 89.0% 95.0% +3.0%
Munich Re (1)(9) EUR 31,516 30,668 30,033 2.8% 47,325 48,505 47,225 -2.4% 2,580 3,107 3,153 -17.0% 8.3% 10.2% 95.7% 89.7% 94.5% +6.0%
National Indemnity ** USD 101,286 89,829 93,998 12.8% 20,030 18,457 26,655 8.5% 7,577 7,271 12,007 4.2% 7.9% 7.9% 95.2% 93.2% 92.5% +2.0%
Nav igators USD 1,178 1,096 1,027 7.5% 1,186 1,044 1,000 13.6% 83 81 95 2.1% 7.3% 7.6% 96.7% 94.1% 92.6% +2.6%
Nov ae GBP 322 350 336 -8.2% 664 638 528 4.1% 22 52 50 -58.1% 6.4% 15.0% 103.6% 90.8% 91.0% +12.8%
Partner Re (1) USD 6,688 6,901 7,049 -3.1% 4,954 5,230 5,720 -5.3% 447 104 1,055 328.5% 6.6% 1.5% 93.6% 85.6% 86.2% +8.0%
Renaissance Re USD 4,867 4,732 3,866 2.8% 1,535 1,416 1,068 8.4% 503 431 533 16.6% 10.5% 10.0% 72.5% 64.7% 50.2% +7.8%
RGA Re (1)(3) USD 7,093 6,135 7,023 15.6% 9,249 8,571 8,670 7.9% 701 502 684 39.7% 10.6% 7.6%
SCOR (1) EUR 6,661 6,330 5,694 5.2% 12,577 12,077 10,138 4.1% 603 642 512 -6.1% 9.3% 10.7% 93.1% 91.1% 91.4% +2.0%
Sirius USD 2,208 2,183 2,019 1.2% 938 848 883 10.7% 88 326 324 -73.0% 4.0% 15.5% 95.1% 81.5% 76.6% +13.6%
Sw iss Re (1)(10) USD 35,634 33,517 35,930 6.3% 33,570 30,442 31,640 10.3% 3,558 4,597 3,500 -22.6% 10.3% 13.2% 93.5% 87.4% 85.4% +6.1%
Toa Re (1)(2) JPYbn 181 199 224 209 6 6 - 3.0% - 96.5% 94.0%
Validus USD 3,838 3,639 3,588 5.5% 2,359 2,229 2,054 5.8% 359 375 481 -4.1% 9.6% 10.4% 84.2% 79.7% 73.7% +4.5%
WR Berkley USD 5,047 4,600 4,590 9.7% 6,424 6,190 5,997 3.8% 602 504 649 19.5% 12.5% 11.0% 94.3% 93.7% 93.8% +0.6%
XL Catlin USD 10,939 11,677 10,034 -6.3% 10,231 7,951 5,945 28.7% 441 1,207 188 -63.5% 3.9% 11.1% 94.2% 92.0% 88.2% +2.2%
USD 331,661 332,210 341,480 -0.2% 253,838 264,749 279,179 -4.1% 26,224 31,028 37,796 -15.5% 8.2% 9.5% 94.2% 91.4% 91.5% +2.8%
% Sh Equity*
Aggregate***
Notes
WILLIS TOWERS WATSON - MARKET SECURITY GROUPGroup Consolidated 2016 Results Table
Consolidated Data
(Millions) Ccy
Shareholders' Equity Net Written Premium Net Income Combined ratio
Reinsurance Market Report – Year-End 2016
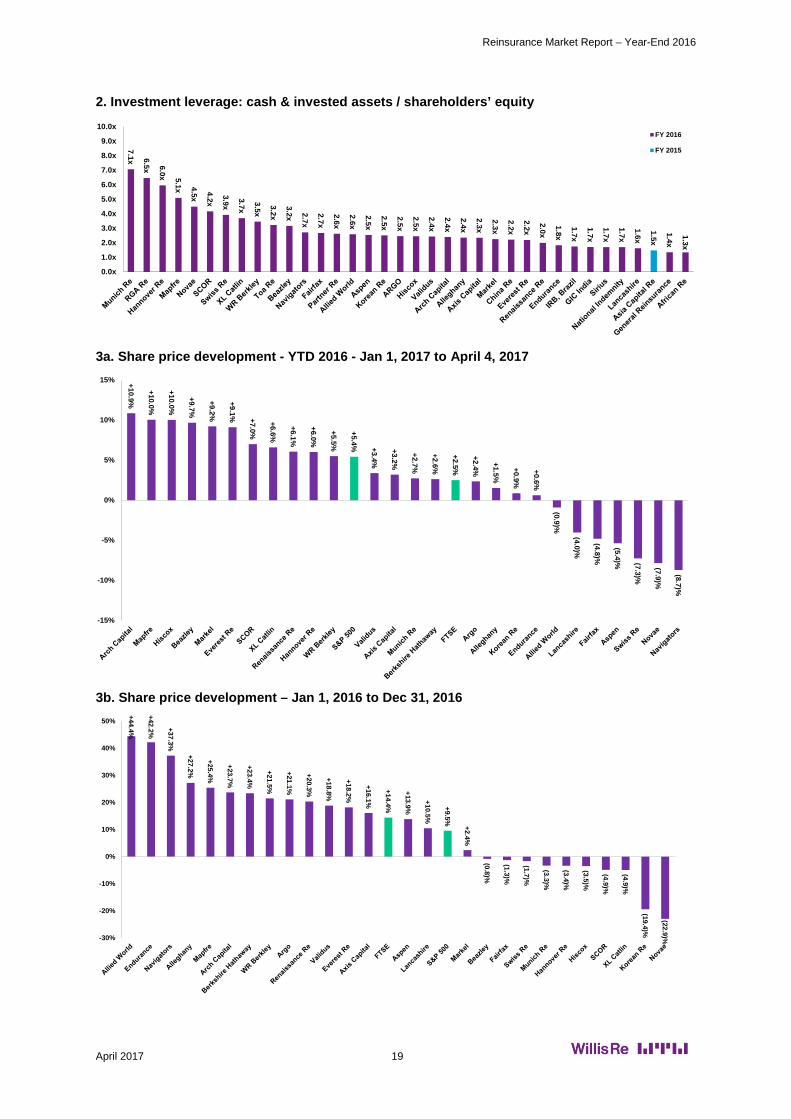
April 2017 19
2. Investment leverage: cash & invested assets / shareholders’ equity
3a. Share price development - YTD 2016 - Jan 1, 2017 to April 4, 2017
3b. Share price development – Jan 1, 2016 to Dec 31, 2016
7.1x 6.5x 6.0x 5.1x 4.5x
4.2x
3.9x
3.7x
3.5x
3.2x
3.2x 2.7x
2.7x
2.6x
2.6x
2.5x
2.5x
2.5x
2.5x
2.4x
2.4x
2.4x
2.3x
2.3x
2.2x
2.2x
2.0x
1.8x
1.7x
1.7x
1.7x
1.7x
1.6x
1.4x
1.3x
1.5x
0.0x
1.0x
2.0x
3.0x
4.0x
5.0x
6.0x
7.0x
8.0x
9.0x
10.0xFY 2016
FY 2015
+10.9%
+10.0%
+10.0%
+9.7%
+9.2%
+9.1% +7.0%
+6.6%
+6.1%
+6.0%
+5.5%
+5.4% +3.4%
+3.2%
+2.7%
+2.6%
+2.5%
+2.4%
+1.5%
+0.9%
+0.6%
(0.9)%
(4.0)%
(4.8)%
(5.4)% (7.3)%
(7.9)%
(8.7)%
-15%
-10%
-5%
0%
5%
10%
15%
+44.4%
+42.2%
+37.3%
+27.2%
+25.4%
+23.7%
+23.4%
+21.5%
+21.1%
+20.3%
+18.8%
+18.2%
+16.1%
+14.4%
+13.9%
+10.5%
+9.5%
+2.4%
(0.8)%
(1.3)%
(1.7)%
(3.3)%
(3.4)%
(3.5)%
(4.9)%
(4.9)%
(19.4)%
(22.9)%-30%
-20%
-10%
0%
10%
20%
30%
40%
50%
Willis Limited, Registered number: 181116 England and Wales.Registered address: 51 Lime Street, London, EC3M 7DQ. A Lloyd’s Broker. Authorised and regulated by the Financial Conduct Authority for its general insurance mediation activities only. 20101/03/17
willistowerswatson.com
© Copyright 2017 Willis Limited / Willis Re Inc. All rights reserved: No part of this publication may be reproduced, disseminated, distributed, stored in a retrieval system, transmitted or otherwise transferred in any form or by any means, whether electronic, mechanical, photocopying, recording, or otherwise, without the permission of Willis Limited / Willis Re Inc. Some information contained in this document may be compiled from third party sources and we do not guarantee and are not responsible for the accuracy of such. This document is for general information only and is not intended to be relied upon. Any action based on or in connection with anything contained herein should be taken only after obtaining specific advice from independent professional advisors of your choice. The views expressed in this document are not necessarily those of Willis Limited / Willis Re Inc., its parent companies, sister companies, subsidiaries or affiliates, Willis Towers Watson PLC and all member companies thereof (hereinafter “Willis Towers Watson”). Willis Towers Watson is not responsible for the accuracy or completeness of the contents herein and expressly disclaims any responsibility or liability for the reader’s application of any of the contents herein to any analysis or other matter, or for any results or conclusions based upon, arising from or in connection with the contents herein, nor do the contents herein guarantee, and should not be construed to guarantee, any particular result or outcome. Willis Towers Watson accepts no responsibility for the content or quality of any third party websites to which we refer.
The contents herein are provided for informational purposes only and do not constitute and should not be construed as professional advice. Any and all examples used herein are for illustrative purposes only, are purely hypothetical in nature, and offered merely to describe concepts or ideas. They are not offered as solutions to produce specific results and are not to be relied upon. The reader is cautioned to consult independent professional advisors of his/her choice and formulate independent conclusions and opinions regarding the subject matter discussed herein. Willis Towers Watson is not responsible for the accuracy or completeness of the contents herein and expressly disclaims any responsibility or liability for the reader’s application of any of the contents herein to any analysis or other matter, nor do the contents herein guarantee, and should not be construed to guarantee, any particular result or outcome.
About Willis Towers WatsonWillis Towers Watson (NASDAQ: WLTW ) is a leading global advisory, broking and solutions company that helps clients around the world turn risk into a path for growth. With roots dating to 1828, Willis Towers Watson has 40,000 employees serving more than 140 countries. We design and deliver solutions that manage risk, optimize benefits, cultivate talent, and expand the power of capital to protect and strengthen institutions and individuals. Our unique perspective allows us to see the critical intersections between talent, assets and ideas — the dynamic formula that drives business performance. Together, we unlock potential. Learn more at willistowerswatson.com.
Contact usAnnie RobertsCorporate Communications UK51 Lime StreetLondon, EC3M 7DQ
D +44 (0) 203 124 7080M +44 (0) 778 766 [email protected]