Embed Size (px)
Citation preview

The Modern History of Exchange Rate Arrangements: A ReinterpretationAuthor(s): Carmen M. Reinhart and Kenneth S. RogoffSource: The Quarterly Journal of Economics, Vol. 119, No. 1 (Feb., 2004), pp. 1-48Published by: Oxford University PressStable URL: http://www.jstor.org/stable/25098676 .Accessed: 17/07/2011 11:49
Your use of the JSTOR archive indicates your acceptance of JSTOR's Terms and Conditions of Use, available at .http://www.jstor.org/page/info/about/policies/terms.jsp. JSTOR's Terms and Conditions of Use provides, in part, that unlessyou have obtained prior permission, you may not download an entire issue of a journal or multiple copies of articles, and youmay use content in the JSTOR archive only for your personal, non-commercial use.
Please contact the publisher regarding any further use of this work. Publisher contact information may be obtained at .http://www.jstor.org/action/showPublisher?publisherCode=oup. .
Each copy of any part of a JSTOR transmission must contain the same copyright notice that appears on the screen or printedpage of such transmission.
JSTOR is a not-for-profit service that helps scholars, researchers, and students discover, use, and build upon a wide range ofcontent in a trusted digital archive. We use information technology and tools to increase productivity and facilitate new formsof scholarship. For more information about JSTOR, please contact [email protected].
Oxford University Press is collaborating with JSTOR to digitize, preserve and extend access to The QuarterlyJournal of Economics.
http://www.jstor.org

THE
QUARTERLY JOURNAL
OF ECONOMICS
Vol. CXIX February 2004 Issue 1
THE MODERN HISTORY OF EXCHANGE RATE ARRANGEMENTS: A REINTERPRETATION*
Carmen M. Reinhart and Kenneth S. Rogoff
We develop a novel system of reclassifying historical exchange rate regimes. One key difference between our study and previous classifications is that we
employ monthly data on market-determined parallel exchange rates going back to
1946 for 153 countries. Our approach differs from the IMF official classification
(which we show to be only a little better than random); it also differs radically from all previous attempts at historical reclassification. Our classification points to a rethinking of economic performance under alternative exchange rate regimes.
Indeed, the breakup of Bretton Woods had less impact on exchange rate regimes than is popularly believed.
I. Introduction
This paper rewrites the history of post-World War II ex
change rate arrangements, based on an extensive new monthly data set spanning across 153 countries for 1946-2001. Our ap
proach differs not only from countries' officially declared classifi
cations (which we show to be only a little better than random); it
also differs radically from the small number of previous attempts at historical reclassification.1
* The authors wish to thank Alberto Alesina, Arminio Fraga, Amartya Lahiri, Vincent Reinhart, Andrew Rose, Miguel Savastano, participants at Harvard Uni
versity's Canada-US Economic and Monetary Integration Conference, Interna tional Monetary Fund-World Bank Joint Seminar, National Bureau of Economic
Research Summer Institute, New York University, Princeton University, and three anonymous referees for useful comments and suggestions, and Kenichiro
Kashiwase, Daouda Sembene, and Ioannis Tokatlidis for excellent research as sistance. Data and background material to this paper are available at
http: I /www.puaf. umd.edu.facultylpaperslreinhartlreinhart.htm. 1. The official classification is given in the IMF's Annual Report on Exchange
Rate Arrangements and Exchange Restrictions, which, until recently, asked mem ber states to self-declare their arrangement as belonging to one of four categories.
? 2004 by the President and Fellows of Harvard College and the Massachusetts Institute of
Technology. The Quarterly Journal of Economics, February 2004
i

2 QUARTERLY JOURNAL OF ECONOMICS
As a first innovation, we incorporate data on parallel and
dual exchange rate markets, which have been enormously impor tant not only in developing countries but in virtually all the
European countries up until the late 1950s, and sometimes well
beyond. We argue that any classification algorithm that fails to
distinguish between unified rate systems (with one official ex
change rate and no significant "black" or parallel market) and all
others is fundamentally flawed. Indeed, in the vast majority of
multiple exchange rate or dual systems, the floating dual or
parallel rate is not only a far better barometer of monetary policy than is the official exchange rate, it is often the most economically
meaningful rate.2 Very frequently?roughly half the time for
official pegs?we find that dual/parallel rates have been used as a
form of "back door" floating, albeit one usually accompanied by
exchange controls. The second novelty in our approach is that we
develop extensive chronologies of the history of exchange ar
rangements and related factors, such as exchange controls and
currency reforms. Together with a battery of descriptive statis
tics, this allows us to draw a nuanced distinction between what
countries declare as their official de jure regime, and their actual
de facto exchange rate practices. To capture the wide range of
arrangements, our approach allows for fourteen categories of
exchange rate regimes, ranging from no separate legal tender or
a strict peg to a dysfunctional "freely falling" or "hyperfloat." Some highlights from our reclassification of exchange rate
arrangements are as follows.
First, dual, or multiple rates, and parallel markets have
prevailed far more frequently than is commonly acknowledged. In
1950, 45 percent of the countries in our sample had dual or
multiple rates; many more had thriving parallel markets. Among the industrialized economies, dual or multiple rates were the
Previous studies have either extended the four-way official classification into a more informative taxonomy (see Ghosh et al. [1997]), or relied largely on statis tical methods to regroup country practices (see Levy-Yeyati and Sturzenegger [2002]). The Fund, recognizing the limitations of its former strategy, revised and
upgraded the official approach toward classifying exchange rate arrangements in 1997 and again in 1999. Notably, all these prior approaches to exchange rate
regime classification, whether or not they accept the country's declared regime, have been based solely on official exchange rates.
2. When we refer to multiple exchange rates in this context, we are focusing on the cases where one or more of the rates is market-determined. This is very different from the cases where the multiple official rates are all fixed and simply act as a differential tax on a variety of transactions. Dual markets are typically legal, whereas parallel markets may or may not be legal.

EXCHANGE RATE ARRANGEMENTS 3
norm in the 1940s and the 1950s, and in some cases, these lasted
until much later. Our data lend strong support to the view
stressed by Bordo [1993] that Bretton Woods encompassed two
very different kinds of exchange rate arrangements in the pre and postconvertibility periods and that the period of meaningful
exchange rate stability was quite short-lived. In the developing
world, such practices remained commonplace through the 1980s
and 1990s and into the present. We show that market-determined dual/parallel markets are
important barometers of underlying monetary policy. This may be obvious in cases such as modern-day Myanmar where the
parallel market premium at the beginning of 2003 exceeded 700
percent. As we show, however, the phenomenon is much more
general, with the parallel market premium often serving as a
reliable guide to the direction of future official exchange rate
changes. Whereas dual/parallel markets have been marginal over
some episodes, they have been economically important in others, and there are many instances where only a few transactions take
place at the official rate. To assess the importance of secondary
(legal or illegal) parallel markets, we collected data that allow us
to estimate export misinvoicing practices, in many cases going back to 1948. These estimates show that leakages from the official
market were significant in many of the episodes when there were
dual or parallel markets.
Second, when one uses market-determined rates in place of official rates, the history of exchange rate policy begins to look
very different. For example, it becomes obvious that de facto
floating was common during the early years of the Bretton Woods era of "pegged" exchange rates. Conversely, many "floats" of the
post-1980s turn out to be (de facto) pegs, crawling pegs, or very narrow bands. Of countries listed in the official IMF classification as managed floating, 53 percent turned out to have de facto pegs,
crawls, or narrow bands to some anchor currency.
Third, next to pegs (which account for 33 percent of the observations during 1970-2001 (according to our new "Natural"
classification), the most popular exchange rate regime over mod ern history has been the crawling peg, which accounted for over 26 percent of the observations. During 1990 to 2001 this was the
most common type of arrangement in emerging Asia and Western
Hemisphere (excluding Canada and the United States), making up for about 36 and 42 percent of the observations, respectively.
Fourth, our taxonomy introduces a new category: freely fall

4 QUARTERLY JOURNAL OF ECONOMICS
ing, or the cases where the twelve-month inflation rate is equal to or exceeds 40 percent per annum.3 It turns out to be a crowded
category indeed, with about 12 Vz percent of the observations in our sample occurring in the freely falling category. As a result,
"freely falling" is about three times as common as "freely float
ing," which accounts for only 4 V2 percent of the total observa tions. (In the official classification, freely floating accounts for over 30 percent of observations over the past decade.) Our new
freely falling classification makes up 22 and 37 percent of the
observations, respectively, in Africa and Western Hemisphere (excluding Canada and the United States) during 1970-2001. In the 1990s freely falling accounted for 41 percent of the observa tions for the transition economies. Given the distortions associ
ated with very high inflation, any fixed versus flexible exchange rate regime comparisons that do not break out the freely falling
episodes are meaningless, as we shall confirm.
There are many important reasons to seek a better approach to classifying exchange rate regimes. Certainly, one is the recog nition that contemporary thinking on the costs and benefits of
alternative exchange rate arrangements has been profoundly in
fluenced by the large number of studies on the empirical differ ences in growth, trade, inflation, business cycles, and commodity price behavior. Most have been based on the official classifications
and all on official exchange rates. In light of the new evidence we
collect, we conjecture that the influential results in Baxter and
Stockman [1989]?that there are no significant differences in
business cycles across exchange arrangements?may be due to
the fact that the official historical groupings of exchange rate
arrangements are misleading. The paper proceeds as follows. In the next section we present
evidence to establish the incidence and importance of dual or
multiple exchange rate practices. In Section III we sketch our
methodology for reclassifying exchange rate arrangements. Sec
tion IV addresses some of the possible critiques to our approach, compares our results with the "official history," and provides
examples of how our reclassification may reshape evidence on the
links between exchange rate arrangements and various facets of
economic activity. The final section reiterates some of the main
3. We also include in the freely falling category the first six months following an exchange rate crisis (see the Appendix for details), but only for those cases
where the crisis marked a transition from a peg or quasi-peg to a managed or
independent float.

EXCHANGE RATE ARRANGEMENTS 5
findings, while background material to this paper provides the
detailed country chronologies that underpin our analysis.
II. The Incidence and Importance of Dual and Multiple
Exchange Rate Arrangements
In this section we document the incidence of dual or parallel markets (legal or otherwise) and multiple exchange rate practices during post-World War II. We then present evidence that the
market-determined exchange rate is a better indicator of the
underlying monetary policy than the official exchange rate. Fi
nally, to provide a sense of the quantitative importance for eco
nomic activity of the dual or parallel market, we present esti mates of "leakages" from the official market. Specifically, we
provide quantitative measures of export misinvoicing practices. We primarily use monthly data on official and market-deter
mined exchange rates for the period 1946-2001. In some in
stances, the data for the market-determined rate is only available for a shorter period and the background material provides the
particulars on a country-by-country basis. The pre-1999 market determined exchange rate data come from various issues of Pick's
Currency Yearbook, Pick's Black Market Yearbooks, and World
Currency Reports, and the official rate comes from the same sources and as well as the IMF. The quotes are end-of-month
exchange rates and are not subject to revisions. For the recent
period (1999-2001) the monthly data on market-determined ex
change rates come from the original country sources (i.e., the central banks), for those countries where there are active parallel
markets for which data are available.4 Since our coverage spans more than 50 years, it encompasses numerous cases of monetary reforms involving changes in the units of account, so the data
were spliced accordingly to ensure continuity.
U.A. On the Popularity of Dual and Multiple Exchange Rate Practices
Figure I illustrates de facto and de jure nonunified exchange rate regimes. The figure shows the incidence of exchange rate
arrangements over 1950-2001, with and without stripping out
4. These countries include Afghanistan, Angola, Argentina, Belarus, Belize, Bolivia, Burundi, Congo (DCR), Dominican Republic, Egypt, Ghana, Iran, Libya,
Macedonia, Mauritania, Myanmar, Nigeria, Pakistan, Rwanda, Tajikistan, Turk menistan, Ukraine, Uzbekistan, Yemen, Yugoslavia, and Zimbabwe.
6 QUARTERLY JOURNAL OF ECONOMICS
1950 1970-1973 1974-1990 1991-2001
Figure I
The Incidence of Dual or Multiple Exchange Rate Arrangements, 1950-2001:
Simplified IMF Classification Sources: International Monetary Fund, Annual
Report on Exchange Arrange
ments and Exchange Restrictions and International Financial Statistics; Pick and S?dillot [1971]; International Currency Analysis, World Currency Yearbook, vari ous issues.
Exchange rate arrangements classified as "Other" include the IMF's categories of limited flexibility, managed floating, and independently floating.
cases of dual markets or multiple exchange rates. The IMF clas
sification has been simplified into what it was back in the days of
Bretton Woods?namely, Pegs and Other.5 The dark portions of
the bars represent cases with unified exchange rates, and the
lightly shaded portion of each bar separates out the dual, multi
ple, or parallel cases. In 1950 more than half (53 percent) of all
arrangements involved two or more exchange rates. Indeed, the
heyday of multiple exchange rate practices and active parallel markets was 1946-1958, before the restoration of convertibility
in Europe. Note also, that according to the official IMF classifi
cation, pegs reigned supreme in the early 1970s, accounting for
over 90 percent of all exchange rate arrangements. In fact, over
half of these "pegs" masked parallel markets that, as we shall
show, often exhibited quite different behavior.
5. For a history of the evolution of the IMF's classification strategy, see the
working paper version of this paper, Reinhart and Rogoff [2002].

EXCHANGE RATE ARRANGEMENTS 7
II.B. The Market-Determined Exchange Rate as an Indicator of
Monetary Policy
While the quality of data on market-determined rates is
likely to vary across countries and time, we nevertheless believe
these data to be generally far better barometers of the underlying
monetary policy than are official exchange rates. For instance, if
the laxity in monetary policy is not consistent with maintaining a
fixed official exchange rate, one would expect that the market
determined rate starts depreciating ahead of the inevitable de
valuation of the official rate. When the official realignment oc
curs?it is simply a validation of what had previously transpired in the free market. Indeed, this is the pattern shown in the three
panels of Figure II for the cases of Bolivia, Indonesia, and Iran?
many more such cases are displayed in the figures that accom
pany the 153 country chronologies.6 This pattern also emerges often in the developed European economies and Japan in the
years following World War II.
To illustrate more rigorously that the market-based ex
change rate is a better indicator of the monetary policy stance
than the official rate, we performed two exercises for each coun
try. First, we examined whether the market-determined ex
change rate systematically predicts realignments in the official
rate, as suggested in Figure II. To do so, we regressed a currency crash dummy on the parallel market premium lagged one to six
months, for each of the developing countries in our sample.7 If the
market exchange rate consistently anticipates devaluations of the
official rate, its coefficient should be positive and statistically
significant. If, in turn, the official exchange rate does not validate
the market rate, then the coefficient on the lagged market ex
change rate will be negative or simply not significant. Table I
summarizes the results of the country-by-country time series
probit regressions. In the overwhelming number of cases (97
percent), the coefficient on the market-determined exchange rate
is positive. In about 81 percent of the cases, the sign on the
coefficient was positive and statistically significant. Indeed, for
6. See "Part I. The Country Chronologies and Chartbook, Background Mate rial to A Modern History of Exchange Rate Arrangements: A Reinterpretation" at
http: I /www.puaf. umd.edu/facultylpapers/reinhart/reinhart. htm. 7. Two definitions of currency crashes are used. A severe currency crash
refers to a 25 percent or higher monthly depreciation which is at least 10 percent higher than the previous month's depreciation. The "milder" version represents a 12.5 percent monthly depreciation which is at least 10 percent above the preced ing month's depreciation; see details in the Appendix.

8 QUARTERLY JOURNAL OF ECONOMICS
Official Market-Determined
&
Bolivia: Log of Official and Market-Determined Exchange Rates
January 1946-December 1972
1946 1948 1950 1952 1954 1956 1958 1960 1962 1964 1966 1968 1970 1972
Indonesia: Log of Official and Market-Determined Exchange Rates
January 1946-December 1972
8 6
3 4 I 2
1 o s? I-2
d -6
2 -8
1946 1948 1950 1952 1954 1956 1958 1960 1962 1964 1966 1968 1970 1972
Iran: Log of Official and Market-Determined Exchange Rates
January 1946-December 1998
1946 1950 1954 1958 1962 1966 1970 1974 1978 1981 1986 1990 1994 1998
Figure II
Official Exchange Rates Typically Validate the Changes in the Market Rates
Sources: Pick and S?dillot [1971]; International Currency Analysis, World Cur
rency Yearbook, various issues.

EXCHANGE RATE ARRANGEMENTS 9
TABLE I Is the Parallel Market Rate a Good Predictor of Crashes in the Official
Exchange Rate?
Summary of the Probit Country-by-Country Estimation
Regression, D0t = a + ? APt_? + ut "Mild" crash
Percent of countries for which:
? > 0 97.1
? > 0 and significant3 81.4
? < 0 2.9
? < 0 and significant3 1.4
Sources: Pick's Currency Yearbook, World Currency Report, Pick's Black Market Yearbook, and the authors' calculations.
Dot is a dummy variable that takes on the value of 1 when there is a realignment in the official exchange rate
along the lines described below and 0 otherwise, a and ? are the intercept and slope coefficients, respectively (our null hypothesis is ? > 0), AP?_? is the twelve-month change in the parallel exchange rate, lagged one to six months (the lags were allowed to vary country by country, as there was no prior reason to restrict dynamics to be the same for all countries) and ut is a random disturbance. Two definitions of currency crashes are used in the spirit of Frankel and Rose [1996]. A "severe" currency crash refers to a 25 percent or higher monthly depreciation, which is at least 10 percent higher than the previous month's depreciation. The "mild" version represents a 12.5 percent
monthly depreciation, which is at least 10 percent above the preceding month's depreciation. Since both defini tions of crash yield similar results, we report here only those for the more inclusive definition. The regression sample varies by country and is determined by data availability.
a. At the 10 percent confidence level or higher.
Western Hemisphere as a region, the coefficient on the parallel
premium was significant for all the countries in our sample. These findings are in line with those of Bahmani-Oskooee,
Miteza, and Nasir [2002], who use panel annual data for 1973
1990 for 49 countries and employ a completely different approach. Their panel cointegration tests indicate that the official rate will
systematically adjust to the market rate in the long run.
Second, we calculated pairwise correlations between inflation
(measured as the twelve-month change in the consumer price index) and the twelve-month percent change in the official and
market exchange rates, six months earlier. If the market rate is a better pulse of monetary policy, it should be (a priori) more
closely correlated with inflation. As shown in Table II, we find
that for the majority of cases (about three-quarters of the coun
tries) the changes in market-determined exchange rates have
higher correlations with inflation than do changes in the official
rate.8 An interesting exception to this pattern of higher correla
8. Note that, due to data limitations, we use official prices rather than black market or "street" prices to measure inflation here. Otherwise, the dominance of the market-determined rates in this exercise would presumably be even more
pronounced.

10 QUARTERLY JOURNAL OF ECONOMICS
TABLE II Inflation, Official and Market-Determined Exchange Rates:
COUNTRY-BY-COUNTRY PaIRWISE CORRELATIONS
Percent of countries for which the correlations of:
The market-determined exchange rate and inflation are higher than the
correlations of the official rate and inflation 73.7
The market-determined exchange rate and inflation are lower than the
correlations of the official rate and inflation 26.3
Sources: International Monetary Fund, International Financial Statistics, Pick's Currency Yearbook, World Currency Report, Pick's Black Market Yearbook, and the authors' calculations.
The correlations reported are those of the twelve-month percent change in the consumer price index with the twelve-month percent change in the relevant bilateral exchange rate lagged six months.
tions between the market-determined exchange rate changes and
inflation is for the industrial countries in the "Convertible Bret
ton Woods" period (1959-1973), an issue that merits further
study.
U.C. How Important Are Parallel Markets?
There are cases where the parallel (or secondary) exchange rate applies only to a few limited transactions. An example is the
"switch pound" in the United Kingdom during September 1950
through April 1967.9 However, it is not unusual for dual or
parallel markets (legal or otherwise) to account for the lion's
share of transactions with the official rate being little more than
symbolic. As Kiguel, Lizondo, and O'Connell [1997] note, the
official rate typically diminishes in importance when the gap between the official and market-determined rate widens.
To provide a sense of the comparative relevance of the dual or
parallel market, we proceed along two complementary dimen
sions. First, we include a qualitative description in the country
specific chronologies (see background material) of what transac
tions take place in the official market versus the secondary mar
ket. Second, we develop a quantitative measure of the potential size of the leakages into dual or parallel exchange markets.10
9. For example, while the United Kingdom officially had dual rates through April 1967, the secondary rate was so trivial (both in terms of the premium and the volume of transactions it applied to) that it is classified as a peg in our
classification scheme (see background material). In the next section we describe how our classification algorithm deals with these cases.
10. For instance, according to Claessens [1997], export underinvoicing hit a
historic high in Mexico during 1982?the crisis year in which the dual market was

EXCHANGE RATE ARRANGEMENTS 11
Following Ghei, Kiguel, and O'Connell [1997], we classify epi sodes where there are dual/parallel markets into three tiers ac
cording to the level (in percent) of the parallel market premium: low (below 10 percent), moderate (10 percent or above but below
50), and high (50 percent and above). For the episodes of dual/
parallel markets, we provide information about which category each episode falls in (by calculating the average premium for the
duration of the episode). In addition to the information contained
in the premium, we constructed an extensive database on export
misinvoicing, or the difference between what a country reports as
its exports and what other countries report as imports from that
country, adjusted for shipping costs. Historically, there are tight links between capital flight, export underinvoicing, and the par allel market premium.11 As with the parallel market premium,
we divide the export misinvoicing estimates into three categories (as a percent of the value of total exports): low (less than 10
percent of exports), moderate (10 to 15 percent of exports), and
high (above 15 percent). For Europe, Japan, and the United
States, misinvoicing calculations start in 1948, while for the
remaining countries these start in 1970. In the extensive back
ground material to this paper, we show, for each episode, which of
the three categories is applicable. Finally, we construct a score (1 for Low, 2 for Moderate, and 3 for High) for both of these proxies for leakages. The combined score on the estimated size of the
leakages (these range from 2 to 6) is also reported.12 Table III, which shows the evolution of export misinvoicing
(as a percent of the value of total exports) and the parallel market
premium (in percent) across regions and through time, provides a
general flavor of the size of potential leakages from the official market. According to our estimates of misinvoicing (top panel), the regional patterns show the largest leakages for the Caribbean and non-CFA Sub-Saharan Africa 1970-2001, with averages in
the 30 to 50 percent range. The lowest estimates of misinvoicing (8 to 11 percent) are for Western Europe, North America, and the
introduced. Similar statements can be made about other crisis episodes that involved the introduction of exchange controls and the segmentation of markets.
11. See Kiguel, Lizondo, and O'Connell [1997] and the references contained therein.
12. See "Part II. Parallel Markets and Dual and Multiple Exchange Rate Practices: Background Material to A Modern History of Exchange Rate Arrange ments: A Reinterpretation" at http:/ lwww.puaf.umd.edu/faculty/papers I rein hart I reinhart, htm.

12 QUARTERLY JOURNAL OF ECONOMICS
TABLE III Leakages: Export Misinvoicing and the Parallel Market Premium
Absolute Value of Export Misinvoicing
(as a percent of the value of exports)
Descriptive statistics Mean absolute value (by decade)
Min. Max. St. dev 48-^9 50-59 60-69 70-79 80-^89 90-01 70-01
World
North Africa
CFA
Rest of Africa
Middle East and
Turkey
Developing Asia
and Pacific
Industrialized Asia
Caribbean
Central and South America
Central and
Eastern Europe Western Europe North America
7.0 39.8 8.4
2.5 59.9 10.3
12.6 48.3 8.4
16.3 201.9 33.5
9.1 45.4
12.0 49.6
9.6
9.5 79.1 16.9
3.7 18.2 3.3
9.7 136.0 33.2
8.2
2.5 50.0 18.3
2.4 16.9 3.0
0.6 22.6 5.9
12.8 10.9 9.9
11.2 14.2 13.9
14.1
4.6 10.4
9.4
10.0
3.8
24.7
7.2
28.5
23.4
22.1
8.3
21.7
23.4
26.0
16.1
21.5
53.6
31.4 14.9
14.6 12.0
30.8 48.9
24.1
10.3
60.0
46.6 15.4 11.6 7.6 16.0 11.4
7.4
7.7
4.8
24.4
10.9
23.8
34.1
30.7 16.7 17.4 21.5
23.5
12.2
47.0
26.1 36.0 30.4 30.8
22.1
8.9 10.4
Monthly average parallel market premium
(excluding freely falling episodes, in percent)
Descriptive statistics Average (by decade)
Min. Max. St. dev 46-^9 50-59 60-69 70-79 80-89 90-98 46-98
World
North Africa
CFA
Rest of Africa Middle East and
Turkey
Developing Asia
and Pacific
Industrialized Asia
Caribbean
Central and South
America
Western Europe North America
11.6 205.9 35.4 137.8
-1.2 164.8 41.4
-6.4 12.7 2.7
1.7 322.5 73.9 31.9
56.7
9.9
6.9
38.1 31.3 57.8 52.6 54.1
35.7 30.7 108.6 62.0 53.6
0.0 1.2 1.8 0.9
33.7 113.7 112.7 107.7 71.0
5.1 493.1 99.6 54.6 81.0 26.0 21.4 146.5 193.2 88.6
-3.7 660.1 95.0 143.5 60.9 168.9 44.7 43.1 12.1 72.9
-6.9 815.9 107.6 324.4 43.0 12.0 3.6 1.3 1.5 36.1
-23.8 300.0 42.8 . 29.6 30.2 56.8 53.6 42.3
3.0 716.1 78.5 49.1 133.0 16.4 18.6
-5.6 347.5 48.6 165.5 17.0 1.2 2.0
-4.3 49.7 3.3 7.2 0.5 0.0 1.1
74.8 8.4 51.0
1.7 1.2 16.9
1.4 1.6 1.3
Sources: International Monetary Fund, Direction of Trade Statistics, International Financial Statistics, Pick's Currency Yearbook, World Currency Report, Pick's Black Market Yearbook, and authors' calculations.
To calculate export misinvoicing, letX^? =
imports from country i, as reported by the rest of the world (CIF basis), X?
= exports to the world as reported by country i, Z = imports CIF basis/imports COB basis,
then export misinvoicing = {Xy^lZ)
- Xt. The averages reported are absolute values as a percent of the value
of total exports. The parallel premium is defined as 100 X [(P -
0)/0)], where P and O are the parallel and official rates, respectively. The averages for the parallel premium are calculated for all the countries in our sample in each region, as such, it includes countries where rates are unified and the premium is zero or nil.

EXCHANGE RATE ARRANGEMENTS 13
CFA Franc Zone. It is also noteworthy that, although low by the
standards of other regions, the export misinvoicing average in
1970-2001 for Western Europe is half of what it was in 1948
1949. Yet these regional averages may understate the importance of misinvoicing in some countries. For example, the maximum
value for 1948-2001 for Western Europe (16.9 percent) does not
reflect the fact that for Spain misinvoicing as a percent of the
value of exports amounted to 36 percent in 1950, a comparable value to what we see in some of the developing regions.
As to the regional average parallel market premium shown
in the bottom panel of Table III, all regions fall squarely in the
Moderate-to-High range (with the exception of North America, Western Europe, and CFA Africa). In the case of developing Asia,
the averages are significantly raised by Myanmar and Laos. It is
worth noting the averages for Europe and industrialized Asia in
the 1940s are comparable and even higher than those recorded
for many developing countries, highlighting the importance of
acknowledging and accounting for dual markets during this
period. To sum, in this section we have presented evidence that leads
us to conclude that parallel markets were both important as
indicators of monetary policy and as representative of the prices
underlying an important share of economic transactions. It is
therefore quite reasonable to draw heavily on the dual or parallel market data in classifying exchange rate regimes, the task to which we now turn.
III. The "Natural" Classification Code: A Guide
We would describe our classification scheme as a "Natural"
system that relies on a broad variety of descriptive statistics and
chronologies to group episodes into a much finer grid of regimes, rather than the three or four buckets of other recent classification
strategies.13 The two most important new pieces of information we bring to bear are our extensive data on market-determined dual or parallel exchange rates and detailed country chronologies. The data, its sources, and country coverage are described along with the chronologies that map the history of exchange rate
arrangements for each country in the detailed background mate
13. In biology, a natural taxonomic scheme relies on the characteristics of a
species to group them.
14 QUARTERLY JOURNAL OF ECONOMICS
rial to this paper. To verify and classify regimes, we also rely on a variety of descriptive statistics based on exchange rate and
inflation data from 1946 onwards; the Appendix describes these.
III.A. The Algorithm
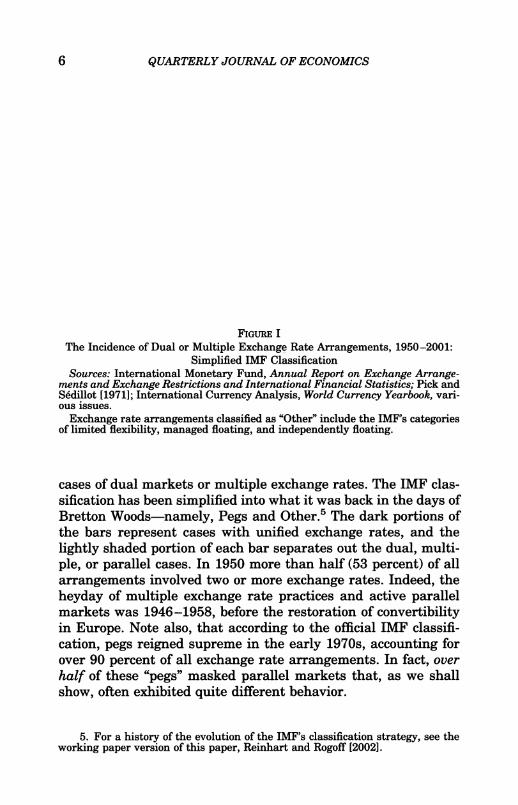
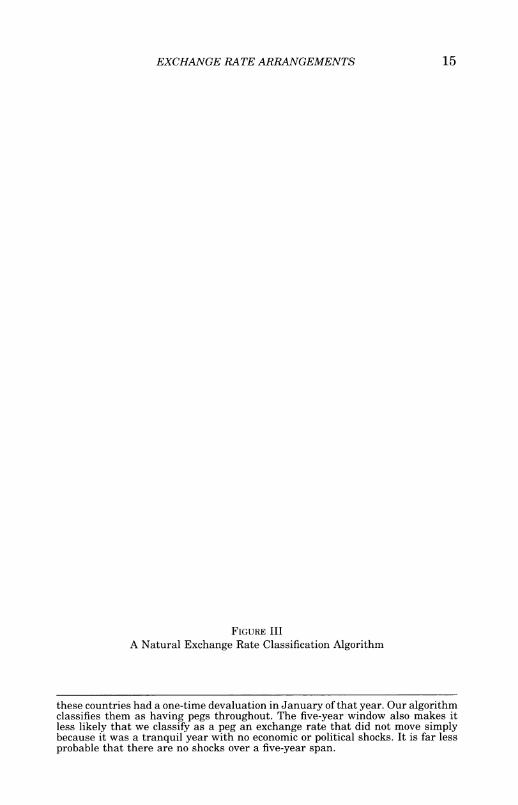
Figure III is a schematic summarizing our Natural Classifi
cation algorithm. First, we use the chronologies to sort out for
separate treatment countries with either official dual or multiple rates or active parallel (black) markets.14 Second, if there is no
dual or parallel market, we check to see if there is an official
preannounced arrangement, such as a peg or band. If there is, we
examine summary statistics to verify the announced regime, go
ing forward from the date of the announcement. If the regime is
verified (i.e., exchange rate behavior accords with the prean nounced policy), it is then classified accordingly as a peg, crawling peg, etc. If the announcement fails verification (by far the most common outcome), we then seek a de facto statistical classifica
tion using the algorithm described below, and discussed in
greater detail in the Appendix. Third, if there is no preannounced path for the exchange
rate, or if the announced regime cannot be verified by the data
and the twelve-month rate of inflation is below 40 percent, we
classify the regime by evaluating exchange rate behavior. As
regards which exchange rate is used, we consider a variety of
potential anchor currencies including the US dollar, deutsche
mark, euro, French franc, UK pound, yen, Australian dollar, Italian lira, SDR, South African rand, and the Indian rupee. A
reading of the country chronologies makes plain that the relevant
anchor currency varies not only across countries but sometimes
within a country over time. (For example, many former British
colonies switched from pegging to the UK pound to pegging to the
US dollar.) Our volatility measure is based on a five-year moving window
(see the Appendix for details), so that the monthly exchange rate
behavior may be viewed as part of a larger, continuous, regime.15
14. See background material posted at http://www.puafumd.edu/faculty/ papers I reinhart I reinhart, htm.
15. If the classification is based on exchange rate behavior in a particular year, it is more likely that one-time events (such as a one-time devaluation and
repeg) or an economic or political shock leads to labeling the year as a change in
regime, when in effect there is no change. For example, Levy-Yeyati and Stur
zenegger [2002], who classify regimes one year at a time (with no memory), classified all CFA zone countries as having an intermediate regime in 1994, when
EXCHANGE RATE ARRANGEMENTS 15
From Chronologies: Are There Dual or Multiple Rates, or a Parallel Market?
Unified rate Dual/Multiple or
Parallel rates
From Chronologies: Is there an official announcement ?
Statistically classify regime
using market determined
exchange rates
Kt}??
PASS: Announcement Confirmed
If (12-month Infiation>40%)
If(12-month Infiation<40%)
Classified as De Facto:
Freely falling
Classified as De Jure:
No legal tender Crawling peg
Currency board/Peg Crawling band
Peg Moving band
Band I Managed float I
Freely floating
If (Monthly Inflation > 50%)
Hyperfloat
Peg
Band
Crawling peg
Crawling band
Moving band
Managed float
Freely floating
Figure III
A Natural Exchange Rate Classification Algorithm
these countries had a one-time devaluation in January ofthat year. Our algorithm classifies them as having pegs throughout. The five-year window also makes it less likely that we classify as a peg an exchange rate that did not move simply because it was a tranquil year with no economic or political shocks. It is far less
probable that there are no shocks over a five-year span.

16 QUARTERLY JOURNAL OF ECONOMICS
We also examined the graphical evidence as a check on the
classification. In practice, the main reason for doing so is to
separate pegs from crawling pegs or bands and to sort the latter
into crawling and noncrawling bands.
Fourth, as we have already stressed, a straightforward but fundamental departure from all previous classification schemes is
that we create a new separate category for countries whose
twelve-month rate of inflation is above 40 percent. These cases
are labeled "freely falling."16 If the country is in a hyperinflation
(according to the classic Cagan [1956] definition of 50 percent or
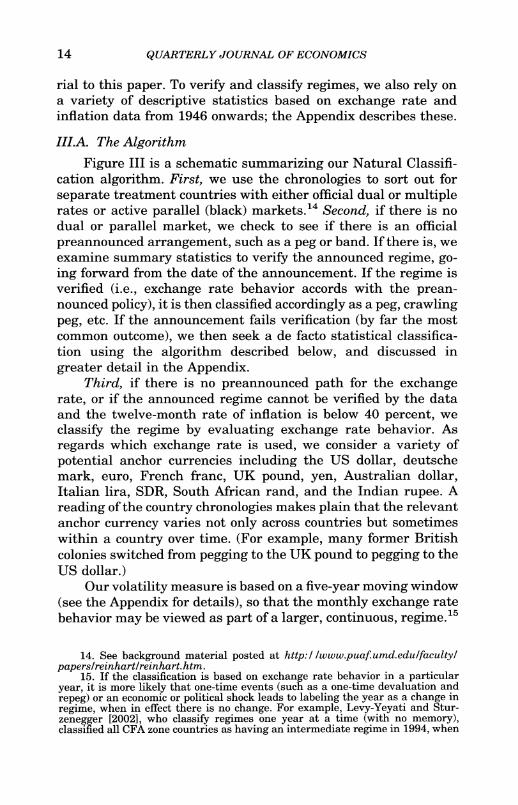
more monthly inflation), we categorize the exchange rate regime as a "hyperfloat," a subspecies of freely falling. In Figure IV, bilateral exchange rates versus the US dollar are plotted for two
countries that have been classified by the IMF (and all previous classification efforts) as floating over much of the postwar pe riod?Canada and Argentina.17 To us, lumping the Canadian
float with that of Argentina during its hyperinflation seems, at a
minimum, misleading. As Figure IV illustrates, floating regimes look rather different from freely falling regimes?witness the
orders of magnitude difference in the scales between Canada (top of page) and Argentina (bottom). This difference is highlighted in
the middle panel, which plots the Canadian dollar-US dollar
exchange rate against Argentina's scale; from this perspective, it
looks like a fixed rate! The exchange rate histories of other coun
tries that experienced chronic high inflation bouts?even if these
did not reach the hyperinflation stage?look more similar to Ar
gentina in Figure IV than to Canada.18 In our view, regimes associated with an utter lack of monetary control and the atten
dant very high inflation should not be automatically lumped under the same exchange rate arrangement as low inflation float
ing regimes. On these grounds, freely falling needs to be treated as a separate category, much in the same way that Highly In
debted Poorest Countries (HIPC) are treated as a separate "type" of debtor.
16. In the exceptional cases (usually the beginning of an inflation stabiliza tion plan) where, despite inflation over 40 percent, the market rate nevertheless follows a confirmed, preannounced band or crawl, the preannounced regime takes
precedence. 17. For Argentina, this of course refers to the period before the Convertibility
Plan is introduced in April 1991 and for Canada the post-1962 period. 18. Two-panel figures, such as that shown for Chile (Figure V), for each
country in the sample are found in the background material alongside the coun
try-specific chronologies.

EXCHANGE RATE ARRANGEMENTS 17
M 0.4
Canada (1): Log of Market-Determined Exchange Rate
January 1946-December 1998
1946 1950 1954 1958 1962 1966 1970 1974 1978 1981 1986 1990 1994 1998
Canada (2): Log of Market-Determined Exchange Rate in Argentina's Scale
January 1946-December 1998
-5
-10
-15
-20
-25
-30
1946 1950 1954 1958 1962 1966 1970 1974 1978 1981 1986 1990 1994 1998
g -15
I -20
? -25 -
-30
Argentina: Log of Market-Determined Exchange Rate
January 1946-December 1998
1946 1950 1954 1958 1962 1966 1970 1974 1978 1981 1986 1990 1994 1998
Figure IV
The Essential Distinction between Freely Floating and Falling Sources: Pick and S?dillot [1971]; International Currency Analysis, World Cur
rency Yearbook, various issues.

18 QUARTERLY JOURNAL OF ECONOMICS
In step 5 we take up those residual regimes that were not
classified in steps 1 through 4. These regimes become candidates
for "managed" or "freely" floating.19 To distinguish between the
two, we perform some simple tests (see the Appendix) that look at
the likelihood the exchange rate will move within a narrow range, as well as the mean absolute value of exchange rate changes.
When there are dual or parallel markets and the parallel market
premium is consistently 10 percent or higher, we apply steps 1
through 5 to our data on parallel exchange rates and reclassify
accordingly, though in our finer grid.20
III.B. Using the Chronologies
The 153 individual country chronologies are also a central
point of departure from all previous efforts to classify regimes. In
the first instance the data are constructed by culling information
from annual issues of various secondary sources, including Pick's
Currency Yearbook, World Currency Yearbook, Pick's Black Mar
ket Yearbook, International Financial Statistics, the IMF's An
nual Report on Exchange Rate Arrangements and Exchange Re
strictions, and the United Nations Yearbook. Constructing our
data set required us to sort and interpret information for every
year from every publication above. Importantly, we draw on na
tional sources to investigate apparent data errors or inconsisten
cies. More generally, we rely on the broader economics literature
to include pertinent information, such as the distribution of
transactions among official and parallel markets.21
The chronologies allow us to date dual or multiple exchange rate episodes, as well as to differentiate between preannounced
pegs, crawling pegs, and bands from their de facto counterparts. We think it is important to distinguish between, say, de facto pegs
or bands from announced pegs or bands, because their properties are potentially different.22 At the very least, we want to provide future researchers with the data needed to ask a variety of
questions about the role of exchange rate arrangements. The
19. Our classification of "freely floating" is the analogue of "independently floating" in the official classification.
20. When the parallel market premium is consistently (i.e., all observations within the five-year window) in single digits, we find that in nearly all these cases
the official and parallel rates yield the same classification. 21. See Marion [1994], for instance. 22. Policy-makers may not be indifferent between the two. In theory, at least,
announcements of pegs, bands, and so on can act as a coordinating device which,
by virtue of being more transparent, could invite speculative attacks.

EXCHANGE RATE ARRANGEMENTS 19
chronologies also flag the dates for important turning points, such
as when the exchange rate first floated, or when the anchor
currency was changed.
Table IV gives an example of one of our 153 chronologies (see
background material) for the case of Chile. The first column gives critical dates. Note that we extend our chronologies as far back as
possible (even though we can only classify from 1946 onwards); in
the case of Chile we go back to 1932.
The second column lists how the arrangement is classified.
Primary classification refers to the classification according to our
Natural algorithm, which may or may not correspond to the
official IMF classification (shown in parentheses in the second
column of Table IV). Secondary and tertiary classifications are
meant only to provide supplemental information, as appropriate.
So, for example, from November 1952 until April 1956, Chile's
inflation was above 40 percent, and hence, its primary classifica
tion is freely falling?that is, the only classification that matters
for the purposes of the Natural algorithm. For those interested in
additional detail, however, we also note in that column that the
market-determined exchange rate was a managed float along the
lines described in detail in the Appendix (secondary) and that,
furthermore, Chile had multiple exchange rates (tertiary). This
additional information may be useful, for example, for research ers who are not interested in treating the high inflation cases
separately (as we have done here). In this case, they would have sufficient information to place Chile in the 1952-1956 period in
the managed float category. Alternatively, for those researchers
who wish to treat dual or multiple exchange rate practices as a
separate category altogether (say, because these arrangements
usually involve capital controls), the second column (under sec
ondary or tertiary classification) provides the relevant informa
tion to do that sorting accordingly. As one can see, although Chile unified rates on September
1999, it previously had some form of dual or multiple rates
throughout most of its history. In these circumstances, we reit
erate that our classification algorithm relies on the market-de
termined, rather than the official exchange rate.23 Over some
23. The other Chronologies do not contain this information, but the annual official IMF classification for the countries in the sample is posted at http:/1 www.puaf.umd.edu/faculty/paperslreinhart/reinhart.htm.

TABLE IV A Sample Chronology in the Natural Classification Scheme: Chile, 1932-2001
to o
Date
Classification primary/secondary/tertiary (official IMF classification in parentheses) Comments
September 16,1925-April 20,1932
April 20,1932-1937
1937-February 1946
March 1946-May 1947
June 1947-October 1952
November 1952-April 16,1956
April 16,1956-August 1957
September 1957-June 1958
July 1958-January 1,1960
January 1,1960-January 15,1962
January 15,1962-November 1964
December 1964-June 1971
July 197 Wune 29,1976
June 29,1976-January 1978
February 1978-June 1978
July 1978-June 30,1979 June 30,1979-June 15,1982 June 15,1982-December 1982
January 1983-December 8,1984
Peg
Dual market
Managed floatin^Multiple rates
Freely falling/Managed floating/Multiple rates
Managed floating/Multiple rates
Freely falling/Managed floating/Multiple rates
Freely falling/Managed floating/Dual market
Managed floating/Dual market
Freely falling/Managed floating/Dual market
Peg to US dollar
Freely falling/Managed floating/Multiple rates
Managed floatingftlultiple rates (Peg)
Freely falling/Multiple exchange rates (Peg through
1973-managed floating afterwards)
Freely falling/Crawling peg to US dollar (Managed
floating) Preannounced crawling peg to US dollar/Freely falling
(Managed floating) Preannounced crawling peg to US dollar (Peg)
Peg to US dollar (Peg)
Freely falling/Managed floating/Dual market
Managed floating/Dual market (Managed floating)
Gold standard. Foreign exchange controls are introduced on
July 30,1931. Pound Sterling is reference currency. Suspension of gold
standard.
US dollar becomes the reference currency.
Rate structure is simplified, and a dual market is created.
The escudo replaces the peso.
Freely falling since April 1962.
On September 29,1975, the peso replaced the escudo.
October 1973 classifies as a hyperfloat.
The Tablita Plan.
The Tablita Plan.
The second phase of the Tablita Plan.
Parallel market premium reaches 102 percent in early 1983. On March 1983 the intention to follow a PPP rule
was announced.
?
i
5 ta
o
s

TABLE IV (continued)
Date
Classification primary/secondary/tertiary (official IMF classification in parentheses) Comments
December 8,1984-January 1988
February 1988-Januaiy 1, 1989
January 1,1989-January 22,1992
January 22, 1992-January 20,1997
January 20,1997-June 25,1998
June 25,1998-September 16,1998
September 16,1998-December 22,1998
December 22,1998-^September 2,1999
September 2,1999-December 2001
Managed floatingflDual market (Managed floating)
De facto crawling band around US dollar/Dual market
(Managed floating)
Preannounced crawling band around US dollar/Dual
market (Managed floating) De facto crawling band around US dollar/Dual market
(Managed floating)
De facto crawling band to US dollar/Dual market
(Managed floating) Preannounced crawling band to US dollar/Dual market
(Managed floating) Preannounced crawling band to US dollar/Dual market
(Managed floating) Preannounced crawling band to US dollar/Dual market
(Managed floating)
Managed floating (independently floating)
PPP rule. The official rate is kept within a ?2% crawling band to US dollar.
PPP rule. ?5% band. Official preannounced ?3% crawling band to US dollar. While the official rate remains within
the preannounced band, parallel market premium remain in double digits.
PPP rule. Band width is ?5%.
PPP rule. Band is ?5%. There is an official preannounced ?10% crawling band to US dollar. Parallel premium falls
below 15 percent and into single digits. Official preannounced crawling ?12.5% band to US dollar;
de facto band is ?5%.
?2.75% band.
?3.5% band.
?8% band.
Rates are unified.
t?
S3
i
Reference currency is the US dollar. Data availability: Official rate, 1900:1-2001:12. Parallel rate, 1946:1-1998:12.
to

22 QUARTERLY JOURNAL OF ECONOMICS
periods the discrepancy between the official and parallel rate,
however, proved to be small. For example, from January 1992
onwards the parallel market premium remained in single digits, and our algorithm shows that it makes little difference whether
the official or parallel rate is used. In these instances, we leave
the notation in the second column that there are dual rates (for information purposes), but also note in the third column that the
premium is in single digits. As noted, Chile has also experienced several periods where the twelve-month monthly inflation ex
ceeded 40 percent. Our algorithm automatically categorizes these
as freely falling exchange rate regimes?unless there is a prean nounced peg, crawling peg, or narrow band that is verified, as was
the case when the Tablita program was introduced on February 1978.
The third column in our chronology gives further sundry information on the regime?e.g., the width of the announced and
de facto bands, etc. For Chile, which followed a crawling band
policy over many subperiods, it is particularly interesting to note
the changes over time in the width of the bands. The third column
also includes information about developments in the parallel market premium and currency reform. As an example of the
former, we note that since 1992 the parallel premium slipped into
single digits; an example of the latter is given for Chile when the
peso replaced the escudo in 1975.
The top panel of Figure V plots the path of the official and
market-determined exchange rate for Chile from 1946. It is evi
dent that through much of the period shown the arrangement was one of a crawling peg or a crawling band, with the rate of
crawl varying through time and notably slowing as inflation
began to stabilize following the Tablita plan of the early 1980s.
The bottom panel plots the parallel market premium (in percent). This pattern is representative of many other countries in our
sample; the premium skyrockets in the periods of economic and
political instability, declines into single digits as credible policies are put in place and capital controls are eased. As we will discuss
in the next section, the Chilean case is also illustrative, in that
crawling pegs or bands are quite common. Figure VI, which
shows the path of the exchange rate for the Philippines, India, and Greece, provides other examples of the plethora of crawling
pegs or bands in our sample.

EXCHANGE RATE ARRANGEMENTS 23
Official and Market-determined Exchange Rates
1946 1950 1954 1958 1962 1966 1970 1974 1978 1982 1986 1990 1994 1998
Monthly Parallel Market Premium
800
1946 1950 1954 1958 1962 1966 1970 1974 1978 1982 1986 1990 1994 1998
Figure V
Chile: Official and Market-Determined Exchange Rates and the Parallel Market Premium
January 1946-December 1998
Sources: International Monetary Fund, Annual Report on Exchange Arrangements and Exchange Restrictions and International Financial Statistics; Pick and S?dillot
[1971]; International Currency Analysis, World Currency Yearbook, various issues.

24 QUARTERLY JOURNAL OF ECONOMICS
I40 I 3.5
D 3.0 ?
? 2.0
I" I 1.0
J 0.5
Philippines: Log of Market-Determined Exchange Rate
August 1949-December 1998
yu^-A^ 1949 1953 1957 1961 1965 1969 1973 1977 1981 1985 1989 1993 1997
India: Log of Market-Determined Exchange Rate
January 1946-December 1998
1946 1950 1954 1958 1962 1966 1970 1974 1978 1981 1986 1990 1994 1998
& 6.0
Greece: Log of Market-Determined Exchange Rate
January 1954-December 1998
1954 1958 1962 1966 1970 1974 1978 1981 1986 1990 1994 1998
Figure VI
The Prevalence of Crawling Pegs and Bands
Sources: Pick and S?dillot [1971]; International Currency Analysis, World Cur
rency Yearbook, various issues.
EXCHANGE RATE ARRANGEMENTS 25
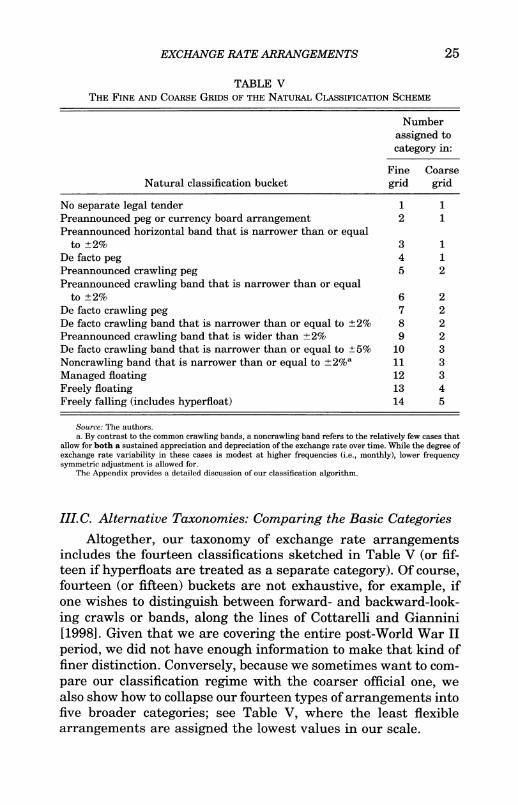
TABLE V The Fine and Coarse Grids of the Natural Classification Scheme
Natural classification bucket
Number
assigned to
category in:
Fine Coarse
grid grid
No separate legal tender 1 1
Preannounced peg or currency board arrangement 2 1
Preannounced horizontal band that is narrower than or equal to ?2% 3 1
De facto peg 4 1
Preannounced crawling peg 5 2
Preannounced crawling band that is narrower than or equal to ?2% 6 2
De facto crawling peg 7 2
De facto crawling band that is narrower than or equal to ?2% 8 2
Preannounced crawling band that is wider than ?2% 9 2
De facto crawling band that is narrower than or equal to ?5% 10 3
Noncrawling band that is narrower than or equal to ?2%a 11 3
Managed floating 12 3
Freely floating 13 4
Freely falling (includes hyperfloat) 14 5
Source: The authors. a. By contrast to the common crawling bands, a noncrawling band refers to the relatively few cases that
allow for both a sustained appreciation and depreciation of the exchange rate over time. While the degree of exchange rate variability in these cases is modest at higher frequencies (i.e., monthly), lower frequency symmetric adjustment is allowed for.
The Appendix provides a detailed discussion of our classification algorithm.
III.C. Alternative Taxonomies: Comparing the Basic Categories
Altogether, our taxonomy of exchange rate arrangements includes the fourteen classifications sketched in Table V (or fif teen if hyperfloats are treated as a separate category). Of course, fourteen (or fifteen) buckets are not exhaustive, for example, if one wishes to distinguish between forward- and backward-look
ing crawls or bands, along the lines of Cottarelli and Giannini
[1998]. Given that we are covering the entire post-World War II
period, we did not have enough information to make that kind of finer distinction. Conversely, because we sometimes want to com
pare our classification regime with the coarser official one, we
also show how to collapse our fourteen types of arrangements into five broader categories; see Table V, where the least flexible
arrangements are assigned the lowest values in our scale.

26 QUARTERLY JOURNAL OF ECONOMICS
In the finer grid, we distinguish between preannounced pol icies and the less transparent de facto regimes. Since the former involve an explicit announcement while the latter leave it to
financial market analysts to determine the implicit exchange rate
policy, in the finer classification we treat preannouncement as
less flexible than de facto. We accordingly assign it a lower num
ber in our scale. Those not interested in testing whether an
nouncements serve as a coordinating device (say, to make a
speculative attack more likely) and only interested in sorting out
the degree of observed exchange rate flexibility will prefer the coarser grid. However, even in the coarse grid, it is imperative to treat freely falling as a separate category.
IV. The "Natural" Taxonomy: Critiques and Comparisons
As the previous section described, our classification strategy relies importantly on the observed behavior of the market-deter
mined exchange rate. In this section we first address some poten tial critiques of our approach, including whether a country's in
ternational reserve behavior should affect its classification, and
whether we may be mislabeling some regimes as pegs or crawls
simply due to the absence of shocks. We then proceed to compare our results with the "official history," and provide examples of
how our reclassification may reshape some of the existing evi
dence on the links between exchange rate arrangements and
various facets of economic activity.
TV.A. The Trilogy: Exchange Rates, Monetary Policy, and
Capital Controls
To capture the nuances of any exchange rate arrangement, one might also want information on the presence and effective
ness of capital controls, the modalities of (sterilized or unsteril
ized) foreign exchange intervention, and the extent to which
interest rates (or other less conventional types of intervention) are used as a means to stabilize the exchange rate. Since, for the
purposes of universality, our classification rests squarely on the
univariate time series behavior of the nominal exchange rates
(combined with historical chronologies), in this subsection we
address some of these limitations to our approach. Some studies have reclassified exchange rate arrangements
by also factoring in the behavior of foreign exchange reserves as

EXCHANGE RATE ARRANGEMENTS 27
reported by the IMF's International Financial Statistics.24 How
ever, as Calvo and Reinhart [2002] note, using reserves has
serious limitations. In Brazil and in over two dozen other coun
tries, foreign exchange market intervention is frequently done
through purchases and sales of domestic dollar-linked debt.25 This debt is not reflected in the widely used IFS reserve data, neither were the massive interventions of the Thai authorities in
the forward market during 1997 and in South Africa thereafter.
Furthermore, as financial liberalization has spread throughout the globe, there has been a widespread switch from direct inter vention in the foreign exchange market to the use of interest rate
policy in the 1990s as a means to stabilize the exchange rate.26
Picking up on this kind of policy intervention requires having the
policy interest rate?the equivalent of the federal funds rate for the United States?for each country. Such data are very difficult to come by, and none of the other efforts at reclassification have
dealt with issue.
Other issues arise in the context of the links between mone
tary, capital controls, and exchange rate policy. In particular, while fixing the exchange rate (or having narrow bands, or crawl
ing pegs, or bands) largely defines monetary policy, our two most
flexible arrangement categories (managed or freely floating) do not. Floating could be consistent with monetary targets, interest rate targets, or inflation targeting, the latter being a relatively recent phenomenon.27 Since our study dates back to 1946, it
spans a sea change in capital controls and monetary policy re
gimes, and it is beyond the scope of this paper to subdivide the
monetary policy framework for the most flexible arrangements in
24. For instance, the algorithm used by Levy-Yeyati and Sturzenegger [2002] also uses (besides the exchange rate) reserves and base money. This gives rise to
many cases of what they refer to as "one classification variable not available." This means that their algorithm cannot provide a classification for the United Kingdom
(where it is hard to imagine such data problems) until 1987 and?in the most extreme of cases?some developing countries cannot be classified for any year over their 1974-2000 sample.
25. See Reinhart, Rogoff, and Savastano [2003] for a recent compilation of data on domestic dollar-linked debt.
26. There are plenty of recent examples where interest rates were jacked up aggressively to fend off a sharp depreciation in the currency. Perhaps one of the
more obvious examples is in the wake of the Russian default in August 1998, when many emerging market currencies came under pressure and countries like Mexico
responded by doubling interest rates (raising them to 40 percent) within a span of a couple of weeks.
27. Indeed, several of the inflation targeters in our sample (United Kingdom, Canada, Sweden, etc.) are classified as managed floaters. (However, it must also be acknowledged that there are many different variants of inflation targeting, especially in emerging markets.)

28 QUARTERLY JOURNAL OF ECONOMICS
our grid. Apart from exchange rate policy, however, our study sheds considerable light on the third leg of the trinity?capital controls. While measuring capital mobility has not been the goal of this paper, our data consistently show that the parallel market
premium dwindles into insignificance with capital market inte
gration, providing a promising continuous measure of capital
mobility.
IV.B. Exchange Rates and Real Shocks
Ideally, one would like to distinguish between exchange rate
stability arising from deliberate policy actions (whether its direct
foreign exchange market intervention or interest rate policy, as
discussed) and stability owing to the absence of economic or
political shocks. In this subsection we provide evidence that, if the
exchange rate is stable and it is accordingly treated in our de jure
approach to classification, it is typically not due to an absence of
shocks.
Terms of trade shocks are a natural source of potential
shocks, particularly for many developing countries. Similarly, the
presence (or absence) of shocks is likely to be reflected in the
volatility of real GDP. To investigate the incidence and size of
terms of trade shocks, we constructed monthly terms of trade
series for 172 countries over the period 1960-2001.28 The terms
of trade series is a geometric weighted average of commodity
prices (fixed weights based on the exports of 52 commodities). Table VI presents a summary by region of the individual
country findings. The first column shows the share of commodi
ties in total exports, while a Atot denotes the variance of the
monthly change in the terms of trade of the particular region relative to Australia. Australia is our benchmark, as it is both a
country that is a primary commodity exporter and has a floating
exchange rate that, by some estimates, approximates an optimal
response to terms of trade shocks (see Chen and Rogoff [2003]).
The next three columns show the variance of the monthly change in the terms of trade of the region relative to Australia (a Atot),
exchange rate of the individual region relative to Australia (a Ae)
and the variance of the annual change in real GDP of the region relative to Australia (a Ay). The last two columns show the
28. Table VI is based on the more extensive results in Reinhart, Rogoff, and
Spilimbergo [2003].

EXCHANGE RATE ARRANGEMENTS 29
TABLE VI Terms of Trade, Output, and Exchange Rate Variability
Variance Ratios (Normalized to Australia and Excludes Freely
Falling Episodes)
cr cr a Ae cr Ae
Region Share cr Atot Ae Ay cr Atot a Ay
North Africa 0.51 3.29 0.93 2.54 0.64 0.23
Rest of Africa (excluding CFA) 0.56 2.92 2.87 2.50 1.29 1.38
Middle East 0.60 4.15 0.95 3.48 0.33 0.50
Development Asia/Pacific 0.34 2.02 0.85 2.40 0.54 0.44
Industrialized Asia 0.18 0.82 0.97 1.15 1.23 0.86
Caribbean 0.50 4.15 0.67 2.40 0.20 0.35
Central America 0.62 3.02 0.49 2.11 0.21 0.28
South America 0.63 2.03 1.08 2.15 0.66 0.52
Central East Europe 0.24 0.60 1.03 1.51 1.66 0.78
Western Europe 0.18 1.75 0.84 1.25 0.76 0.56
North America 0.33 1.64 0.60 1.12 0.47 0.54
Source: Reinhart, Rogoff, and Spilimbergo [2003] and sources cited therein. The variable definitions are as follows: Share = share of primary commodities to total exports; the next
three columns show the variance of the monthly change in the terms of trade of the region relative to Australia (a Mot), the variance of the monthly change in the exchange rate of the individual region relative to Australia (a Ae), and the variance of the annual change in real GDP of the region relative to Australia (a Ay); the last two columns show the variance of the exchange rate relative to the variance of the terms of trade (cr Ae)/(cr ?tot) and output (ct Ae)/(cr ?y), respectively.
variance of the exchange rate relative to the variance of the terms of trade (a Ae)/(a Atot) and output (a Ae)/(a Av), respectively.
A priori, adverse terms of trade shocks should be associated with depreciations and the converse for positive terms of trade
shocks; greater volatility in the terms of trade should go hand in-hand with greater volatility in the exchange rate. (In Chen and
Rogoff [2003] there is greater volatility even under optimal pol icy.) Table VI reveals several empirical regularities: (a) most countries (regions) have more variable terms of trade than Aus tralia?in some cases, such as the Middle East and the Carib
bean, as much as three or four times as variable; (b) real GDP is also commonly far more volatile than in Australia; (c) most coun
tries' exchange rates appear to be far more stable than Austra
lia's, as evidenced by relatively lower variances for most of the
groups; (d) following from the previous observations, the last two columns show that for most of the country groupings that the variance of exchange rate changes is lower than that of changes in the terms of trade or real GDP. Taken together, the implication of these findings is that if the exchange rate is not moving, it is

30 QUARTERLY JOURNAL OF ECONOMICS
not for lack of shocks. Of course, terms of trade are only one class of shocks that can cause movement in the exchange rate. Thus, considering other kinds of shocks?political and economic, domestic, and international?would only reinforce the results presented here.
TV.C. Fact and Fiction: Natural and Artificial?
We are now prepared to contrast the official view of the
history of exchange rate regimes with the view that emerges from
employing our alternative methodology. To facilitate compari sons, we will focus mainly on the coarse grid version of the
Natural system.
Figure VII highlights some of the key differences between the Natural and IMF classifications. The dark portions of the bars denote the cases where there is overlap between the IMF and the Natural classification.29 The white bar shows the cases where the IMF labels the regime in one way (say, a peg in 1970-1973) and the Natural labels it differently. Finally, the striped portions of the bars indicate the cases where the Natural classification labels the regime in one way (say, freely falling, 1991-2001) and the IMF labels differently (say, freely floating). As shown in Figure
VII, according to our Natural classification system, about 40
percent of all regimes in 1950 were pegs (since many countries had dual/parallel rates that did not qualify as pegs). Figure VII also makes plain that some of the "pegs" in our classification were
not considered pegs under the official classification; in turn, our
algorithm rejects almost half of the official pegs as true pegs. Our reclassification of the early postwar years impacts not only on
developing countries, but on industrialized countries as well;
nearly all the European countries had active parallel markets
after World War II.
A second reason why our scheme shows fewer pegs is that the
IMF's pre-1997 scheme allowed countries to declare their regimes as "pegged to an undisclosed basket of currencies." This notably
nontransparent practice was especially popular during the 1980s, and it was also under this that a great deal of managed floating,
freely floating, and freely falling actually took place. For the period 1974-1990 the official classification has
roughly 60 percent of all regimes as pegs; our classification has
only half as many. Again, as we see in Figure VII, this comparison
29. Specifically, both classifications assigned the regime for a particular country in a given particular year to the same category.

EXCHANGE RATE ARRANGEMENTS 31
? According to Natural but Not IMF
According to IMF but Not Natural
Overlap of IMF and Natural
1950 1970-1973 1974-1990 1991-2001
Figure VII
Comparison of Exchange Rate Arrangements According to the IMF Official and Natural Classifications, 1950-2001
Sources: International Monetary Fund, Annual Report on Exchange Arrange ments and Exchange Restrictions and International Financial Statistics; Pick and S?dillot [1971]; International Currency Analysis, World Currency Yearbook, vari ous issues.
The dark bars show the overlap between the IMF and Natural classification
(i.e., for that particular year the IMF and Natural classifications coincide); the white bars show the cases where the IMF classification labeled the regime in one
way (say, a peg in 1974-1990) and the Natural classification labeled it differently; the striped bars indicate the cases where the Natural classification labeled the
regime in one way (say, freely falling) and the IMF labeled it differently, (say, freely floating).
understates the differences since some of our pegs are not official
pegs and vice versa. For the years 1974-1990, and 1991-2001, one can see two major trends. First, "freely falling" continues to
be a significant category, accounting for 12 percent of all regimes from 1974-1990, and 13 percent of all regimes from 1991-2001.
For the transition economies in the 1990s, over 40 percent of the
observations are in the freely falling category. Of course, what we
are reporting in Figure VII is the incidence of each regime.
Clearly, future research could use GDP weights and?given that

32 QUARTERLY JOURNAL OF ECONOMICS
low-income countries are disproportionately represented in the
freely falling category?this would reveal a lower importance to
this category.30 Second, the Natural classification scheme reveals a bunching
to the middle in terms of exchange rate flexibility, when com
pared with the official monetary history of the world. Limited
flexibility?which under the Natural classification is dominated
by de facto crawling pegs?becomes notably more important. From being a very small class under the official scheme, the
Natural classification algorithm elevates limited flexibility to the
second most important grouping over the past decade, just behind
pegs. Another startling difference is the reduced importance of
freely floating. According to the official classification, more than
30 percent of countries were independently floating during 1991
2001. According to the Natural classification, less than 10 percent were freely floating. This is partly a manifestation of what Calvo
and Reinhart [2002] term "fear of floating," but equally because we assign high inflation floats (including ones that are officially
"pegs") to our new freely falling category. Indeed, more countries
had freely falling exchange rates than had freely floating ex
change rates! The contrast between the IMF and Natural classification
systems becomes even more striking when one sees just how
small the overlap is between the two classifications country by
country and year by year. As shown in Table VII, if the IMF
designation of the regime is a peg (1970-2001), there is a 44
percent probability that our algorithm will place it into a more
flexible arrangement. If the official regime is a float, there is a 31
percent chance we will categorize it as a peg or limited flexibility. If the official regime is a managed float, there is a 53 percent chance our algorithm will categorize it as a peg or limited flexi
bility. Whether the official regime is a float or peg, it is virtually a coin toss whether the Natural algorithm will yield the same
result. The bottom of the table gives the pairwise correlation
between the two classifications, with the official classification
running from 1 (peg) to 4 (independently floating), and the Nat
ural classification running from 1 (peg) to 5 (freely falling). The
simple correlation coefficient is only 0.42. As one can confirm from
30. GDP weights and population weights would, of course, present very different pictures. For example, the United States and Japan alone would increase
the world's share of floaters if it were GDP weights, while weight by population would increase the weight of fixers by China alone.

EXCHANGE RATE ARRANGEMENTS 33
TABLE VII Floating Pegs and Pegged Floats: Revisiting the Past, 1970-2001
In
Conditional probability that the regime is: percent
"Other" according to NCa conditional on being classified "Peg" by IMF 44.5
"Peg" or "Limited Flexibility" according to NC conditional on being classified "Managed Floating" by IMF 53.2
"Peg" or "Limited Flexibility" according to NC conditional on being classified "Independently Floating" by IMF 31.5
Pairwise correlation between IMF and NC classifications 42.0
Sources: The authors' calculations. a. NC refers to the Natural Classification; "Other" according to NC includes limited flexibility, managed
floating, freely floating, and freely falling.
the chronologies, the greatest overlap occurs in the classification of the G3 currencies and of the limited flexibility European ar
rangements. Elsewhere, and especially in developing countries, the two classifications differ significantly, as we shall see.
IV.D. The Pegs That Float
Figure VIII plots the parallel market premium since January 1946, in percent, for Africa, Asia, Europe, and Western Hemisphere.
As is evident from the Figure VIII, for all the regions except Europe, it would be difficult to make the case that the breakdown of Bretton
Woods was a singular event, let alone a sea change.31 For the
developing world, the levels of pre- and post-1973 volatilities in the market-determined exchange rate, as revealed by the parallel mar
ket premium, are remarkably similar. Note that for all regions, we
exclude the freely falling episodes that would significantly increase the volatility but also distort the scale. To give a flavor of the
cross-country variation within region and across time, the dashed line plots the regional average plus one standard deviation (calcu lated across countries and shown as a five-year moving average).
As regards Europe, the story told by Figure VIII is consistent with the characterization of the Bretton Woods system as a period of when true exchange rate stability was remarkably short-lived. From 1946 until the arrival of the late 1950s, while Europe was not floating in the modern sense?as most currencies were not
31. We plot the premium rather than the market-determined rate, as it allows us to aggregate across countries in comparable units (percent).

34 QUARTERLY JOURNAL OF ECONOMICS
Figure VIII
Average Monthly Parallel Market Premium: 1946-1998
Sources: International Monetary Fund, Annual Report on Exchange Arrange ments and Exchange Restrictions and International Financial Statistics; Pick and
S?dillot [1971]; International Currency Analysis, World Currency Yearbook, vari ous issues.
The solid line represents the average monthly parallel market premium while the dashed line shows the five-year moving average of plus one standard devia tion. The regional averages are calculated excluding the freely falling episodes.

EXCHANGE RATE ARRANGEMENTS 35
convertible?it had some variant of de facto floating under the
guise of pegged official exchange rates. Each time official rates are realigned, the story had already unfolded in the parallel
market (as shown earlier in Figure II). While the volatility of the
gap between the official rate and the market exchange rate is not
quite in the order of magnitude observed in the developing world, the volatility of the parallel rate is quite similar to the volatility of today's managed or freely floating exchange rates.32
There are many cases that illustrate clearly that little
changed before and after the breakup of Bretton Woods.33
Clearly, more careful statistical testing is required to make cate
gorical statements about when a structural break took place; but it is obvious from the figures that whatever break might have taken place hardly lives up to the usual image of the move from
fixed to flexible rates.
IV.E. The Floats That Peg
Figure IX provides a general flavor of how exchange rate
flexibility has evolved over time and across regions. The figure plots five-year moving averages of the probability that the
monthly percent change in the exchange rate remains within a 2
percent band for Africa, Asia, Europe, and Western Hemisphere (excluding only the United States). Hence, under a pegged ar
rangement, assuming no adjustments to the parity, these proba bilities should equal 100 percent. As before, we exclude the freely falling episodes. For comparison purposes, the figures plot the
unweighted regional averages against the unweighted averages for the "committed floaters." (The committed floaters include the
following exchange rates against the dollar: Yen, DM (euro), Australian dollar, and the UK pound.) The dashed lines, which show plus/minus one standard deviation around the regional averages, highlight the differences between the group of floaters and the regional averages.
It is evident for all regions (this applies the least to Africa) that the monthly percent variation in the exchange rate has
32. See Bordo [1993] on Bretton Woods and Bordo [2003] on a historical
perspective on the evolution of exchange rate arrangements. 33. The country-by-country figures in "The Country Chronologies and Chart
book, Background Material to A Modern History of Exchange Rate Arrangements: A Reinterpretation" at http://www.puaf.umd.edu/faculty/papers/reinhart/ reinhart.htm are particularly revealing in this regard.

36 QUARTERLY JOURNAL OF ECONOMICS
Figure IX
Absolute Monthly Percent Change in the Exchange Rate: Percent of Observations within a ?2 Percent Band {five-year moving average)
Sources: International Monetary Fund, Annual Report on Exchange Arrange ments and Exchange Restrictions and International Financial Statistics; Pick and S?dillot [1971]; International Currency Analysis, World Currency Yearbook, vari ous issues.
The solid line represents the average for the group while the dashed lines show
plus/minus one standard deviation. The regional averages are calculated exclud
ing the freely falling episodes.

EXCHANGE RATE ARRANGEMENTS 37
typically been kept to a minimum?there is a great deal of
smoothing of exchange rate fluctuations in all regions when com
pared with the usual monthly variations of the committed float ers. The smoothing is most evident in Asia where the index
hovers around 90 percent for most of the period, versus 60-70
percent for the floaters. Hence, over time, the nature of the classification problem has evolved from labeling something as a
peg when it is not, to labeling something as floating when the
degree of exchange rate flexibility has in fact been very limited.
rV.F. Does the Exchange Rate Regime Matter?
The question of whether the exchange rate arrangement matters for various facets of economic activity has, indeed, been a
far-reaching issue over the years in the literature on interna tional trade and finance, and is beyond the scope of this paper. In this subsection we present a few simple exercises that do not
speak to possible causal patterns between exchange rate regimes and economic performance, but are meant as illustrative of the
potential usefulness of our classification. First, consider Table
VIII, which separates dual/parallel markets from all the other
regimes where the "exchange rate is unitary," to employ the
language of the IMF. The top row shows average inflation rates and real per capita GDP growth for the period 1970-2001 for dual
arrangements separately from all other regimes. This two-way split drastically alters the picture presented by the IMF's classi fication in the top and fourth rows of Table IX, which does not
TABLE VIII Inflation and per Capita Real GDP Growth:
A Comparison of Dual (or Multiple) and Unified Exchange Rate Systems, 1970-2001
Average annual Average per capita
Regime inflation rate real GDP growth
Unified exchange rate 19.8 1.8
Dual (or multiple) exchange rates 162.5 0.8
Sources: International Monetary Fund, Annual Report on Exchange Arrangements and Exchange Re strictions and International Financial Statistics, Pick and S?dillot [1971], International Currency Analysis,
World Currency Yearbook, various issues. The averages for the two regime types (unified and dual) are calculated on a country-by-country and
year-by-year basis. Thus, if a country has a unified exchange rate for most of the year, the observation for that year is included in the averages for unified rates; if in the following year that same country introduces a dual market (or multiple rate) for most of the year, the observation for that year is included in the average for dual rates. This treatment allows us to deal with transitions across regime types over time.

38 QUARTERLY JOURNAL OF ECONOMICS
TABLE IX Do Classifications Matter?
Growth, Inflation, and Trade across Regimes: 1970-2001
Limited Managed Freely Freely Classification scheme Peg flexibility floating floating falling
Average annual inflation rate
IMF Official 38.8 5.3 74.8 173.9 n.a. Natural 15.9 10.1 16.5 9.4 443.3
Average annual per capita real GDP growth IMF Official 1.4 2.2 1.9 0.5 n.a.
Natural 1.9 2.4 1.6 2.3 -2.5 Exports plus imports as a percent of GDP
IMF Official 69.9 81.0 65.8 60.6 n.a. Natural 78.7 80.3 61.2 44.9 57.1
Source: International Monetary Fund, World Economic Outlook. An n.a. denotes not available. The averages for each regime type (peg, limited flexibility, etc.) are
calculated on a country-by-country and year-by-year basis. Thus, if a country has a pegged exchange rate for most of the year, the observation for that year is included in the averages for pegs; if in the following year that same country has a managed float for most of the year, the observation for that year is included in the average for managed floats. This treatment allows us to deal with transitions across regime types over time.
treat dual markets as a separate category. Dual (or multiple) exchange rate episodes are associated with an average inflation rate of 163 percent versus 20 percent for unified exchange mar
kets?growth is one percentage point lower for dual arrange ments. The explanation for this gap between the outcomes shown
in Table VIII and the IMF's in Table IX is twofold. First, 62
percent of the freely falling cases during 1970-2001 were associ
ated with parallel markets or dual or multiple exchange rates.
Second, the high inflation cases classified by the IMF as freely
floating were moved to the freely falling category Natural classi
fication. Again, we caution against overinterpreting the results in
Table VIII as evidence of causality, as exchange controls and dual
markets are often introduced amid political and economic cri ses?as the recent controls in Argentina (2001) and Venezuela
(2003) attest.
As Table IX highlights, according to the IMF, only limited
flexibility cases record moderate inflation. On the other hand,
freely floating cases record the best inflation performance (9
percent) in the Natural classification. Freely falling regimes ex
hibit an average annual inflation rate 443 percent versus an
inflation average in the 9 to 17 percent range for the other
categories (Table IX).

EXCHANGE RATE ARRANGEMENTS 39
16000
14000
12000
10000
1 8 8000
6000
4000
2000
m IMF Official O Natural
a* Limited Flexibility Managed float Freely floating
Figure X
PPP Adjusted GDP per Capita across Regime Types: 1970-2001
(averaging over all regions)
Freely falling
The contrast is also significant both in terms of the level of
per capita GDP (Figure X) and per capita growth (Figure XI and
Table IX). Freely falling has the lowest per capita income (US
$3,476) of any category?highlighting that the earlier parallel to
the HIPC debtor is an apt one?while freely floating has the
highest (US $13,602). In the official IMF classification, limited
flexibility, which was almost entirely comprised of European
countries, shows the largest per capita income.
Growth is negative for the freely falling cases (-2.5 percent) versus growth rates in the 1.6-2.4 percent range for the other
categories. Once freely falling is a separate category, the differ
ences between our other classifications pale relative to the differ
ences between freely falling and all others (Table VIII). In the
official IMF classification, freely floating shows a meager average
growth rate of 0.5 percent for the independently floating cases.
For the Natural classification, the average growth rate quadru
ples for the floaters to 2.3 percent. Clearly, this exercise high
lights the importance of treating the freely falling episodes
separately.

40 QUARTERLY JOURNAL OF ECONOMICS
i &0
MFOffieW ONMnri
ElllllJI
Peg Limited Flexibility Maniged float Freely floating Freely failing
Figure XI Real per Capita GDP Growth across Regime Types: 1970-2001
(averaging over all regions) Sources: International Monetary Fund, Annual Report on Exchange Arrange
ments and Exchange Restrictions and International Financial Statistics; Pick and S?dillot [1971]; International Currency Analysis, World Currency Yearbook, vari ous issues.
The averages for each regime type (peg, limited flexibility, etc.) are calculated on a country-by-country and year-by-year basis. Thus, if a country has a pegged exchange rate for most of the year, the observation for that year is included in the
averages for pegs; if in the following year that same country has a managed float for most of the year, the observation for that year is included in the average for
managed floats. This treatment allows us to deal with transitions across regime types over time.
V. Concluding Remarks
According to our Natural classification, across all countries
for 1970-2001, 45 percent of the observations officially labeled as
a "peg" should, in fact, have been classified as limited flexibility,
managed or freely floating?or worse, "freely falling." Post
Bretton Woods, a new type of misclassification problem emerged, and the odds of being officially labeled a "managed float" when
there was a de facto peg or crawling peg were about 53 percent. We thus find that the official and other histories of exchange
rate arrangements can be profoundly misleading, as a striking number of pegs are much better described as floats, and vice versa.
These misclassification problems may cloud our view of his
tory along some basic dimensions. Using the IMF's classification

EXCHANGE RATE ARRANGEMENTS 41
for the period 1970 to 2001, for instance, one would conclude that a freely floating exchange rate is not a very attractive option?it produces an average annual inflation rate of 174 percent and a
paltry average per capita growth rate of 0.5 percent. This is the
worst performance of any arrangement. Our classification pre sents a very different picture: free floats deliver an average in
flation that is less than 10 percent (the lowest of any exchange rate arrangement), and an average per capita growth rate of 2.3
percent. Equally importantly, we find that unified exchange rate
regimes vastly outperform dual or multiple exchange rate ar
rangements, although one cannot necessarily interpret these dif
ferences as causal. While we have focused in this paper on the
exchange rate arrangement classification issue, the country his
tories and data provided in this paper may well have conse
quences for theory and empirics going forward, especially the issue of accounting for dual an parallel markets.
In her classic history of the IMF de Vries [1969] looked back at the early years of the Bretton Woods regime and noted:
Multiple exchange rates were one of the first problems that faced the
Fund in 1946, and have probably been its most common problem in the
field of exchange rates. An impressive number and diversity of coun
tries in the last twenty years have experimented with one form or
another of what the Fund has called multiple currency practices, at
least for a few if not most of their transactions.. . The problem of
multiple rates, then, never seems entirely at an end.
Thirty-four years have passed since this history was written, and
multiple exchange rate practices are showing no signs of becom
ing pass?. On December 2001 Argentina suspended convertibility and, in so doing, segmented the market for foreign exchange,
while on February 7, 2003, Venezuela introduced strict new ex
change controls?de facto creating a multiple exchange rate sys tem. Some things never change.
Appendix: The Details of the "Natural" Classification
This appendix describes the details of our classification algo rithm, which is outlined in Section III of the paper. We concen trate on the description of the fine grid as shown in Table V.
A. Exchange Rate Flexibility Indices and Probability Analysis
Our judgment about the appropriate exchange rate classifi cation is shaped importantly by the time-series of several mea

42 QUARTERLY JOURNAL OF ECONOMICS
sures of exchange rate variability, based on monthly observations and averaged over two-year and five-year rolling windows. The
first of these measures is the absolute percent change in the
monthly nominal exchange rate. We prefer the mean absolute
change to the variance to minimize the impact of outliers. These outliers arise when, for example, there are long periods in which
the exchange rate is fixed but, nonetheless, subject to rare but
large devaluations.
To assess whether exchange rate changes are kept within a
band, we calculate the probabilities that the exchange rate re
mains within a plus/minus 1,2, and 5 percent-wide band over any
given period. Two percent seems a reasonable cutoff to distin
guish between the limited flexibility cases and more flexible ar
rangements, as even in the Exchange Rate Mechanism arrange ment in Europe ?2 XA bands were allowed. As with the mean
absolute deviation, these probabilities are calculated over two
year and five-year rolling windows. Unless otherwise noted in the
chronologies, we use the five-year rolling windows as our primary measure for the reasons discussed in Section III of the paper. These rolling probabilities are especially useful to detect implicit unannounced pegs and bands.
B. De Jure and de Facto Pegs and Bands
Where the chronologies show the authorities explicitly an
nouncing a peg, we shortcut the de facto dating scheme described
below and zero in on the date announced as the start of the peg. We then confirm (or not) the peg by examining the mean absolute
monthly change over the period following the announcement. The
chronologies we develop, which give the day, month, and year when a peg becomes operative, are essential to our algorithm. There are two circumstances where we need to go beyond simply
verifying the announced peg. The first case is where our chronol
ogies indicate that the peg applies only to an official rate and that
there is an active parallel (official or illegal) market. As shown in
Figure III, in these cases we apply the same battery of tests to the
parallel market exchange rate as we do to the official rate in a
unified market. Second, there are the cases where the official
policy is a peg to an undisclosed basket of currencies. In these
cases, we verify if the "basket" peg is really a de facto peg to a single dominant currency (or to the SDR). If no dominant currency can be
identified, we do not label the episode as a peg. Potentially, of course,

EXCHANGE RATE ARRANGEMENTS 43
we may be missing some de facto basket pegs, though in practice, this is almost certainly not a major issue.
We now describe our approach toward detecting de facto
pegs. If there is no officially announced peg, we test for a "de
facto" peg in two ways. First, we examine the monthly absolute
percent changes. If the absolute monthly percent change in the
exchange rate is equal to zero for four consecutive months or
more, that episode is classified (for however long its lasts) as a de
facto peg if there are no dual or multiple exchange rates. This
allows us to identify short-lived de facto pegs as well as those with a longer duration. For instance, this filter allowed us to identify the Philippines' de facto peg to the US dollar during 1995-1997 in
the run-up to the Asian crisis as well as the numerous European de facto pegs to the DM well ahead of the introduction of the euro.
Second, we compute the probability that the monthly exchange rate change remains within a 1 percent band over a rolling
five-year period:34
P(?< 1%),
where 8 is the monthly absolute percentage change in the ex
change rate. If this probability is 80 percent or higher, then the
regime is classified as a de facto peg or crawling peg over the entire five-year period. If the exchange rate has no drift, it is classified as a fixed parity; if a positive drift is present, it is labeled a crawling peg; and, if the exchange rate also goes through periods of both appreciation and depreciation, it is dubbed a "noncrawling" peg. Our choice of an 80 percent thresh old is not accidental, but rather we chose this value because it
appears to do a very good job at detecting regimes one would want to label as pegs, without drawing in a significant number of "false
positives."
Our approach regarding preannounced and de facto bands follows exactly the same process as that of detecting prean nounced and de facto pegs, we simply replace the ? 1% band with a ?2% band in the algorithm. If a band is announced and the
chronologies show a unified exchange market, we label the epi sode as a band unless it had already been identified as a de facto
peg by the criteria described earlier. But, importantly, we also
verify whether the announced and de facto bands coincide, espe
34. There are a handful of cases where a two-year window is used. In such
instances, it is noted in the chronologies.

44 QUARTERLY JOURNAL OF ECONOMICS
cially as there are numerous cases where the announced (de jure) band is much wider than the de facto band.35 To detect such cases, we calculate the probability that the monthly exchange rate change remains within a ?2% band over a rolling five-year period:
P(?<2%).
If this probability is 80 percent or higher, then the regime is
classified as a de facto narrow horizontal, crawling, or noncrawl
ing band (which allows for both a sustained appreciation and
depreciation) over the period through which it remains continu
ously above the 80 percent threshold. In the case where the preannounced bands are wide (mean
ing equal to or greater than ?5%), we also verify ?5% bands. The
specifics for each case are discussed in the country chronologies. For instance, as shown earlier in Table IV, in the case of Chile we
found that the de facto band during 1992-1998 was narrower
(?5%) than that which was announced at the time (?10% and
?12.5%). In the case of Libya, which had an announced 77 per cent wide band along & fixed central parity pegged to the SDR over
the March 1986-December 2001, we detected a ?5% crawling band to the US dollar.
C. Freely Falling
As we emphasize in the text, there are situations, almost
invariably due to high inflation or hyperinflation, in which there are mega-depreciations in the exchange rate on a routine and
sustained basis. We have argued that it is inappropriate and
misleading to lump these cases?which is what all previous clas
sifications (IMF or otherwise) do?with floating rate regimes. We
label episodes freely falling on the basis of two criteria. First,
periods where the twelve-month rate of inflation equals or ex
ceeds 40 percent are classified as freely falling unless they have
been identified as some form of preannounced peg or prean nounced narrow band by the above criteria.36 The 40 percent
35. Mexico's exchange rate policy prior to the December 1994 crisis is one of numerous examples of this pattern. Despite the fact that the band was widening over time, as the floor of the band was fixed and the ceiling was crawling, the peso remained virtually pegged to the US dollar for extended periods of time.
36. It is critical that the peg criteria supersede the high inflation criteria in
the classification strategy, since historically a majority of inflation stabilization efforts have used the exchange rate as the nominal anchor and in many of these
episodes inflation rates at the outset of the peg were well above our 40 percent threshold.

EXCHANGE RATE ARRANGEMENTS 45
inflation threshold is not entirely arbitrary, as it has been iden
tified as an important benchmark in the literature on the deter
minants of growth (see Easterly [2001]). As a special subcategory of freely falling, we dub as hyperfloats those episodes that meet
Cagan's [1956] classic definition of hyperinflation (50 percent or
more inflation per month). A second situation where we classify an exchange rate re
gime as freely falling are the six months immediately following a
currency crisis?but only for those cases where the crisis marks a
transition from a fixed or quasi-fixed regime to a managed or
independently floating regime.37 Such episodes are typically characterized by exchange rate overshooting. This is another
situation where a large change in the exchange rate does not owe
to a deliberate policy; it is the reflection of a loss of credibility and
recurring speculative attacks. To date these crisis episodes, we
follow a variant of the approach suggested by Frankel and Rose
[1996]. Namely, any month where the depreciation exceeds or
equals 12 V2 percent and also exceeds the preceding month's
depreciation by at least 10 percent is identified as a crisis.38 To
make sure that this approach yields plausible crisis dates, we
supplement the analysis with our extensive country chronologies, which also shed light on balance of payments difficulties.39 Since, as a rule, freely falling is not typically an explicit arrangement of
choice, our chronologies also provide for all the freely falling cases, the underlying de jure or de facto arrangement (for exam
ple, dual markets, independently floating, etc.).
D. Managed and Freely Floating
Our approach toward identifying managed and freely float
ing episodes is basically to create these classes out of the residual
pool of episodes that, after comprehensive application of our
algorithm, have not been identified as an explicit or implicit peg or some form of band, and that are not included in the freely
37. This rules out cases where there was a devaluation and a repeg and cases where the large exchange rate swing occurred in the context of an already floating rate.
38. Frankel and Rose [1996] do not date the specific month of the crisis but the year; their criteria call for a 25 percent (or higher) depreciation over the year.
39. For instance, the Thai crisis of July 1997 does not meet the modified Frankel-Rose criteria. While the depreciation in
July exceeded that of the preced
ing month by more than 10 percent, the depreciation of the Thai Baht in that month did not exceed 25 percent. For these cases, we rely on the chronologies of events.

46 QUARTERLY JOURNAL OF ECONOMICS
falling category. To proxy the degree of exchange rate flexibility under freely floating and managed floats, we construct a compos ite statistic,
e/P(e < 1%),
where the numerator is the mean absolute monthly percent
change in the exchange rate over a rolling five-year period, while
the denominator flags the likelihood of small changes. For de jure or de facto pegs, this index will be very low (close to or equal to
zero), while for the freely falling cases it will be very large. As
noted, we only focus on this index for those countries and periods which are candidates for freely or managed floating. We tabulate
the frequency distribution of our index for the currencies that are
most transparently floating, these include US dollar/DM-euro, US dollar/yen, US dollar/UK pound, US dollar/Australian dollar, and US dollar/New Zealand dollar beginning on the date in which
the float was announced. We pool the observations (the ratio for
rolling five-year averages) for all the floaters. So, for example, since Brazil floated the real in January 1999, we would calculate
the ratio only from that date forward. If Brazil's ratio falls inside
the 99 percent confidence interval (the null hypothesis is freely
floating and hence the rejection region is located at the lower tail
of the distribution of the floater's group), the episode is charac
terized as freely floating. If that ratio falls in the lower 1 percent
tail, the null hypothesis of freely floating is rejected in favor of the
alternative hypothesis of managed float. It is important to note
that managed by this definition does not necessarily imply ac
tive or frequent foreign exchange market intervention?it refers
to the fact that for whatever reason our composite exchange rate
variability index, e/P(e < 1%), does not behave like the indices
for the freely floaters.
E. Dual or Multiple Exchange Rate Regimes and Parallel
Markets
Dual rates are essentially a hybrid arrangement. There are
cases or periods in which the premium is nil and stable so that the
official rate is representative of the underlying monetary policy. The official exchange rate could be pegged, crawling, or main
tained within some bands, or in a few cases allowed to float. But
there are countless episodes where the divergence between the
official and parallel rate is so large that the picture is incomplete without knowledge of what the parallel market rate is doing. The

EXCHANGE RATE ARRANGEMENTS 47
country chronologies are critical in identifying these episodes. In
the cases where dual or multiple rates are present or parallel markets are active, we focus on the market-determined rates
instead of the official exchange rates. As shown in Figure III, we
subject the market-determined exchange rate (dual, multiple, or
parallel) to the battery of tests described above.40 This particular
category will especially reshape how we view the 1940s through the 1960s, where about half the cases in the sample involved dual
markets.
University of Maryland, College Park
Harvard University
References
Bahmani-Oskooee, Mohsen, Ilir Miteza, and A. B. M. Nasir, "The Long-Run Relationship between Black Market and Official Exchange Rates: Evidence from Panel Cointegration," Economics Letters, LXXVI (2002), 397-404.
Baxter, Marianne, and Alan Stockman, "Business Cycle and Exchange Rate
Regime: Some International Evidence," Journal of Monetary Economics, XXIII (1989), 377-400.
Bordo, Michael, "The Bretton Woods International Monetary System: A Historical
Overview," in A Retrospective on the Bretton Woods System, Michael Bordo and Barry Eichengreen, eds. (Chicago, IL: University of Chicago Press, 1993), pp. 3-98.
-, "Exchange Rate Regimes in Historical Perspective," National Bureau of Economic Research Working Paper No. 9654, 2003.
Cagan, Philip, "The Monetary Dynamics of Hyperinflation," in Studies in the
Quantity Theory of Money, Milton Friedman, ed. (Chicago, IL: University of
Chicago Press, 1956), pp. 25-117.
Calvo, Guillermo A., and Carmen M. Reinhart, "Fear of Floating," Quarterly Journal of Economics, CXVII (2002), 379-408.
Chen, Yu-chin, and Kenneth S. Rogoff, "Commodity Currencies," Journal of International Economics, VX (2003), 133-160.
Claessens, Stijn, "Estimates of Capital Flight and Its Behavior," Revista de An?lisis Econ?mico, XII (1997), 3-34.
Cotarelli, C, and C. Giannini. "Credibility Without Rules? Monetary Frameworks in the Post Bretton-Woods Era," IMF Occasional Paper No. 154 (Washington,
DC: International Monetary Fund, 1998). de Vries, Margaret G., "Multiple Exchange Rates," in The International Monetary
Fund 1945-1965, Margaret de Vries and J. Keith Horsefield, eds. (Washing ton, DC: International Monetary Fund, 1969), pp. 122-151.
Easterly, William, The Elusive Quest for Growth (Cambridge, MA: MIT Press, 2001).
Frankel, Jeffrey A., and Andrew K. Rose, "Currency Crashes in Emerging Mar kets: An Empirical Treatment," Journal of International Economics, XXXXI
(1996), 351-368.
Ghei, Nita, Miguel A. Kiguel, and Stephen A. O'Connell, "Parallel Exchange Rates in Developing Countries: Lessons from Eight Case Studies," in Parallel Ex
change Rates in Developing Countries, Miguel Kiguel, J. Saul Lizondo, and
Stephen O'Connell, eds. (New York, NY: Saint Martin's Press, 1997), pp. 17-76.
40. There are a few such cases in the sample, where only government trans actions take place at the official rate.

48 QUARTERLY JOURNAL OF ECONOMICS
Ghosh, Atish, Anne-Marie Guide, Jonathan Ostry, and Holger Wolfe, "Does the Nominal Exchange Rate Regime Matter?" National Bureau of Economic Re search Working Paper No. 5874, 1997.
International Currency Analysis, World Currency Yearbook (New York, NY: In ternational Currency Analysis, 1983-1998), various issues.
International Monetary Fund, Annual Report on Exchange Restrictions (Wash ington, DC: International Monetary Fund, 1949-1978), various issues.
International Monetary Fund, Annual Report on Exchange Arrangements and
Exchange Restriction (Washington, DC: International Monetary Fund, 1979
2001), various issues.
Kiguel, Miguel, J. Saul Lizondo, and Stephen A. O'Connell, eds., Parallel Ex
change Rates in Developing Countries (New York, NY: Saint Martin's Press, 1997).
Levy-Yeyati, Eduardo, and Federico Sturzenegger, "Classifying Exchange Rate
Regimes: Deeds versus Words/' mimeo, Universidad Torcuato Di Telia, 2002.
Marion, Nancy P., "Dual Exchange Rates in Europe and Latin America," World Bank Economic Review, VIII (1994), 213-245.
Pick, Franz, World Currency Reports (New York, NY: Pick Publishing Corpora tion, 1945-1955), various issues.
-, Black Market Yearbook (New York, NY: Pick Publishing Corporation, 1951
1955), various issues. -, Pick's Currency Yearbook (New York, NY: Pick Publishing Corporation,
1955-1982), various issues. -, World Currency Reports (New York, NY: International Currency Analysis
Inc., 1983-1998), various issues.
Pick, Franz, and Ren? S?dillot, All the Monies of the World: A Chronicle of Currency Values (New York, NY: Pick Publishing Corporation, 1971).
Reinhart, Carmen M., and Kenneth S. Rogoff, "A Modern History of Exchange Rate Arrangements: A Reinterpretation," National Bureau of Economic Re search Working Paper No. 8963, 2001.
Reinhart, Carmen M., and Kenneth S. Rogoff, "Parts I and II. Background Ma terial to a Modern History of Exchange Rate Arrangements: A Reinterpreta tion," mimeo, International Monetary Fund, Washington, DC, 2003 at http:/ /
www.puaf.umd.edu/faculty/papers/reinhart/reinhart.htm. Reinhart, Carmen M., Kenneth S. Rogoff, and Miguel A. Savastano, "Addicted to
Dollars," National Bureau of Economic Research Working Paper No. 10015. 2003.
Reinhart, Carmen M., Kenneth S. Rogoff, and Antonio Spilimbergo, "When Hard Shocks Hit Soft Pegs," mimeo, International Monetary Fund, Washington, DC, 2003.
United Nations, United Nations Yearbook (New York: United Nations, 1946
1960), various issues.