Embed Size (px)
Citation preview

reimagining the business of apps
©2013 NativeX Holdings, LLC

Twitter: @MDCstatsd

Measure EverythingUnderstanding your systems.

Why should we measure?Understanding the current state of our code and systems.

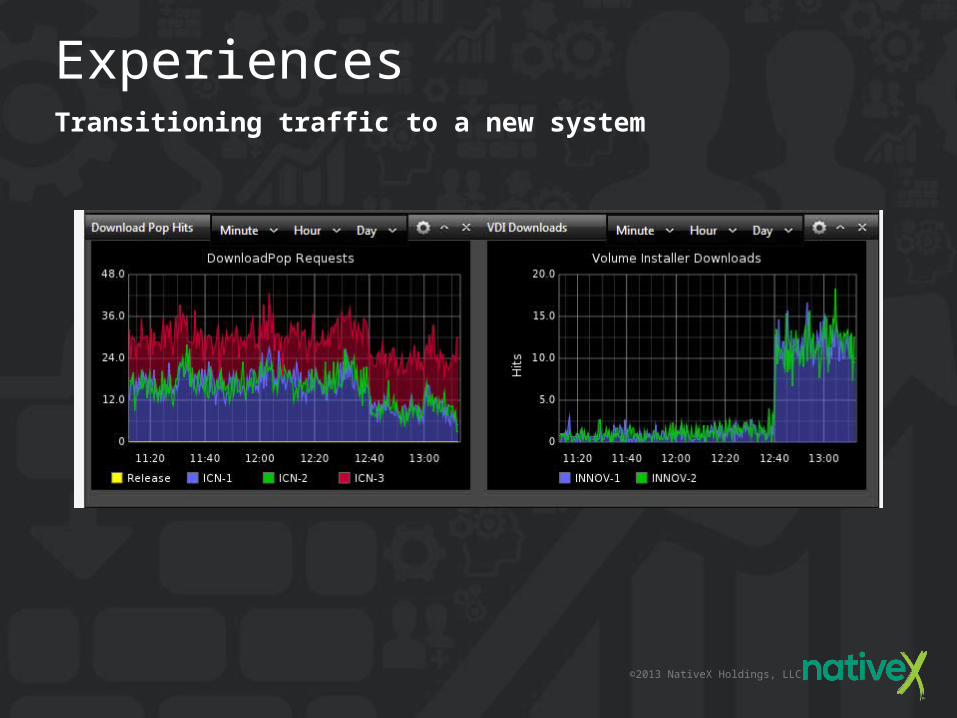
ExperiencesWhy StatsD and Graphite may help you!

©2013 NativeX Holdings, LLC
ExperiencesSystem performance degradation

©2013 NativeX Holdings, LLC
ExperiencesUnderstanding when releases have an effect on our systems

©2013 NativeX Holdings, LLC
ExperiencesLoad balancing – When is my server active
©2013 NativeX Holdings, LLC
ExperiencesTransitioning traffic to a new system

Convinced Yet?Hopefully so.

Other reasons you should use StatsD and Graphite?
©2013 NativeX Holdings, LLC
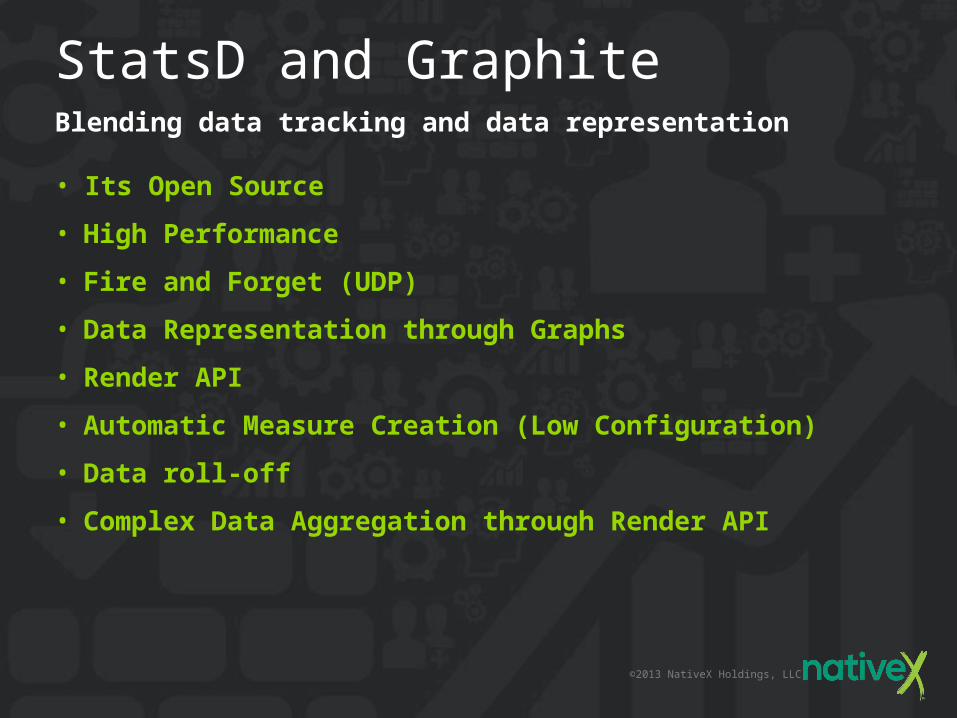
StatsD and GraphiteBlending data tracking and data representation
• Its Open Source
• High Performance
• Fire and Forget (UDP)
• Data Representation through Graphs
• Render API
• Automatic Measure Creation (Low Configuration)
• Data roll-off
• Complex Data Aggregation through Render API

StatsDHigh Performance Data Logging

©2013 NativeX Holdings, LLC
StatsDHow does it work?
• Node JS
• UDP
• Pluggable Backend (Graphite, Console, Repeater, Create Your Own)

©2013 NativeX Holdings, LLC
StatsDWhy NodeJS?
• High throughput
• Simple code
• Simple calls
• Async Everything
How does it work?
• It Listens for metrics on UDP socket
• It Assigns a metric to its own bucket
• It Aggregates values for each bucket until they need to flush
• Each bucket flushes every X seconds (configurable) and resets the value in the bucket
©2013 NativeX Holdings, LLC
StatsDWhy UDP?
• Fire and Forget
• Unless you majorly overload your network with UDP traffic it will not bring down your systems if StatsD fails
• Little network overhead, small messages
• Ask me how many times we crashed StatsD

©2013 NativeX Holdings, LLC
StatsD – Metric Types• Timers – Track Times by Millisecond
• How long does it take to make calls to other people’s APIs• Do I know how long specific units of code take to run?• How long does it take for my API to respond?
• Counters – Track an Integer Value• How many times does my page get hit per flush interval• How many times does my API get hit per flush interval• How many users hit my API per flush interval
• Gauges – Track a Value• What was this value at the last point before flush interval?• What is our CPU on our serer running at?• How much memory do we have available?• How much disk space do we have available?

©2013 NativeX Holdings, LLC
StatsDLets talk about creating metrics
• If the metric name did not exist previously, a bucket will be created to store the data. “.” represents a step down in hierarchy. Think of it as a file system but replace “\” with “.”.
• MDC.Twitter.HashTags becomes
• MDC• Twitter
• HashTags

©2013 NativeX Holdings, LLC
StatsDShow me some code already, OK
• NStatsD.Client.Current.Increment("testing.increment"); NStatsD.Client.Current.Decrement("testing.decrement"); NStatsD.Client.Current.Timing("testing.timing", 2345); NStatsD.Client.Current.Gauge("testing.gauge", 45);
• Also has ability to do sample rate, which allows you to only send metrics every x requests. Value is expressed as a double from 0.0 to 1.0
• Can it send tracking from SQL Server? It can• Check the Questions page

GraphiteData Aggregation and Graphing

©2013 NativeX Holdings, LLC
GraphiteHow does it work?
Graphite Web – for assembling and rendering graphs
• Render API – An API which takes querystring parameters to generate graphs or json
• Web App – Allows you to generate graphs by assembling simple urls which call the render api
©2013 NativeX Holdings, LLC
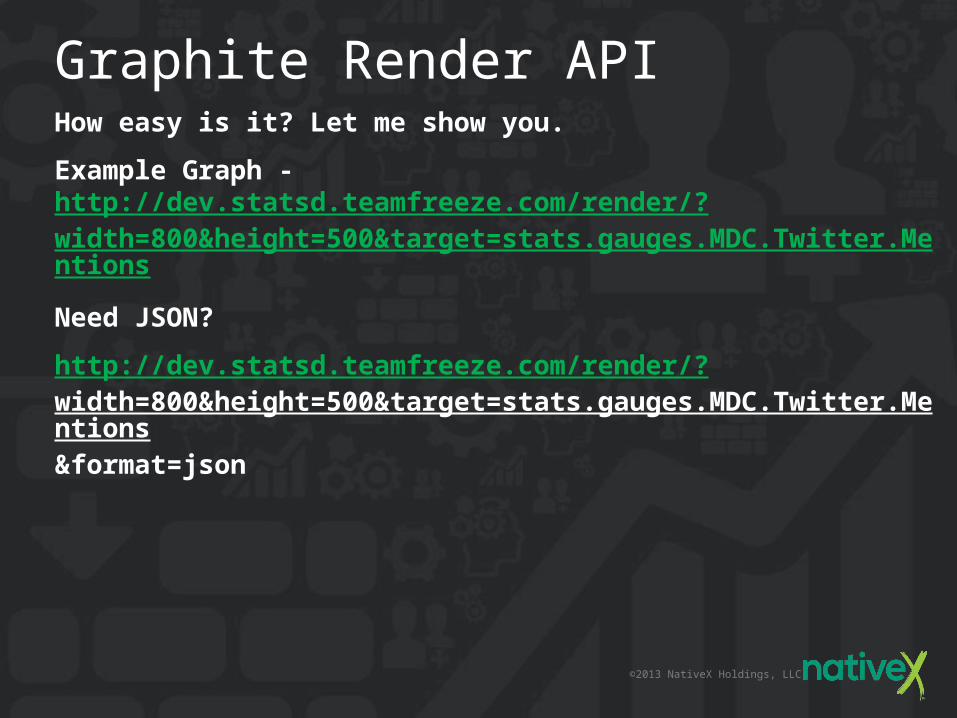
Graphite Render APIHow easy is it? Let me show you.
Example Graph - http://dev.statsd.teamfreeze.com/render/?width=800&height=500&target=stats.gauges.MDC.Twitter.Mentions
Need JSON?
http://dev.statsd.teamfreeze.com/render/?width=800&height=500&target=stats.gauges.MDC.Twitter.Mentions&format=json

©2013 NativeX Holdings, LLC
Making Measurements MeaningfulUnderstanding data is all about knowing the context and presentation
• Grids (Nice filtering, but little impact)
• Charts (Depends on the Type and what You’re Measuring)
• Line (Great for comparing things over time)• Gauge (Great for showing general system health as an average)• Focus (Selectable Timeframe for in depth analysis over time)
• Alerting - Graphs are nice, but do we really want to stare at graphs all day

Lets Build a GraphGraphite - How simple can it be?

©2013 NativeX Holdings, LLC
Graphite DashboardsWhat if I want to create a collection of graphs that I want to repeatedly look at?
• /dashboard – Created named dashboards with graphs which you generate

Setting Up StatsD & Graphite

©2013 NativeX Holdings, LLC
Components• StatsD
• nodeJS module [Listener; Aggregation]
• Graphite• Carbon• carbon-relay• carbon-cache• carbon-aggregator• Whisper• Django Webapp

©2013 NativeX Holdings, LLC
Graphite – Python modulesStore and render time-series data
• carbon - a daemon that listens for time-series data
• whisper - a simple database library for storing time-series data
• graphite webapp - A Django webapp that renders graphs on-demand
• Query = look in carbon cache + whisper files

©2013 NativeX Holdings, LLC
Carbon daemonsReceive, cache, store
• carbon-relay.py
• Basically a Load Balancer
• carbon-cache.py – daemon receives incoming data into RAM
• flush to whisper on an interval
• carbon-aggregator.py – optional
• Works similar to StatsD
• TCP
©2013 NativeX Holdings, LLC
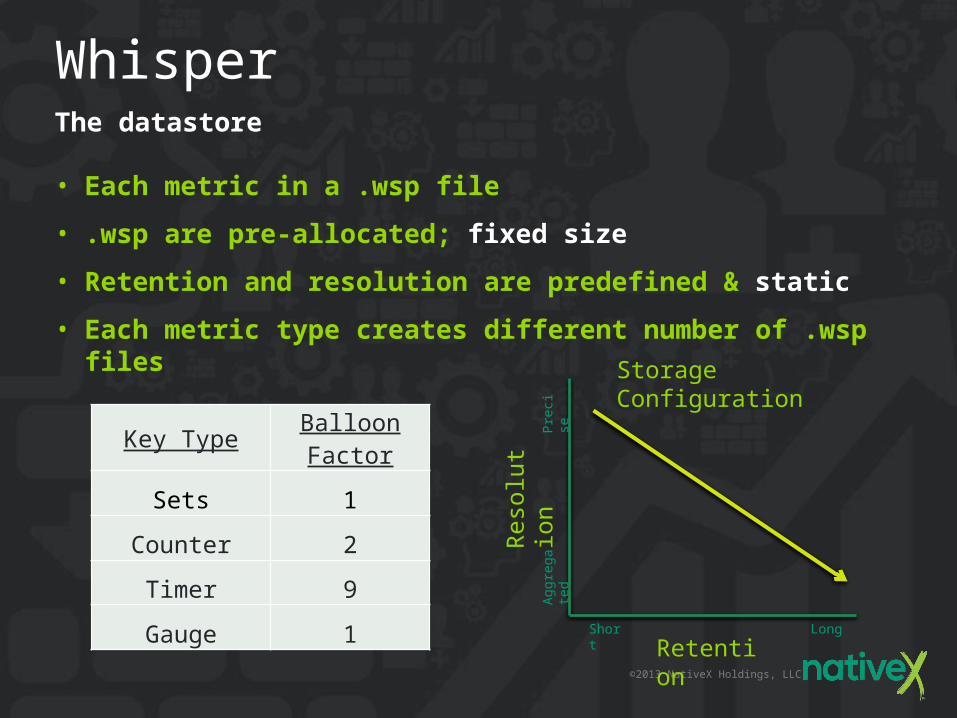
WhisperThe datastore
• Each metric in a .wsp file
• .wsp are pre-allocated; fixed size
• Retention and resolution are predefined & static
• Each metric type creates different number of .wsp files
Key Type Balloon Factor
Sets 1
Counter 2
Timer 9
Gauge 1
Reso
lutio
n
RetentionShort Long
Aggr
egat
ed
Prec
ise
Storage Configuration
©2013 NativeX Holdings, LLC
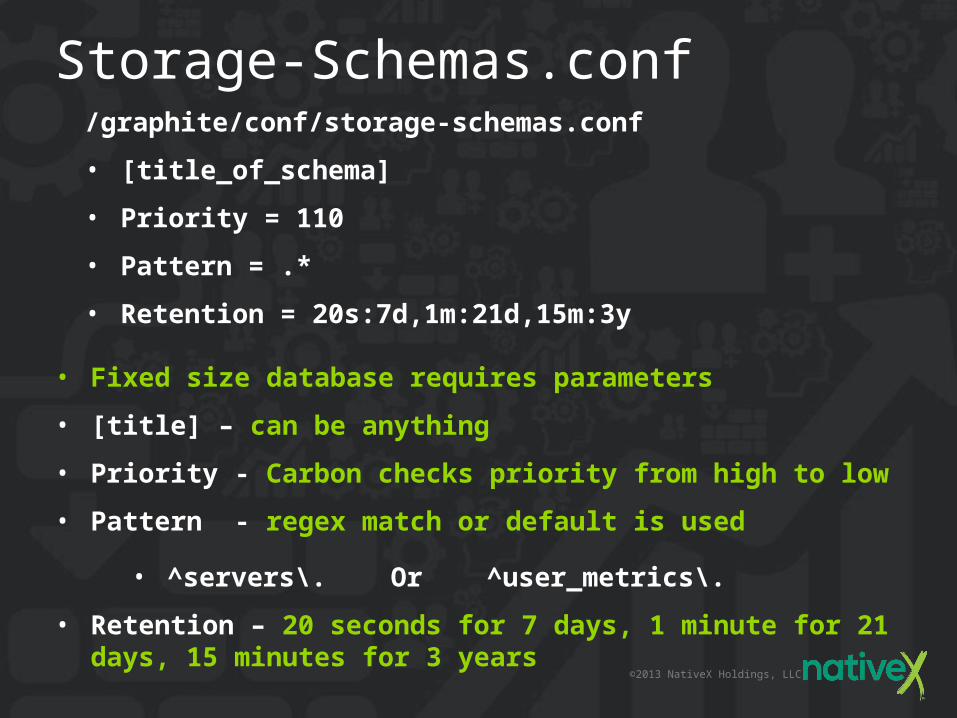
Storage-Schemas.conf/graphite/conf/storage-schemas.conf
• [title_of_schema]
• Priority = 110
• Pattern = .*
• Retention = 20s:7d,1m:21d,15m:3y
• Fixed size database requires parameters
• [title] – can be anything
• Priority - Carbon checks priority from high to low
• Pattern - regex match or default is used
• ^servers\. Or ^user_metrics\.
• Retention – 20 seconds for 7 days, 1 minute for 21 days, 15 minutes for 3 years

©2013 NativeX Holdings, LLC
StatsD Configuration• File:
<statsd_install_root>/dConfig.js
• Ex: /opt/graphite/statsd/dConfig.js
• JSON Object
• Graphite backend config (could be a carbon-relay or –cache)
• graphitePort
• graphiteHost
• legacyNamespace: Should ‘counts’ for counters and timers have ‘stats_counts’ prefix? [for backwards compat]
• port – for the StatsD UDP socket
• flushInterval: In ms, how often to flush values to backend and reset to 0.

Lessons LearnedWhat did we learn the hard way?

©2013 NativeX Holdings, LLC
Lessons learned
• Keep Flush interval’s the same
• StatsD & Carbon config
• 10 seconds typically
• Limit bucket architecture
• Bad idea – reporting per server in a cluster
• Buckets total size is static
• Filled up whisper storage? corrupt data!
• Countries example

©2013 NativeX Holdings, LLC
Lessons learned• Data points per pixel
• More data points per pixel = rounded data
• Some crazy numbers
• Show example

©2013 NativeX Holdings, LLC
Lessons learned• NStatsD C# library
• Retention ratios don’t exactly work
• Need to handle % sent to NStatsD
• Example
• Start in the cloud
• Scalability
• Data Precision & Accuracy
• Company adoption brings over use
• Limit use to monitoring general trends

©2013 NativeX Holdings, LLC
Rolling your own systemWhat can you do with StatsD and Graphite

©2013 NativeX Holdings, LLC
Questions?• Graphite - https://graphite.readthedocs.org/en/0.9.10/
• StatsD - http://codeascraft.com/2011/02/15/measure-anything-measure-everything/
• StatsD GitHub - https://github.com/etsy/statsd/
• StatsD Metrics - https://github.com/etsy/statsd/blob/master/docs/metric_types.md
• NStatsD - https://github.com/robbihun/NStatsD.Client
• Graphite ** - http://www.aosabook.org/en/graphite.html
• Github on the stored procedure - https://github.com/peschuster/graphite-client/blob/master/source/Graphite.TSql/sp_graphitesend.sql
• DLL, should be placed in the shared location - https://github.com/peschuster/graphite-client/tree/master/source/Graphite.TSql
** super useful for setting graphite up the right way