Embed Size (px)
Citation preview
University of IowaIowa Research Online
Theses and Dissertations
Spring 2011
Regulation of renin gene expression by CTCF,Nr2f2, Nr2f6, Nr4a1 and maintenance of the reninexpressing cellEric Thomas WeatherfordUniversity of Iowa
Copyright 2011 Eric Thomas Weatherford
This dissertation is available at Iowa Research Online: https://ir.uiowa.edu/etd/1104
Follow this and additional works at: https://ir.uiowa.edu/etd
Part of the Biophysics Commons
Recommended CitationWeatherford, Eric Thomas. "Regulation of renin gene expression by CTCF, Nr2f2, Nr2f6, Nr4a1 and maintenance of the reninexpressing cell." PhD (Doctor of Philosophy) thesis, University of Iowa, 2011.https://doi.org/10.17077/etd.f8f6i6xy
REGULATION OF RENIN GENE EXPRESSION BY CTCF, NR2F2, NR2F6, NR4A1
AND MAINTENANCE OF THE RENIN EXPRESSING CELL
by
Eric Thomas Weatherford
An Abstract
Of a thesis submitted in partial fulfillment of the requirements for the Doctor of
Philosophy degree in Molecular Physiology and Biophysics in the Graduate College of
The University of Iowa
May 2011
Thesis Supervisor: Professor Curt D. Sigmund

1
ABSTRACT
The renin angiotensin system (RAS) is critical for the regulation of blood
pressure, electrolyte/fluid, and metabolic homeostasis. Regulation of the RAS is
important in the development and treatment of hypertension. As part of the rate-limiting
step in a cascade of events ending in the production of angiotensin II, renin is a major
regulator of the RAS. Its expression is localized to the juxtaglomerular (JG) cells of the
JG apparatus where it is exquisitely located to respond to various physiological cues.
Understanding the regulation of renin expression and development of the juxtaglomerular
cells is critical. Two regulatory elements, the enhancer and proximal promoter, have
been found to be important in controlling cell- and tissue- specific baseline expression of
the renin gene. Within the enhancer is a hormone response element (HRE) which confers
a high level of activity to the enhancer. Nuclear receptors that bind this element have
been found to bind the HRE and regulate renin promoter transcriptional activity. We
have previously characterized the role of the orphan nuclear receptor Nr2f6 as a negative
regulator of renin expression that mediates its effects through the HRE. However, gel
shift assays indicate that there are other transcription factors binding this element. We
have identified other orphan nuclear receptors that regulate renin expression. The first,
Nr2f2 acts as a negative regulator of renin promoter activity but does not appear to affect
baseline expression of the endogenous renin gene. The other, Nr4a1, is a positive
regulator of renin expression, but it does not appear to mediate its effects through the
HRE.
The transcriptional regulation of gene expression is controlled by regulatory
elements separated by large distances from promoters. We and others have found that
short transgenes of the human renin (hREN) locus are not sufficient to protect them from
positional effects that can be exerted upon them by neighboring regulatory elements. We
discovered a random truncation in a large genomic construct of the hREN gene that
2
resulted in ubiquitous expression of renin not seen with the intact form. By locating the
genomic insertion site of that transgene in the Zbtb20 gene, we found that the hREN
promoter had come under control of that gene’s regulatory elements. The gene
downstream of renin however maintained its tissue-specific expression. We found that
CCCTC-binding factor (CTCF) bound to chromatin in and around the renin locus. The
presence of CTCF suggests that insulator elements are present in the renin locus, and
their loss likely explains the results above.
Finally, we assessed the role of microRNAs in the development of renin
expressing cells in the mouse kidneys by cell-specific deletion of the processing enzyme
Dicer. This resulted in reduction of renin expression and a decrease in the number of
renin expressing cells in the kidney. Mice were hypotensive and had several kidney
abnormalities including a hypertrophied vasculature and striped fibrosis. These results
indicate that Dicer and the miRNAs it processes are critical for the development and
maintenance of renin expressing cells that contribute to normal kidney development.
Abstract Approved: ____________________________________ Thesis Supervisor
____________________________________ Title and Department
____________________________________ Date
REGULATION OF RENIN GENE EXPRESSION BY CTCF, NR2F2, NR2F6, NR4A1
AND MAINTENANCE OF THE RENIN EXPRESSING CELL
by
Eric Thomas Weatherford
A thesis submitted in partial fulfillment of the requirements for the Doctor of
Philosophy degree in Molecular Physiology and Biophysics in the Graduate College of
The University of Iowa
May 2011
Thesis Supervisor: Professor Curt D. Sigmund
Graduate College The University of Iowa
Iowa City, Iowa
CERTIFICATE OF APPROVAL
_______________________
PH.D. THESIS
_______________
This is to certify that the Ph.D. thesis of
Eric Thomas Weatherford
has been approved by the Examining Committee for the thesis requirement for the Doctor of Philosophy degree in Molecular Physiology and Biophysics at the May 2011 graduation.
Thesis Committee: ___________________________________ Curt D. Sigmund, Thesis Supervisor
___________________________________ Michael G. Anderson
___________________________________ Michael D. Henry
___________________________________ Scott Moye-Rowley
___________________________________ Kamal Rahmouni
___________________________________ Thomas J. Schmidt

To my members of the “Greatest Generation”
ii
ABSTRACT
The renin angiotensin system (RAS) is critical for the regulation of blood
pressure, electrolyte/fluid, and metabolic homeostasis. Regulation of the RAS is
important in the development and treatment of hypertension. As part of the rate-limiting
step in a cascade of events ending in the production of angiotensin II, renin is a major
regulator of the RAS. Its expression is localized to the juxtaglomerular (JG) cells of the
JG apparatus where it is exquisitely located to respond to various physiological cues.
Understanding the regulation of renin expression and development of the juxtaglomerular
cells is critical. Two regulatory elements, the enhancer and proximal promoter, have
been found to be important in controlling cell- and tissue- specific baseline expression of
the renin gene. Within the enhancer is a hormone response element (HRE) which confers
a high level of activity to the enhancer. Nuclear receptors that bind this element have
been found to bind the HRE and regulate renin promoter transcriptional activity. We
have previously characterized the role of the orphan nuclear receptor Nr2f6 as a negative
regulator of renin expression that mediates its effects through the HRE. However, gel
shift assays indicate that there are other transcription factors binding this element. We
have identified other orphan nuclear receptors that regulate renin expression. The first,
Nr2f2 acts as a negative regulator of renin promoter activity but does not appear to affect
baseline expression of the endogenous renin gene. The other, Nr4a1, is a positive
regulator of renin expression, but it does not appear to mediate its effects through the
HRE.
The transcriptional regulation of gene expression is controlled by regulatory
elements separated by large distances from promoters. We and others have found that
short transgenes of the human renin (hREN) locus are not sufficient to protect them from
positional effects that can be exerted upon them by neighboring regulatory elements. We
discovered a random truncation in a large genomic construct of the hREN gene that
iii
resulted in ubiquitous expression of renin not seen with the intact form. By locating the
genomic insertion site of that transgene in the Zbtb20 gene, we found that the hREN
promoter had come under control of that gene’s regulatory elements. The gene
downstream of renin however maintained its tissue-specific expression. We found that
CCCTC-binding factor (CTCF) bound to chromatin in and around the renin locus. The
presence of CTCF suggests that insulator elements are present in the renin locus, and
their loss likely explains the results above.
Finally, we assessed the role of microRNAs in the development of renin
expressing cells in the mouse kidneys by cell-specific deletion of the processing enzyme
Dicer. This resulted in reduction of renin expression and a decrease in the number of
renin expressing cells in the kidney. Mice were hypotensive and had several kidney
abnormalities including a hypertrophied vasculature and striped fibrosis. These results
indicate that Dicer and the miRNAs it processes are critical for the development and
maintenance of renin expressing cells that contribute to normal kidney development.
iv
TABLE OF CONTENTS
LIST OF TABLES............................................................................................................ vii
LIST OF FIGURES ......................................................................................................... viii
CHAPTER 1 GENERAL INTRODUCTION .....................................................................1 History and Background of the Renin-Angiotensin System.............................2 Regulation of Renin Expression .......................................................................6
Transcriptional Regulation of Renin .........................................................6 Post-transcriptional regulation.................................................................11
Regulation of Renin Secretion........................................................................13 Development of the Renin Expressing Cell....................................................15
CHAPTER 2 CONTROL OF RENIN EXPRESSION BY NUCLEAR RECEPTORS.............................................................................................20
Introduction.....................................................................................................20 Methods ..........................................................................................................22
RT-PCR ...................................................................................................22 cDNA Expression Plasmids ....................................................................22 Luciferase Assay .....................................................................................22 Orphan Nuclear Receptor Knockdown ...................................................23 Electrophoretic Mobility Shift Assay and Supershift Assay...................24 DNA Affinity Purification Assay............................................................24 Chromatin Immunoprecipitation .............................................................25 Immunofluorescence ...............................................................................25
Results.............................................................................................................26 Discussion.......................................................................................................31
CHAPTER 3 CONTROL OF THE RENIN LOCUS BY CTCF.......................................46 Introduction.....................................................................................................46 Methods ..........................................................................................................47
Generation of Kidney Enhancer-deficient PAC160 Transgenic Mice.........................................................................................................47 Transgene insertion mapping ..................................................................48 RNA Isolation and RT-PCR....................................................................48 In vitro Transcription Translation ...........................................................49 EMSA......................................................................................................49 Chromatin Immunoprecipitation .............................................................50
Results.............................................................................................................50 Discussion.......................................................................................................54
CHAPTER 4 DICER MAINTAINS THE RENIN CELL PHENOTYPE.........................66 Introduction.....................................................................................................66 Methods ..........................................................................................................67
Generation of Dicer KO mice..................................................................67 Histological analysis and immunostaining..............................................68 RNA extraction and quantitative RT-PCR (qRT-PCR) analysis ..............68
v
Tail cuff and Telemetry BP measurements .............................................68 Results.............................................................................................................69 Discussion.......................................................................................................70
CHAPTER 5 GENERAL DISCUSSION ..........................................................................76 Renin Expression and Maintenance of the Renin Cell Phenotype .................76
Summary of Results.................................................................................76 Future Directions .....................................................................................77
REFERENCES ..................................................................................................................81
vi
LIST OF TABLES
Table 2-1. Primers and probes for gene expression analysis. ...........................................37
Table 2-2. Summary of data from RT-PCR and microarray analysis of As4.1 mRNA..............................................................................................................39
Table 3-1. Primers and probes for determining gene expression, transgene insertion mapping, EMSA, and ChIP analysis................................................................58
vii
LIST OF FIGURES
Figure 1-1. Alignment of mouse and human enhancer.....................................................19
Figure 2-1. Expression of orphan nuclear receptors in As4.1 cells. .................................38
Figure 2-2. Immunofluorescence for Nr2f2, Nr2f6, and Nr4a1. ......................................40
Figure 2-3. Luciferase activity of 4.1kP-luc when Nr2f2, Nr2f6, or Nr4a1 are overexpressed or knocked down....................................................................41
Figure 2-4. EMSA analysis of in vitro translated Nr2f2, Nr2f6, and Nr4a1. ...................42
Figure 2-5. Characterization of Nr2f2, Nr2f6, and As4.1 nuclear proteins to the HRE................................................................................................................43
Figure 2-6. Renin, Nr2f2, Nr2f6, and Nr4a1 expression following orphan receptor knock down in As4.1 cells. ............................................................................44
Figure 2-7. Expression of other potential target genes following orphan receptor knock down....................................................................................................45
Figure 3-1. Stucture of the PAC160 and ∆KE6 transgenes and renin expression............59
Figure 3-2. Mapping the ∆KE6 insertion site in the mouse genome. ...............................60
Figure 3-3. Detection of fusion transcripts in ∆KE6 mice................................................61
Figure 3-4. Genome structure and transcripts of ∆KE6 mice...........................................62
Figure 3-5. RNase protection assay identifying fusion versus hREN transcripts.............63
Figure 3-6. EMSA analysis of identified CTCF binding sites..........................................64
Figure 3-7. ChIP analysis for the binding of chromatin around the ∆KE6 transgene. .....65
Figure 4-1. Expression of Ren1 and Ren2 in mouse kidneys of control and knockout mice................................................................................................73
Figure 4-2. Blood pressure measurements in control and Dicer knockout mice. .............74
Figure 4-3. Histology of control and Dicer knockout mice. .............................................75
viii
1
CHAPTER 1
GENERAL INTRODUCTION
The renin-angiotensin system (RAS) or renin-angiotensin-aldosterone system
(RAAS) maintains homeostasis by regulating blood pressure and fluid-electrolyte
balance. How the system accomplishes the modulation of these endpoints is as diverse as
the tissues responding to angiotensin II (Ang II). Ang II can regulate blood pressure by
directly stimulating vasoconstriction in resistance vessels. It also has direct and indirect
actions in the kidney, and its regulation of fluid-electrolyte homeostasis can indirectly
influence blood pressure by regulating extracellular volume. Angiotensin II stimulates
aldosterone release from the adrenal glands leading to Na+ reabsorption in the kidney, a
driving force for H2O retention. Ang II can also directly stimulate sodium reabsorption
by binding to Ang II receptors in the tubular segments of the late nephron. Furthermore,
Ang II can stimulate the thirst response, salt appetite, and vasopressin release by actions
in the brain. Sympathetic outflow is also stimulated by Ang II and that can affect other
levels of blood pressure regulation like chronotropic and ionotropic events in the heart.
Furthermore, β-adrenergic stimulation through the sympathetic nervous system is one
way to activate the RAS by stimulating renin secretion from the kidney. Initially
believed to be a purely paracrine system, it is widely accepted that it functions in an
autocrine or “intracrine” manner in several tissues. Initially simplistic and straight
forward, the complexity of the RAS has expanded significantly since discovery of the
founding molecule renin.
Renin serves as the foundation of this system because it is involved in the rate-
limiting step of a cascade of events leading to physiological changes. It is primarily
produced, stored, and secreted from the juxtaglomerular (JG) cells of the kidney. These
cells make up approximately 0.01% of the total cell population of the kidney, yet account
for the bulk of renin produced body-wide. They are exquisitely positioned adjacent to
2
both the vascular and tubule components of the kidney to respond to blood pressure and
electrolyte changes of which the RAS is responsible for regulating.
History and Background of the Renin-Angiotensin System
Study of the RAS was initiated by the discovery of renin by Robert Tigerstedt and
Per Bergman over 100 years ago. They discovered that kidney extracts were able to
induce increases in blood pressure when injected into rabbits. They hypothesized that the
kidney produced a vasoactive substance and were able to localize its production to the
kidney cortex. Because of the source they called the substance renin. Their discovery
was largely ignored until the work of Henry Goldblatt published in 1934. He noticed that
patients who died of hypertension often had a narrowing of renal blood vessels.
Goldblatt was able to show that clipping of renal arteries resulted in hypertension in
experimental animals (1). He too concluded that the ischemic kidney must produce a
substance with vasoactive properties (2). This spurred new interest in the work of
Tigerstedt and whether renin was responsible for the hypertension in Goldblatt’s
experiments.
The mechanism of increased blood pressure produced by Goldblatt’s ischemic
kidney was pursued by two separate groups simultaneously. One was led by Irvine Page
in the United States and the other by Eduardo Braun-Menendez in Argentina. Page’s
group noted that there was a diminished response to renin in isolated perfused dog tail
preparations unless plasma was included with the perfusate (3). This led to the conclusion
that renin was not the vasoactive substance, but acted on another plasma peptide.
Menendez’s group demonstrated that renal vein blood from ischemic kidneys produce a
strong pressor response in nephrectomized dogs. Further work resulted in the
characterization of another vasoactive molecule that had very acute pressor action unlike
the prolonged effect of renin (4). One group named this substance “hypertensin”, the
other “angiotonin”, which were combined to form the name as we know it today,
3
“angiotensin”. Furthermore, renin was recognized as a proteolytic enzyme released from
the kidney that acted on a plasma substrate, hypertensinogen (angiotensinogen). In 1942,
Leloir was able to show that this substrate is produced in the liver, and in 1954, Leonard
Skeggs was able to show that angiotensin existed in two forms, angiotensin I (Ang I) and
II (Ang II) (5-7). Skeggs was subsequently able to show that Ang I converted by
angiotensin converting enzyme (ACE) to Ang II was responsible for the increases in
blood pressure (8). About four years later it was determined that Ang II was able to
stimulate aldosterone release (9). The last piece to the puzzle came in 1970 when
angiotensin receptors were identified in various tissues (10). That completed the pathway
as we know it today- renin release from the kidney cleaves angiotensinogen to Ang I
which is further processed by ACE producing the active peptide Ang II that can stimulate
vasoconstriction and aldosterone release by binding to angiotensin receptors.
The RAS soon became a system that was considered to be attractive as a drug
target for controlling high blood pressure (hypertension). The first drug utilized to target
the RAS was the ACE inhibitor captopril in 1977. This drug was based on a peptide
found in the Brazilian pit snake, Bothrops jararaca. The existence of such a peptide was
first described by Sergio Ferreira in 1965 (11). In 1968 Y.S. Bakhle showed that ACE
from the dog lung was inhibited by peptides from this snake’s venom (12). David
Cushman, a biochemist, and Miguel Ondetti, a chemist, collaborated to develop captopril
based on structural combinations of the peptide from pit snake venom and L-
benzylsuccinic acid (13). Inhibitors of ACE are now some of the most prescribed anti-
hypertensive drugs prescribed today. Today, other ACE inhibitors have been developed
as well as Ang II receptor antagonists and renin inhibitors. Not only was captopril the
first drug to target the RAS, but it renewed interest in its role in controlling blood
pressure.
The RAS has expanded greatly in terms of the number of angiotensin peptides
generated, receptors involved, and localization of its components. There has been the
4
discovery of a second ACE (ACE2) that is important in the steps that generate Ang-(1-7),
another peptide hormone of the RAS (14, 15). The binding of Ang 1-7 to its receptor (the
Mas receptor) appears to initiate cell responses that antagonize those of Ang II (16).
Renin is secreted in both an inactive (prorenin) and active form. Recently, a
prorenin/renin receptor (PRR) has been identified and characterized to bind prorenin.
When prorenin binds to the receptor, its active site is unmasked allowing it to cleave
angiotensinogen and generate Ang II (17). A signal transduction cascade that results in
ERK1/2 activation is also initiated upon prorenin/renin binding. Thus, a new hypothesis
is that renin is not only an enzyme responsible for the ultimate production of Ang II, but
is also a ligand activating intracellular signaling by binding its receptor. The PRR may
play an important role in localized tissue Ang II production and local RASs.
It is now well accepted that several organs express components of the RAS. Of
particular importance is their expression in key cardiovascular tissues such as the kidney,
heart, and brain. It has become increasingly apparent that these local tissue RASs are
involved in cardiovascular disease progression. The potential importance of these tissue
RASs is highlighted by the fact that ACE inhibitors and ARBs can lower blood pressure
even in patients with low or normal plasma renin levels, which points to inhibition at the
level of local systems (18, 19).
The primary sites of renin synthesis and release are the juxtaglomerular (JG) cells
of the JG apparatus in the kidney. However, other bonafide sites of renin expression
exist, with the brain and lung expressing specific novel transcriptional isoforms of the
renin mRNA containing exon-1b and exon-1c, respectively, in place of exon-1a (20).
These isoforms are probably regulated by different promoters since the expression of
exon-1b is retained despite deletion of the 500 bp of DNA surrounding exon-1a that
includes the classic renin promoter (21). These two isoforms are most likely intracellular
forms of renin and probably participate exclusively in localized tissue RAS signaling.
Overexpression of the RAS specifically in the brain of mice leads to hypertension and
5
increases in metabolic rate with suppression of the peripheral RAS (22-24). When renin
is overexpressed in the proximal tubule of the kidney it leads to hypertension without
stimulation of the peripheral RAS (25). These two animal models are just two examples
that underscore the significance of tissue RASs in hypertension.
Hypertension is a major risk factor for cardiovascular disease and lowering blood
pressure in patients has proven to significantly reduce risk for developing cardiovascular
morbidity and mortality (26-28). In human patients, hypertension is defined as a systolic
blood pressure greater than 130 mmHg and/or a diastolic greater than 90 mmHg. A
major controller of blood pressure homeostasis is the RAS. Renin catalyzes the
conversion of angiotensinogen to angiotensin I in the rate-limiting step of the RAS, and
angiotensin I is ultimately cleaved by angiotensin converting enzyme (ACE) to produce
angiotensin II. This molecule is the primary blood pressure regulator of the RAS. It
stimulates vasoconstriction, sodium reabsorption, salt appetite and thirst, vasopressin
release, and the sympathetic nervous system. The importance of the RAS in controlling
blood pressure, hypertension, and development of cardiovascular disease is revealed by
the effectiveness of ACE inhibitors and angiotensin receptor blockers (ARBs) as
antihypertensive agents (29, 30). In fact, the renin inhibitor Aliskiren was recently
approved for clinical use. The RAS also plays an important role in Mendelian forms of
hypertension, and renin gene polymorphisms have been associated with hypertension
(31-33). In conjunction with control of blood pressure homeostasis, the RAS, and
particularly renin, plays a significant role in kidney development and is critical
postnatally (34-37). Specifically, secreted renin is critical for life as its genetic ablation
leads to postnatal lethality (21). Because renin is involved in the most regulated and rate-
limiting step of the RAS, understanding its regulation is critical to resolving the
complexity of hypertension and cardiovascular disease.
6
Regulation of Renin Expression
Transcriptional Regulation of Renin
The mouse and human renin genes are found on chromosome 1 and share about
78% homology. Certain strains of mice (e.g. C57BL/6 & BALB/c) carry one renin gene
whereas others (e.g. DBA/2J & 129SvJ) have two as a result of gene duplication. Renin
in one gene strains is designated Ren-1c, and in two gene strains, renin loci are termed
Ren-1d and Ren-2. The coding regions of Ren-1c and Ren-1d are 99% homologous while
Ren-1c&d are 97% homologous to Ren-2. One gene strains more faithfully recapitulate
the genetic state in humans. Therefore, the majority of evidence presented here will
focus on the Ren-1c gene.
Initial studies into the transcriptional regulation of renin involved the use of non-
renin expressing cells and transgenic mice. Data from non-renin expressing cells are
probably of limited use because the renin gene was not studied in its usual environment
of trans-acting factors. Transgenic mice, however, provided evidence that ~4.6 kb of
Ren-2 upstream sequence was sufficient to drive tissue- and cell-specific renin expression
of the T-antigen coding sequence (38). Now, through the use of endogenous renin
expressing juxtaglomerular derived mouse As4.1 and human lung carcinoma Calu-6
cells, we have a better understanding of the trans- and cis-factors involved in the
regulation of the renin gene (39, 40).
Evidence from As4.1 cells has identified two elements within the Ren-1c gene that
are critical for its control. A proximal promoter element (PPE, -197 to -50 bp) and
enhancer (-2866 to -2625 bp) work in conjunction to direct renin expression. Inclusion of
the enhancer in reporter constructs results in a ~50-fold increase in promoter activity in
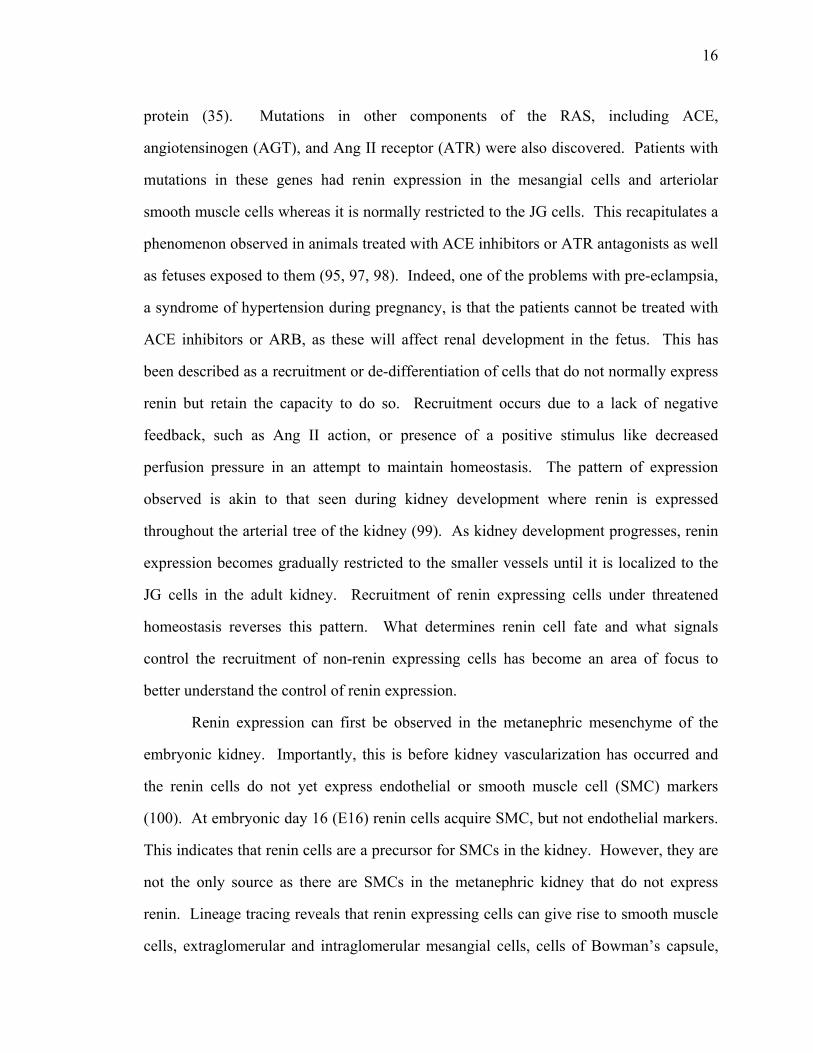
an orientation- and position-independent manner (41). The mREN enhancer shares 71%
homology with a human renin (hREN) enhancer that lies ~11 kb upstream of the start site
(Figure 1-1). Within the enhancer there are three identified binding sites that are 100%
7
identical between mouse and human. Mutation of any one of these sites results in a
dramatic decrease in enhancer activity (42, 43). Element d (Ed) is a cAMP responsive
element (CRE) which has been found not only to bind cAMP responsive element binding
protein (CREB) and cAMP responsive element modulator (CREM), but also nuclear
factor kappa B (NfκB) (44). A second site, termed element e (Ee), is an E-box found to
bind upstream stimulatory factors 1 and 2 (USF-1/2) (42). The last binding site,
element c (Ec), is a hormone response element (HRE) (45). This site is of particular
interest because it is the half-site of a TGACCT repeat, that in combination with element
b (Eb) of the mouse enhancer makes up a larger HRE. Additionally, the HRE can bind
EAR2 and vitamin D receptor (VDR) that have a negative effect on the enhancer (43,
46). However, the effects of VDR appear to be controlled through DNA independent
transrepression of CREB binding to the CRE (47). Within the second half-site of the
HRE, the human enhancer contains a A>G single nucleotide polymorphism (SNP) that
reduces enhancer activity significantly and may contribute to the dramatic differences
seen in renin levels between mice and humans (~1000 vs. 3 ng Ang I/ml/hr) (48).
The remaining portion of the enhancer contains six binding sites that are less
conserved yet may still be important for enhancer function. Of those six sites, four are
NFI binding sites and one is a SP1/3 site (49). When the binding sites are mutated
individually they have generally modest effects on promoter activity. When all the sites
are mutated there is approximately a 90% reduction. However, their action appears to be
dependent on the presence of the proximal portion of the enhancer discussed above (42).
In addition to the enhancer and its transcription factors, the PPE is a key element
of the renin gene. Within the PPE, there is a binding element named the renin proximal
promoter element-2 (RP-2) that binds the HOXB9/D10-PBX1b-MEIS/PREP1 complex
and is involved in baseline and cAMP induced renin expression (42, 50). When the RP-2
element is deleted in transgenic mice, renin expression in the kidney is lost, but not in
other tissues (51, 52). This element is thus critical for tissue-specific expression of renin.
8
The HOXB9/D10-PBX1b complex appears to mediate cAMP responsiveness through
binding to CREB since it cannot bind to the site by itself. Furthermore, this complex can
cooperate with Ets and Notch1/CBF1 to activate rat renin promoter activity (53). That
HoxD10 and Notch1 direct promoter activity and are well known developmental
regulators, suggests renin may help determine cell fate. In fact, retinoblastoma
susceptibility protein (RB) can stimulate renin expression in human embryonic kidney
cells through the same binding site as HOXB9/B10 (54). This is of note since human
embryonic kidney cells do not normally express renin. While the HOX and PBX binding
sites appear to be critical for promoter activity across species, other possible cis-elements
have been identified via DNaseI footprinting assays of the human promoter (55, 56). One
of these sites is a CRE that binds ATF1-CREB heterodimer, but it is poorly conserved
across species (57). The other site is for the orphan nuclear receptor Nr2f2 (Coup-tfii,
ARP-1) that negatively regulates human promoter activity (58). However, this site is not
well conserved across species and it has not been determined whether the corresponding
site in the mouse or rat promoters is still capable of binding Nr2f2. The promoter is no
doubt critical for controlling renin, but some evidence reveals that it may only direct cell-
specific expression by interacting with the appropriate combination of cis-elements (59-
61). Initial data suggested that the enhancer identified in As4.1 cells might be the
element to fill this role, but as will be discussed subsequently, this is probably not the
only element responsible.
Renin is under tight transcriptional and post-transcriptional control. Physiological
regulators of renin include perfusion pressure, β-adrenergic stimulation, angiotensin II
negative feedback, and tubuloglomerular feedback. The major intracellular pathways
activated/inhibited by these regulators involve the cAMP pathway and Ca2+. It now
appears that these two second messengers are connected in their modulation of renin by
Ca2+-inhibitable adenylate cyclases V and VI (62, 63). Of note is the observation that
Ang II can inhibit renin exocytosis in isolated perfused kidneys when stimulated through
9
adenylate cyclase with isoproterenol, but not stimulation by 8Br-cAMP. This same study
revealed that angiotensin II activates increases in intracellular Ca2+ in cultured JG cells.
This study provides a direct link to a physiological negative regulator and the signaling
mechanism involved. It does not test effects at the transcript level, but increases in
intracellular Ca2+ have previously been shown to inhibit renin via transcriptional and
post-transcriptional mechanisms (64). Cyclic AMP response element binding protein
(CREB) is a transcription factor target of this pathway and CRE binding sites in the renin
promoter and enhancer play an integral role in renin transcription. However, there exist
CREB independent pathways that activate human promoter activity through the CRE (42,
50, 57). Beyond the cAMP pathway, there is less known about the pathways that link
physiological cues to increases or decreases in renin expression. Evidence does suggest
an important role for the enhancer in mediating negative regulation in response to
cytokines and vitamin D, while regulating positive stimulation by retinoic acid (45, 46,
65). Taken together, the evidence provided above would suggest that the enhancer is a
master regulator of renin.
Studies in vivo where the enhancer has been specifically deleted points us in a
new direction. Two separate models have been developed to study the effects of deleting
the renin enhancer (66, 67). These studies imply that both the human and mouse
enhancers are important for baseline expression, but not for cell- and tissue-specific
expression. The renin enhancer knockout (REKO) mouse provided evidence that the
enhancer is critical for renin expression and regulation, but it fails to use more sensitive
methods for renin detection and specificity of expression. In a separate study using the
REKO mouse, Markus et al. show that there are modest decreases in kidney tissue renin
activity and mRNA (68). Plasma renin activity (PRA) and concentration (PRC) were
also reduced, but did not reach statistical significance. The lack of a more significant
response may be due to positive feedback on renin exerted by the blood pressure decrease
observed in these mice. This region may be of critical importance in the salivary gland
10
and adrenals, as its deletion resulted in almost complete loss of renin in these tissues.
Despite a modest effect on baseline renin, when challenged with a low salt diet combined
with enalapril administration, REKO mice had significantly blunted increases. Perhaps
most interesting was an almost complete absence of kidney renin protein. Although the
mRNA levels in the kidney still increased, it was insufficient to replenish kidney renin
stores in response to the physiological change. This study did not address whether a
partial response was still sufficient to maintain the baseline blood pressure. These results
support the role of the enhancer in regulating not only the baseline activity of the
promoter, but also the transcriptional response to physiological cues and stressors.
Our lab focused on the human enhancer by precisely deleting the enhancer within
a PAC transgene carrying the entire renin gene plus 75 kb upstream and 70 kb
downstream sequences (69). This model is advantageous because of the species-
specificity of the renin-angiotensinogen reaction. Unlike the REKO mouse, knock out of
the human renin enhancer in the PAC model and subsequent decrease in renin expression
would have no impact on the blood pressure because human renin cannot cleave mouse
angiotensinogen. This allows for isolating the effects of deleting the enhancer without
changing the normal physiology of the mouse. Our data showed that normal renin
expression in transgenic mice was retained, albeit at lower levels, and responded
appropriately to captopril treatment (ACE inhibition) as well as angiotensin II infusion.
Our data indicate that the enhancer is required to regulate baseline renin expression, but
is dispensable for cell-specific expression or response to physiological cues.
Data from Ken Gross’s lab using a BAC transgenic with the renin coding region
replaced with GFP largely recapitulates our results (52). Their model targets the 3’
portion of the enhancer containing the three binding sites discussed earlier that are most
critical for its activity (Ee, Ed, Ec). Deletion of this region along with Eb and Ea led to a
large reduction in baseline GFP expression. Unlike our results, they observed a
diminished increase in GFP when mice were given captopril. This may represent a
11
mouse promoter specific response since this is in agreement with the REKO mouse.
Importantly, their data provide in vivo evidence supporting the luciferase experiments
that localize the bulk of enhancer function to the 3’ region containing elements Ea
through Ee.
There is another renin enhancer in the human gene at position -5777 to -5552 that
we have termed the chorionic enhancer (CE). This enhancer was identified by transient
transfection of reporter constructs in choriodecidual cells (70). It induced a 59-fold
increase in promoter activity in choriodecidual cells, but a much less robust 6-fold
increase in As4.1 and Calu-6 cells. There is a SNP downstream of this enhancer that
mediates differential activation of the promoter in transient transfection reporter gene
analysis in choriodecidual cells (71). The region containing the SNP does bind proteins
from choriodecidual nuclear extracts, but the SNP has little impact in patients (72). What
transcription factors and binding sites regulate promoter activity through this element
remains to be determined. Our lab deleted this element in PAC transgenic mice and
found no change in the regulation of kidney or placental renin expression (73).
Additionally, its deletion had no effect on the expression of the nearby KISS gene. This
was tested because the KISS gene is expressed highly in placenta, and thus we
hypothesized that perhaps the CE is not an upstream enhancer for renin but a downstream
enhancer of KISS. These data would suggest that this element plays no role in renin
expression.
Post-transcriptional regulation
The first analysis of post-transcriptional regulation of renin was performed in
native juxtaglomerular cells. Renin mRNA half-life was measured to be 3 hours, but
when treated with forskolin it increased more than 3-fold to almost 11 hours (74). Post-
transcriptional regulation of the renin gene was not well studied until the renin response
to forskolin in the lung carcinoma cell line Calu-6 was tested. Lang et al. observed that
12
transfected human renin promoter transcription reporter constructs were not significantly
induced upon forskolin treatment despite a robust response of the steady state mRNA
(75). Similar experiments from Florence Pinet’s lab largely supported this result (76).
Nuclear run-on analysis from Lang et al. indicated only a small increase in transcription
al activity after 1 hour of forskolin treatment, but none after 24 hours. They concluded
that stimulation of the cAMP pathway in these cells led primarily to increases in mRNA
stability rather than transcriptional activity. Sinn et al. went on to show that the increase
in half-life was so great that there was no decay in renin mRNA 60 hours following
pretreatment with forskolin (77). The difference in stability was not due to a different 5’
or 3’ UTR found in Calu-6 cells than that in the kidney mRNA. These results indicate
that the regulation of renin expression in these cells is almost entirely post-
transcriptional. Although not an optimal cell line for investigating renin transcription,
others have used it to identify RNA-binding proteins that regulate mRNA stability.
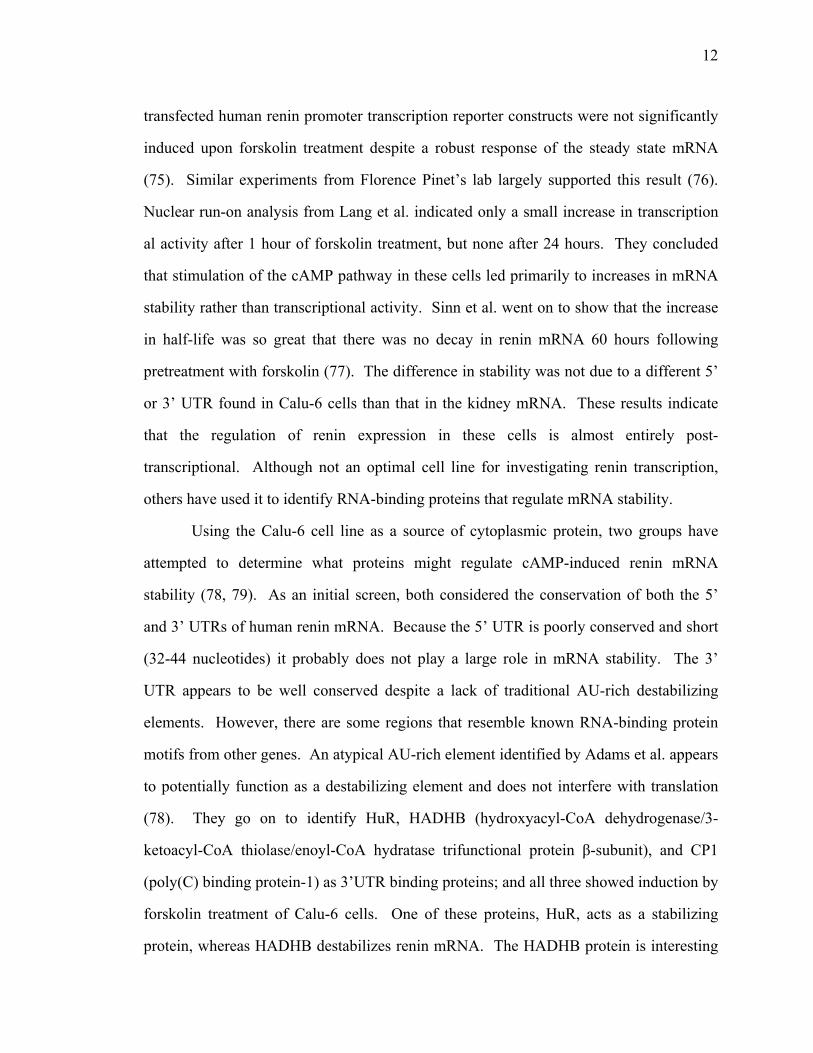
Using the Calu-6 cell line as a source of cytoplasmic protein, two groups have
attempted to determine what proteins might regulate cAMP-induced renin mRNA
stability (78, 79). As an initial screen, both considered the conservation of both the 5’
and 3’ UTRs of human renin mRNA. Because the 5’ UTR is poorly conserved and short
(32-44 nucleotides) it probably does not play a large role in mRNA stability. The 3’
UTR appears to be well conserved despite a lack of traditional AU-rich destabilizing
elements. However, there are some regions that resemble known RNA-binding protein
motifs from other genes. An atypical AU-rich element identified by Adams et al. appears
to potentially function as a destabilizing element and does not interfere with translation
(78). They go on to identify HuR, HADHB (hydroxyacyl-CoA dehydrogenase/3-
ketoacyl-CoA thiolase/enoyl-CoA hydratase trifunctional protein β-subunit), and CP1
(poly(C) binding protein-1) as 3’UTR binding proteins; and all three showed induction by
forskolin treatment of Calu-6 cells. One of these proteins, HuR, acts as a stabilizing
protein, whereas HADHB destabilizes renin mRNA. The HADHB protein is interesting
13
because of its specific localization in the JG apparatus. However, the role of HADHB in
JG cells has yet to be directly tested.
Skalweit et al. were able to identify six proteins that can bind to the renin mRNA
3’ UTR. These include: heterogeneous nuclear ribonucleoproteins hnRNP E1 and
hnRNP K (poly(C) binding proteins), dynamin, nucleolin, YB-1, and MINT-homologous
protein. Upon treatment of Calu-6 cells with forskolin, hnRNP E1, dynamin, nucleolin,
and YB-1 protein expression were all upregulated. Because all of the proteins identified
by these groups are induced by the cAMP pathway, it is difficult to know which of these,
if any, is participating in the stabilization of renin mRNA following activation. There is
no compelling evidence for increased 3’UTR binding after forskolin treatment in Calu-6
cells from either group. However, dynamin has been found to be downregulated by
increases in intracellular Ca2+ in As4.1 cells (64). Knockdown of dynamin in As4.1 cells
leads to a large decrease in steady state renin mRNA. Given the link between Ca2+ and
cAMP in renin expressing cells, it is reasonable to speculate that dynamin serves as the
link between the cAMP pathway and mRNA stability. However, it seems counter-
productive to control post-transcriptional regulation of one gene through transcriptional
regulation of another. The only related proteins identified by both groups are the
poly(C)-binding proteins hnRNP E1, hnRNP K, and CP-1. These proteins function in
mRNA stabilization, splicing, and translational regulation (80). There is therefore
potential for regulation by these proteins at other levels of post-transcriptional processing
such as splicing and translation.
Regulation of Renin Secretion
The same signals that stimulate or inhibit renin transcription also affect renin
secretion. Renin is first translated into preprorenin, containing a signal peptide which
directs the protein into the secretory apparatus. In the endoplasmic reticulum, the signal
sequence is removed. Prorenin then moves to the Golgi apparatus where it can be
14
glycosylated and sorted into the regulated pathway. The prosegment is then cleaved
inside the granule to form active renin. Constitutive and regulated pathways contribute to
the secretion of renin. The regulated pathway is controlled by a protein kinase A
dependent mechanism mediated by increases in cAMP (81). Those increases in cAMP
can be controlled by adenylate cyclase activation or phosphodiesterase inhibition (82).
As mentioned previously, increases in intracellular Ca2+ paradoxically inhibit renin
secretion. Renin and parathyroid hormone are the only two secreted proteins known to
be inhibited by increases in Ca2+. There is now evidence to suggest that Ca2+ inhibition
of renin secretion can be controlled by the calmodulin-calcineurin pathway which is
independent of PKA (83).
Sorting into the regulated pathway is dependent upon the presence of the
prosegment and a dibasic pair of amino acids at position 42-43 (84). This dibasic amino
acid pair seems to be the target of a processing enzyme important for renin’s sorting in
the secretory pathway. The prosegment does, however, contribute to the processing
controlled by the amino acid pair (85). It is the absence of the signal peptide and one-
third of the prosegment in the exon-1b and exon-1c renin isoforms that have led to the
hypothesis that these represent intracellular forms. Transient transfection of the exon-1b
cDNA into cells led to intracellular retention of active renin protein (86). The
glycosylation of renin is important for sorting as well. We know this because the Ren-2
protein lacks three asparagine residues that serve as glycosylation sites in Ren-1. In mice
with Ren-1 knocked out but Ren-2 preserved, JG cells completely lack secretory granules
(87). The phenotype was rescued only when Ren-1 knock out mice were backcrossed to
a BAC transgenic with Ren-1 and Ren-2, but not Ren-2 alone (88). For some reason, the
sorting of renin into the regulated pathway is rather inefficient because only ~25% of the
prorenin is directed into that pathway, while 75% is secreted without further processing
by the constitutive pathway (89).
15
Although understanding the renin secretory pathway is important for determining
how its release is controlled, it probably does not play a major role in how much is
released. The number of granules per JG cell does not vary under physiological
conditions that stimulate renin secretion (90). Long term regulation seems to favor
recruitment of more renin expressing cells rather than modification of granule
morphology or amount of release per cell (91-94). Although renin content per cell is not
altered, the level of renin mRNA per cell, the number of JG apparatuses, and the number
of cells expressing renin is increased (95). This recruitment of renin expressing cells is
an interesting phenomenon. As discussed in the next section, cells which express renin
during development apparently retain their ability to express renin and are recruited do so
under conditions when homeostasis is threatened. The constitutive pathway responsible
for prorenin release is tied to the transcriptional activity and post-transcriptional
regulation of the gene. During an acute stimulus the levels of active renin increase
whereas there is no change in prorenin (96). Thus, regulation of renin secretion is
controlled primarily by the regulated pathway. A long term stimulation results in an
increase in both prorenin and active renin indicating that the synthesis of renin (i.e. renin
expression) plays a more important role when renin secretion is chronically stimulated.
Development of the Renin Expressing Cell
Renin is absolutely essential for the normal development of the kidney. Renin
knockout mice die between birth and weaning due to severe renal defects and impaired
electrolyte retention. The survival of knockout mice must be rescued by saline injection
of neonates (37). These mice have no detectable angiotensin I or II, kidney fibrosis,
hydronephrosis, shrinkage of the tubules, and hypertrophy of the renal arterials. As
expected, they are hypotensive and unable to concentrate their urine. The phenotype of
these mice is similar to that of Potter’s syndrome (tubular dysgenesis) patients, a subset
of which have mutations in the renin gene that result in a lack of expression or inactive
16
protein (35). Mutations in other components of the RAS, including ACE,
angiotensinogen (AGT), and Ang II receptor (ATR) were also discovered. Patients with
mutations in these genes had renin expression in the mesangial cells and arteriolar
smooth muscle cells whereas it is normally restricted to the JG cells. This recapitulates a
phenomenon observed in animals treated with ACE inhibitors or ATR antagonists as well
as fetuses exposed to them (95, 97, 98). Indeed, one of the problems with pre-eclampsia,
a syndrome of hypertension during pregnancy, is that the patients cannot be treated with
ACE inhibitors or ARB, as these will affect renal development in the fetus. This has
been described as a recruitment or de-differentiation of cells that do not normally express
renin but retain the capacity to do so. Recruitment occurs due to a lack of negative
feedback, such as Ang II action, or presence of a positive stimulus like decreased
perfusion pressure in an attempt to maintain homeostasis. The pattern of expression
observed is akin to that seen during kidney development where renin is expressed
throughout the arterial tree of the kidney (99). As kidney development progresses, renin
expression becomes gradually restricted to the smaller vessels until it is localized to the
JG cells in the adult kidney. Recruitment of renin expressing cells under threatened
homeostasis reverses this pattern. What determines renin cell fate and what signals
control the recruitment of non-renin expressing cells has become an area of focus to
better understand the control of renin expression.
Renin expression can first be observed in the metanephric mesenchyme of the
embryonic kidney. Importantly, this is before kidney vascularization has occurred and
the renin cells do not yet express endothelial or smooth muscle cell (SMC) markers
(100). At embryonic day 16 (E16) renin cells acquire SMC, but not endothelial markers.
This indicates that renin cells are a precursor for SMCs in the kidney. However, they are
not the only source as there are SMCs in the metanephric kidney that do not express
renin. Lineage tracing reveals that renin expressing cells can give rise to smooth muscle
cells, extraglomerular and intraglomerular mesangial cells, cells of Bowman’s capsule,
17
and proximal tubule cells (101). The same cells labeled by lineage tracing but no longer
expressing renin stained positive for renin when mice were subjected to low sodium diet
plus ACE inhibition. Therefore, all cells that once expressed renin were capable of being
recruited under conditions of threatened homeostasis.
What molecular signals are responsible for the development of the renin
expressing cell and its restriction to the JG apparatus under normal conditions?
Intercellular communication mediated by gap junctions is playing a critical role.
Connexins 40, 43, and 37 are all expressed in JG cells (102). Another, connexin 45, is
restricted to the vascular smooth muscle cells in the adult kidney, but is co-expressed
with renin in cells during development. It has also been detected in the glomerulus and
mesangium (103). Connexin 40 expression is found in endothelial cells of the kidney
vasculature along with the intraglomerular and extraglomerular mesangium (102, 104).
Their localization may provide important information regarding their role in controlling
renin expression and localization.
Connexin 40 is necessary for the proper localization of renin expression in the
adult kidney. In connexin 40 global knockout mice (Cx40-KO) renin is found aberrantly
expressed along the afferent arteriole and in the extraglomerular mesangium (105).
Global knockout of connexin 40 results in hypertension and increased PRA as a result a
lack of negative regulation by increased perfusion pressure and AngII (106, 107). In fact,
isolated perfused kidneys from connexin 40 knockout mice show a paradoxical induction
in renin secretion rate when perfused with AngII. The lack of negative regulation
appears to be due to the absence of a response to extracellular calcium. This suggests
that the signal initiated by a reduction in extracellular calcium is not being transmitted to
the JG cells. The lack of a baroreceptor response is dependent on the presence of
connexin 40 in the JG cells rather than the endothelial cells (104). There is also a defect
in TGF inhibition of renal blood flow in Cx40-KO mice that is probably a reflection of its
loss in the extraglomerlular mesangium (108). Connexin 45 also appears to transmit a
18
negative regulatory signal as well. Knockout of connexin 45 in the vasculature of the
kidney results in an increase in renin and blood pressure (103). Vascular smooth muscle
cells from those knockout kidneys were found to transmit Ca2+ waves at a slower rate.
The role of connexin 43 is less well characterized, but it may propagate a positive
stimulus for renin secretion and expression in response to a decrease in perfusion
pressure (109). Lack of this connexin abrogated the increase in renin expression and
secretion in response to decreases in perfusion pressure. Again, Ca2+ appears to play an
integral role in renin expression and the recruitment of renin expressing cells. Connexins
may play an important role in transmission of calcium fluxes from cell to cell in response
to physiological cues.
Given the integral role of cAMP in the control of renin expression and secretion it
should come as no surprise that it is also involved in renin cell development and
recruitment. Using a dual fluorescent reporter mouse, Pentz et al. were able to isolate
cells of the renin cell lineage from renal arterial smooth muscle (110). Forskolin
induction of the cAMP pathway was capable of inducing renin expression and increased
histone acetylation around the promoter. Therefore, non-renin expressing cells of the
renin cell lineage maintain the ability to re-express renin upon stimulation of the cAMP
pathway. The histone acetylation is most likely mediated by CBP/p300 recruitment by
cAMP stimulated PKA phosphorylation of CREB and its subsequent binding to CREs in
the promoter and/or enhancer. In fact, CBP/p300 are absolutely essential for the
development of the renin expressing cell (111). Given the importance of Ca2+ in
controlling the production of cAMP in renin expressing cells it is not a stretch to assume
that the Ca2+ signals likely to be transmitted by connexins is modulating the recruitment
of non-renin expressing cells during threatened homeostasis.
19
Figure 1-1. Alignment of mouse and human enhancer.
Numbers indicate the position relative to the transcription start site. Mouse enhancer binding elements are labeled with their corresponding transcription factor indicated to the right. The HRE is boxed.
20
CHAPTER 2
CONTROL OF RENIN EXPRESSION BY NUCLEAR RECEPTORS
Introduction
Nuclear receptors are a specific class of the transcription factor family that share
a number of structural features. These features include (from N-terminus to C- terminus)
the transactivation domain (AF-1), a DNA binding domain (DBD), and a C-terminal
ligand binding domain (AF2). The AF-1 domain sequence varies the most between
nuclear receptors and sometimes serves as a recognition signal for co-activators and other
transcription factors. This domain can also serve as a site for post-translational
modifications that control nuclear receptor activity. The DBD contains two zinc finger
motifs that are involved in DNA binding but can also serve a role in dimerization with
other nuclear receptors and post-translational modifications. Nuclear localization signals
(NLS) can also be contained within the DBD. The AF2 domain serves as the ligand
binding site, binds co-regulators, serves as a site for dimerization with other nuclear
receptors, and contains NLSs. There are no known ligands of any kind for 20 of the 48
known human nuclear receptors which are therefore called “orphan” receptors. The other
nuclear receptors have either an endogenous or synthetic ligand that activates their
activity.
Nuclear receptors control cell responses by a variety of methods. Nuclear
receptors bind to DNA via variations of the RGGTCA sequence, also called the hormone
response elements (HREs). These response elements can form direct repeats, inverted
repeats, or everted repeats separated by different lengths of spacer. The nuclear receptors
can bind these elements as monomers, homodimers, or heterodimers. When bound to
DNA they can recruit co-regulators that can modify chromatin or other transcription
factors and interact with the general transcription machinery. However, their function
can be exerted through other mechanisms. Some exert their function independent of
21
direct DNA binding through transrepression. Others have been shown to have non-
genomic effects by interacting with signal transduction pathways (112-114).
The regulation of nuclear receptor function is not just controlled by the presence
or absence of ligand. Control of nuclear receptors themselves can be through the nature
of the element to which they bind or post-translational modifications like
phosphorylation, sumoylation, and ubiquitination. These then affect their interactions
with co-regulators or other transcription factors and/or DNA binding.
Because of their diverse control and function, nuclear receptors have been the
target of much research in transcriptional regulation and how those signals control
physiology. They also are attractive for drug development because of their ability to be
controlled by ligands. Orphan nuclear receptors are particularly interesting because they
control a variety of physiological functions yet lack any known ligand. Some may lack a
ligand altogether, but others may provide a novel link between physiological cues and
responses involved in disease.
Because of the presence of an HRE within the renin enhancer, our lab has been
interested in determining what nuclear receptors might regulate renin expression. We
have hypothesized that one of the nuclear receptors that bind to the HRE is responsible
for the robust induction of the promoter. Despite the identification of at least four nuclear
receptors (RAR, RXR, EAR2, and PPARγ) that can bind to the HRE and regulate renin
expression, none of them have the large impact on renin expression that would be
expected based on promoter activity assays. We have previously identified and
characterized Nr2f6 as a negative regulator of the renin promoter. Additionally, As4.1
cell nuclear extracts result in four HRE shift complexes in electrophoretic mobility shift
assays that cannot be completely accounted for by RAR, RXR, and Nr2f6 (115, 116).
Using the same yeast one-hybrid screen that identified Nr2f6, we identified another
orphan nuclear receptor, Nr2f2 (Arp-1, Coup-TFII). This receptor is a member of the
same group of nuclear receptors (subfamily 2) and is thus closely related to Nr2f6.
22
Because Nr2f6 (EAR-2) is a negative regulator of the renin promoter, we hypothesized
that Nr2f2 (Coup-TFII) would be as well. We also wanted to determine the role of Nr4a1
(Nur77) and Nr4a2 (Nurr1), which were found to be expressed in As4.1 cells and
identified in a BLAST search of orphan nuclear receptors to have homology with Nr2f6.
Methods
RT-PCR
As4.1 total RNA was isolated using the PurelinkTM RNA Mini Kit. After RNA
isolation, 1 µg was reverse transcribed using 200 units of Superscript III in a 20 µl
reaction (Invitrogen). Reactions were incubated at 50°C for 30 minutes, 55°C for 15
minutes, 60°C for 15 minutes, and 70°C for 15 minutes to inactivate the reaction.
Orphan receptor cDNAs were amplified using AmpliTaq Gold (Applied Biosytems) with
1X PCR buffer containing 1.5 mM MgCl2. See Table 3-1 for primer sequences.
cDNA Expression Plasmids
Expression plasmids were constructed using cDNAs for Nr2f2, Nr4a1, and Nr4a2.
The cDNAs were obtained by reverse transcription of As4.1 totRNA isolated using the
PurelinkTM RNA Mini Kit. They were PCR amplified using HiFi Platinum Taq
Polymerase (Invitrogen) using primers designed at the translation start and termination
codons. Amplified cDNAs were TOPO cloned into pCR2.1 (Invitrogen) and
subsequently clone into pcDNA3.1(+) (Invitrogen).
Luciferase Assay
As4.1 cells (ATCC CRL2193) were split and transfected the following day using
a 3:1 ratio of Fugene 6 (Roche) to plasmid DNA. One microgram of m4.1kP-luc (117)
and 1 ng phRL-TK (Promega) were included in all transfections. Each well was
transfected with 1 µg cDNA or shRNA expression plasmid corresponding to the specific
23
nuclear receptor. Forty-eight hours post-transfection cells were lysed and extracts
analyzed using Promega’s Dual-Luciferase Assay System.
Orphan Nuclear Receptor Knockdown
Adenoviruses expressing shRNA to GFP, Nr2f2, and Nr2f6 were constructed and
tested as previously described (118, 119). As4.1 cells were infected at 60% confluency
using an MOI of 100, 24 hours after being split into 6-well dishes. Adenovirus and
polybrene (5µg/ml; Millipore) were mixed in serum free DMEM and added to duplicate
wells for each shRNA. After a six hour incubation, cells were washed and complete
DMEM (10% FBS, 100 U/ml penicillin, 100 mg/ml streptomycin) was added. Forty-
eight hours later, total RNA was isolated using the PurelinkTM RNA Mini Kit and protein
extracted using RIPA buffer (50 mM Tris-Cl pH 7.4, 150 mM NaCl, 1% NP-40, 0.5%
Sodium deoxycholate, 0.1% SDS).
The cDNA was obtained as indicate above, diluted 1:20, and gene expression was
measured using Taqman® Gene Expression Master Mix (Applied Biosystems) and
Taqman® probes or iQ SYBR Green Supermix (Bio-Rad) and primers. Nr2f2, Nr2f6, and
Nr4a1 probes were from Applied Biosystems as listed on the Nuclear Receptor Signaling
Atlas website (www.nursa.org, Table 3-1). The renin (Mm02342888_gH) and β-actin
probes (4352933E) were from Applied Biosystems. Data was analyzed using the 2-∆∆Ct
method to calculate fold changes relative to shGFP samples. Assay PCR efficiency was
determined to be 90-105% using a 7-log serial dilution series of the cDNA samples.
Protein extracts were quantified and 10 µg of each were mixed with SDS sample
buffer. Samples were loaded and run on 10% SDS-PAGE gels, transferred to PVDF
(Millipore), and probed for renin (Santa Cruz; sc-22671), Nr2f2 (Perseus Proteomics; PP-
H7147-00), and actin (Abcam; ab1801). Horseradish peroxidase conjugated secondary
antibodies included the Goat TrueBlot® (eBioscience; 18-8814) for renin blots, the ECL
24
anti-Mouse IgG (GE Healthcare; NA931) for Nr2f2 blots, and the ECL anti-Rabbit IgG
(GE Healthcare; NA-934) for actin blots.
Electrophoretic Mobility Shift Assay and Supershift Assay
Electrophoretic mobility shift assays (EMSA) were carried out using double
stranded DNA probes corresponding to the HRE were designed with 5’-GATC overhangs
and labeled using [α-32P]dATP. The wild-type HRE sequence is 5’-
GATCTGGTGACCTGGCTGTACTCTGACCTCTCAGAT-3’ and mutant probes µb:
5’-GATCTGGTGACCTGGCTGTACTCTTTCCTCTCAGAT-3’, µc: 5’-GATCTGGTT
TCCTGGCTGTACTCTGACCTCTCAGAT-3’, µbc: 5’-GATCTGGTTTCCTGGCTGT
ACTCTTTCCTCTCAGAT-3’. In vitro translated proteins were generated using the
TNT® Quick Coupled Transcription/Translation System (Promega). Parallel reactions to
assess protein production were run in which proteins were labelled using 35S-Methionine.
Probes were incubated at room temperature for 30 minutes with 1 µl of unlabeled
in vitro translated protein or 6 µg of As4.1 nuclear extract in Tris binding buffer (10 mM
Tris-Cl pH 7.4, 1 mM EDTA pH 8.0, 60 mM KCl, 10 mM DTT, 0.1% Triton X-100, 4%
Glycerol) with 1 µg poly[d(I-C)]. Binding reactions were loaded onto 5% native
polyacrylamide gels and run for 2 hours. Gels were dried, exposed to phospho-screens
overnight, and scanned using a Molecular Dynamics Storm 840. Supershift analysis was
performed by adding 1 µg of the appropriate antibody after the initial incubation period
for 15 minutes on ice prior to electrophoresis.
DNA Affinity Purification Assay
DNA affinity purification assays were carried out with slight modifications as
described by Mittler et al. using Biotin-TEG 5’-labeled double-stranded DNA probes
(120, 121). The sequence for the WT probe was 5’-CAAAACTGCAGGATGGTGACC
TGGCTGTACTCTGACCTCTCAGAT-3’ and for the mutant probe was 5’- CAAAACT
GCAGGATGGTTTCCTGGCTGTACTCTTTCCTCTCAGAT-3’. Nuclear extracts from
25
As4.1 cells (40 µg) were mixed with 80 pmol of double stranded probe in the same
binding buffer as that used in EMSAs with protease and phosphatase inhibitors (Roche),
plus 4 µg poly[d(I-C)] (Roche) for a total binding reaction of 40 µl. Nuclear extract and
probe were incubated on ice for 30 minutes followed by addition of 50 µl of streptavidin
conjugated Dynabeads® MyOne™ C1 (Invitrogen). Following a 90 minute incubation at
4°C while rotating, beads were collected using the DynaMag™-2 magnet (Invitrogen)
and washed three times with binding buffer. Beads were subsequently boiled, separated,
and extracts loaded onto a 10% SDS-PAGE gel. Western blots were probed for Nr2f2
and Nr2f6 (Abcam, ab65012).
Chromatin Immunoprecipitation
Chromatin immunoprecipitation (ChIP) was performed as described in the EZ-
ChIP (Millipore) kit manual. Briefly, chromatin extracts from As4.1 cells were subjected
to sonication using a Fisher Scientific Sonic Dismembrator Model 500 at an amplitude of
40% for 10-15 cycles of 10 seconds on and 10 seconds between each pulse. Sheared
chromatin was subjected to immunoprecipitation using 5 µg of the antibodies indicated
previously along with 1 µg of IgG provided with the kit. Immunoprecipitated chromatin
was subjected to PCR for 30 cycles using primers flanking the HRE (5’- TTGGACCCTC
TCCATTCCTTCACG-3’, 5’- ATGCGCTATCACAACCAGCCACTC-3’) and a region
in intron 5 (5’- ATTTGAGGGTGGGAAGGAAGG-3’, 5’- ATGAACTGGAAGAGGAC
CGAG-3’) of the renin gene.
Immunofluorescence
As4.1 cells were grown to 80% confluency in 24-well dishes with 12 mm #1
coverslips. Cells were washed with PBS and fixed for five minutes in PBS with 1%
Triton X-100 and 3.7% formaldehyde. They were subsequently washed three times in
PBS with 0.1% BSA. Cells were permeabilized and blocked for 1 hour at room
temperature in blocking buffer (1X PBS, 1% BSA, 5% goat serum, 0.2% Tween 20, 0.2%
26
NP-40) with slight agitation. Coverslips were washed and incubated with primary
antibody (1:100 dilution α-Nr2f2 and α-Nr2f6 and 1:50 dilution Nr4a1 (Santa Cruz; sc-
7014)) in blocking buffer overnight at 4°C. After washes, cells were incubated for 1 hour
with secondary antibody (goat anti-rabbit Alexa Fluor 586 or anti-mouse Alexa Fluor
488; 1:200 dilution) in blocking buffer. Cells were washed and mounted with
Vectashield with DAPI or incubated with 10 µM TOPRO3 for 15 minutes. Coverslips
incubated with TOPRO3 were washed and mounted with Vectashield for fluorescence.
Cells were imaged and observed using a Nikon Eclipse E600 fluorescent scope equipped
with a SPOT advanced digital camera (Diagnostic Instruments, Inc.)
Results
Initially, the HRE was shown to be a response element that RAR/RXR could bind
to and mediate the induction of renin expression by retinoic acid. We now recognize it as
an element that can bind several other nuclear receptors that regulate the renin promoter.
Previously, we identified Nr2f2 and Nr2f6 as HRE binding proteins using the HRE as
bait in a yeast one-hybrid screen. Nr2f6 was further characterized to act as a negative
regulator of the renin promoter via binding to the HRE in the enhancer. However, Nr2f6
only accounted for one of at least four proteins that could complex with the HRE and the
role of Nr2f2 was not determined. Here, in order to establish the role of Nr2f2 in
regulating renin expression, we are using Nr2f6 as a positive control.
By searching As4.1 microarray data obtained previously in our lab by Hana Itani
and performing RT-PCR we have identified several nuclear receptors that are expressed.
All of the nuclear receptors tested in my studies were detected via microarray and RT-
PCR (Table 2-2 and Figure 2-1A). Immunofluorescence confirmed the expression of all
three nuclear receptors. Localization of Nr2f2 and Nr4a1 were almost completely
nuclear, while Nr2f6 showed cytoplasmic and nuclear localization (Figure 2-2). The dual
localization of Nr2f6 suggests that it may shuttle between the cytoplasm and nucleus.
27
Quantitative PCR shows that Nr2f2 had the lowest expression level of the three nuclear
receptors tested. The expression level of Nr2f6 was two-fold greater than Nr2f2 and
Nr4a1 was five-fold greater (Figure 2-1B). Thus, several nuclear receptors are found in
As4.1 cells and of the three tested in this study, Nr4a1 has the highest expression level.
In order to test whether Nr2f2 can regulate the mouse renin promoter we
cotransfected cDNA expression vectors for Nr2f2 and Nr2f6 with m4.1kP-luc reporter
vector into As4.1 cells. The m4.1kP-luc vector contains 4.1 kb of the 5’ upstream
sequence of the mouse Ren1 gene driving expression of firefly luciferase.
Overexpression of Nr2f2 led to a 70% reduction in promoter activity compared to the
empty vector control (Figure 2-3A). The overexpression of Nr2f6 and Nr4a1 resulted in
an approximately 44% and 60% reduction, respectively. Another orphan nuclear
receptor, Nr4a2, had no effect on promoter activity. Because overexpression of these
nuclear receptors could force interactions with other proteins or cis-acting elements that
do not normally occur, we performed the reverse experiment where we co-transfected
shRNAs targeting Nr2f2 and Nr2f6 with m4.1kP-luc. Knockdown of Nr2f2 and Nr2f6
produced a greater than 2-fold increase in promoter activity (Figure 2-3B). When Nr4a1
was knocked down it resulted in a surprising decrease in promoter activity. However,
this did not reach statistical significance. The data here suggest that Nr2f2 has the
potential to negatively regulate the mouse renin promoter and supports our previous data
for Nr2f6. In contrast, Nr4a1 exerts opposite effects when overexpressed or knocked
down.
We next used EMSAs to determine if Nr2f2 could directly bind to the HRE.
When in vitro translated proteins were combined with 32P-labeled HRE probe and
DR1(G) or NBRE control probe, Nr2f2 and Nr2f6 show clear binding to the HRE that is
effectively competed away by excess WT cold probe (Figure 2-4A and 2-4B). In
contrast, Nr4a1 shows no binding to the HRE but does bind the control probe (Figure 2-
4C). We combined equivalent volumes of in vitro translated Nr2f2 and Nr2f6 extracts
28
with the HRE probe to determine if they could heterodimerize to form different shift
complexes. Two specific shift complexes are formed that correspond to the individual
complexes formed when Nr2f2 and Nr2f6 are incubated with the HRE probe alone
(Figure 2-5A). Each complex is effectively competed away by 100 fold excess wild-type
(WT) cold probe. That competition is lost when either half-site (µb or µc) or both (µbc)
are mutated. This suggests that both half-sites are necessary for binding to the HRE and
therefore Nr2f2 and Nr2f6 bind as dimers. This is consistent with the proposed
functional DNA binding form of Nr2f2 (122, 123). However, this does not eliminate the
possibility that Nr2f2 and Nr2f6 cannot bind as monomers, because some competition is
maintained with an intact b site and mutated c site. Therefore, binding to the HRE may
be primarily dependent on a single intact b site suggesting that Nr2f2 and Nr2f6 are
binding as monomers. It has been shown previously that Nr2f2 and Nr2f6 can form DNA
binding heterodimers (124). The top complex was entirely supershifted by the addition
of Nr2f2 antibody, whereas the bottom complex was shifted by Nr2f6 antibody. Neither
antibody supershifted both bands, indicating that Nr2f2 and Nr2f6 do not form
heterodimers when binding to the HRE. However, this does not eliminate the possibility
that they can heterodimerize with other nuclear receptors like RXR. Altogether, these
data indicate that the negative regulation on the renin promoter can be mediated by direct
binding of Nr2f2 and Nr2f6 to the HRE. In contrast, Nr4a1 does not appear to mediate
its effects though direct binding to the HRE. If Nr4a1 can bind to the HRE, it is through
binding to another transcription factor.
To verify that Nr2f2 is one of the proteins from As4.1 cells that forms a complex
with the HRE, we performed the same EMSA analysis with nuclear extracts. As
observed previously, four shift complexes (a, b, c, d) were formed that are effectively
competed away by excess WT probe (Figure 2-5B) (116). Complexes b and c are still
competed away when only one of the half-sites is mutated (µb or µc), but is lost with
mutation of both half-sites (µbc). In contrast, mutant half-site probes are less effective
29
competitors for unidentified complexes a and d. We hypothesized that complexes b and c
correspond to Nr2f2 and Nr2f6 based on their similarity to the shift complexes formed by
in vitro translated Nr2f2 and Nr2f6. In support of complex c being Nr2f6, the addition of
Nr2f6 antibody resulted in the supershift of complex c and replicates our previous results
(116). However, none of the complexes was supershifted or reduced by addition of
Nr2f2 antibody. Therefore, we performed DNA affinity puridication assays (DAPA) as
an alternative for identifying Nr2f2. Both Nr2f2 and Nr2f6 show clear enrichment for
binding to the WT DAPA probe versus a mutant probe with both half-sites mutated
(Figure 2-5C). Thus, Nr2f2 and Nr2f6 can directly bind to the HRE and may form two of
the four complexes from EMSA.
Whether or not Nr2f2 and Nr2f6 can bind to the enhancer in its native chromatin
context was addressed using ChIP. Both nuclear receptors showed clear enrichment over
IgG immunoprecipitated chromatin. As a positive control, Creb1 antibody was used to
precipitate chromatin and showed enrichment as well. No signal was detected when a
region approximately 10.5 kb downstream of the enhancer in intron 6 was probed,
indicating that the signal was specific for chromatin around the HRE. This indicates that
both Nr2f2 and Nr2f6 can bind to chromatin around the HRE to control renin expression.
Luciferase assays, EMSA, and DAPA all support a mechanism by which Nr2f2
negatively regulates renin expression through its binding to the HRE. We aimed to
substantiate that role further by determining the effect of Nr2f2 knockdown on the
endogenous renin gene in its native genomic and chromatin context. Using the same
shRNAs as used in luciferase assays, we specifically knocked down Nr2f2, Nr2f6, and
Nr4a1 in As4.1 cells and measured renin mRNA levels using qPCR (Figure 2-6A).
Knockdown of Nr2f2 had no effect on baseline renin expression despite a robust
reduction of Nr2f2 mRNA. In contrast, Nr2f6 knockdown resulted in an approximately
1.8-fold increase in renin. The lack of effect on renin expression was not due to the
absence of Nr2f2 protein knockdown, because that mirrored the reduction of mRNA
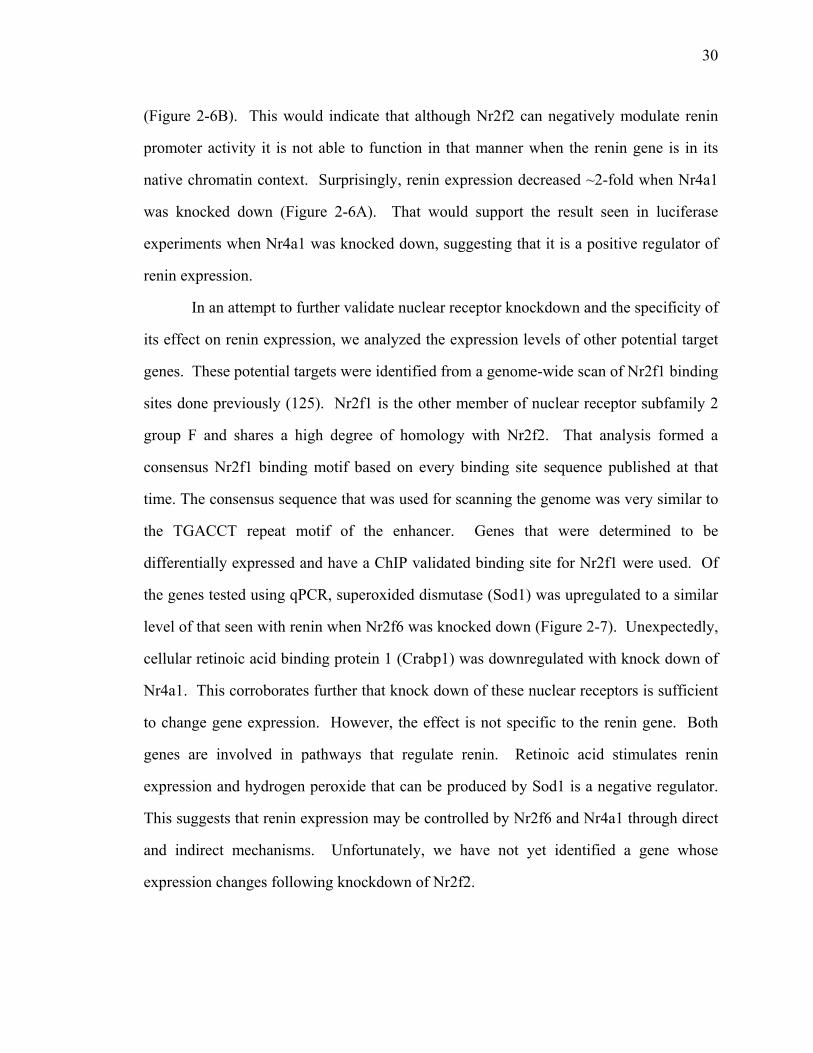
30
(Figure 2-6B). This would indicate that although Nr2f2 can negatively modulate renin
promoter activity it is not able to function in that manner when the renin gene is in its
native chromatin context. Surprisingly, renin expression decreased ~2-fold when Nr4a1
was knocked down (Figure 2-6A). That would support the result seen in luciferase
experiments when Nr4a1 was knocked down, suggesting that it is a positive regulator of
renin expression.
In an attempt to further validate nuclear receptor knockdown and the specificity of
its effect on renin expression, we analyzed the expression levels of other potential target
genes. These potential targets were identified from a genome-wide scan of Nr2f1 binding
sites done previously (125). Nr2f1 is the other member of nuclear receptor subfamily 2
group F and shares a high degree of homology with Nr2f2. That analysis formed a
consensus Nr2f1 binding motif based on every binding site sequence published at that
time. The consensus sequence that was used for scanning the genome was very similar to
the TGACCT repeat motif of the enhancer. Genes that were determined to be
differentially expressed and have a ChIP validated binding site for Nr2f1 were used. Of
the genes tested using qPCR, superoxided dismutase (Sod1) was upregulated to a similar
level of that seen with renin when Nr2f6 was knocked down (Figure 2-7). Unexpectedly,
cellular retinoic acid binding protein 1 (Crabp1) was downregulated with knock down of
Nr4a1. This corroborates further that knock down of these nuclear receptors is sufficient
to change gene expression. However, the effect is not specific to the renin gene. Both
genes are involved in pathways that regulate renin. Retinoic acid stimulates renin
expression and hydrogen peroxide that can be produced by Sod1 is a negative regulator.
This suggests that renin expression may be controlled by Nr2f6 and Nr4a1 through direct
and indirect mechanisms. Unfortunately, we have not yet identified a gene whose
expression changes following knockdown of Nr2f2.
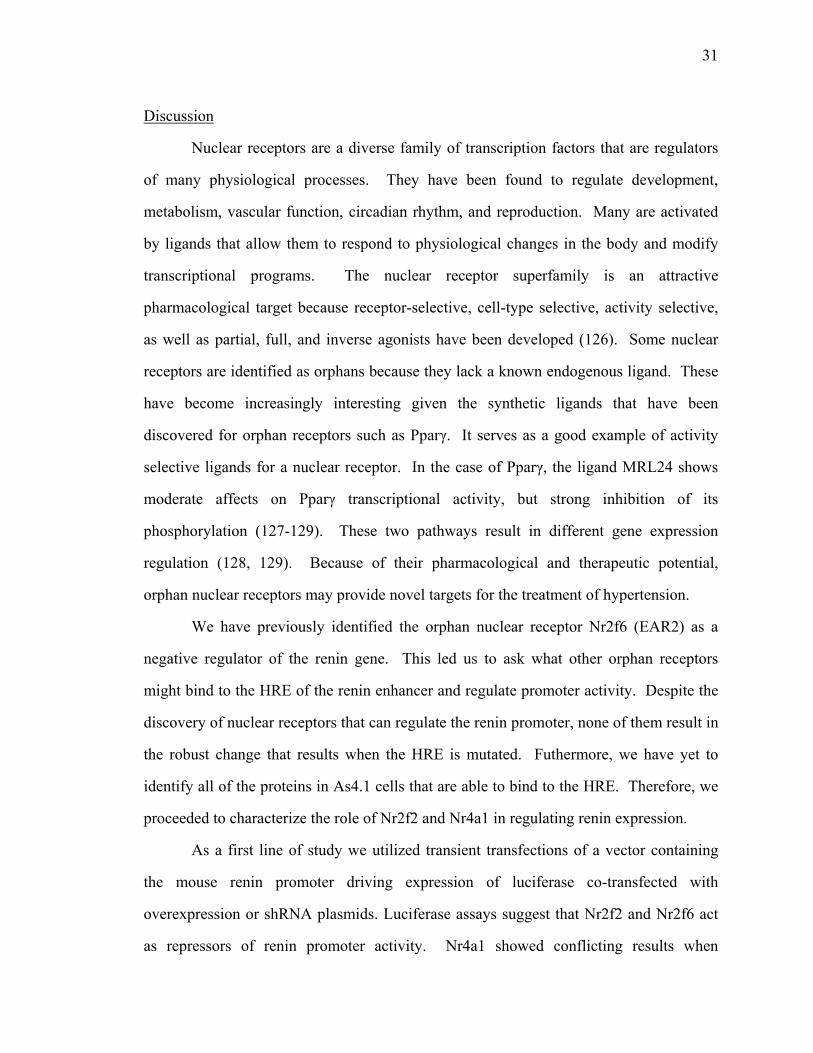
31
Discussion
Nuclear receptors are a diverse family of transcription factors that are regulators
of many physiological processes. They have been found to regulate development,
metabolism, vascular function, circadian rhythm, and reproduction. Many are activated
by ligands that allow them to respond to physiological changes in the body and modify
transcriptional programs. The nuclear receptor superfamily is an attractive
pharmacological target because receptor-selective, cell-type selective, activity selective,
as well as partial, full, and inverse agonists have been developed (126). Some nuclear
receptors are identified as orphans because they lack a known endogenous ligand. These
have become increasingly interesting given the synthetic ligands that have been
discovered for orphan receptors such as Pparγ. It serves as a good example of activity
selective ligands for a nuclear receptor. In the case of Pparγ, the ligand MRL24 shows
moderate affects on Pparγ transcriptional activity, but strong inhibition of its
phosphorylation (127-129). These two pathways result in different gene expression
regulation (128, 129). Because of their pharmacological and therapeutic potential,
orphan nuclear receptors may provide novel targets for the treatment of hypertension.
We have previously identified the orphan nuclear receptor Nr2f6 (EAR2) as a
negative regulator of the renin gene. This led us to ask what other orphan receptors
might bind to the HRE of the renin enhancer and regulate promoter activity. Despite the
discovery of nuclear receptors that can regulate the renin promoter, none of them result in
the robust change that results when the HRE is mutated. Futhermore, we have yet to
identify all of the proteins in As4.1 cells that are able to bind to the HRE. Therefore, we
proceeded to characterize the role of Nr2f2 and Nr4a1 in regulating renin expression.
As a first line of study we utilized transient transfections of a vector containing
the mouse renin promoter driving expression of luciferase co-transfected with
overexpression or shRNA plasmids. Luciferase assays suggest that Nr2f2 and Nr2f6 act
as repressors of renin promoter activity. Nr4a1 showed conflicting results when
32
overexpressed or knocked down as both conditions showed a downregulation of promoter
activity. Nr2f2 and Nr2f6 can directly bind the HRE as indicated in EMSA and DAPA
experiments, but Nr4a1 does not. Luciferase and binding experiments taken together
suggest that the repressor activity of Nr2f2 and Nr2f6 are mediated through the HRE.
However, Nr2f2 and Nr2f6 appear to have divergent effects on baseline endogenous gene
expression. Nr2f2 knockdown did not affect renin expression, whereas Nr2f6
knockdown resulted in an increase. Interestingly, Nr4a1 knockdown resulted in a
decrease in renin expression indicating that it activates renin expression.
The main question that needs to be answered is why Nr2f2 had effects on
transfected promoters but not the endogenous. It is a member of the same subfamily as
Nr2f6 albeit more distantly than the other family member, Nr2f1 (Coup-TFI).
Compensation of Nr2f2 loss by Nr2f1 is unlikely because that would have been observed
in transfection experiments. It will be of interest to investigate the role of Nr2f1 in
regulation of the endogenous renin promoter to examine if the lack of regulation is
common to the two closer related family members. Nr2f6 was in vitro translated at a
much lower efficiency than Nr2f2 and thus smaller amounts were present in the binding
reactions in EMSAs. Despite being at a lower concentration, it showed similar binding
intensity to Nr2f2. The absence of Nr2f2 regulation might be related to the different
binding affinities for the HRE.
The argument could be made that Nr2f2 does not bind to the HRE in the native
chromatin context, but ChIP studies contradict that argument. There is a possibility that
binding detected in the ChIP experiments is at another site in the enhancer. The binding
of Nr2f2 to the early growth response 1 gene (Egr1) promoter is through indirect binding
to Sp1 (130). Therefore, binding to the enhancer might be through the Sp1 site upstream
of the HRE. If that is the case, loss of Sp1 or an additional factor may be required to
unmask a response at baseline. It is also possible that Nr2f2 does not modify baseline
activity but controls induction or repression by a signal that regulates renin. What that
33
signal might be will require further studies examining renin expression responses to
cAMP-PKA pathway stimulation or increases in intracellular Ca2+ with Nr2f2
knockdown. Examination of the crystal structure of Nr2f2 suggests that it is an auto-
repressed conformation but promotes transcription activity in multiple cell lines (122).
Furthermore, mutation of sites responsible for cofactor binding, dimerization, and ligand
binding reduce that transcription activity. These results suggest that there is a ligand for
Nr2f2 that can activate it. It is possible that Nr2f2 is regulated post-translationally, but to
date no modifications have been identified. Despite our finding that Nr2f2 does not
regulate baseline renin expression, it still deserves further attention. Interestingly, genetic
data in humans and Dahl salt-sensitive rats show an association of Nr2f2 with
hypertension (131-134).
My studies further supported the role of Nr2f6 as a negative regulator of renin
expression through binding to the HRE. I replicated both luciferase experiments and
showed that its knockdown resulted in an increase in renin expression. Although this
response is modest, inducing renin gene expression in As4.1 cells has been shown to be
difficult. Forskolin stimulation of renin expression in As4.1 cells requires
phosphodiesterase inhibition. Therefore, renin expression may be nearly maximally
stimulated in this cell line. Nr2f6 knockdown may result in a more robust increase when
the cAMP-PKA pathway is inhibited.
The mechanisms underlying Nr2f6 regulation and the genes which it regulates are
poorly understood. A recent study showed that Nr2f6 binding is inhibited when
phosphorylated by protein kinase C (PKC) (135). Although increases in calcium, which
can activate PKC, play an important role in negatively regulating renin expression, the
phosphorylation of Nr2f6 in As4.1 cells would prevent its binding and negative
regulation of the renin promoter. In that same study, in vitro kinase assays revealed a
phosphorylation of Nr2f6 by PKA. A mechanism by which PKA phosphorylation of
Nr2f6 leads to a decrease in its binding to the HRE and activation of renin expression is
34
an attractive one. In fact, previous studies in our lab show a robust inhibition of
endogenous renin expression when Nr2f6 is overexpressed (116). In that situation Nr2f6
levels may be high enough to provide an unphosphorylated pool capable of binding the
HRE and repressing the renin promoter.
The potential role of Nr4a1 as an activator of renin expression is of particular
interest. Although luciferase assays revealed divergent effects when Nr4a1 was
overexpressed or knocked down, it could be due to the nature of the experiments.
Overexpression might cause Nr4a1 to act as a sink by forming heterodimers with
transcriptional activators it does not normally bind with. In contrast, knock down
decreases its occupancy somewhere on the 5’ upstream sequence. The shRNA
experiments using luciferase assays support the notion that Nr4a1 is a positive regulator
of renin expression. Even though it does not directly bind to the HRE, it remains to be
determined whether it can bind to the enhancer indirectly. Control of renin expression by
Nr4a1 may still be mediated through the HRE by a transactivation pathway. Conversely,
it may bind to an unidentified motif elsewhere in the 5’ upstream sequence of the renin
gene.
Members of nuclear receptor subfamily 4 are unlikely to have endogenous ligands
due to their small binding pocket. However, regulation of their expression and
phosphorylation are important for their function. Their expression is induced by the
cAMP pathway that is so important in renin expression. Furthermore, Ken Gross and
Ariel Gomez have found Nr4a1 to be highly enriched in JG cells (personal
communication). However, my data from As4.1 cells is difficult to interpret given the
higher levels of cell death observed when Nr4a1 is knocked down. This may be due to
the nature of As4.1 cells. The Ren-2 promoter drives expression of T-antigen in these
cells which may be critical for their survival in culture. Thus, removal of an activator of
the renin promoter may result in a loss of T-antigen, loss of cell growth and ultimately
35
cell death. The effect of Nr4a1 does appear to be specific to the renin promoter since
levels of other genes tested in qPCR remain unchanged.
Further attention should be given to Nr4a1, but experiments should be conducted
in another cell line. The renin cell lineage cell line recently isolated by Ariel Gomez’s
lab may be a good model in which to conduct those experiments (129). These cells were
isolated by creating two separate reporter gene mice. One line had Cre recombinase
knocked into the endogenous Ren1d locus and a renin promoter transgene driving
expression of yellow fluorescent protein (YFP). This mouse was crossed with one that
had CFP knocked into the ROSA26 locus. Offspring positive for both transgenes would
express YFP in cells currently expressing renin and any cells that had expressed renin at
one time were marked with CFP. Therefore, cells of the renin lineage were marked with
CFP. The cells were then isolated by FACS sorting. These cells do not expresss renin at
baseline, but maintain their ability to do so upon cAMP induction. Therefore, they are
attractive for studying what signals are responsible for inducing renin expression.
Because Nr4a1 expression is induced by the cAMP pathway and it is enriched in JG cells,
it may participate in activating renin expression in non-renin expressing cells of the renin
lineage and maintenance of renin expressing cells.
In the process of validating knockdown of our nuclear receptors we identified two
other genes that were differentially regulated. By chance, these genes are involved in
pathways known to regulate renin expression. Hydrogen peroxide (H2O2) was found
previously in our lab to negatively regulate renin expression (136). Superoxide
dismutase 1, which was upregulated when Nr2f6 was knocked down, converts superoxide
radicals to oxygen and H2O2. The upregulation of Sod1 would presumably lead to
increases in H2O2 and a decrease in renin expression. This response is contradictory to
what might be expected since Nr2f6 led to an increase in renin expression. Of course, we
do not have any data suggesting that these cells actively generate superoxide, the
precursor to H2O2. In the case of Nr4a1 knockdown, Crabp1 was down regulated. It
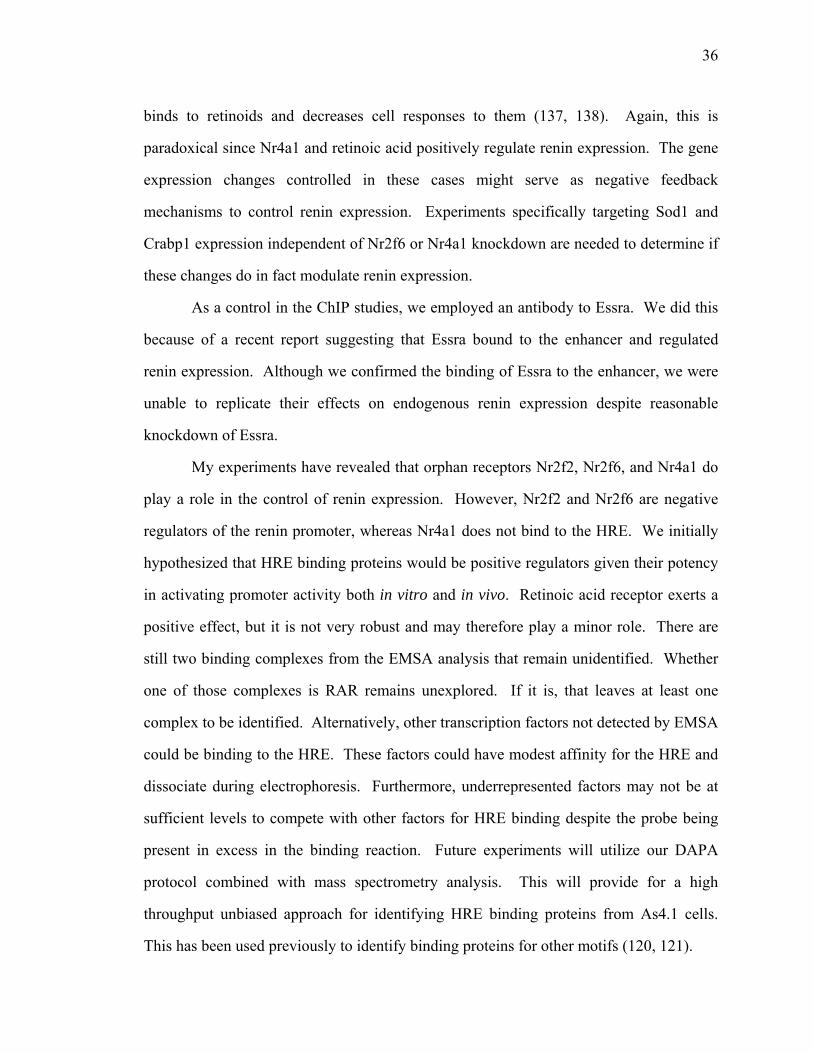
36
binds to retinoids and decreases cell responses to them (137, 138). Again, this is
paradoxical since Nr4a1 and retinoic acid positively regulate renin expression. The gene
expression changes controlled in these cases might serve as negative feedback
mechanisms to control renin expression. Experiments specifically targeting Sod1 and
Crabp1 expression independent of Nr2f6 or Nr4a1 knockdown are needed to determine if
these changes do in fact modulate renin expression.
As a control in the ChIP studies, we employed an antibody to Essra. We did this
because of a recent report suggesting that Essra bound to the enhancer and regulated
renin expression. Although we confirmed the binding of Essra to the enhancer, we were
unable to replicate their effects on endogenous renin expression despite reasonable
knockdown of Essra.
My experiments have revealed that orphan receptors Nr2f2, Nr2f6, and Nr4a1 do
play a role in the control of renin expression. However, Nr2f2 and Nr2f6 are negative
regulators of the renin promoter, whereas Nr4a1 does not bind to the HRE. We initially
hypothesized that HRE binding proteins would be positive regulators given their potency
in activating promoter activity both in vitro and in vivo. Retinoic acid receptor exerts a
positive effect, but it is not very robust and may therefore play a minor role. There are
still two binding complexes from the EMSA analysis that remain unidentified. Whether
one of those complexes is RAR remains unexplored. If it is, that leaves at least one
complex to be identified. Alternatively, other transcription factors not detected by EMSA
could be binding to the HRE. These factors could have modest affinity for the HRE and
dissociate during electrophoresis. Furthermore, underrepresented factors may not be at
sufficient levels to compete with other factors for HRE binding despite the probe being
present in excess in the binding reaction. Future experiments will utilize our DAPA
protocol combined with mass spectrometry analysis. This will provide for a high
throughput unbiased approach for identifying HRE binding proteins from As4.1 cells.
This has been used previously to identify binding proteins for other motifs (120, 121).
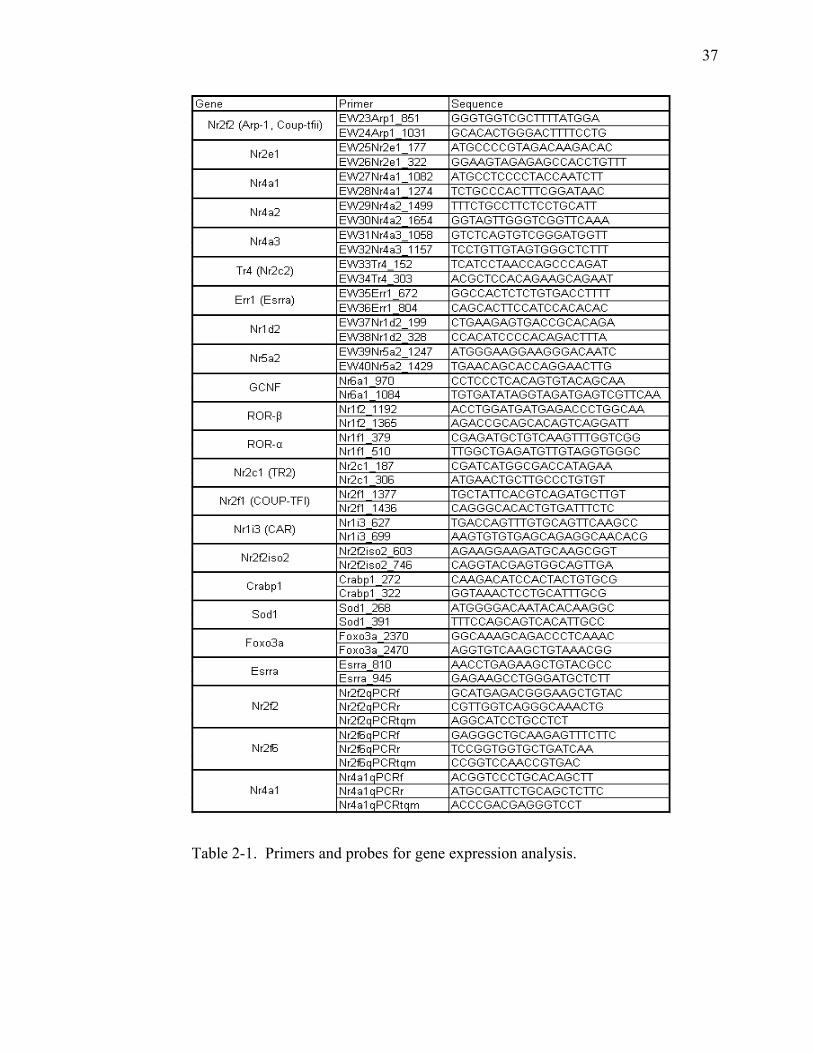
37
Table 2-1. Primers and probes for gene expression analysis.
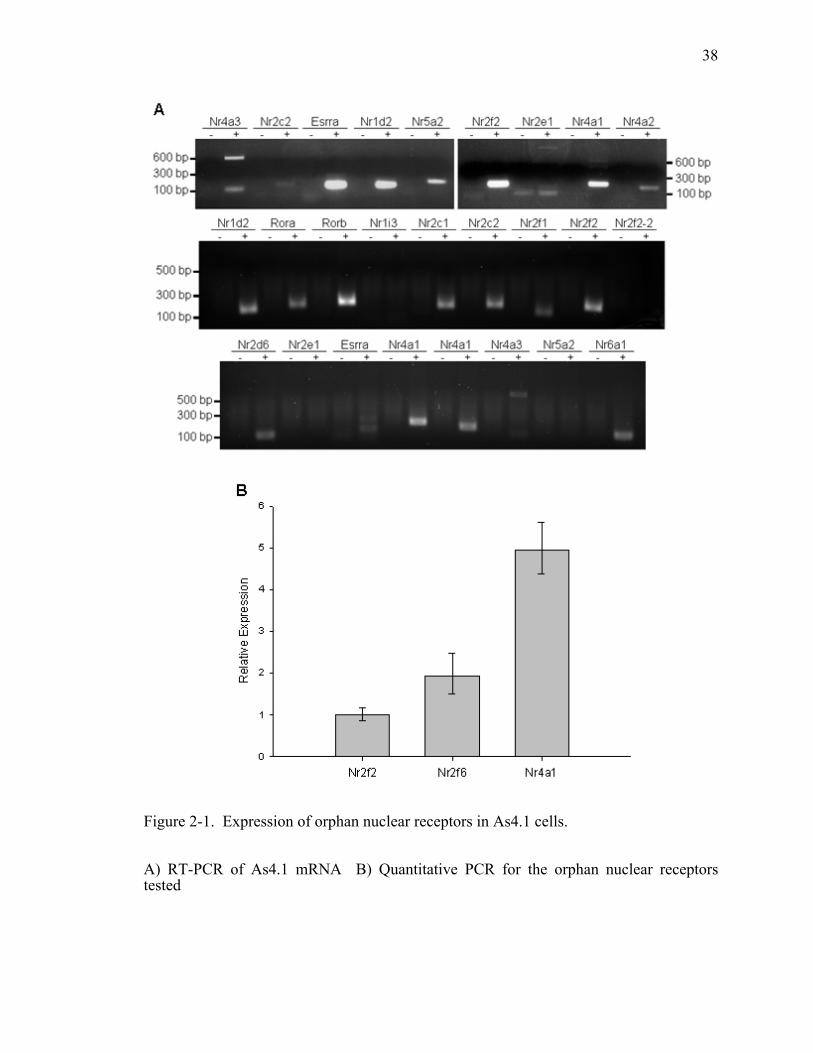
38
Figure 2-1. Expression of orphan nuclear receptors in As4.1 cells.
A) RT-PCR of As4.1 mRNA B) Quantitative PCR for the orphan nuclear receptors tested
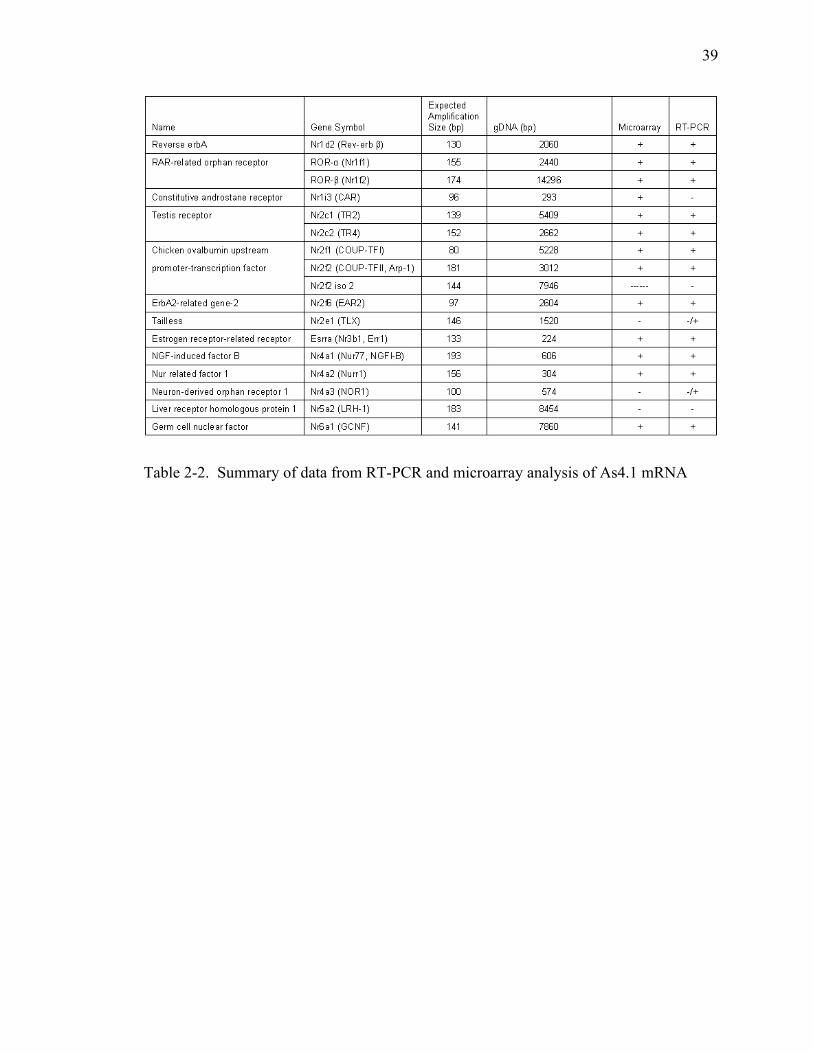
39
Table 2-2. Summary of data from RT-PCR and microarray analysis of As4.1 mRNA
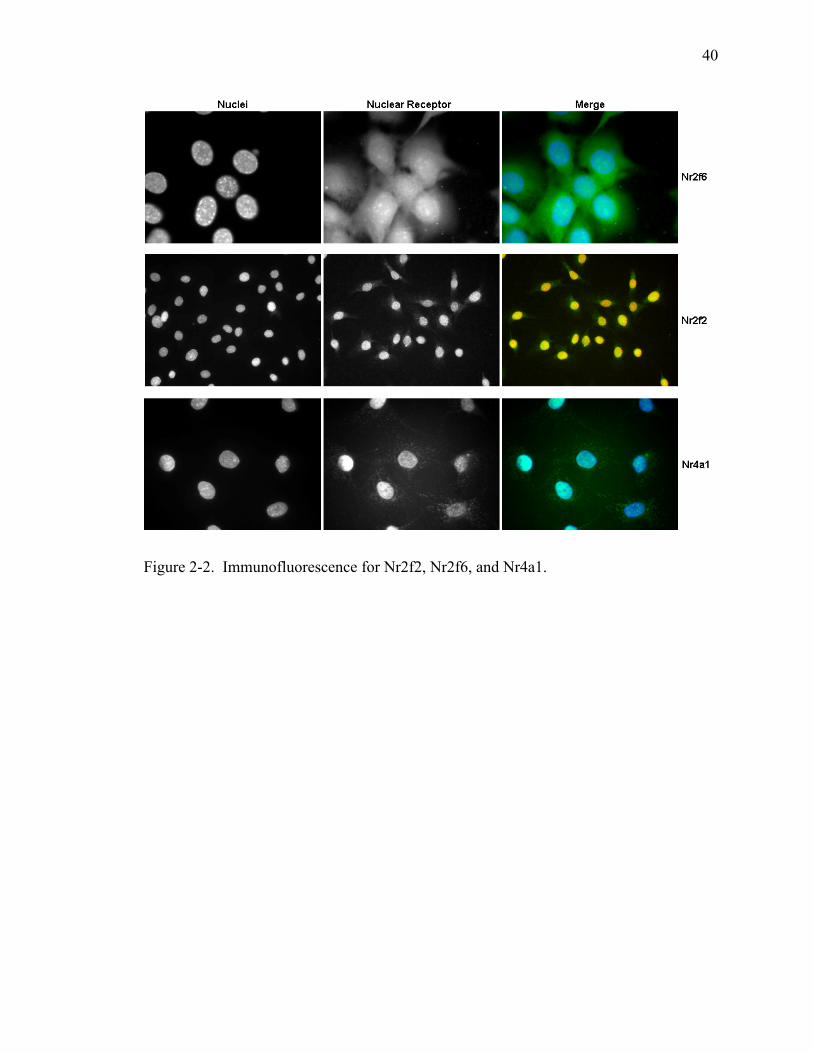
40
Figure 2-2. Immunofluorescence for Nr2f2, Nr2f6, and Nr4a1.
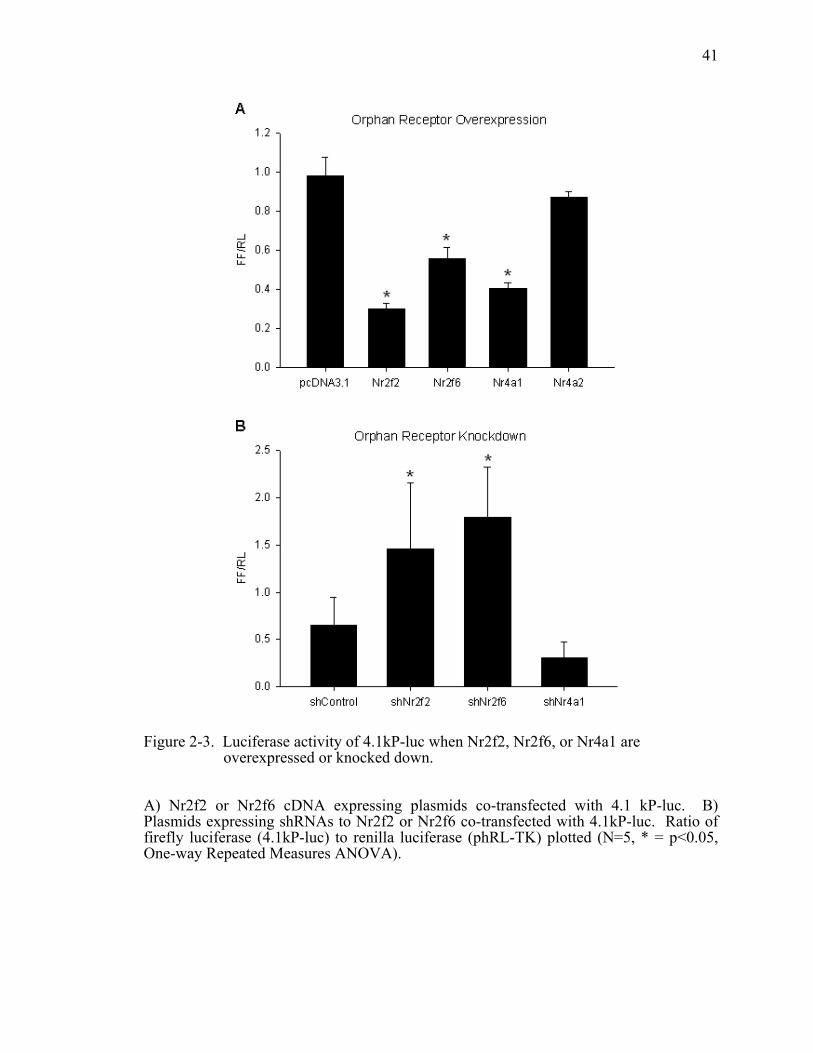
41
Figure 2-3. Luciferase activity of 4.1kP-luc when Nr2f2, Nr2f6, or Nr4a1 are overexpressed or knocked down.
A) Nr2f2 or Nr2f6 cDNA expressing plasmids co-transfected with 4.1 kP-luc. B) Plasmids expressing shRNAs to Nr2f2 or Nr2f6 co-transfected with 4.1kP-luc. Ratio of firefly luciferase (4.1kP-luc) to renilla luciferase (phRL-TK) plotted (N=5, * = p<0.05, One-way Repeated Measures ANOVA).
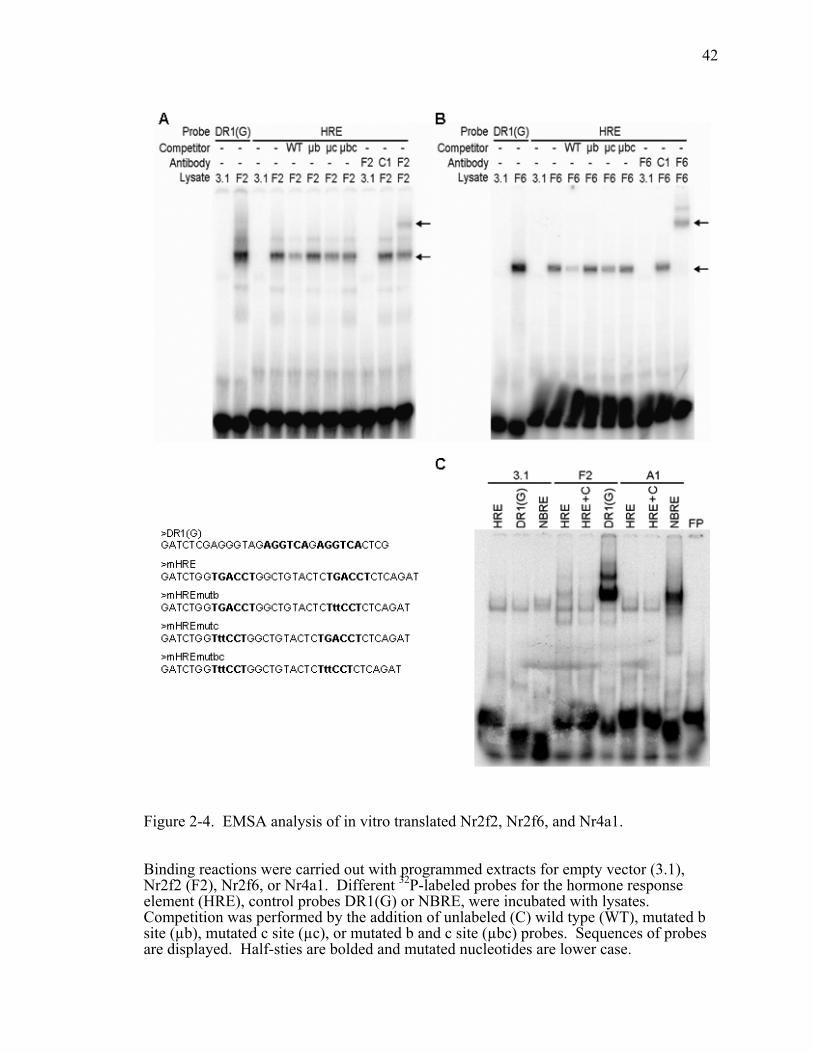
42
Figure 2-4. EMSA analysis of in vitro translated Nr2f2, Nr2f6, and Nr4a1.
Binding reactions were carried out with programmed extracts for empty vector (3.1), Nr2f2 (F2), Nr2f6, or Nr4a1. Different 32P-labeled probes for the hormone response element (HRE), control probes DR1(G) or NBRE, were incubated with lysates. Competition was performed by the addition of unlabeled (C) wild type (WT), mutated b site (µb), mutated c site (µc), or mutated b and c site (µbc) probes. Sequences of probes are displayed. Half-sties are bolded and mutated nucleotides are lower case.
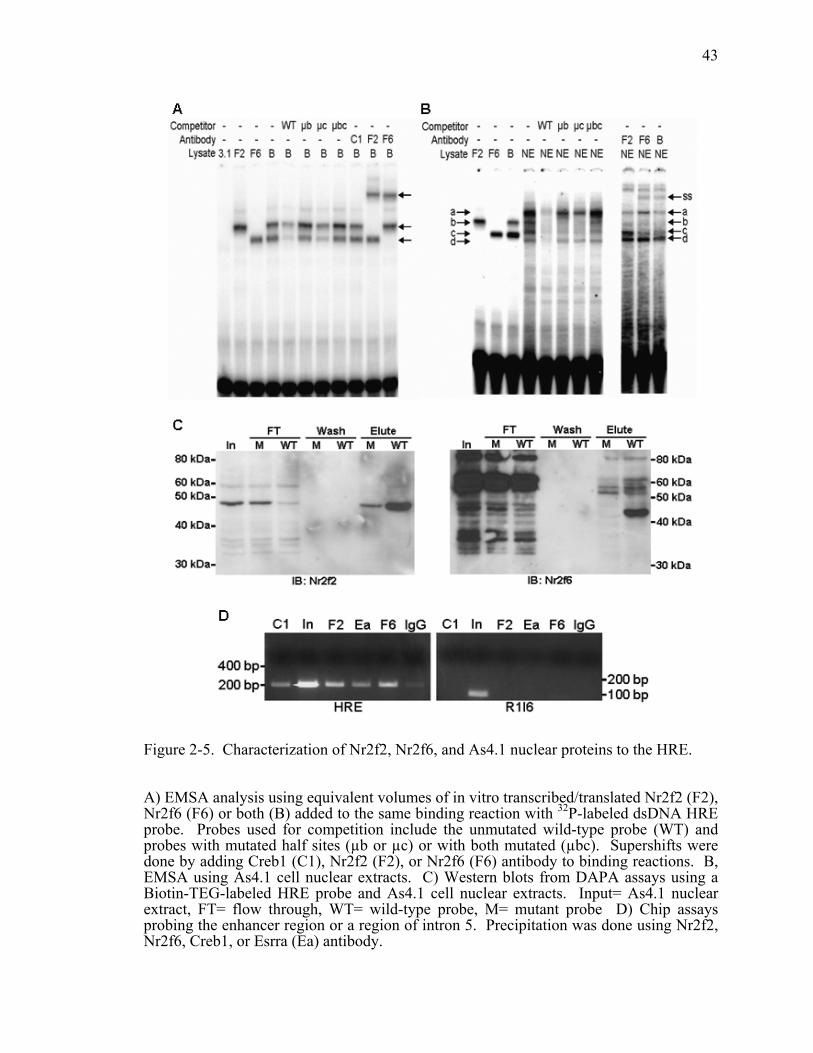
43
Figure 2-5. Characterization of Nr2f2, Nr2f6, and As4.1 nuclear proteins to the HRE.
A) EMSA analysis using equivalent volumes of in vitro transcribed/translated Nr2f2 (F2)Nr2f6 (F6) or both (B) added to the same binding reaction with 32P-labeled d
, sDNA HRE
probe. Probes used for competition include the unmutated wild-type probe (WT) and probes with mutated half sites (µb or µc) or with both mutated (µbc). Supershifts were done by adding Creb1 (C1), Nr2f2 (F2), or Nr2f6 (F6) antibody to binding reactions. B,
a Biotin-TEG-labeled HRE probe and As4.1 cell nuclear extracts. Input= As4.1 nuclear extract, FT= flow through, WT= wild-type probe, M= mutant probe D) Chip assays probing the enhancer region or a region of intron 5. Precipitation was done using Nr2f2, Nr2f6, Creb1, or Esrra (Ea) antibody.
EMSA using As4.1 cell nuclear extracts. C) Western blots from DAPA assays using
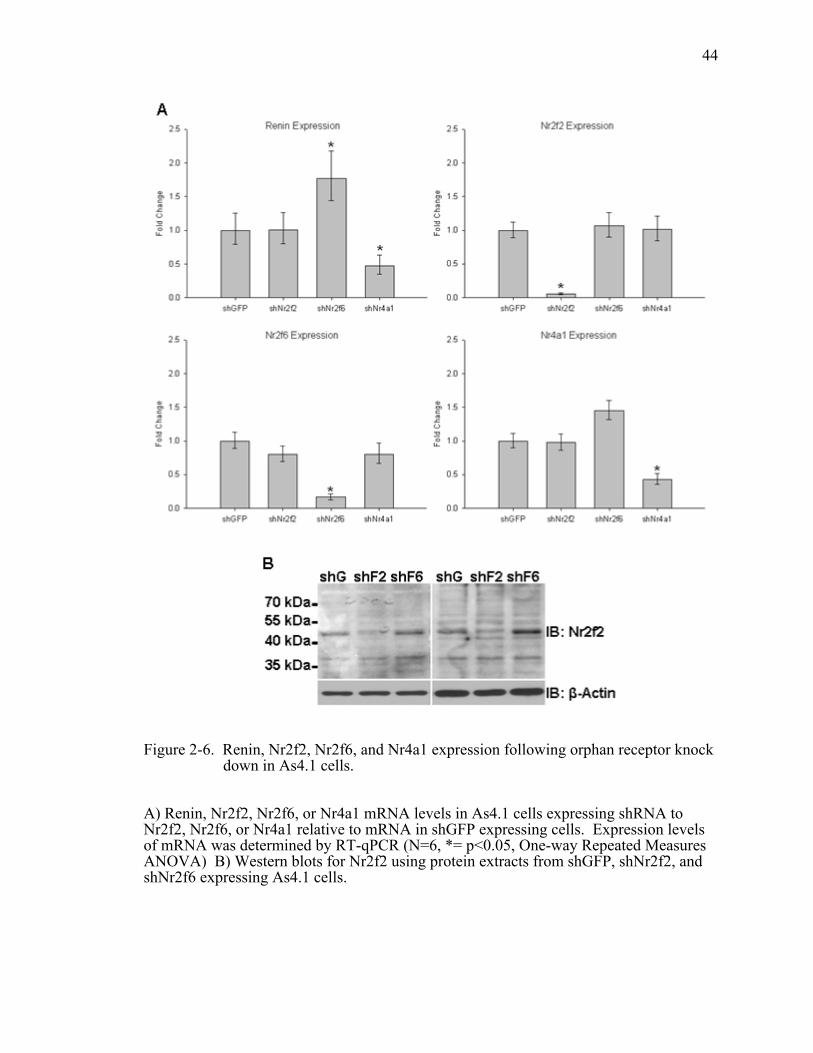
44
Figure 2-6. Renin, Nr2f2, Nr2f6, and Nr4a1 expression following orphan receptor knock down in As4.1 cells.
) Renin, Nr2f2, Nr2f6, or Nr4a1 mRNA levels in As4.1 cells expressing shRNA to r2f2, Nr2f6, or Nr4a1 relative to mRNA in shGFP expressing cells. Expression levels
of mRNA was determined by RT-qPCR (N=6, *= p<0.05, One-way Repeated Measures ANOVA) B) Western blots for Nr2f2 using protein extracts from shGFP, shNr2f2, and shNr2f6 expressing As4.1 cells.
AN
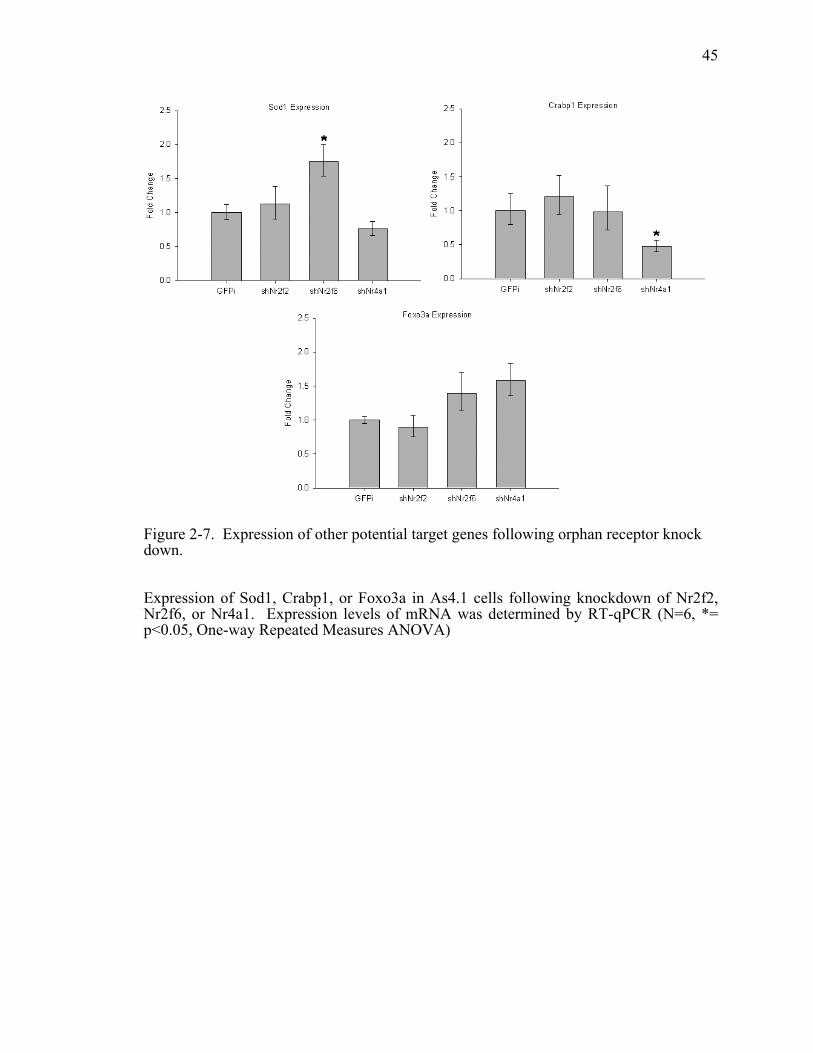
45
Figure 2-7. Expression of other potential target genes following orphan receptor knock down.
Expression of Sod1, Crabp1, or Foxo3a in As4.1 cells following knockdown of Nr2f2, Nr2f6, or Nr4a1. Expression levels of mRNA was determined by RT-qPCR (N=6, *= p<0.05, One-way Repeated Measures ANOVA)
46
CHAPTER 3
CONTROL OF THE RENIN LOCUS BY CTCF
Introduction
The control of gene expression can be regulated through the interactions of
regulatory elements that reside large distances apart in the genome. There are
documented cases of interchromosomal contacts and intrachromosomal loops such as
those that occur during olfactory receptor and allele specific expression (139, 140). It is
therefore important to protect loci from the influences of other gene’s regulatory elements
to maintain their normal tissue and cell-specific gene expression. Insulators are
important regulatory elements that carry out this function. They are typically defined by
their ability to block communication between regulatory elements (enhancer blocking) or
block the spread of heterochromatin (barrier activity). A DNA binding protein found at
insulators, CCCTC-binding factor (CTCF), can mediate enhancer blocking activity
through a variety of mechanisms. The first correlation between CTCF and enhancer
blocking activity was shown for hypersensitive site 5 (HS5) of the β-globin locus.
Barrier activity however does not appear to require CTCF, thus it is primarily functional
in enhancer blocking insulators (141).
In our studies of the human renin kidney enhancer (KE) we have utilized large
genomic PAC transgenesis. These constructs are advantageous because they presumably
contain all of the necessary regulatory elements and provide protection against transgene
insertion site position effects of neighboring genes. This is critical given the difficulties
encountered in creating transgenic mice to tease out the regulatory elements important in
the human enhancer. Previous attempts have resulted in the ubiquitous expression or
variable regulation in response to physiological cues (142-146). This is probably due to
the influence of regulatory elements in genes around the site of insertion. In contrast,
larger constructs containing 25 kb, 35 kb, or 70 kb of 5’ upstream sequence show
47
appropriate cell- and tissue-specific expression and responses to all physiological input
(146, 147). Furthermore, the development of BAC recombineering has made these large
constructs amenable to the deletion and insertion of sequences within them. In fact, our
lab has used this method to delete both the KE and chorionic enhancer (CE) (146-149).
The PAC construct used in our lab contains 160 kb of human chromosome 1 with
the human renin gene (hREN), the upstream genes GOLT1A and KISS1, and the
downstream gene ETNK2. During the production and validation of PAC transgenics
random truncations were detected in two lines. One of these truncations was found to
occur in the 5’ upstream sequence between the KE and CE (∆KE6) (Figure 3-1A). These
mice retained tissue-specific expression of the downstream ETNK2 gene, but renin
expression was ubiquitous and unresponsive to ACE inhibition (Figure 3-1B). We
hypothesized that this was due to position effects of the insertion site because loss of the
KE on its own is not sufficient to explain these results. We therefore set out to
determine where the transgene inserted and if the renin gene had fallen under the
influence of that genes regulatory elements. Additionally, because of the retention of
ETNK2 expression, we questioned whether insulator elements resided around the renin
locus.
Methods
Generation of Kidney Enhancer-deficient PAC160 Transgenic Mice
Construction of the KE deletion mutant of PAC160 and of transgenic mice
containing PAC160 and PAC160∆KE6 were previously reported (147, 148). All mice
were fed with standard mouse chow (LM-485; Teklad Premier Laboratory Diets) and
water ad libitum. Care and use of mice met the standard set forth by the National
Institutes of Health and all procedures were approved by the University Animal Care and
Use Committee at the University of Iowa.
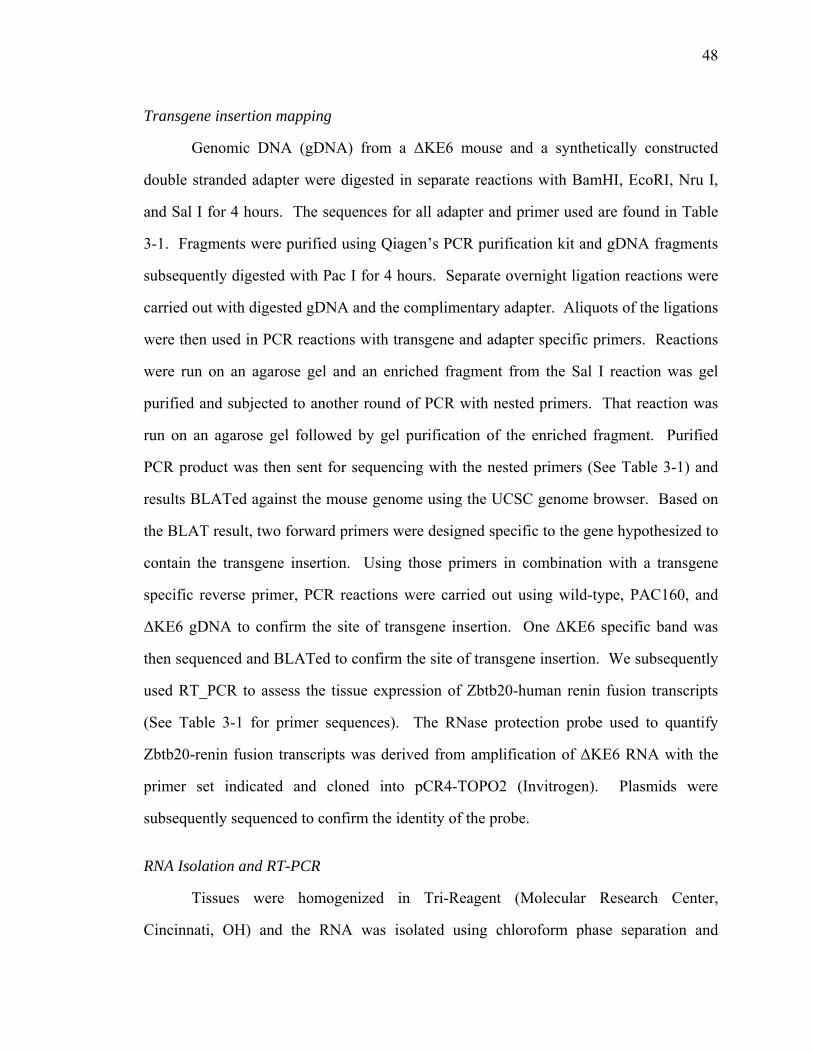
48
Transgene insertion mapping
Genomic DNA (gDNA) from a ∆KE6 mouse and a synthetically constructed
double stranded adapter were digested in separate reactions with BamHI, EcoRI, Nru I,
and Sal I for 4 hours. The sequences for all adapter and primer used are found in Table
3-1. Fragments were purified using Qiagen’s PCR purification kit and gDNA fragments
subsequently digested with Pac I for 4 hours. Separate overnight ligation reactions were
carried out with digested gDNA and the complimentary adapter. Aliquots of the ligations
were then used in PCR reactions with transgene and adapter specific primers. Reactions
were run on an agarose gel and an enriched fragment from the Sal I reaction was gel
purified and subjected to another round of PCR with nested primers. That reaction was
run on an agarose gel followed by gel purification of the enriched fragment. Purified
PCR product was then sent for sequencing with the nested primers (See Table 3-1) and
results BLATed against the mouse genome using the UCSC genome browser. Based on
the BLAT result, two forward primers were designed specific to the gene hypothesized to
contain the transgene insertion. Using those primers in combination with a transgene
specific reverse primer, PCR reactions were carried out using wild-type, PAC160, and
∆KE6 gDNA to confirm the site of transgene insertion. One ∆KE6 specific band was
then sequenced and BLATed to confirm the site of transgene insertion. We subsequently
used RT_PCR to assess the tissue expression of Zbtb20-human renin fusion transcripts
(See Table 3-1 for primer sequences). The RNase protection probe used to quantify
Zbtb20-renin fusion transcripts was derived from amplification of ∆KE6 RNA with the
primer set indicated and cloned into pCR4-TOPO2 (Invitrogen). Plasmids were
subsequently sequenced to confirm the identity of the probe.
RNA Isolation and RT-PCR
Tissues were homogenized in Tri-Reagent (Molecular Research Center,
Cincinnati, OH) and the RNA was isolated using chloroform phase separation and
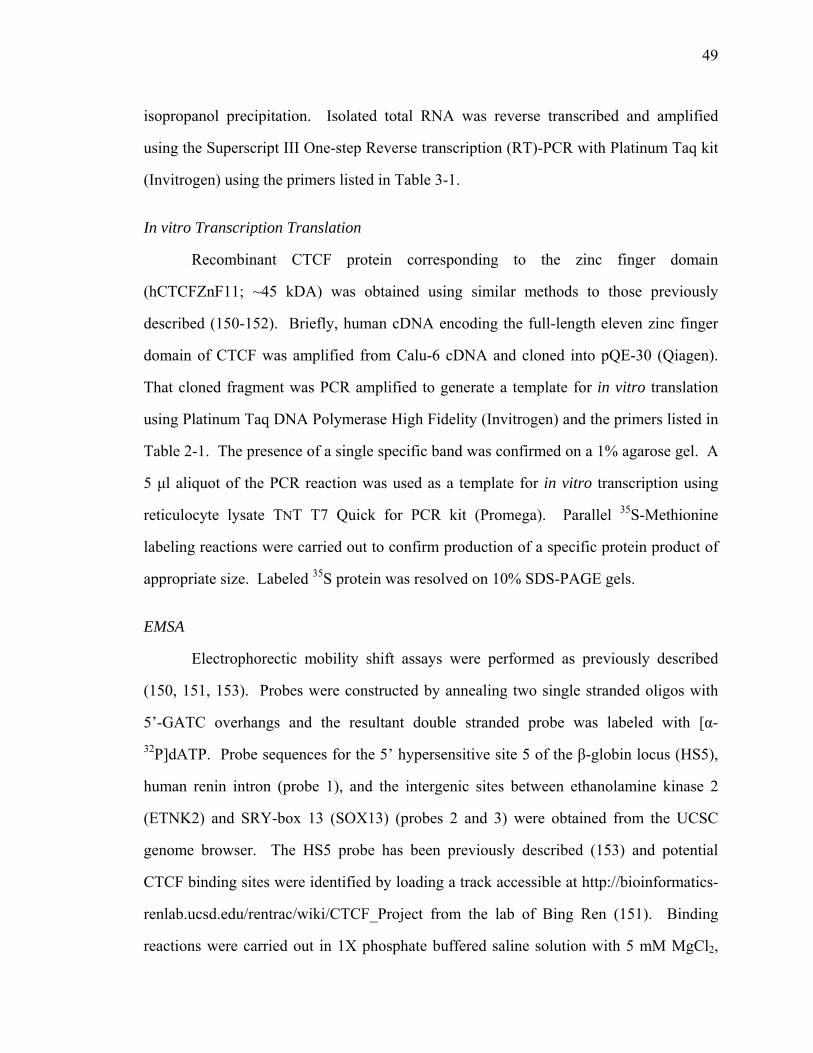
49
isopropanol precipitation. Isolated total RNA was reverse transcribed and amplified
using the Superscript III One-step Reverse transcription (RT)-PCR with Platinum Taq kit
(Invitrogen) using the primers listed in Table 3-1.
In vitro Transcription Translation
Recombinant CTCF protein corresponding to the zinc finger domain
(hCTCFZnF11; ~45 kDA) was obtained using similar methods to those previously
described (150-152). Briefly, human cDNA encoding the full-length eleven zinc finger
domain of CTCF was amplified from Calu-6 cDNA and cloned into pQE-30 (Qiagen).
That cloned fragment was PCR amplified to generate a template for in vitro translation
using Platinum Taq DNA Polymerase High Fidelity (Invitrogen) and the primers listed in
Table 2-1. The presence of a single specific band was confirmed on a 1% agarose gel. A
5 µl aliquot of the PCR reaction was used as a template for in vitro transcription using
reticulocyte lysate TNT T7 Quick for PCR kit (Promega). Parallel 35S-Methionine
labeling reactions were carried out to confirm production of a specific protein product of
appropriate size. Labeled 35S protein was resolved on 10% SDS-PAGE gels.
EMSA
Electrophorectic mobility shift assays were performed as previously described
(150, 151, 153). Probes were constructed by annealing two single stranded oligos with
5’-GATC overhangs and the resultant double stranded probe was labeled with [α-32P]dATP. Probe sequences for the 5’ hypersensitive site 5 of the β-globin locus (HS5),
human renin intron (probe 1), and the intergenic sites between ethanolamine kinase 2
(ETNK2) and SRY-box 13 (SOX13) (probes 2 and 3) were obtained from the UCSC
genome browser. The HS5 probe has been previously described (153) and potential
CTCF binding sites were identified by loading a track accessible at http://bioinformatics-
renlab.ucsd.edu/rentrac/wiki/CTCF_Project from the lab of Bing Ren (151). Binding
reactions were carried out in 1X phosphate buffered saline solution with 5 mM MgCl2,
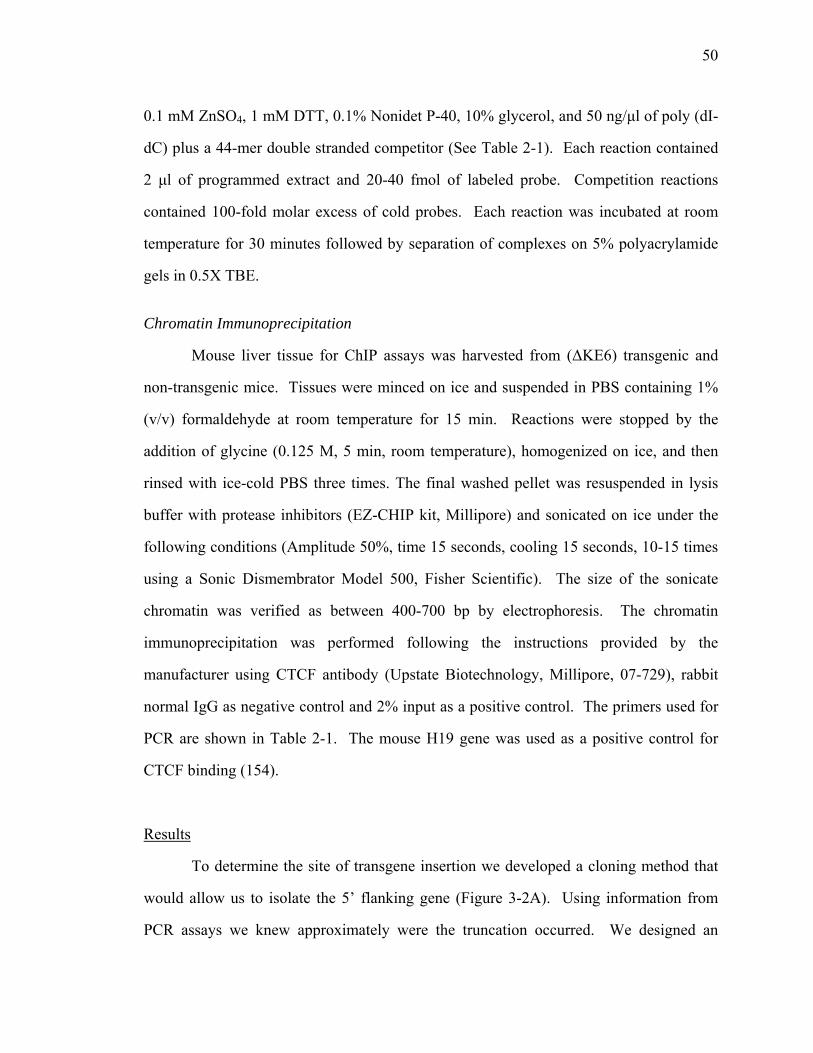
50
0.1 mM ZnSO4, 1 mM DTT, 0.1% Nonidet P-40, 10% glycerol, and 50 ng/µl of poly (dI-
dC) plus a 44-mer double stranded competitor (See Table 2-1). Each reaction contained
2 µl of programmed extract and 20-40 fmol of labeled probe. Competition reactions
contained 100-fold molar excess of cold probes. Each reaction was incubated at room
temperature for 30 minutes followed by separation of complexes on 5% polyacrylamide
gels in 0.5X TBE.
Chromatin Immunoprecipitation
Mouse liver tissue for ChIP assays was harvested from (∆KE6) transgenic and
non-transgenic mice. Tissues were minced on ice and suspended in PBS containing 1%
(v/v) formaldehyde at room temperature for 15 min. Reactions were stopped by the
addition of glycine (0.125 M, 5 min, room temperature), homogenized on ice, and then
rinsed with ice-cold PBS three times. The final washed pellet was resuspended in lysis
buffer with protease inhibitors (EZ-CHIP kit, Millipore) and sonicated on ice under the
following conditions (Amplitude 50%, time 15 seconds, cooling 15 seconds, 10-15 times
using a Sonic Dismembrator Model 500, Fisher Scientific). The size of the sonicate
chromatin was verified as between 400-700 bp by electrophoresis. The chromatin
immunoprecipitation was performed following the instructions provided by the
manufacturer using CTCF antibody (Upstate Biotechnology, Millipore, 07-729), rabbit
normal IgG as negative control and 2% input as a positive control. The primers used for
PCR are shown in Table 2-1. The mouse H19 gene was used as a positive control for
CTCF binding (154).
Results
To determine the site of transgene insertion we developed a cloning method that
would allow us to isolate the 5’ flanking gene (Figure 3-2A). Using information from
PCR assays we knew approximately were the truncation occurred. We designed an
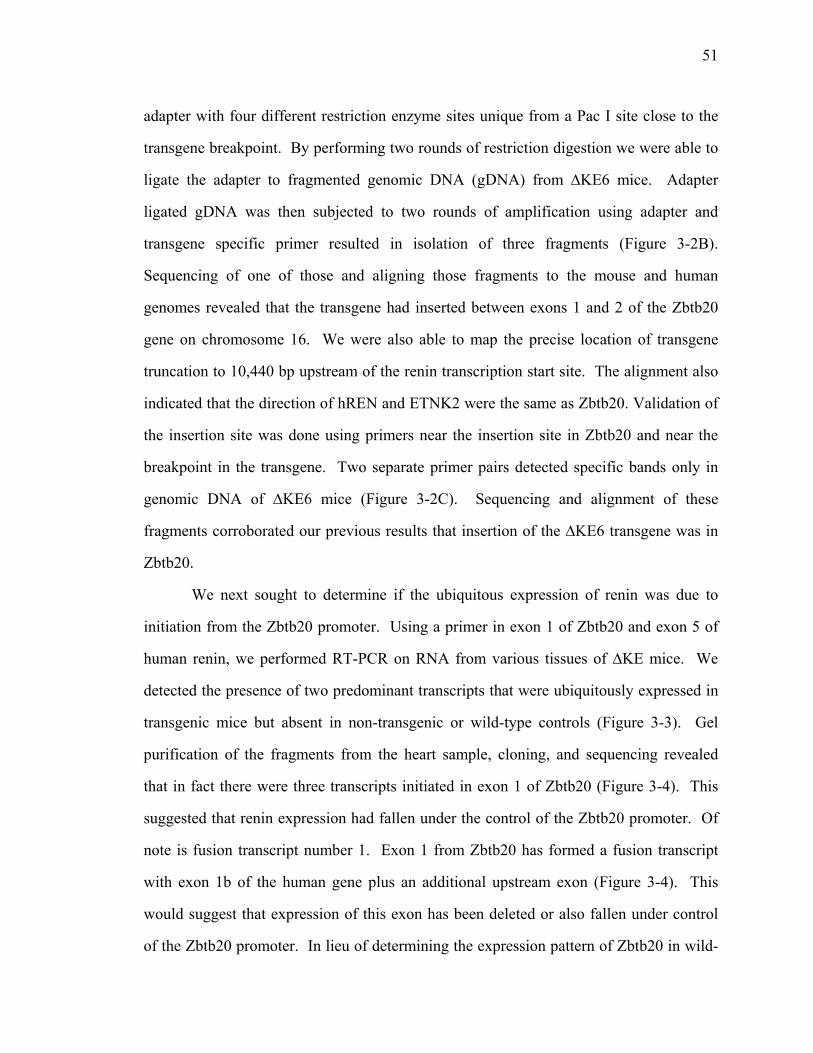
51
adapter with four different restriction enzyme sites unique from a Pac I site close to the
transgene breakpoint. By performing two rounds of restriction digestion we were able to
ligate the adapter to fragmented genomic DNA (gDNA) from ∆KE6 mice. Adapter
ligated gDNA was then subjected to two rounds of amplification using adapter and
transgene specific primer resulted in isolation of three fragments (Figure 3-2B).
Sequencing of one of those and aligning those fragments to the mouse and human
genomes revealed that the transgene had inserted between exons 1 and 2 of the Zbtb20
gene on chromosome 16. We were also able to map the precise location of transgene
truncation to 10,440 bp upstream of the renin transcription start site. The alignment also
indicated that the direction of hREN and ETNK2 were the same as Zbtb20. Validation of
the insertion site was done using primers near the insertion site in Zbtb20 and near the
breakpoint in the transgene. Two separate primer pairs detected specific bands only in
genomic DNA of ∆KE6 mice (Figure 3-2C). Sequencing and alignment of these
fragments corroborated our previous results that insertion of the ∆KE6 transgene was in
Zbtb20.
We next sought to determine if the ubiquitous expression of renin was due to
initiation from the Zbtb20 promoter. Using a primer in exon 1 of Zbtb20 and exon 5 of
human renin, we performed RT-PCR on RNA from various tissues of ∆KE mice. We
detected the presence of two predominant transcripts that were ubiquitously expressed in
transgenic mice but absent in non-transgenic or wild-type controls (Figure 3-3). Gel
purification of the fragments from the heart sample, cloning, and sequencing revealed
that in fact there were three transcripts initiated in exon 1 of Zbtb20 (Figure 3-4). This
suggested that renin expression had fallen under the control of the Zbtb20 promoter. Of
note is fusion transcript number 1. Exon 1 from Zbtb20 has formed a fusion transcript
with exon 1b of the human gene plus an additional upstream exon (Figure 3-4). This
would suggest that expression of this exon has been deleted or also fallen under control
of the Zbtb20 promoter. In lieu of determining the expression pattern of Zbtb20 in wild-
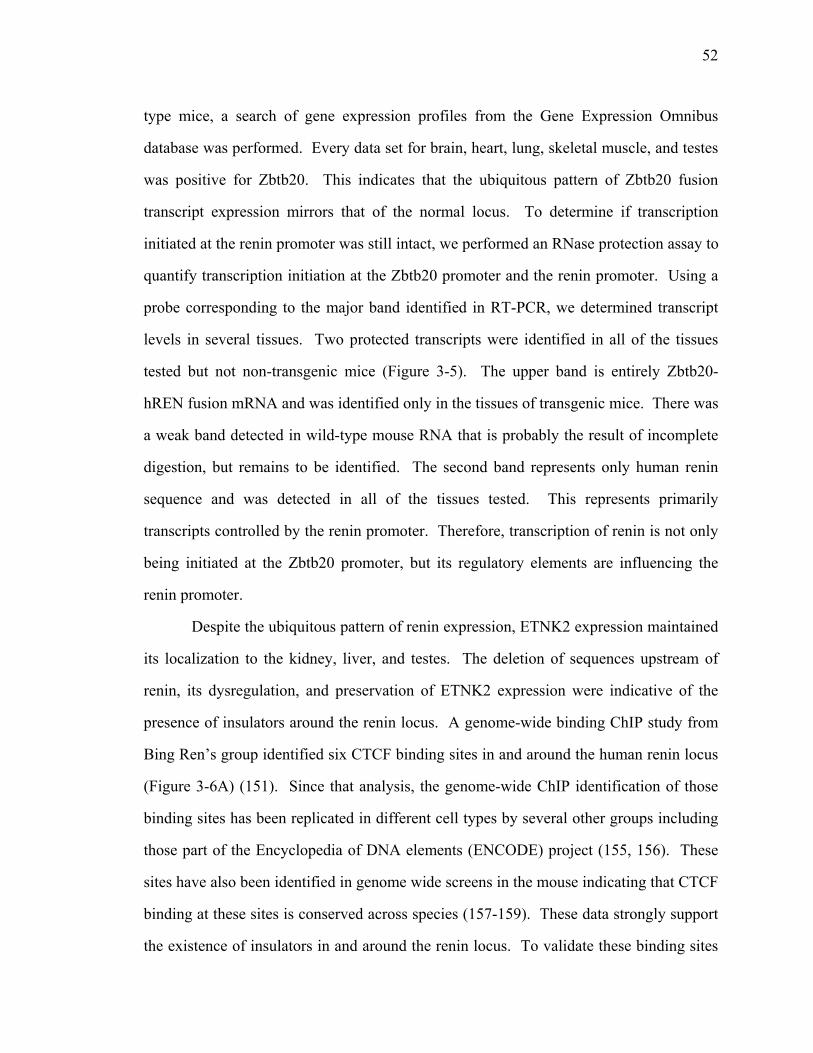
52
type mice, a search of gene expression profiles from the Gene Expression Omnibus
database was performed. Every data set for brain, heart, lung, skeletal muscle, and testes
was positive for Zbtb20. This indicates that the ubiquitous pattern of Zbtb20 fusion
transcript expression mirrors that of the normal locus. To determine if transcription
initiated at the renin promoter was still intact, we performed an RNase protection assay to
quantify transcription initiation at the Zbtb20 promoter and the renin promoter. Using a
probe corresponding to the major band identified in RT-PCR, we determined transcript
levels in several tissues. Two protected transcripts were identified in all of the tissues
tested but not non-transgenic mice (Figure 3-5). The upper band is entirely Zbtb20-
hREN fusion mRNA and was identified only in the tissues of transgenic mice. There was
a weak band detected in wild-type mouse RNA that is probably the result of incomplete
digestion, but remains to be identified. The second band represents only human renin
sequence and was detected in all of the tissues tested. This represents primarily
transcripts controlled by the renin promoter. Therefore, transcription of renin is not only
being initiated at the Zbtb20 promoter, but its regulatory elements are influencing the
renin promoter.
Despite the ubiquitous pattern of renin expression, ETNK2 expression maintained
its localization to the kidney, liver, and testes. The deletion of sequences upstream of
renin, its dysregulation, and preservation of ETNK2 expression were indicative of the
presence of insulators around the renin locus. A genome-wide binding ChIP study from
Bing Ren’s group identified six CTCF binding sites in and around the human renin locus
(Figure 3-6A) (151). Since that analysis, the genome-wide ChIP identification of those
binding sites has been replicated in different cell types by several other groups including
those part of the Encyclopedia of DNA elements (ENCODE) project (155, 156). These
sites have also been identified in genome wide screens in the mouse indicating that CTCF
binding at these sites is conserved across species (157-159). These data strongly support
the existence of insulators in and around the renin locus. To validate these binding sites
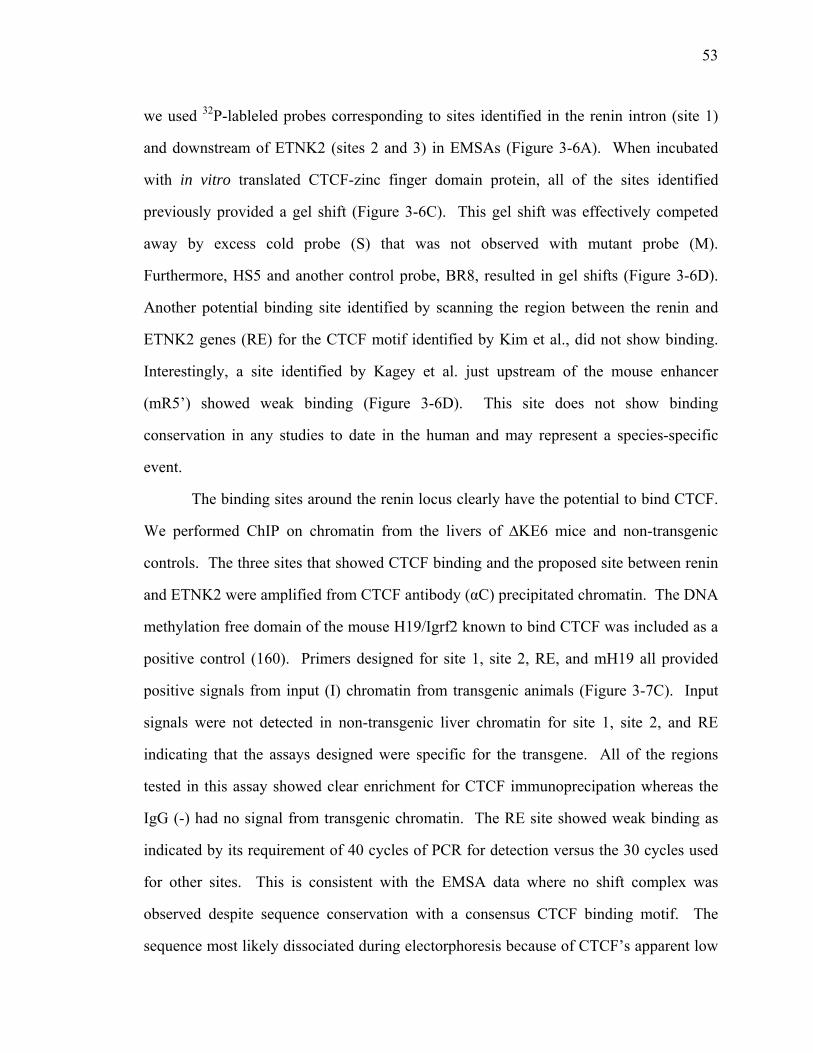
53
we used 32P-lableled probes corresponding to sites identified in the renin intron (site 1)
and downstream of ETNK2 (sites 2 and 3) in EMSAs (Figure 3-6A). When incubated
with in vitro translated CTCF-zinc finger domain protein, all of the sites identified
previously provided a gel shift (Figure 3-6C). This gel shift was effectively competed
away by excess cold probe (S) that was not observed with mutant probe (M).
Furthermore, HS5 and another control probe, BR8, resulted in gel shifts (Figure 3-6D).
Another potential binding site identified by scanning the region between the renin and
ETNK2 genes (RE) for the CTCF motif identified by Kim et al., did not show binding.
Interestingly, a site identified by Kagey et al. just upstream of the mouse enhancer
(mR5’) showed weak binding (Figure 3-6D). This site does not show binding
conservation in any studies to date in the human and may represent a species-specific
event.
The binding sites around the renin locus clearly have the potential to bind CTCF.
We performed ChIP on chromatin from the livers of ∆KE6 mice and non-transgenic
controls. The three sites that showed CTCF binding and the proposed site between renin
and ETNK2 were amplified from CTCF antibody (αC) precipitated chromatin. The DNA
methylation free domain of the mouse H19/Igrf2 known to bind CTCF was included as a
positive control (160). Primers designed for site 1, site 2, RE, and mH19 all provided
positive signals from input (I) chromatin from transgenic animals (Figure 3-7C). Input
signals were not detected in non-transgenic liver chromatin for site 1, site 2, and RE
indicating that the assays designed were specific for the transgene. All of the regions
tested in this assay showed clear enrichment for CTCF immunoprecipation whereas the
IgG (-) had no signal from transgenic chromatin. The RE site showed weak binding as
indicated by its requirement of 40 cycles of PCR for detection versus the 30 cycles used
for other sites. This is consistent with the EMSA data where no shift complex was
observed despite sequence conservation with a consensus CTCF binding motif. The
sequence most likely dissociated during electorphoresis because of CTCF’s apparent low
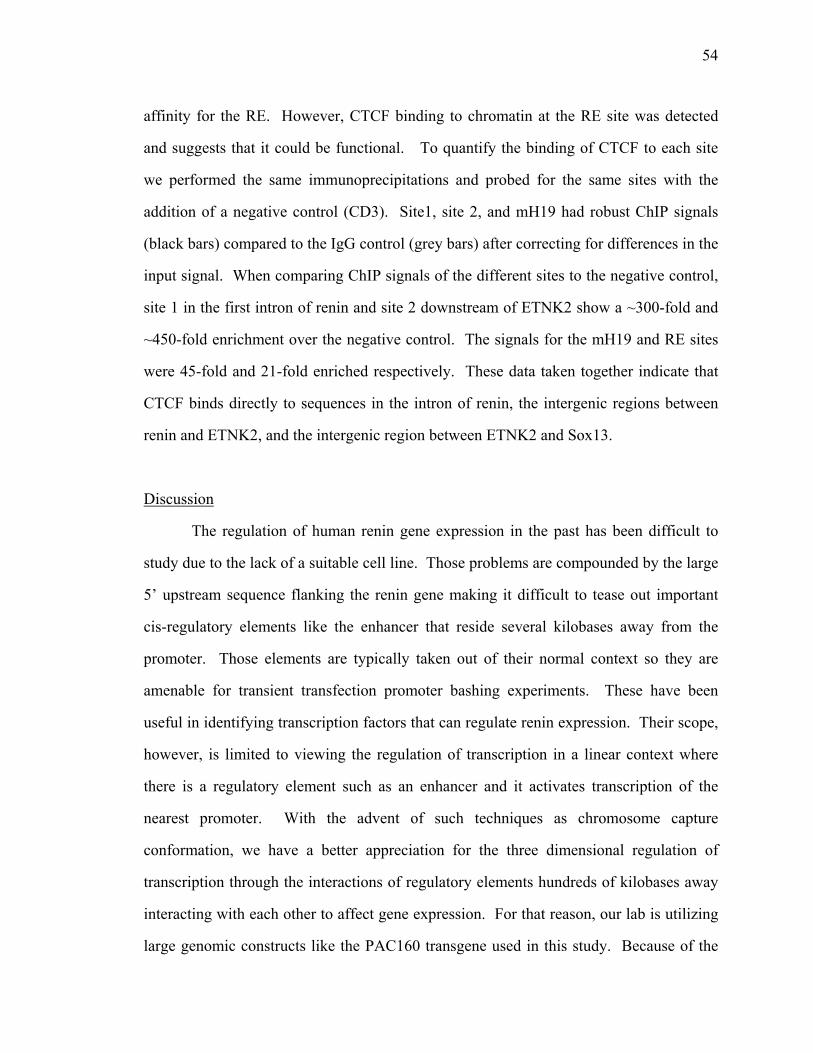
54
affinity for the RE. However, CTCF binding to chromatin at the RE site was detected
and suggests that it could be functional. To quantify the binding of CTCF to each site
we performed the same immunoprecipitations and probed for the same sites with the
addition of a negative control (CD3). Site1, site 2, and mH19 had robust ChIP signals
(black bars) compared to the IgG control (grey bars) after correcting for differences in the
input signal. When comparing ChIP signals of the different sites to the negative control,
site 1 in the first intron of renin and site 2 downstream of ETNK2 show a ~300-fold and
~450-fold enrichment over the negative control. The signals for the mH19 and RE sites
were 45-fold and 21-fold enriched respectively. These data taken together indicate that
CTCF binds directly to sequences in the intron of renin, the intergenic regions between
renin and ETNK2, and the intergenic region between ETNK2 and Sox13.
Discussion
The regulation of human renin gene expression in the past has been difficult to
study due to the lack of a suitable cell line. Those problems are compounded by the large
5’ upstream sequence flanking the renin gene making it difficult to tease out important
cis-regulatory elements like the enhancer that reside several kilobases away from the
promoter. Those elements are typically taken out of their normal context so they are
amenable for transient transfection promoter bashing experiments. These have been
useful in identifying transcription factors that can regulate renin expression. Their scope,
however, is limited to viewing the regulation of transcription in a linear context where
there is a regulatory element such as an enhancer and it activates transcription of the
nearest promoter. With the advent of such techniques as chromosome capture
conformation, we have a better appreciation for the three dimensional regulation of
transcription through the interactions of regulatory elements hundreds of kilobases away
interacting with each other to affect gene expression. For that reason, our lab is utilizing
large genomic constructs like the PAC160 transgene used in this study. Because of the
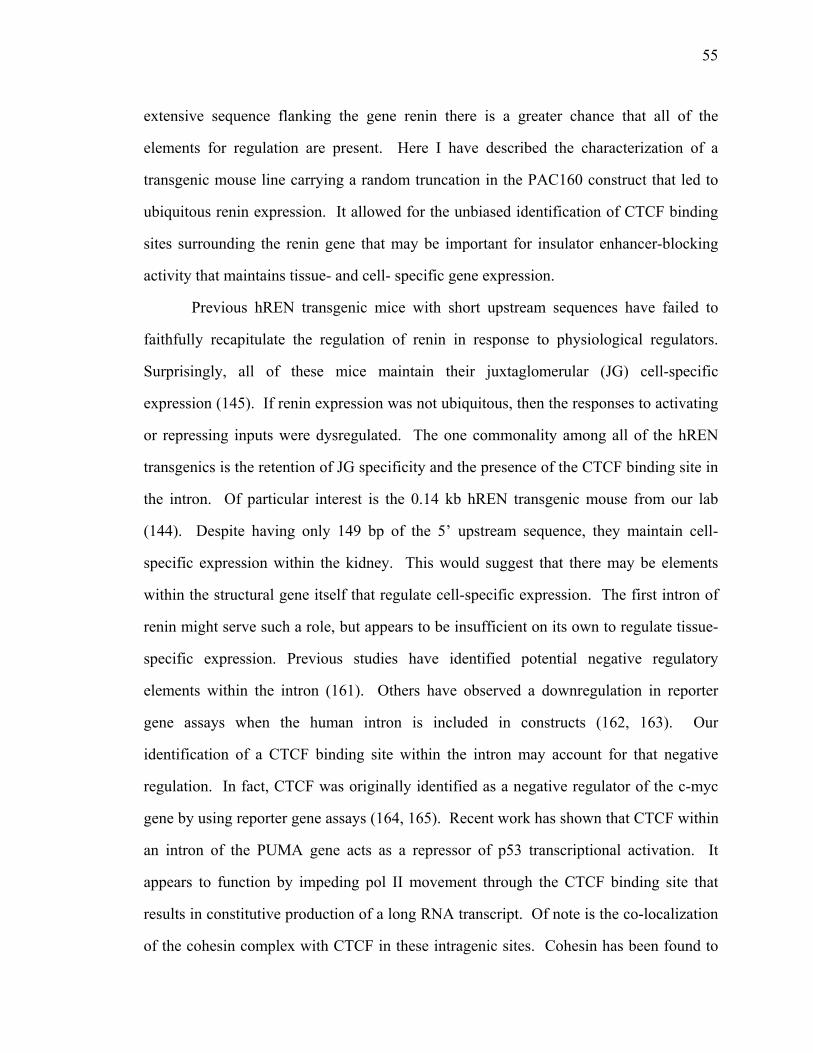
55
extensive sequence flanking the gene renin there is a greater chance that all of the
elements for regulation are present. Here I have described the characterization of a
transgenic mouse line carrying a random truncation in the PAC160 construct that led to
ubiquitous renin expression. It allowed for the unbiased identification of CTCF binding
sites surrounding the renin gene that may be important for insulator enhancer-blocking
activity that maintains tissue- and cell- specific gene expression.
Previous hREN transgenic mice with short upstream sequences have failed to
faithfully recapitulate the regulation of renin in response to physiological regulators.
Surprisingly, all of these mice maintain their juxtaglomerular (JG) cell-specific
expression (145). If renin expression was not ubiquitous, then the responses to activating
or repressing inputs were dysregulated. The one commonality among all of the hREN
transgenics is the retention of JG specificity and the presence of the CTCF binding site in
the intron. Of particular interest is the 0.14 kb hREN transgenic mouse from our lab
(144). Despite having only 149 bp of the 5’ upstream sequence, they maintain cell-
specific expression within the kidney. This would suggest that there may be elements
within the structural gene itself that regulate cell-specific expression. The first intron of
renin might serve such a role, but appears to be insufficient on its own to regulate tissue-
specific expression. Previous studies have identified potential negative regulatory
elements within the intron (161). Others have observed a downregulation in reporter
gene assays when the human intron is included in constructs (162, 163). Our
identification of a CTCF binding site within the intron may account for that negative
regulation. In fact, CTCF was originally identified as a negative regulator of the c-myc
gene by using reporter gene assays (164, 165). Recent work has shown that CTCF within
an intron of the PUMA gene acts as a repressor of p53 transcriptional activation. It
appears to function by impeding pol II movement through the CTCF binding site that
results in constitutive production of a long RNA transcript. Of note is the co-localization
of the cohesin complex with CTCF in these intragenic sites. Cohesin has been found to
56
co-localize with CTCF at insulators and mediate enhancer blocking activity through the
formation of intrachromosomal loops (166-168). If the intron site is involved in cell-
specificity, it is most likely not due to an interaction upstream of the renin gene as
sequences past 146 bp from the transcription start site appear to be dispensable.
Genome-wide ChIP in mouse ES cells shows a signal for components of the cohesin
complex that overlaps the CTCF binding in the renin intron (159). Whether or not loop
formation is playing a role in blocking pol II remains to be seen. Also, searching
ENCODE data using the UCSC genome browser indicates the presence of a DNase I
hypesensitive site. What makes this noteworthy is its existence in cells not thought to
express renin at high levels if at all. One might hypothesize that this is a constitutive
DNaseI hypersensitive site that allows for CTCF binding in multiple cell types to repress
renin expression by blocking the progression of pol II. Is CTCF the cell-specific
determining factor in the kidney? It may be since cell-specific expression was
maintained in the ∆KE6 mice and other hREN transgenics (169). We have the tools
available with BAC transgenesis to delete this sequence and test the effects in transgenic
mice within the native context of the gene.
The preservation of ETNK2 expression in the face of renin dysregulation and the
existence of a CTCF binding site strongly support the presence of an enhancer between
hREN and ETNK2. The weak binding interaction between the RE and CTCF probably
explains why genome-wide ChIP assays have failed to identify this site. Our ChIP-qPCR
method is more sensitive than genome tiling arrays or high throughput sequencing and
was able to detect binding in the RE region. The binding of this site by CTCF and the
downstream intergenic site between ETNK2 and SOX13, or the intragenic hREN site,
might allow for formation of a chromatin loop like those formed in β-globin gene
activation (170, 171). This loop formation may protect ETNK2 from the influences of
regulatory elements in neighboring genes. In the case of ∆KE6 mice, loop formation
57
would shield ETNK2 from the influences of the Zbtb20 gene that result in the
dysregulation of renin.
Our data from ∆KE6 mice suggest that the loss of sequences upstream of the
hREN transgene render it susceptible to positional influences. Whether it is due to the
loss of an insulator at the CTCF binding site in the GOLT1A gene identified by others
remains to be determined. We did not validate CTCF binding at this site in full length
PAC160 mice. However, it is attractive to speculate that an insulator at that site is
responsible for protecting the tissue-specific expression of renin. It is entirely possible
that there is an element lost in ∆KE6 mice that normally represses renin in non-renin
expressing tissues, but our RT-PCR and RPA data argue against this. Furthermore, the
lack of a response to ACE inhibition suggests that Zbtb20 regulatory elements are
exerting the predominant role in promoter activity given that 0.14 kb hREN transgenic
mice are able to respond appropriately. It has now been observed multiple times that loss
of a large portion 5’ upstream sequence of the renin gene vulnerable to position effects.
It now needs to be determine whether the CTCF binding sites within and around the renin
gene are within functional enhancers to serve to protect appropriate renin transcription
activity. Utilization of our PAC constructs to delete these elements in the normal
genomic context will serve as a valuable tool.
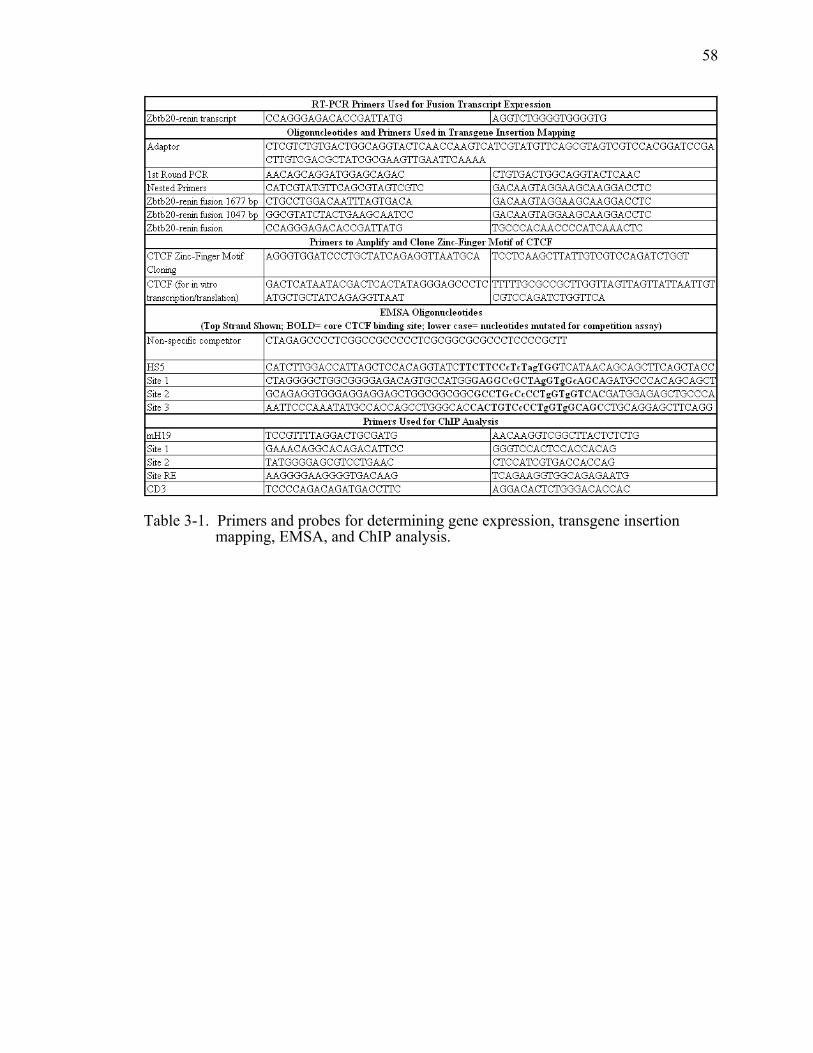
58
Table 3-1. Primers and probes for determining gene expression, transgene insertion mapping, EMSA, and ChIP analysis.
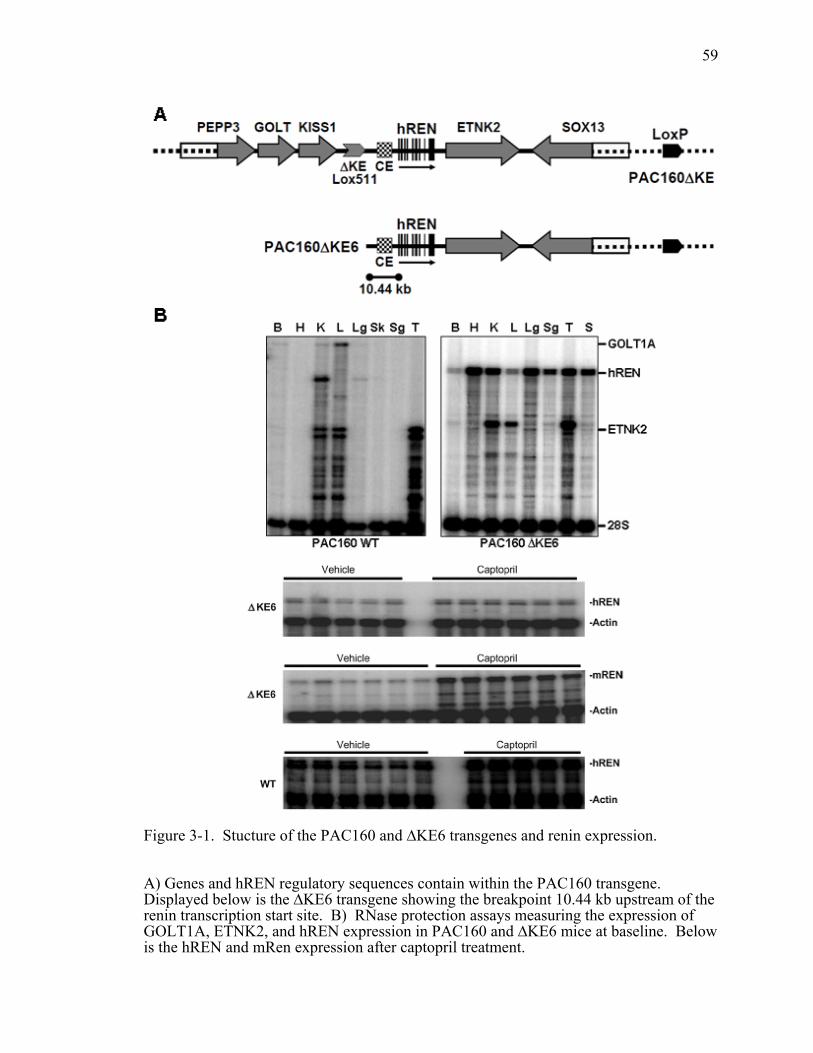
59
Figure 3-1. Stucture of the PAC160 and ∆KE6 transgenes and renin expression.
A) Genes and hREN regulatory sequences contain within the PAC160 transgene. Displayed below is the ∆KE6 transgene showing the breakpoint 10.44 kb upstream of the renin transcription start site. B) RNase protection assays measuring the expression of GOLT1A, ETNK2, and hREN expression in PAC160 and ∆KE6 mice at baseline. Below is the hREN and mRen expression after captopril treatment.
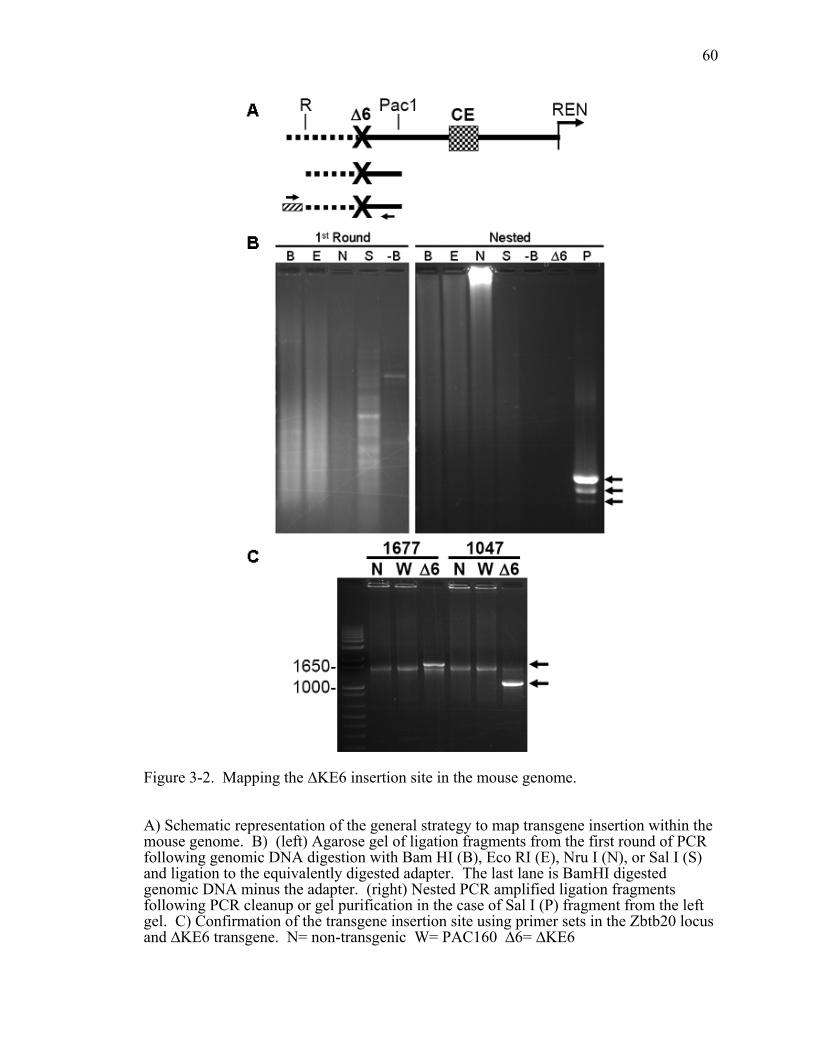
60
Figure 3-2. Mapping the ∆KE6 insertion site in the mouse genome.
A) Schematic representation of the general strategy to map transgene insertion within the mouse genome. B) (left) Agarose gel of ligation fragments from the first round of PCR following genomic DNA digestion with Bam HI (B), Eco RI (E), Nru I (N), or Sal I (S) and ligation to the equivalently digested adapter. The last lane is BamHI digested
tion fragments following PCR cleanup or gel purification in the case of Sal I (P) fragment from the left gel. C) Confirmation of the transgene insertion site using primer sets in the Zbtb20 locus and ∆KE6 transgene. N= non-transgenic W= PAC160 ∆6= ∆KE6
genomic DNA minus the adapter. (right) Nested PCR amplified liga
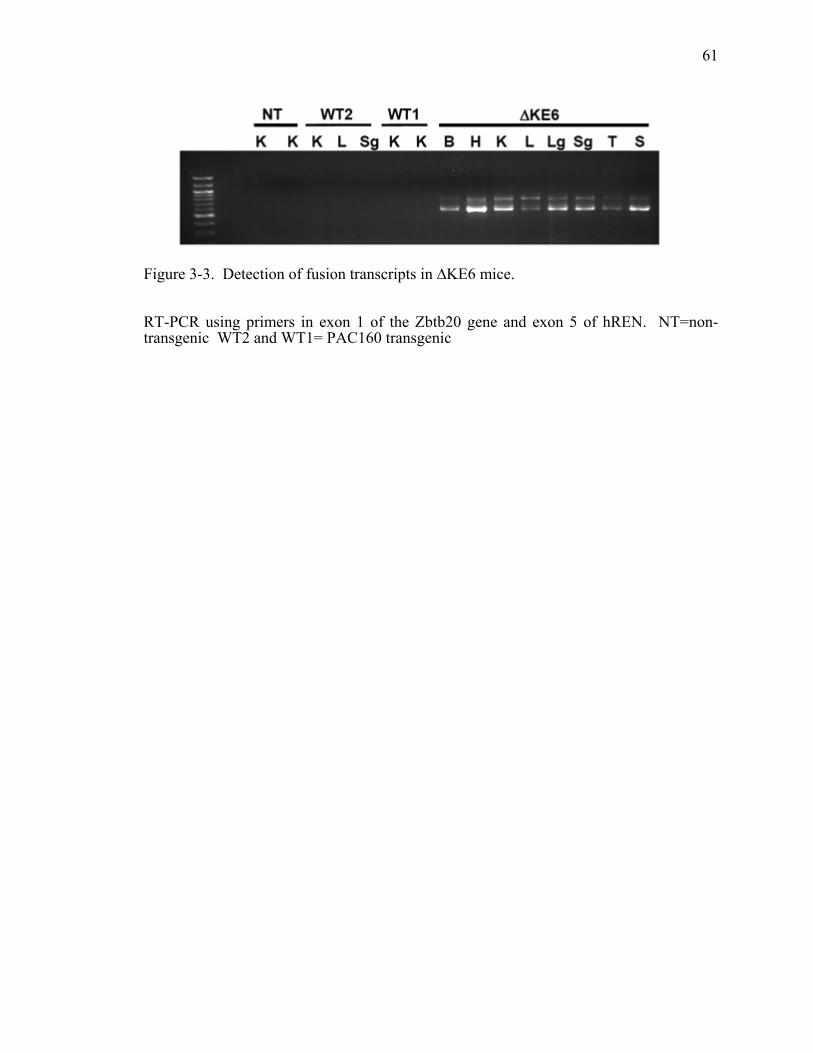
61
Figure 3-3. Detection of fusion transcripts in ∆KE6 mice.
RT-PCR using primers in exon 1 of the Zbtb20 gene and exon 5 of hREN. NT=transgenic WT2 and WT1= PAC160 transgenic
non-
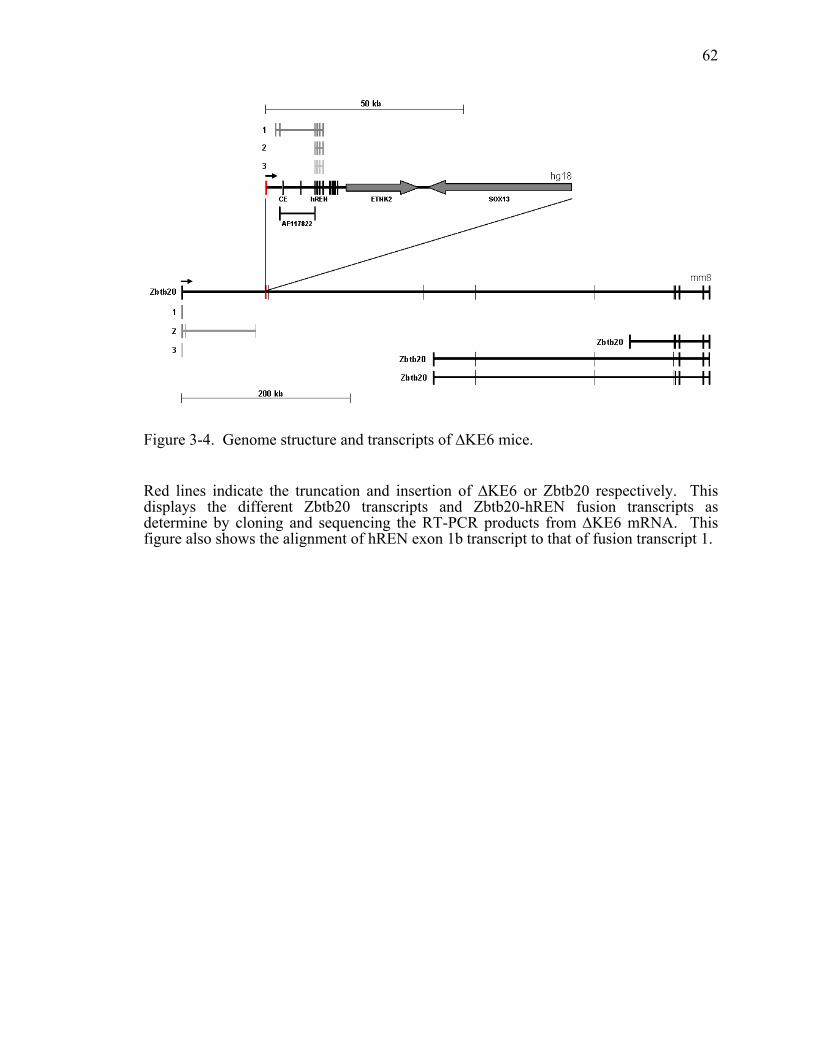
62
Figure 3-4. Genome structure and transcripts of ∆KE6 mice.
Red lines indicate the truncation and insertion of ∆KE6 or Zbtb20 respectively. This displays the different Zbtb20 transcripts and Zbtb20-hREN fusion transcripts as determine by cloning and sequencing the RT-PCR products from ∆KE6 mRNA. This figure also shows the alignment of hREN exon 1b transcript to that of fusion transcript 1.
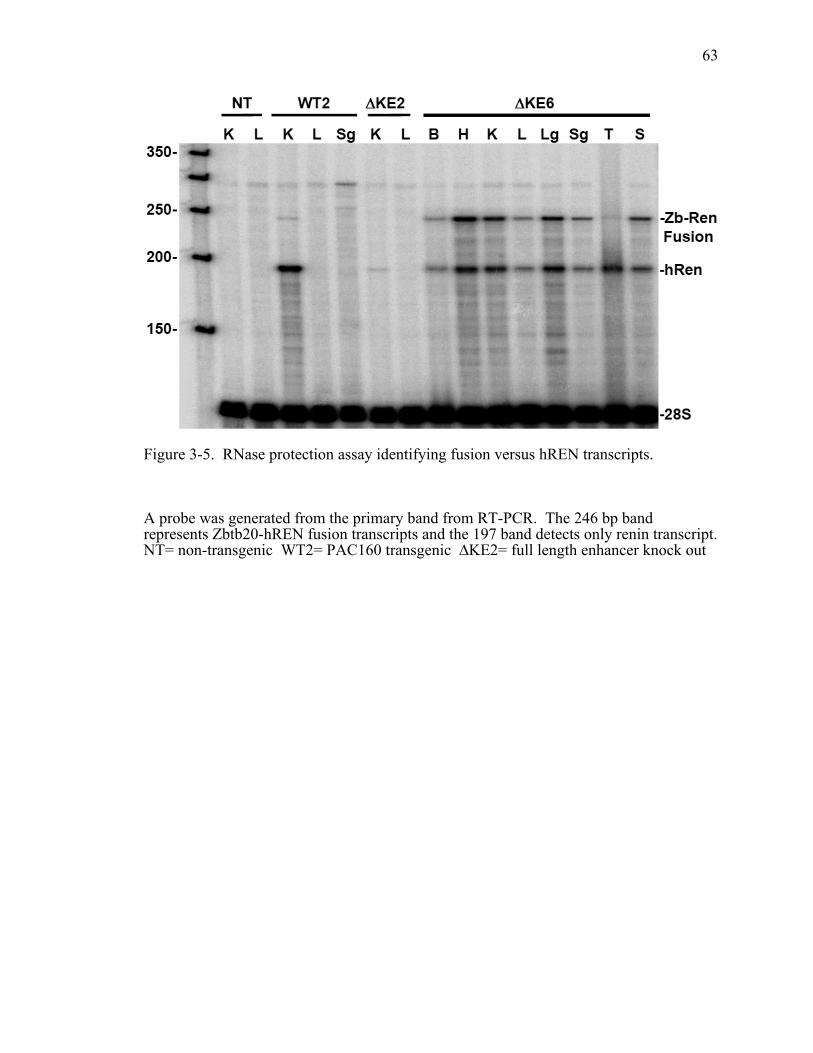
63
Figure 3-5. RNase protection assay identifying fusion versus hREN transcripts.
A probe was generated from the primary band from RT-PCR. The 246 bp band represents Zbtb20-hREN fusion transcripts and the 197 band detects only renin transcript. NT= non-transgenic WT2= PAC160 transgenic ∆KE2= full length enhancer knock out
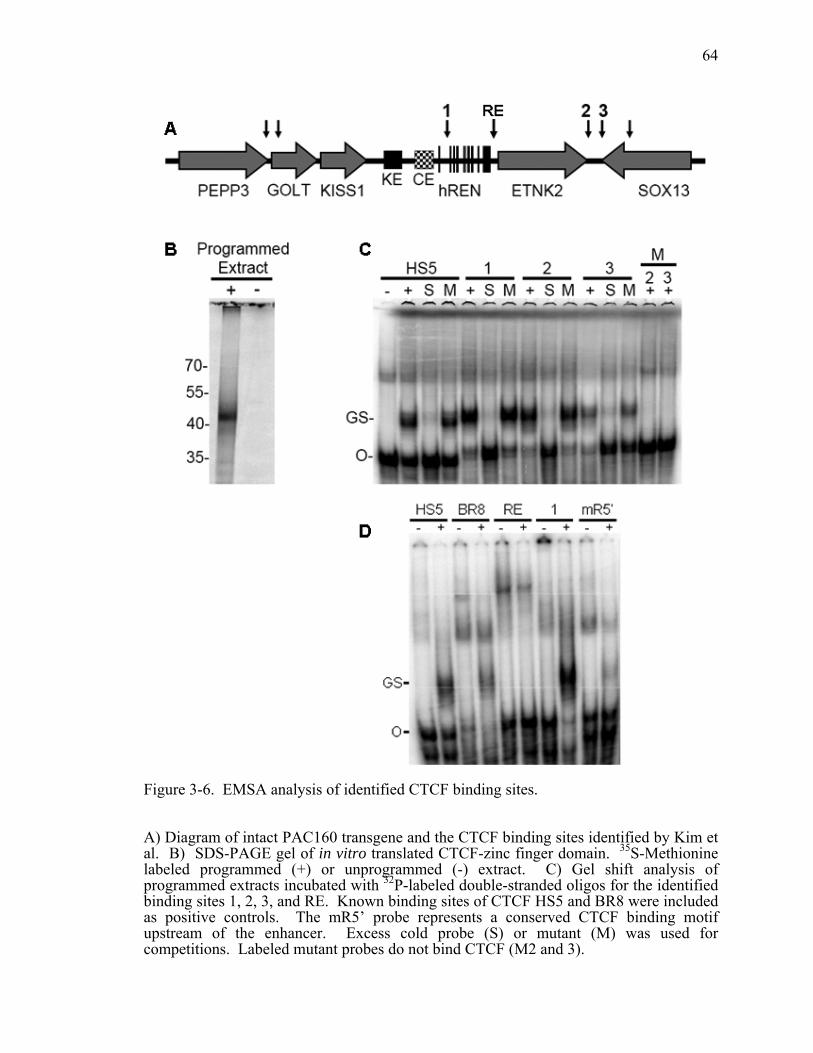
64
Figure 3-6. EMSA analysis of identified CTCF binding sites.
A) Diagram of intact PAC160 transgene and the CTCF binding sites identified by Kim et al. B) SDS-PAGE gel of in vitro translated CTCF-zinc finger domain. 35S-Methionine labeled programmed (+) or unprogrammed (-) extract. C) Gel shift analysis of programmed extracts incubated with 32P-labeled double-stranded oligos for the identified binding sites 1, 2, 3, and RE. Known binding sites of CTCF HS5 and BR8 were included as positive controls. The mR5’ probe represents a conserved CTCF binding motif upstream of the enhancer. Excess cold probe (S) or mutant (M) was used for competitions. Labeled mutant probes do not bind CTCF (M2 and 3).
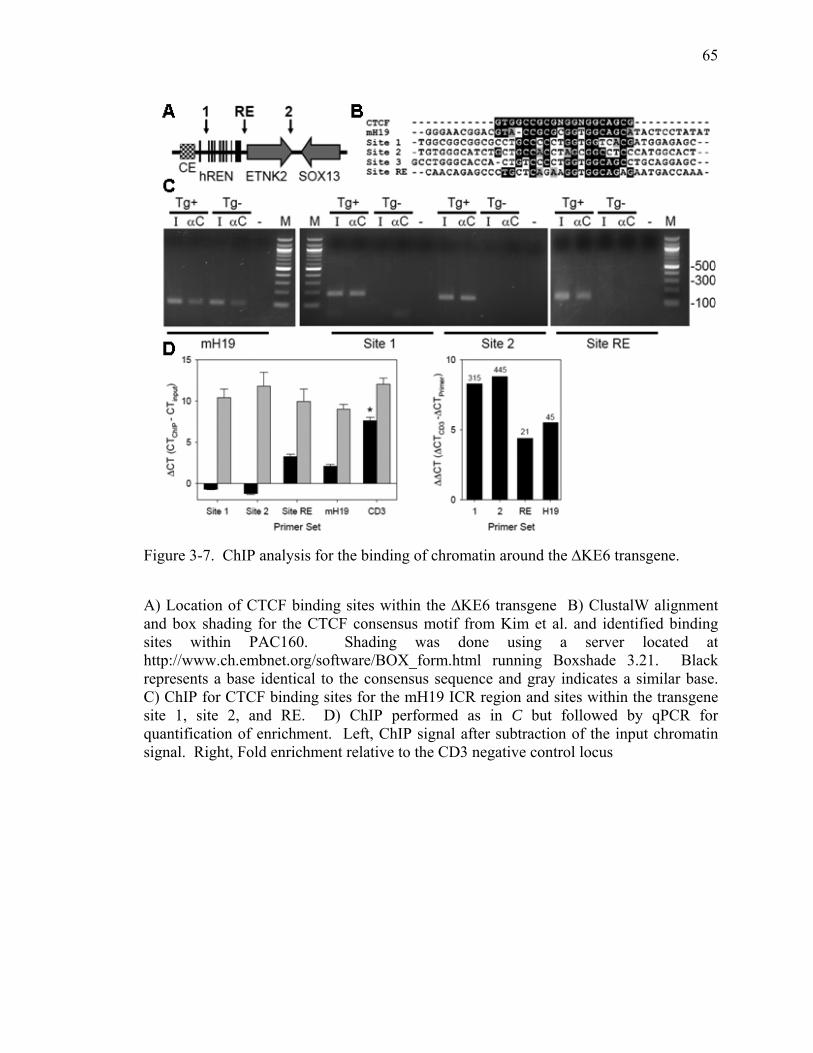
65
Figure 3-7. ChIP analysis for the binding of chromatin around the ∆KE6 transgene.
A) Location of CTCF binding sites within the ∆KE6 transgene B) ClustalW alignment and box shading for the CTCF consensus motif from Kim et al. and identified binding sites within PAC160. Shading was done using a server located at http://www.ch.embnet.org/software/BOX_form.html running Boxshade 3.21. Black represents a base identical to the consensus sequence and gray indicates a similar base. C) ChIP for CTCF binding sites for the mH19 ICR region and sites within the transgene
for quantification of enrichment. Left, ChIP signal after subtraction of the input chromatin signal. Right, Fold enrichment relative to the CD3 negative control locus
site 1, site 2, and RE. D) ChIP performed as in C but followed by qPCR
66
CHAPTER 4
DICER MAINTAINS THE RENIN CELL PHENOTYPE
Introduction
The renin-angiotensin system (RAS) has been established to be important in the
regulation of kidney development. Knockout of RAS components in mice results in
lethality typically between birth and weaning (172-176). Humans with mutations that
inactivate these genes typically die in utero (177). The RAS components are thought to
modulate cell proliferation and differentiation during development or prevent ischemia in
the kidneys. Renin is involved in the rate-limiting step of the RAS and initiates the
cascade of events that leads to angiotensin II production that is important for blood
pressure, electrolyte/fluid, and metabolic homeostasis. Renin knockout mice develop
severe hydronephrosis, cortical atrophy, shrinkage of tubules, interstitial fibrosis,
glomerular sclerosis, and hypertrophy of the kidney vasculature due to increases in cell
numbers (174, 177). These are common features of RAS knockout animals (174, 178-
180). Notably, mice in which the renin cell itself is ablated do not display this
phenotype. This suggests that the renin cell itself or something else that it secretes is
responsible for the hypertrophy. Therefore, the cells surrounding the vessels in RAS
knockout mice are probably cells that were destined to become renin expressing cells.
Small RNAs, particularly microRNAs (miRNA), have become a major area of
research because of their diverse functions. Notably, miRNAs are involved in a variety
of physiological pathways and diseases by regulating gene expression. They are first
transcribed as 100-1000 nt long RNAs that are trimmed by Drosha/DGCR8 in the
nucleus and then transported to the cytoplasm by exportin-5. The enzyme Dicer then
processes them for loading into the RNA induced silencing complex (RISC) which the
miRNA guides to target mRNAs to carry out gene repression. They do this primarily
through repression of translation, but can also cause RNA degradation.
67
The development of several tissues and organs are regulated by miRNAs (181-
185). The knockout of Dicer using specifically expressed cre recombinase expressing
lines and the Dicer-flox mouse expressing lines has been utilized by others to determine
if miRNAs are involved in development or disease because its deletion results in the
absence of miRNA expression in the targeted tissue or cell-type. The deletion of Dicer
has been performed in cells of the nephron lineage epithelium and the collecting duct
epithelium (186-188). It results in the termination of nephrogenesis or severe kidney
abnormalities. When specifically deleted in podocytes, loss of dicer results in the
progression of glomerular disease (186, 187). Given their role in the development of
other tissues and cell-types, we were interested in determining what role microRNAs
(miRNA) play in the maintenance of the renin expressing cell.
Methods
Generation of Dicer KO mice
Mice expressing Cre recombinase from the endogenous renin locus Ren1dcre/+
were bred to mice homozygous for the Dicer floxed allele (Dicerflox/flox). A second cross
of Ren1dcre/+; Dicerflox/+ offspring were bred to Dicerflox/flox to produce Ren1dcre/+;
Dicerflox/flox knockout mice. Alternatively, because Cre may not efficiently delete both
alleles, heterozygous knockout mice Dicer∆/flox were bred to Ren1dcre/+ so that Cre only
had to delete one allele (189, 190). Control mice were Dicerflox/+; Ren1dcre/+ to ensure
comparisons were done in mice with the same number of renin gene alleles.
All mice were fed with standard mouse chow (LM-485; Teklad Premier
Laboratory Diets) and water ad libitum. Care and use of mice met the standards set forth
by the National Institutes of Health and all procedures were approved by the University
of Iowa Animal Care and Use Committee at the University of Iowa.
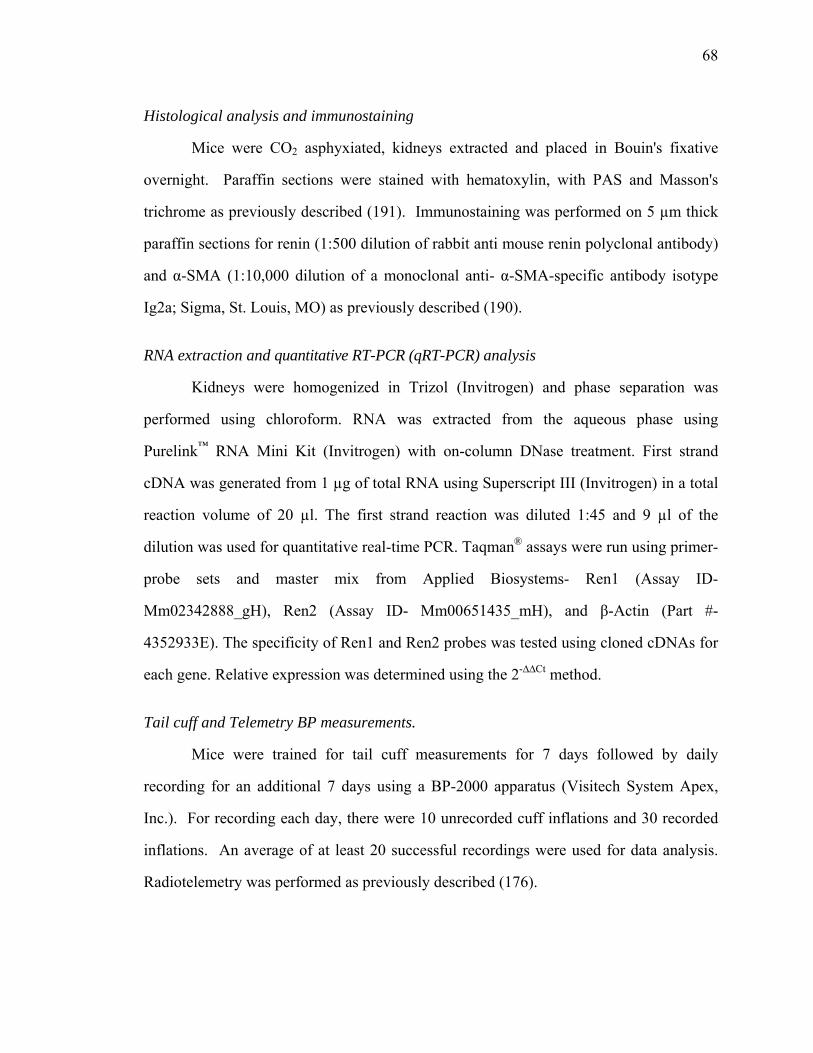
68
Histological analysis and immunostaining
Mice were CO2 asphyxiated, kidneys extracted and placed in Bouin's fixative
overnight. Paraffin sections were stained with hematoxylin, with PAS and Masson's
trichrome as previously described (191). Immunostaining was performed on 5 µm thick
paraffin sections for renin (1:500 dilution of rabbit anti mouse renin polyclonal antibody)
and α-SMA (1:10,000 dilution of a monoclonal anti- α-SMA-specific antibody isotype
Ig2a; Sigma, St. Louis, MO) as previously described (190).
RNA extraction and quantitative RT-PCR (qRT-PCR) analysis
Kidneys were homogenized in Trizol (Invitrogen) and phase separation was
performed using chloroform. RNA was extracted from the aqueous phase using
Purelink™ RNA Mini Kit (Invitrogen) with on-column DNase treatment. First strand
cDNA was generated from 1 µg of total RNA using Superscript III (Invitrogen) in a total
reaction volume of 20 µl. The first strand reaction was diluted 1:45 and 9 µl of the
dilution was used for quantitative real-time PCR. Taqman® assays were run using primer-
probe sets and master mix from Applied Biosystems- Ren1 (Assay ID-
Mm02342888_gH), Ren2 (Assay ID- Mm00651435_mH), and β-Actin (Part #-
4352933E). The specificity of Ren1 and Ren2 probes was tested using cloned cDNAs for
each gene. Relative expression was determined using the 2-∆∆Ct method.
Tail cuff and Telemetry BP measurements.
Mice were trained for tail cuff measurements for 7 days followed by daily
recording for an additional 7 days using a BP-2000 apparatus (Visitech System Apex,
Inc.). For recording each day, there were 10 unrecorded cuff inflations and 30 recorded
inflations. An average of at least 20 successful recordings were used for data analysis.
Radiotelemetry was performed as previously described (176).
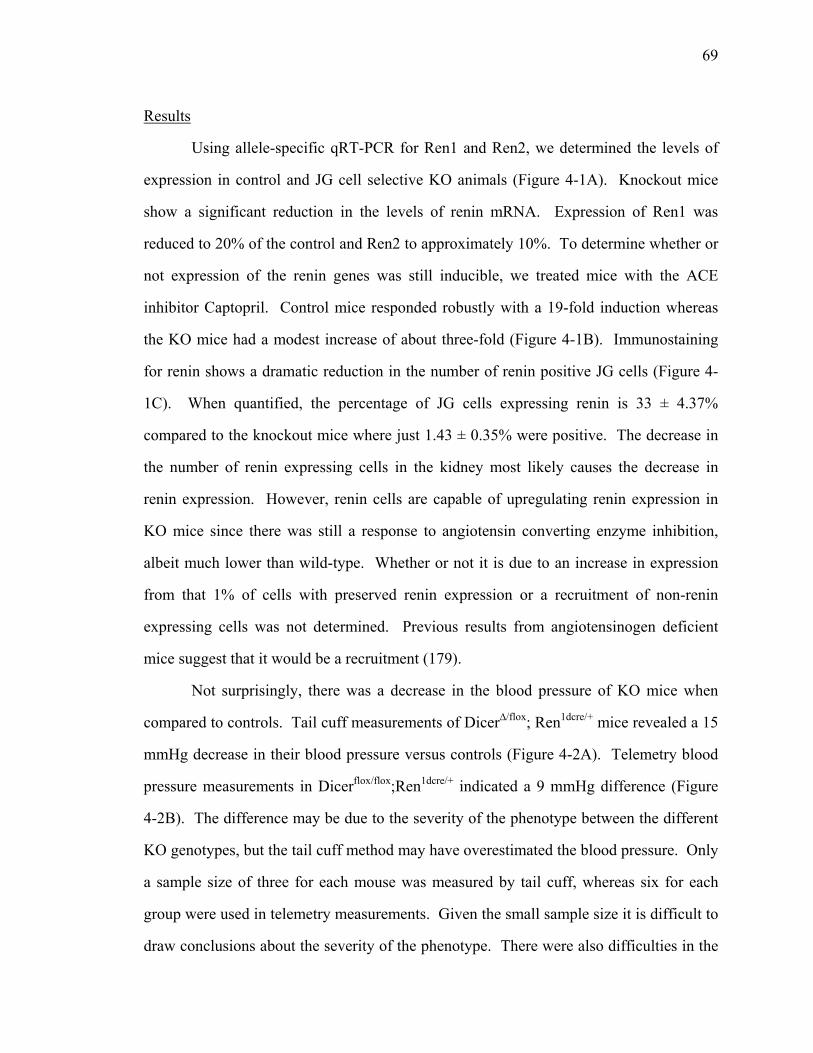
69
Results
Using allele-specific qRT-PCR for Ren1 and Ren2, we determined the levels of
expression in control and JG cell selective KO animals (Figure 4-1A). Knockout mice
show a significant reduction in the levels of renin mRNA. Expression of Ren1 was
reduced to 20% of the control and Ren2 to approximately 10%. To determine whether or
not expression of the renin genes was still inducible, we treated mice with the ACE
inhibitor Captopril. Control mice responded robustly with a 19-fold induction whereas
the KO mice had a modest increase of about three-fold (Figure 4-1B). Immunostaining
for renin shows a dramatic reduction in the number of renin positive JG cells (Figure 4-
1C). When quantified, the percentage of JG cells expressing renin is 33 ± 4.37%
compared to the knockout mice where just 1.43 ± 0.35% were positive. The decrease in
the number of renin expressing cells in the kidney most likely causes the decrease in
renin expression. However, renin cells are capable of upregulating renin expression in
KO mice since there was still a response to angiotensin converting enzyme inhibition,
albeit much lower than wild-type. Whether or not it is due to an increase in expression
from that 1% of cells with preserved renin expression or a recruitment of non-renin
expressing cells was not determined. Previous results from angiotensinogen deficient
mice suggest that it would be a recruitment (179).
Not surprisingly, there was a decrease in the blood pressure of KO mice when
compared to controls. Tail cuff measurements of Dicer∆/flox; Ren1dcre/+ mice revealed a 15
mmHg decrease in their blood pressure versus controls (Figure 4-2A). Telemetry blood
pressure measurements in Dicerflox/flox;Ren1dcre/+ indicated a 9 mmHg difference (Figure
4-2B). The difference may be due to the severity of the phenotype between the different
KO genotypes, but the tail cuff method may have overestimated the blood pressure. Only
a sample size of three for each mouse was measured by tail cuff, whereas six for each
group were used in telemetry measurements. Given the small sample size it is difficult to
draw conclusions about the severity of the phenotype. There were also difficulties in the
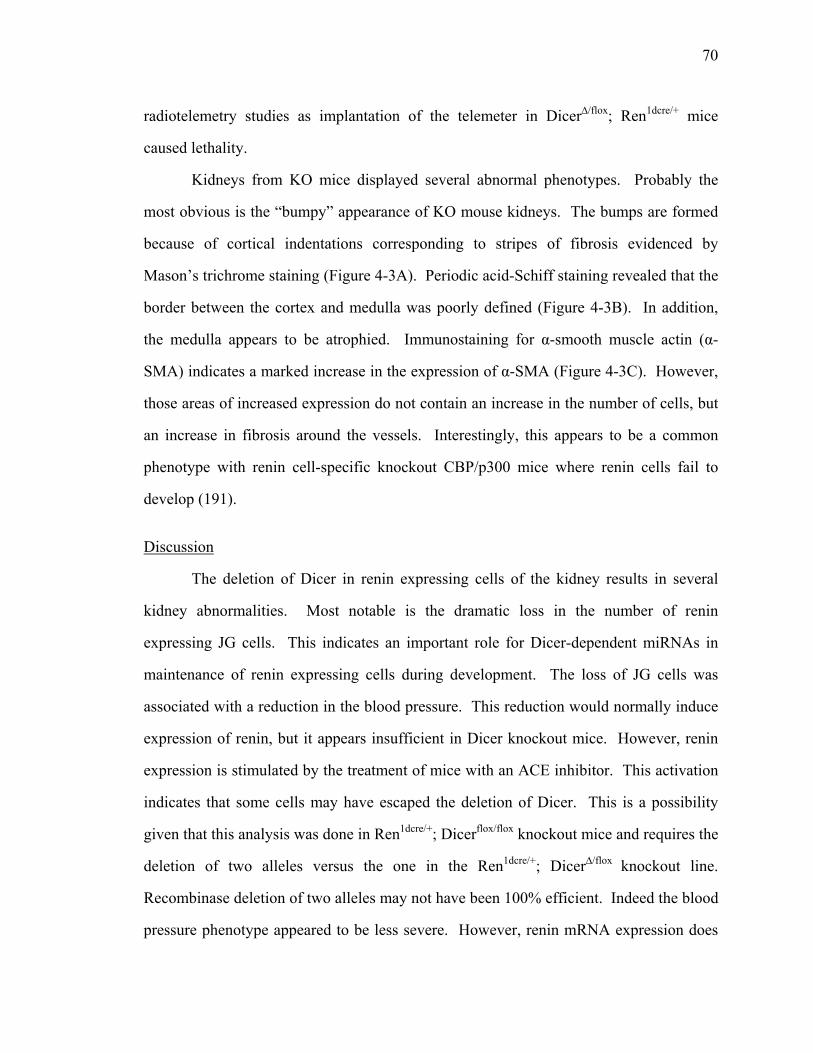
70
radiotelemetry studies as implantation of the telemeter in Dicer∆/flox; Ren1dcre/+ mice
caused lethality.
Kidneys from KO mice displayed several abnormal phenotypes. Probably the
most obvious is the “bumpy” appearance of KO mouse kidneys. The bumps are formed
because of cortical indentations corresponding to stripes of fibrosis evidenced by
Mason’s trichrome staining (Figure 4-3A). Periodic acid-Schiff staining revealed that the
border between the cortex and medulla was poorly defined (Figure 4-3B). In addition,
the medulla appears to be atrophied. Immunostaining for α-smooth muscle actin (α-
SMA) indicates a marked increase in the expression of α-SMA (Figure 4-3C). However,
those areas of increased expression do not contain an increase in the number of cells, but
an increase in fibrosis around the vessels. Interestingly, this appears to be a common
phenotype with renin cell-specific knockout CBP/p300 mice where renin cells fail to
develop (191).
Discussion
The deletion of Dicer in renin expressing cells of the kidney results in several
kidney abnormalities. Most notable is the dramatic loss in the number of renin
expressing JG cells. This indicates an important role for Dicer-dependent miRNAs in
maintenance of renin expressing cells during development. The loss of JG cells was
associated with a reduction in the blood pressure. This reduction would normally induce
expression of renin, but it appears insufficient in Dicer knockout mice. However, renin
expression is stimulated by the treatment of mice with an ACE inhibitor. This activation
indicates that some cells may have escaped the deletion of Dicer. This is a possibility
given that this analysis was done in Ren1dcre/+; Dicerflox/flox knockout mice and requires the
deletion of two alleles versus the one in the Ren1dcre/+; Dicer∆/flox knockout line.
Recombinase deletion of two alleles may not have been 100% efficient. Indeed the blood
pressure phenotype appeared to be less severe. However, renin mRNA expression does
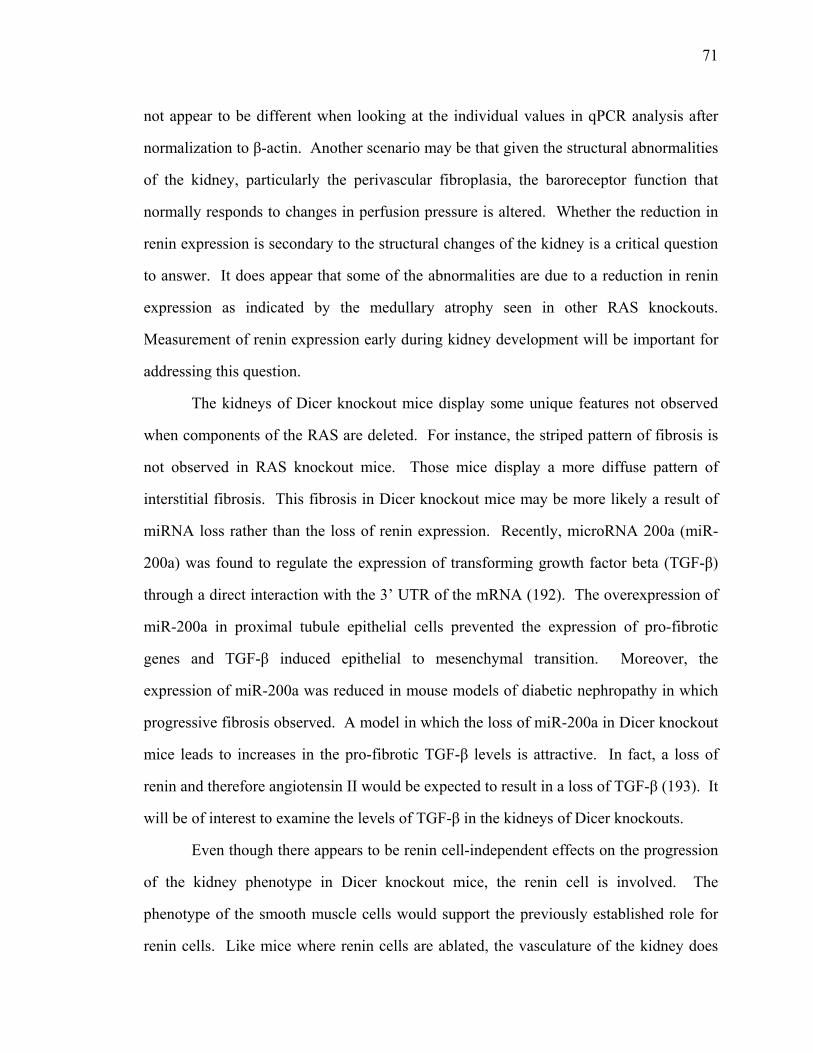
71
not appear to be different when looking at the individual values in qPCR analysis after
normalization to β-actin. Another scenario may be that given the structural abnormalities
of the kidney, particularly the perivascular fibroplasia, the baroreceptor function that
normally responds to changes in perfusion pressure is altered. Whether the reduction in
renin expression is secondary to the structural changes of the kidney is a critical question
to answer. It does appear that some of the abnormalities are due to a reduction in renin
expression as indicated by the medullary atrophy seen in other RAS knockouts.
Measurement of renin expression early during kidney development will be important for
addressing this question.
The kidneys of Dicer knockout mice display some unique features not observed
when components of the RAS are deleted. For instance, the striped pattern of fibrosis is
not observed in RAS knockout mice. Those mice display a more diffuse pattern of
interstitial fibrosis. This fibrosis in Dicer knockout mice may be more likely a result of
miRNA loss rather than the loss of renin expression. Recently, microRNA 200a (miR-
200a) was found to regulate the expression of transforming growth factor beta (TGF-β)
through a direct interaction with the 3’ UTR of the mRNA (192). The overexpression of
miR-200a in proximal tubule epithelial cells prevented the expression of pro-fibrotic
genes and TGF-β induced epithelial to mesenchymal transition. Moreover, the
expression of miR-200a was reduced in mouse models of diabetic nephropathy in which
progressive fibrosis observed. A model in which the loss of miR-200a in Dicer knockout
mice leads to increases in the pro-fibrotic TGF-β levels is attractive. In fact, a loss of
renin and therefore angiotensin II would be expected to result in a loss of TGF-β (193). It
will be of interest to examine the levels of TGF-β in the kidneys of Dicer knockouts.
Even though there appears to be renin cell-independent effects on the progression
of the kidney phenotype in Dicer knockout mice, the renin cell is involved. The
phenotype of the smooth muscle cells would support the previously established role for
renin cells. Like mice where renin cells are ablated, the vasculature of the kidney does
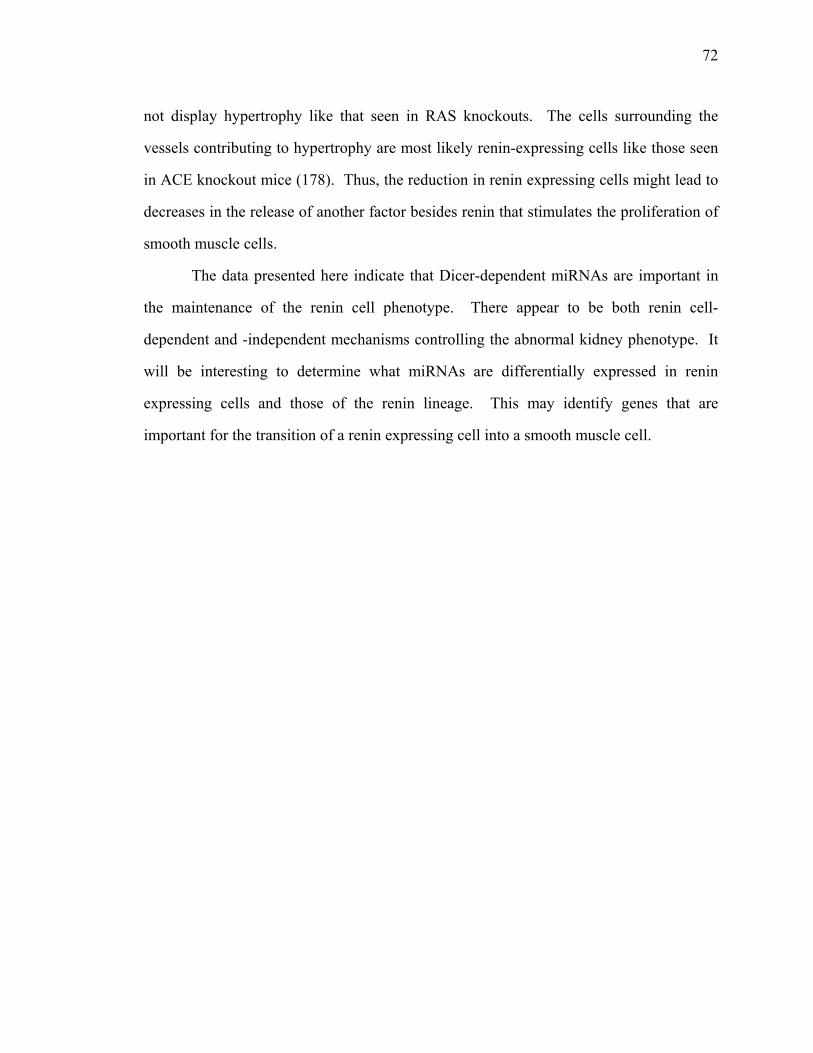
72
not display hypertrophy like that seen in RAS knockouts. The cells surrounding the
vessels contributing to hypertrophy are most likely renin-expressing cells like those seen
in ACE knockout mice (178). Thus, the reduction in renin expressing cells might lead to
decreases in the release of another factor besides renin that stimulates the proliferation of
smooth muscle cells.
The data presented here indicate that Dicer-dependent miRNAs are important in
the maintenance of the renin cell phenotype. There appear to be both renin cell-
dependent and -independent mechanisms controlling the abnormal kidney phenotype. It
will be interesting to determine what miRNAs are differentially expressed in renin
expressing cells and those of the renin lineage. This may identify genes that are
important for the transition of a renin expressing cell into a smooth muscle cell.
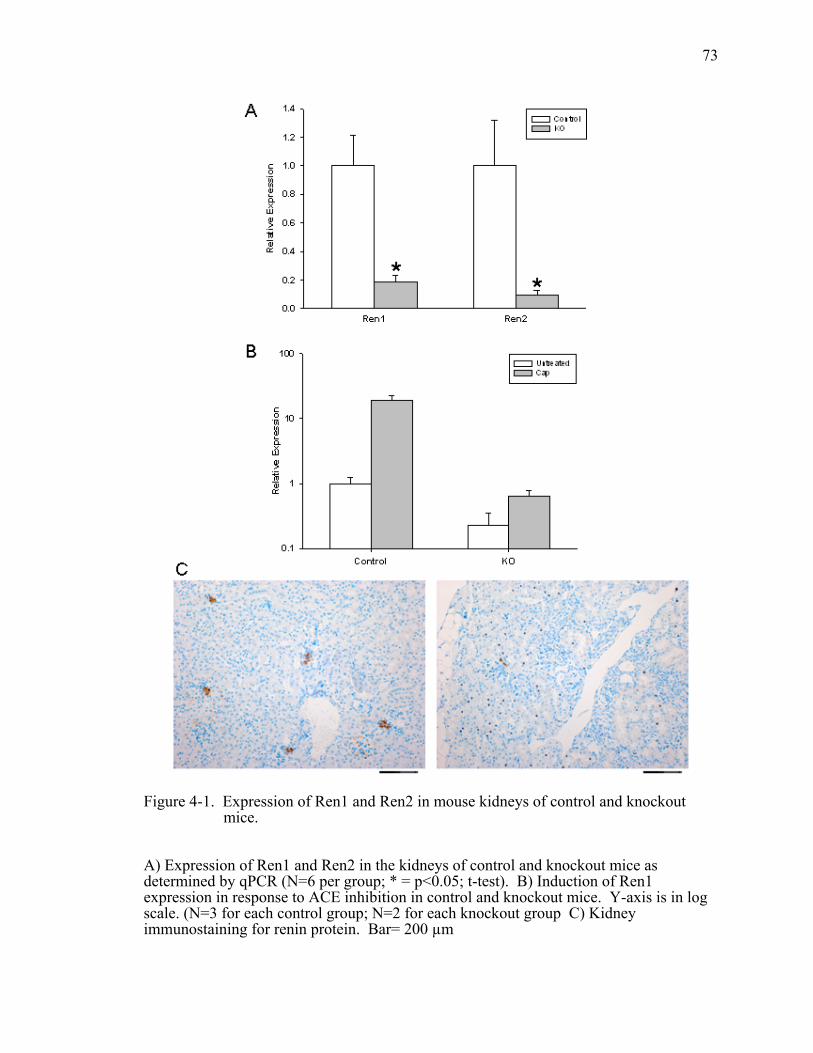
73
Figure 4-1. Expression of Ren1 and Ren2 in mouse kidneys of control and knockout mice.
A) Expression of Ren1 and Ren2 in the kidneys of control and knockout mice as determined by qPCR (N=6 per group; * = p<0.05; t-test). B) Induction of Ren1 expression in response to ACE inhibition in control and knockout mice. Y-axis is in log scale. (N=3 for each control group; N=2 for each knockout group C) Kidney immunostaining for renin protein. Bar= 200 µm
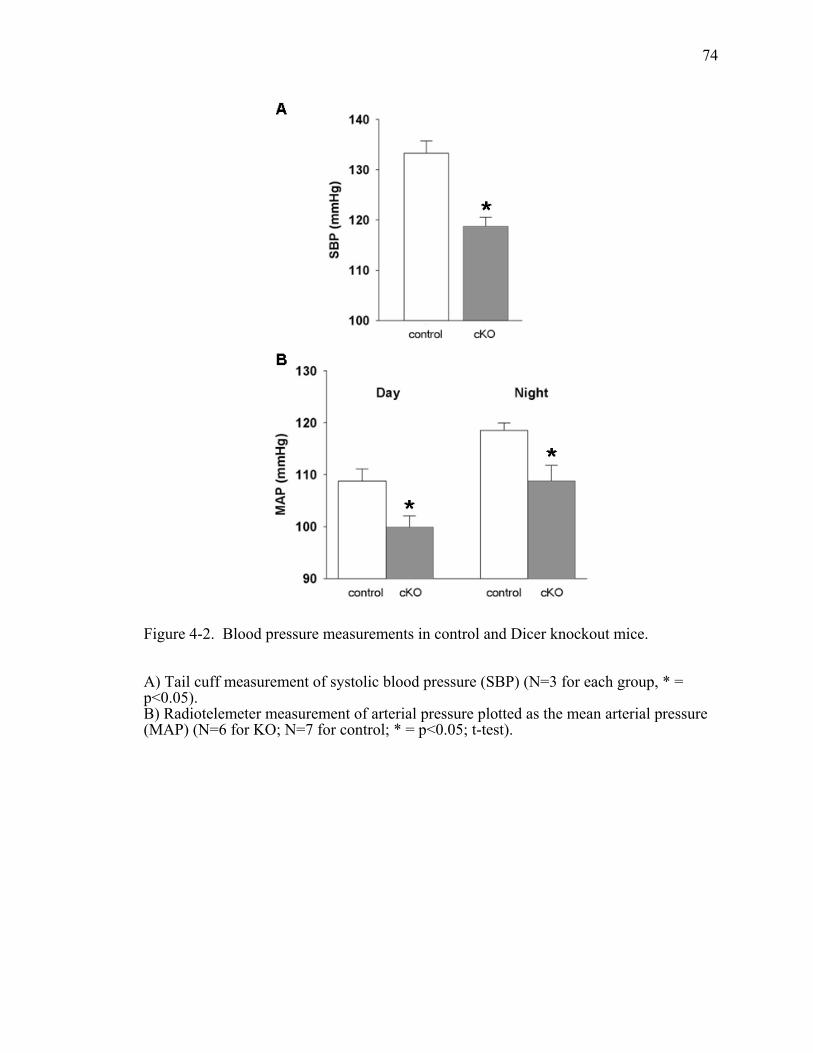
74
Figure 4-2. Blood pressure measurements in control and Dicer knockout mice.
A) Tail cuff measurement of systolic blood pressure (SBP) (N=3 for each group, * = p<0.05). B) Radiotelemeter measurement of arterial pressure plotted as the mean arterial pressure (MAP) (N=6 for KO; N=7 for control; * = p<0.05; t-test).
75
Figure 4-3. Histology of control and Dicer knockout mice.
A) Mason’s trichrome staining of control (left) and Dicer knockout (right) mice for assessment of collagen deposition (blue) and fibrosis. B) Periodic acid Schiff staining for membrane integrity. Arrows indicate cortical indentations. C) α-smooth muscle actin staining (brown) for marking vascular smooth muscle cells.
76
CHAPTER 5
GENERAL DISCUSSION
Renin Expression and Maintenance of the Renin Cell Phenotype
Summary of Results
My studies have focused on three different aspects of the regulation of renin.
First, I have examined the role of the orphan nuclear receptors Nr2f2, Nr2f6, and Nr4a1
in regulating renin expression. Both Nr2f2 and Nr2f6 are negative regulators of the renin
promoter and can bind to the hormone response element of the enhancer to mediate that
effect. However, Nr2f2 does not regulate baseline expression of the endogenous gene.
The orphan Nr4a1 acts as a positive regulator, but it does not do so through direct binding
to the HRE. Future experiments will be aimed at determining what signals can activate
Nr2f2 and its actions and how Nr4a1 might exert its function.
Second, I have identified CTCF binding sites in and around the renin locus. The
insertion of a truncated phage artificial chromosome (PAC) transgene in the mouse
Zbtb20 gene resulted in ubiquitous renin expression. However, ETNK2 maintained its
normal pattern of expression. A CTCF binding site between renin and ETNK2 probably
represents an insulator that shields ETNK2 from the influences of regulatory elements in
the Zbtb20 gene. Because of the loss of 5’ upstream sequences in the PAC transgene,
human renin expression downstream of the truncation was driven by regulatory elements
of the Zbtb20 gene. The upstream sequence likely responsible is a CTCF binding site
identified by other groups that was deleted in the broken transgene. Whether the CTCF
binding sites are acting as insulators and what impact they have on renin expression will
be the target of further experimentation.
Third, I have investigated the role of Dicer-dependent microRNAs (miRNAs) in
controlling the maintenance of the renin expressing cell phenotype. The deletion of Dicer
results in a dramatic reduction in the number of juxtaglomerular (JG) cells and severe
77
kidney abnormalities. Which miRNAs are important for the development of smooth
muscle cells that are derived from a renin cell precursor and which are needed for proper
development of renin expressing cells is the main question yet to be answered.
Future Directions
Although each one of the projects above has their own questions still to be
answered, we do not have knowledge of other regulatory elements and those that mediate
the responses to physiological cues. I will therefore focus on a series of experiments that
I believe will contribute generally to the understanding of renin expression regulation.
Each one of the aspects of renin expression studied above is probably impacted at the
level of chromatin. Histone modifications like acetylation and methylation control the
accessibility of DNA for transcription factor binding by affecting nucleosome occupancy.
They can also act as marks for the recruitment of transcription factors. What chromatin
modifications exist at regulatory regions during renin activation or repression remain
largely unexplored. Additionally, it is not known what other sites are accessible to
transcription factors that act as regulatory elements apart from the currently identified
enhancer and promoter. It is now clear that the enhancer functions as a baseline regulator
of renin expression but not an element that controls renin expression in response to
physiological input. The enhancer likely regulates the magnitude of the inhibition or
activation but is not necessary for an intact physiological response. This is evidenced by
the observation that deletion of the enhancer retains physiological responsiveness.
Therefore, it will be important to define the regulatory elements and transcription factors
acting as the primary regulatory elements responding to signals that regulate renin
expression. Identification of those regulatory elements is critical for understanding how
renin expression is regulated by changes in blood pressure and electrolytes.
In order to identify other regulatory elements it will first require determination of
the regions that are accessible to transcription factor binding. Formaldehyde assisted
78
isolation of regulatory elements (FAIRE) is more amenable for probing the large 5’
upstream sequence of renin over traditional methods like DNase hypersensitivity for
finding accessible regions (194). It exploits differences in the crosslinkability of histones
versus other proteins to DNA. After formaldehyde crosslinking of cell chromatin,
nucleosome free regions of active gene promoters preferentially segregate into the
aqueous phase upon phenol-chloroform extraction. Sites representing nucleosome free
regions can be probed for enrichment using PCR. This is much more amenable for
screening a large upstream region like that of renin rather than using Southern blots to
identify DNase hypersensitive sites. Using this approach combined with sequence
conservation information will allow for the identification of new regulatory elements that
may be the regulators of renin expression in response to physiological cues.
Identification of nucleosome free regions as a first step would be canonical to the
characterization of the β-globin gene (195-198). Regulatory regions in that gene were
initially identified using DNase hypersensitivity assays. That analysis localized several
nucleosome free regions that have now been found to be important in cell-specific
regulation of the β-globin locus. At least two of these regions are CTCF insulator
binding sites that exhibit enhancer blocking activity. Another is an insulator with barrier
activity that does not require CTCF. Identifying accessible regions in and around the
renin locus will allow for the prioritization of regions for future studies. Of course the
potential CTCF binding sites would be important sites to test initially. Additionally,
primer sets spanning the renin intron and 5’ upstream sequence of renin could be
designed to explore those regions. This analysis would not only be useful in As4.1 cells
that express renin at a very high level, but also non-renin expressing cells that can be
induced to express renin. The sites accessible in both As4.1 cells and those induced to
express renin, but not in non-renin expressing cells, would be attractive candidates for
regulatory elements important for recruitment and maintenance of renin expressing cells.
This may be of particular interest in the case of renin expressing cell recruitment since
79
histone acetylation appears to play an important role (199). Those acetylated regions are
most likely those that become accessible to transcription factor binding and regulate
induction of renin expression.
Once accessible regions are identified, the transcription factors that bind them
must be identified. This could be accomplished through the use of the DAPA assay we
have developed combined with stable isotope labeling of amino acids in cell culture
(SILAC). This method utilizes the differential labeling of two cell populations. One
population is labeled with a stable isotope tagged amino acid and the other is not.
Nuclear extracts from each cell population are incubated with biotin labeled double
stranded DNA probe corresponding to the site of interest or a mutant probe. Proteins
binding to each probe are precipitated with streptavidin beads, mixed together, and run on
a mass spectrometer. The stable isotope labeling provides enough of a shift in peptide
peaks that those from wild-type and mutant probes can be identified. If a peak for the
wild-type shows greater abundance over the mutant probe peak it indicates a binding
protein for that sequence. That peptide can then be searched for in protein databases for
identification. This approach has been shown to be very successful at identifying
proteins that show differential DNA binding to sequences differing by a single nucleotide
(200). Not only can it be applied to new regulatory elements but it can also be used for
the HRE and proximal promoter element. Additionally, extracts from cell populations
treated with different stimuli or inhibitors could be tested for transcription factors that
show enrichment for binding under different conditions.
Once potential regulatory elements and the proteins that bind them have been
identified, their functional relevance must be assessed. In order to do this we can utilize
the BAC/PAC recombineering methods already developed in our lab to delete these
sequences. By creating transgenic mice from these constructs, the role of the deleted
elements can be determined by assessing the response of renin to physiological cues.
Alternatively, stable transfections using the modified PACs could be made. Those cells
80
could then be subjected to cAMP induction or stimulation of increases in intracellular
Ca2+. These two stimuli are known to have an important role in the physiological
regulation of renin expression. However, a suitable cell line may be difficult to choose
given the lack of cAMP response in As4.1 cells. Of course the first sequences that should
be deleted using BAC recombineering and transgenic production are those CTCF binding
sites that we have identified.
Utilization of the methods above would allow for us to move beyond analysis of
just the enhancer and promoter. Although important for the regulation of renin
expression they do not represent the only elements involved. In order to move forward in
determining how renin is regulated, those sites that can act as regulatory elements must
be identified. Additionally, sequences that define the renin locus must be identified to
narrow the region of interest. It is most likely to consist of the region that spans from the
CTCF binding sites in GOLT1A to the renin-ETNK2 intergenic site (Figure 2-6). Once
the borders of the renin locus are identified we can localize the elements within them that
regulate renin expression. The difficulty is in identifying the sites responsible for the
induction or repression of renin expression rather than just the baseline expression. It is
therefore attractive to create transgenic mice in which cells expressing or capable of
expressing renin are in their native context making contacts with cells that may be
important for the transmission of regulatory signals. We have developed the tools
necessary to identify new regulatory elements and transcription factors, now we must
apply them to advance the field further.
81
REFERENCES
1. Goldblatt H, Lynch J, Hanzal RF and Summerville WW. STUDIES ON EXPERIMENTAL HYPERTENSION : I. THE PRODUCTION OF PERSISTENT ELEVATION OF SYSTOLIC BLOOD PRESSURE BY MEANS OF RENAL ISCHEMIA. J Exp Med 59: 347-379, 1934.
2. Goldblatt H. The renal origin of hypertension. Physiol Rev 27: 120-165, 1947.
3. Page IH. ON THE NATURE OF THE PRESSOR ACTION OF RENIN. J Exp Med 70: 521-542, 1939.
4. BRAUN-MENENDEZ E, Fasciolo JC, Leloir LF and Munoz JM. The substance causing renal hypertension. J Physiol 98: 283-298, 1940.
5. Skeggs LT, Jr., MARSH WH, Kahn JR and SHUMWAY NP. The existence of two forms of hypertensin. J Exp Med 99: 275-282, 1954.
6. Leloir LF, Munoz JM, Taquini AC, BRAUN-MENENDEZ E and Fasciolo JC. La formacion del angiotensinogeno. Revista argentina de cardiologia 9: 269-278, 1942.
7. Basso N and Terragno NA. History about the discovery of the renin-angiotensin system. Hypertension 38: 1246-1249, 2001.
8. Skeggs LT, Jr., Kahn JR and SHUMWAY NP. The preparation and function of the hypertensin-converting enzyme. J Exp Med 103: 295-299, 1956.
9. Laragh JH, ANGERS M, KELLY WG and LIEBERMAN S. Hypotensive agents and pressor substances. The effect of epinephrine, norepinephrine, angiotensin II, and others on the secretory rate of aldosterone in man. JAMA 174: 234-240, 1960.
10. Lin SY and Goodfriend TL. Angiotensin receptors. Am J Physiol 218: 1319-1328, 1970.
11. Ferreira SH. A BRADYKININ-POTENTIATING FACTOR (BPF) PRESENT IN THE VENOM OF BOTHROPS JARARCA. Br J Pharmacol Chemother 24: 163-169, 1965.
12. Bakhle YS. Conversion of angiotensin I to angiotensin II by cell-free extracts of dog lung. Nature 220: 919-921, 1968.
13. Cushman DW and Ondetti MA. History of the design of captopril and related inhibitors of angiotensin converting enzyme. Hypertension 17: 589-592, 1991.
14. Donoghue M, Hsieh F, Baronas E, Godbout K, Gosselin M, Stagliano N, Donovan M, Woolf B, Robison K, Jeyaseelan R, Breitbart RE and Acton S. A novel angiotensin-converting enzyme-related carboxypeptidase (ACE2) converts angiotensin I to angiotensin 1-9. Circ Res 87: E1-E9, 2000.
15. Turner AJ, Tipnis SR, Guy JL, Rice G and Hooper NM. ACEH/ACE2 is a novel mammalian metallocarboxypeptidase and a homologue of angiotensin-converting enzyme insensitive to ACE inhibitors. Can J Physiol Pharmacol 80: 346-353, 2002.
82
16. Iwai M and Horiuchi M. Devil and angel in the renin-angiotensin system: ACE-angiotensin II-AT1 receptor axis vs. ACE2-angiotensin-(1-7)-Mas receptor axis. Hypertens Res 32: 533-536, 2009.
17. Nguyen G, Delarue F, Burckle C, Bouzhir L, Giller T and Sraer JD. Pivotal role of the renin/prorenin receptor in angiotensin II production and cellular responses to renin. J Clin Invest 109: 1417-1427, 2002.
18. Brunner HR, Gavras H, Waeber B, Kershaw GR, Turini GA, Vukovich RA, McKinstry DN and Gavras I. Oral angiotensin-converting enzyme inhibitor in long-term treatment of hypertensive patients. Ann Intern Med 90: 19-23, 1979.
19. Dzau VJ, Bernstein K, Celermajer D, Cohen J, Dahlof B, Deanfield J, Diez J, Drexler H, Ferrari R, Van Gilst W, Hansson L, Hornig B, Husain A, Johnston C, Lazar H, Lonn E, Luscher T, Mancini J, Mimran A, Pepine C, Rabelink T, Remme W, Ruilope L, Ruzicka M, Schunkert H, Swedberg K, Unger T, Vaughan D and Weber M. The relevance of tissue angiotensin-converting enzyme: manifestations in mechanistic and endpoint data. Am J Cardiol 88: 1L-20L, 2001.
20. Sinn PL and Sigmund CD. Identification of three human renin mRNA isoforms from alternative tissue-specific transcriptional initiation. Physiol Genomics 3: 25-31, 2000.
21. Xu D, Borges GR, Grobe JL, Pelham CJ, Yang B and Sigmund CD. Preservation of intracellular renin expression is insufficient to compensate for genetic loss of secreted renin. Hypertension 54: 1240-1247, 2009.
22. Morimoto S, Cassell MD and Sigmund CD. Glia- and neuron-specific expression of the renin-angiotensin system in brain alters blood pressure, water intake, and salt preference. J Biol Chem 277: 33235-33241, 2002.
23. Sakai K, Agassandian K, Morimoto S, Sinnayah P, Cassell MD, Davisson RL and Sigmund CD. Local production of angiotensin II in the subfornical organ causes elevated drinking. J Clin Invest 117: 1088-1095, 2007.
24. Grobe JL, Grobe CL, Beltz TG, Westphal SG, Morgan DA, Xu D, de Lange WJ, Li H, Sakai K, Thedens DR, Cassis LA, Rahmouni K, Mark AL, Johnson AK and Sigmund CD. The brain Renin-Angiotensin system controls divergent efferent mechanisms to regulate fluid and energy balance. Cell Metab 12: 431-442, 2010.
25. Davisson RL, Ding Y, Stec DE, Catterall JF and Sigmund CD. Novel mechanism of hypertension revealed by cell-specific targeting of human angiotensinogen in transgenic mice. Physiol Genomics 1: 3-9, 1999.
26. Ezzati M, Lopez AD, Rodgers A, Vander HS and Murray CJ. Selected major risk factors and global and regional burden of disease. Lancet 360: 1347-1360, 2002.
27. Kearney PM, Whelton M, Reynolds K, Muntner P, Whelton PK and He J. Global burden of hypertension: analysis of worldwide data. Lancet 365: 217-223, 2005.
28. Sleight P, Yusuf S, Pogue J, Tsuyuki R, Diaz R and Probstfield J. Blood-pressure reduction and cardiovascular risk in HOPE study. Lancet 358: 2130-2131, 2001.
83
29. Sleight P and Yusuf S. New evidence on the importance of the renin-angiotensin system in the treatment of higher-risk patients with hypertension. J Hypertens 21: 1599-1608, 2003.
30. Weir MR and Dzau VJ. The renin-angiotensin-aldosterone system: a specific target for hypertension management. Am J Hypertens 12: 205S-213S, 1999.
31. Lifton RP, Gharavi AG and Geller DS. Molecular mechanisms of human hypertension. Cell 104: 545-556, 2001.
32. Frossard PM, Lestringant GG, Malloy MJ and Kane JP. Human renin gene BglI dimorphism associated with hypertension in two independent populations. Clin Genet 56: 428-433, 1999.
33. Ahmad U, Mahmood MS, Siddiqui S and Frossard PM. Effects of apolipoprotein E polymorphism on the development of stroke. J Pak Med Assoc 54: 626-632, 2004.
34. Davisson RL, Kim HS, Krege JH, Lager DJ, Smithies O and Sigmund CD. Complementation of reduced survival, hypotension, and renal abnormalities in angiotensinogen-deficient mice by the human renin and human angiotensinogen genes. J Clin Invest 99: 1258-1264, 1997.
35. Gribouval O, Gonzales M, Neuhaus T, Aziza J, Bieth E, Laurent N, Bouton JM, Feuillet F, Makni S, Ben Amar H, Laube G, Delezoide AL, Bouvier R, Dijoud F, Ollagnon-Roman E, Roume J, Joubert M, Antignac C and Gubler MC. Mutations in genes in the renin-angiotensin system are associated with autosomal recessive renal tubular dysgenesis. Nat Genet 37: 964-968, 2005.
36. Robillard JE, Weismann DN, Gomez RA, Ayres NA, Lawton WJ and VanOrden DE. Renal and adrenal responses to converting-enzyme inhibition in fetal and newborn life. Am J Physiol 244: R249-R256, 1983.
37. Takahashi N, Lopez ML, Cowhig JE, Jr., Taylor MA, Hatada T, Riggs E, Lee G, Gomez RA, Kim HS and Smithies O. Ren1c homozygous null mice are hypotensive and polyuric, but heterozygotes are indistinguishable from wild-type. J Am Soc Nephrol 16: 125-132, 2005.
38. Sigmund CD, Jones CA, Fabian JR, Mullins JJ and Gross KW. Tissue and cell specific expression of a renin promoter-reporter gene construct in transgenic mice. Biochem Biophys Res Commun 170: 344-350, 1990.
39. Lang JA, Yang G, Kern JA and Sigmund CD. Endogenous human renin expression and promoter activity in CALU-6, a pulmonary carcinoma cell line. Hypertension 25: 704-710, 1995.
40. Sigmund CD, Okuyama K, Ingelfinger J, Jones CA, Mullins JJ, Kane C, Kim U, Wu CZ, Kenny L, Rustum Y and . Isolation and characterization of renin-expressing cell lines from transgenic mice containing a renin-promoter viral oncogene fusion construct. J Biol Chem 265: 19916-19922, 1990.
41. Petrovic N, Black TA, Fabian JR, Kane C, Jones CA, Loudon JA, Abonia JP, Sigmund CD and Gross KW. Role of proximal promoter elements in regulation of renin gene transcription. J Biol Chem 271: 22499-22505, 1996.
84
42. Pan L, Black TA, Shi Q, Jones CA, Petrovic N, Loudon J, Kane C, Sigmund CD and Gross KW. Critical roles of a cyclic AMP responsive element and an E-box in regulation of mouse renin gene expression. J Biol Chem 276: 45530-45538, 2001.
43. Shi Q. Enhancer Mediated Regulation of Renin Gene Transcription (Dissertation). University of Iowa, 2001.
44. Todorov VT, Volkl S, Muller M, Bohla A, Klar J, Kunz-Schughart LA, Hehlgans T and Kurtz A. Tumor necrosis factor-alpha activates NFkappaB to inhibit renin transcription by targeting cAMP-responsive element. J Biol Chem 279: 1458-1467, 2004.
45. Shi Q, Gross KW and Sigmund CD. Retinoic acid-mediated activation of the mouse renin enhancer. J Biol Chem 276: 3597-3603, 2001.
46. Li YC, Kong J, Wei M, Chen ZF, Liu SQ and Cao LP. 1,25-Dihydroxyvitamin D(3) is a negative endocrine regulator of the renin-angiotensin system. J Clin Invest 110: 229-238, 2002.
47. Yuan W, Pan W, Kong J, Zheng W, Szeto FL, Wong KE, Cohen R, Klopot A, Zhang Z and Li YC. 1,25-dihydroxyvitamin D3 suppresses renin gene transcription by blocking the activity of the cyclic AMP response element in the renin gene promoter. J Biol Chem 282: 29821-29830, 2007.
48. Itani HA, Liu X, Pratt JH and Sigmund CD. Functional characterization of polymorphisms in the kidney enhancer of the human renin gene. Endocrinology 148: 1424-1430, 2007.
49. Pan L, Glenn ST, Jones CA, Gronostajski RM and Gross KW. Regulation of renin enhancer activity by nuclear factor I and Sp1/Sp3. Biochim Biophys Acta 1625: 280-290, 2003.
50. Germain S, Konoshita T, Philippe J, Corvol P and Pinet F. Transcriptional induction of the human renin gene by cyclic AMP requires cyclic AMP response element-binding protein (CREB) and a factor binding a pituitary-specific trans-acting factor (Pit-1) motif. Biochem J 316 ( Pt 1): 107-113, 1996.
51. Tanimoto K, Sugiura A, Kanafusa S, Saito T, Masui N, Yanai K and Fukamizu A. A single nucleotide mutation in the mouse renin promoter disrupts blood pressure regulation. J Clin Invest 118: 1006-1016, 2008.
52. Glenn ST, Jones CA, Pan L and Gross KW. In vivo analysis of key elements within the renin regulatory region. Physiol Genomics 35: 243-253, 2008.
53. Pan L, Glenn ST, Jones CA and Gross KW. Activation of the rat renin promoter by HOXD10.PBX1b.PREP1, Ets-1, and the intracellular domain of notch. J Biol Chem 280: 20860-20866, 2005.
54. Tamura K, Umemura S, Nyui N, Yamaguchi S, Ishigami T, Hibi K, Yabana M, Kihara M, Fukamizu A, Murakami K and Ishii M. A novel proximal element mediates the regulation of mouse Ren-1C promoter by retinoblastoma protein in cultured cells. J Biol Chem 272: 16845-16851, 1997.
85
55. Borensztein P, Germain S, Fuchs S, Philippe J, Corvol P and Pinet F. cis-regulatory elements and trans-acting factors directing basal and cAMP-stimulated human renin gene expression in chorionic cells. Circ Res 74: 764-773, 1994.
56. Konoshita T, Makino Y, Wakahara S, Ido K, Yoshida M, Kawai Y and Miyamori I. Candidate cis-elements for human renin gene expression in the promoter region. J Cell Biochem 93: 327-336, 2004.
57. Ying L, Morris BJ and Sigmund CD. Transactivation of the human renin promoter by the cyclic AMP/protein kinase A pathway is mediated by both cAMP-responsive element binding protein-1 (CREB)-dependent and CREB-independent mechanisms in Calu-6 cells. J Biol Chem 272: 2412-2420, 1997.
58. Konoshita T, Fuchs S, Makino Y, Wakahara S and Miyamori I. A proximal direct repeat motif characterized as a negative regulatory element in the human renin gene. J Cell Biochem 102: 1043-1050, 2007.
59. Dreyfus M, Doyen N and Rougeon F. The conserved decanucleotide from the immunoglobulin heavy chain promoter induces a very high transcriptional activity in B-cells when introduced into an heterologous promoter. EMBO J 6: 1685-1690, 1987.
60. Ekker M, Doyen N, Leblond-Francillard M and Rougeon F. A mouse renin promoter containing the conserved decanucleotide element binds the same B-cell factors as an authentic immunoglobulin heavy chain promoter. FEBS Lett 222: 337-340, 1987.
61. Ekker M, Sola C and Rougeon F. The activity of the mouse renin promoter in cells that do not normally produce renin is dependent upon the presence of a functional enhancer. FEBS Lett 255: 241-247, 1989.
62. Grunberger C, Obermayer B, Klar J, Kurtz A and Schweda F. The calcium paradoxon of renin release: calcium suppresses renin exocytosis by inhibition of calcium-dependent adenylate cyclases AC5 and AC6. Circ Res 99: 1197-1206, 2006.
63. Ortiz-Capisano MC, Ortiz PA, Harding P, Garvin JL and Beierwaltes WH. Adenylyl cyclase isoform v mediates renin release from juxtaglomerular cells. Hypertension 49: 618-624, 2007.
64. Klar J, Sigl M, Obermayer B, Schweda F, Kramer BK and Kurtz A. Calcium inhibits renin gene expression by transcriptional and posttranscriptional mechanisms. Hypertension 46: 1340-1346, 2005.
65. Pan L, Wang Y, Jones CA, Glenn ST, Baumann H and Gross KW. Enhancer-dependent inhibition of mouse renin transcription by inflammatory cytokines. Am J Physiol Renal Physiol 288: F117-F124, 2005.
66. Adams DJ, Head GA, Markus MA, Lovicu FJ, van der WL, Kontgen F, Arends MJ, Thiru S, Mayorov DN and Morris BJ. Renin enhancer is critical for control of renin gene expression and cardiovascular function. J Biol Chem 281: 31753-31761, 2006.
67. Zhou X, Davis DR and Sigmund CD. The human renin kidney enhancer is required to maintain base-line renin expression but is dispensable for tissue-specific, cell-specific, and regulated expression. J Biol Chem 281: 35296-35304, 2006.
86
68. Markus MA, Goy C, Adams DJ, Lovicu FJ and Morris BJ. Renin enhancer is crucial for full response in Renin expression to an in vivo stimulus. Hypertension 50: 933-938, 2007.
69. Sinn PL, Davis DR and Sigmund CD. Highly regulated cell type-restricted expression of human renin in mice containing 140- or 160-kilobase pair P1 phage artificial chromosome transgenes. J Biol Chem 274: 35785-35793, 1999.
70. Germain S, Bonnet F, Philippe J, Fuchs S, Corvol P and Pinet F. A novel distal enhancer confers chorionic expression on the human renin gene. J Biol Chem 273: 25292-25300, 1998.
71. Fuchs S, Philippe J, Germain S, Mathieu F, Jeunemaitre X, Corvol P and Pinet F. Functionality of two new polymorphisms in the human renin gene enhancer region. J Hypertens 20: 2391-2398, 2002.
72. Konoshita T, Kato N, Fuchs S, Mizuno S, Aoyama C, Motomura M, Makino Y, Wakahara S, Inoki I, Miyamori I and Pinet F. Genetic variant of the Renin-Angiotensin system and diabetes influences blood pressure response to Angiotensin receptor blockers. Diabetes Care 32: 1485-1490, 2009.
73. Zhou X and Sigmund CD. Chorionic enhancer is dispensable for regulated expression of the human renin gene. Am J Physiol Regul Integr Comp Physiol 294: R279-R287, 2008.
74. Chen M, Schnermann J, Smart AM, Brosius FC, Killen PD and Briggs JP. Cyclic AMP selectively increases renin mRNA stability in cultured juxtaglomerular granular cells. J Biol Chem 268: 24138-24144, 1993.
75. Lang JA, Ying LH, Morris BJ and Sigmund CD. Transcriptional and posttranscriptional mechanisms regulate human renin gene expression in Calu-6 cells. Am J Physiol 271: F94-100, 1996.
76. Germain S, Philippe J, Fuchs S, Lengronne A, Corvol P and Pinet F. Regulation of human renin secretion and gene transcription in Calu-6 cells. FEBS Lett 407: 177-183, 1997.
77. Sinn PL and Sigmund CD. Human renin mRNA stability is increased in response to cAMP in Calu-6 cells. Hypertension 33: 900-905, 1999.
78. Adams DJ, Beveridge DJ, van der WL, Mangs H, Leedman PJ and Morris BJ. HADHB, HuR, and CP1 bind to the distal 3'-untranslated region of human renin mRNA and differentially modulate renin expression. J Biol Chem 278: 44894-44903, 2003.
79. Skalweit A, Doller A, Huth A, Kahne T, Persson PB and Thiele BJ. Posttranscriptional control of renin synthesis: identification of proteins interacting with renin mRNA 3'-untranslated region. Circ Res 92: 419-427, 2003.
80. Han SP, Tang YH and Smith R. Functional diversity of the hnRNPs: past, present and perspectives. Biochem J 430: 379-392, 2010.
87
81. Friis UG, Jensen BL, Sethi S, Andreasen D, Hansen PB and Skott O. Control of renin secretion from rat juxtaglomerular cells by cAMP-specific phosphodiesterases. Circ Res 90: 996-1003, 2002.
82. Schweda F, Friis U, Wagner C, Skott O and Kurtz A. Renin release. Physiology (Bethesda ) 22: 310-319, 2007.
83. Madsen K, Friis UG, Gooch JL, Hansen PB, Holmgaard L, Skott O and Jensen BL. Inhibition of calcineurin phosphatase promotes exocytosis of renin from juxtaglomerular cells. Kidney Int 77: 110-117, 2010.
84. Brechler V, Chu WN, Baxter JD, Thibault G and Reudelhuber TL. A protease processing site is essential for prorenin sorting to the regulated secretory pathway. J Biol Chem 271: 20636-20640, 1996.
85. Chu WN, Mercure C, Baxter JD and Reudelhuber TL. Molecular determinants of human prorenin processing. Hypertension 20: 782-787, 1992.
86. Lee-Kirsch MA, Gaudet F, Cardoso MC and Lindpaintner K. Distinct renin isoforms generated by tissue-specific transcription initiation and alternative splicing. Circ Res 84: 240-246, 1999.
87. Clark AF, Sharp MG, Morley SD, Fleming S, Peters J and Mullins JJ. Renin-1 is essential for normal renal juxtaglomerular cell granulation and macula densa morphology. J Biol Chem 272: 18185-18190, 1997.
88. Mullins LJ, Payne CM, Kotelevtseva N, Brooker G, Fleming S, Harris S and Mullins JJ. Granulation rescue and developmental marking of juxtaglomerular cells using "piggy-BAC" recombination of the mouse ren locus. J Biol Chem 275: 40378-40384, 2000.
89. Pratt RE, Carleton JE, Richie JP, Heusser C and Dzau VJ. Human renin biosynthesis and secretion in normal and ischemic kidneys. Proc Natl Acad Sci U S A 84: 7837-7840, 1987.
90. Rasch R, Jensen BL, Nyengaard JR and Skott O. Quantitative changes in rat renin secretory granules after acute and chronic stimulation of the renin system. Cell Tissue Res 292: 563-571, 1998.
91. Everett AD, Carey RM, Chevalier RL, Peach MJ and Gomez RA. Renin release and gene expression in intact rat kidney microvessels and single cells. J Clin Invest 86: 169-175, 1990.
92. Kim HS, Maeda N, Oh GT, Fernandez LG, Gomez RA and Smithies O. Homeostasis in mice with genetically decreased angiotensinogen is primarily by an increased number of renin-producing cells. J Biol Chem 274: 14210-14217, 1999.
93. Tufro-McReddie A, Arrizurieta EE, Brocca S and Gomez RA. Dietary protein modulates intrarenal distribution of renin and its mRNA during development. Am J Physiol 263: F427-F435, 1992.
88
94. Cantin M, Gutkowska J, Lacasse J, Ballak M, Ledoux S, Inagami T, Beuzeron J and Genest J. Ultrastructural immunocytochemical localization of renin and angiotensin II in the juxtaglomerular cells of the ischemic kidney in experimental renal hypertension. Am J Pathol 115: 212-224, 1984.
95. Gomez RA, Chevalier RL, Everett AD, Elwood JP, Peach MJ, Lynch KR and Carey RM. Recruitment of renin gene-expressing cells in adult rat kidneys. Am J Physiol 259: F660-F665, 1990.
96. Toffelmire EB, Slater K, Corvol P, Menard J and Schambelan M. Response of plasma prorenin and active renin to chronic and acute alterations of renin secretion in normal humans. Studies using a direct immunoradiometric assay. J Clin Invest 83: 679-687, 1989.
97. Takahashi N, Lopez ML, Cowhig JE, Jr., Taylor MA, Hatada T, Riggs E, Lee G, Gomez RA, Kim HS and Smithies O. Ren1c homozygous null mice are hypotensive and polyuric, but heterozygotes are indistinguishable from wild-type. J Am Soc Nephrol 16: 125-132, 2005.
98. Barr M, Jr. and Cohen MM, Jr. ACE inhibitor fetopathy and hypocalvaria: the kidney-skull connection. Teratology 44: 485-495, 1991.
99. Martinovic J, Benachi A, Laurent N, Daikha-Dahmane F and Gubler MC. Fetal toxic effects and angiotensin-II-receptor antagonists. Lancet 358: 241-242, 2001.
100. Gomez RA, Lynch KR, Sturgill BC, Elwood JP, Chevalier RL, Carey RM and Peach MJ. Distribution of renin mRNA and its protein in the developing kidney. Am J Physiol 257: F850-F858, 1989.
101. Sequeira Lopez ML, Pentz ES, Robert B, Abrahamson DR and Gomez RA. Embryonic origin and lineage of juxtaglomerular cells. Am J Physiol Renal Physiol 281: F345-F356, 2001.
102. Sequeira Lopez ML, Pentz ES, Nomasa T, Smithies O and Gomez RA. Renin cells are precursors for multiple cell types that switch to the renin phenotype when homeostasis is threatened. Dev Cell 6: 719-728, 2004.
103. Kurtz L, Janssen-Bienhold U, Kurtz A and Wagner C. Connexin expression in renin-producing cells. J Am Soc Nephrol 20: 506-512, 2009.
104. Hanner F, von Maltzahn J, Maxeiner S, Toma I, Sipos A, Kruger O, Willecke K and Peti-Peterdi J. Connexin45 is expressed in the juxtaglomerular apparatus and is involved in the regulation of renin secretion and blood pressure. Am J Physiol Regul Integr Comp Physiol 295: R371-R380, 2008.
105. Wagner C, Jobs A, Schweda F, Kurtz L, Kurt B, Lopez ML, Gomez RA, van Veen TA, de Wit C and Kurtz A. Selective deletion of Connexin 40 in renin-producing cells impairs renal baroreceptor function and is associated with arterial hypertension. Kidney Int 78: 762-768, 2010.
106. Kurtz L, Schweda F, de Wit C, Kriz W, Witzgall R, Warth R, Sauter A, Kurtz A and Wagner C. Lack of connexin 40 causes displacement of renin-producing cells from afferent arterioles to the extraglomerular mesangium. J Am Soc Nephrol 18: 1103-1111, 2007.
89
107. Krattinger N, Capponi A, Mazzolai L, Aubert JF, Caille D, Nicod P, Waeber G, Meda P and Haefliger JA. Connexin40 regulates renin production and blood pressure. Kidney Int 72: 814-822, 2007.
108. Wagner C, de Wit C, Kurtz L, Grunberger C, Kurtz A and Schweda F. Connexin40 is essential for the pressure control of renin synthesis and secretion. Circ Res 100: 556-563, 2007.
109. Just A, Kurtz L, de Wit C, Wagner C, Kurtz A and Arendshorst WJ. Connexin 40 mediates the tubuloglomerular feedback contribution to renal blood flow autoregulation. J Am Soc Nephrol 20: 1577-1585, 2009.
110. Haefliger JA, Krattinger N, Martin D, Pedrazzini T, Capponi A, Doring B, Plum A, Charollais A, Willecke K and Meda P. Connexin43-dependent mechanism modulates renin secretion and hypertension. J Clin Invest 116: 405-413, 2006.
111. Pentz ES, Lopez ML, Cordaillat M and Gomez RA. Identity of the renin cell is mediated by cAMP and chromatin remodeling: an in vitro model for studying cell recruitment and plasticity. Am J Physiol Heart Circ Physiol 294: H699-H707, 2008.
112. Gomez RA, Pentz ES, Jin X, Cordaillat M and Sequeira Lopez ML. CBP and p300 are essential for renin cell identity and morphological integrity of the kidney. Am J Physiol Heart Circ Physiol 296: H1255-H1262, 2009.
113. Kousteni S, Bellido T, Plotkin LI, O'Brien CA, Bodenner DL, Han L, Han K, DiGregorio GB, Katzenellenbogen JA, Katzenellenbogen BS, Roberson PK, Weinstein RS, Jilka RL and Manolagas SC. Nongenotropic, sex-nonspecific signaling through the estrogen or androgen receptors: dissociation from transcriptional activity. Cell 104: 719-730, 2001.
114. Simoncini T, Hafezi-Moghadam A, Brazil DP, Ley K, Chin WW and Liao JK. Interaction of oestrogen receptor with the regulatory subunit of phosphatidylinositol-3-OH kinase. Nature 407: 538-541, 2000.
115. Simoncini T, Scorticati C, Mannella P, Fadiel A, Giretti MS, Fu XD, Baldacci C, Garibaldi S, Caruso A, Fornari L, Naftolin F and Genazzani AR. Estrogen receptor alpha interacts with Galpha13 to drive actin remodeling and endothelial cell migration via the RhoA/Rho kinase/moesin pathway. Mol Endocrinol 20: 1756-1771, 2006.
116. Shi Q, Gross KW and Sigmund CD. Retinoic acid-mediated activation of the mouse renin enhancer. J Biol Chem 276: 3597-3603, 2001.
117. Liu X, Huang X and Sigmund CD. Identification of a nuclear orphan receptor (Ear2) as a negative regulator of renin gene transcription. Circ Res 92: 1033-1040, 2003.
118. Shi Q, Black TA, Gross KW and Sigmund CD. Species-specific differences in positive and negative regulatory elements in the renin gene enhancer. Circ Res 85: 479-488, 1999.
119. Dickson ME, Tian X, Liu X, Davis DR and Sigmund CD. Upstream stimulatory factor is required for human angiotensinogen expression and differential regulation by the A-20C polymorphism. Circ Res 103: 940-947, 2008.
90
120. Xia H, Mao Q, Paulson HL and Davidson BL. siRNA-mediated gene silencing in vitro and in vivo. Nat Biotechnol 20: 1006-1010, 2002.
121. Butter F, Kappei D, Buchholz F, Vermeulen M and Mann M. A domesticated transposon mediates the effects of a single-nucleotide polymorphism responsible for enhanced muscle growth. EMBO Rep 11: 305-311, 2010.
122. Mittler G, Butter F and Mann M. A SILAC-based DNA protein interaction screen that identifies candidate binding proteins to functional DNA elements. Genome Res 19: 284-293, 2009.
123. Kruse SW, Suino-Powell K, Zhou XE, Kretschman JE, Reynolds R, Vonrhein C, Xu Y, Wang L, Tsai SY, Tsai MJ and Xu HE. Identification of COUP-TFII orphan nuclear receptor as a retinoic acid-activated receptor. PLoS Biol 6: e227, 2008.
124. Cooney AJ, Tsai SY, O'Malley BW and Tsai MJ. Chicken ovalbumin upstream promoter transcription factor (COUP-TF) dimers bind to different GGTCA response elements, allowing COUP-TF to repress hormonal induction of the vitamin D3, thyroid hormone, and retinoic acid receptors. Mol Cell Biol 12: 4153-4163, 1992.
125. Avram D, Ishmael JE, Nevrivy DJ, Peterson VJ, Lee SH, Dowell P and Leid M. Heterodimeric interactions between chicken ovalbumin upstream promoter-transcription factor family members ARP1 and ear2. J Biol Chem 274: 14331-14336, 1999.
126. Montemayor C, Montemayor OA, Ridgeway A, Lin F, Wheeler DA, Pletcher SD and Pereira FA. Genome-wide analysis of binding sites and direct target genes of the orphan nuclear receptor NR2F1/COUP-TFI. PLoS One 5: e8910, 2010.
127. Gronemeyer H, Gustafsson JA and Laudet V. Principles for modulation of the nuclear receptor superfamily. Nat Rev Drug Discov 3: 950-964, 2004.
128. Acton JJ, III, Black RM, Jones AB, Moller DE, Colwell L, Doebber TW, MacNaul KL, Berger J and Wood HB. Benzoyl 2-methyl indoles as selective PPARgamma modulators. Bioorg Med Chem Lett 15: 357-362, 2005.
129. Choi JH, Banks AS, Estall JL, Kajimura S, Bostrom P, Laznik D, Ruas JL, Chalmers MJ, Kamenecka TM, Bluher M, Griffin PR and Spiegelman BM. Anti-diabetic drugs inhibit obesity-linked phosphorylation of PPARgamma by Cdk5. Nature 466: 451-456, 2010.
130. Pentz ES, Lopez ML, Cordaillat M and Gomez RA. Identity of the renin cell is mediated by cAMP and chromatin remodeling: an in vitro model for studying cell recruitment and plasticity. Am J Physiol Heart Circ Physiol 294: H699-H707, 2008.
131. Pipaon C, Tsai SY and Tsai MJ. COUP-TF upregulates NGFI-A gene expression through an Sp1 binding site. Mol Cell Biol 19: 2734-2745, 1999.
132. Browning BL and Browning SR. Haplotypic analysis of Wellcome Trust Case Control Consortium data. Hum Genet 123: 273-280, 2008.
133. Feng T and Zhu X. Genome-wide searching of rare genetic variants in WTCCC data. Hum Genet 128: 269-280, 2010.
91
134. Joe B, Letwin NE, Garrett MR, Dhindaw S, Frank B, Sultana R, Verratti K, Rapp JP and Lee NH. Transcriptional profiling with a blood pressure QTL interval-specific oligonucleotide array. Physiol Genomics 23: 318-326, 2005.
135. Toland EJ, Saad Y, Yerga-Woolwine S, Ummel S, Farms P, Ramdath R, Frank BC, Lee NH and Joe B. Closely linked non-additive blood pressure quantitative trait loci. Mamm Genome 19: 209-218, 2008.
136. Hermann-Kleiter N, Gruber T, Lutz-Nicoladoni C, Thuille N, Fresser F, Labi V, Schiefermeier N, Warnecke M, Huber L, Villunger A, Eichele G, Kaminski S and Baier G. The nuclear orphan receptor NR2F6 suppresses lymphocyte activation and T helper 17-dependent autoimmunity. Immunity 29: 205-216, 2008.
137. Itani H, Liu X, Sarsour EH, Goswami PC, Born E, Keen HL and Sigmund CD. Regulation of renin gene expression by oxidative stress. Hypertension 53: 1070-1076, 2009.
138. Guidez F, Parks S, Wong H, Jovanovic JV, Mays A, Gilkes AF, Mills KI, Guillemin MC, Hobbs RM, Pandolfi PP, de The H, Solomon E and Grimwade D. RARalpha-PLZF overcomes PLZF-mediated repression of CRABPI, contributing to retinoid resistance in t(11;17) acute promyelocytic leukemia. Proc Natl Acad Sci U S A 104: 18694-18699, 2007.
139. Pfoertner S, Goelden U, Hansen W, Toepfer T, Geffers R, Ukena SN, von Knobloch R, Hofmann R, Buer J and Schrader AJ. Cellular retinoic acid binding protein I: expression and functional influence in renal cell carcinoma. Tumour Biol 26: 313-323, 2005.
140. Kurukuti S, Tiwari VK, Tavoosidana G, Pugacheva E, Murrell A, Zhao Z, Lobanenkov V, Reik W and Ohlsson R. CTCF binding at the H19 imprinting control region mediates maternally inherited higher-order chromatin conformation to restrict enhancer access to Igf2. Proc Natl Acad Sci U S A 103: 10684-10689, 2006.
141. Spilianakis CG, Lalioti MD, Town T, Lee GR and Flavell RA. Interchromosomal associations between alternatively expressed loci. Nature 435: 637-645, 2005.
142. Recillas-Targa F, Pikaart MJ, Burgess-Beusse B, Bell AC, Litt MD, West AG, Gaszner M and Felsenfeld G. Position-effect protection and enhancer blocking by the chicken beta-globin insulator are separable activities. Proc Natl Acad Sci U S A 99: 6883-6888, 2002.
143. Fukamizu A, Seo MS, Hatae T, Yokoyama M, Nomura T, Katsuki M and Murakami K. Tissue-specific expression of the human renin gene in transgenic mice. Biochem Biophys Res Commun 165: 826-832, 1989.
144. Keen HL and Sigmund CD. Paradoxical regulation of short promoter human renin transgene by angiotensin ii. Hypertension 37: 403-407, 2001.
145. Sinn PL, Zhang X and Sigmund CD. JG cell expression and partial regulation of a human renin genomic transgene driven by a minimal renin promoter. Am J Physiol 277: F634-F642, 1999.
146. Sinn PL and Sigmund CD. Transgenic models as tools for studying the regulation of human renin expression. Regul Pept 86: 77-82, 2000.
92
147. Yan Y, Chen R, Pitarresi T, Sigmund CD, Gross KW, Sealey JE, Laragh JH and Catanzaro DF. Kidney is the only source of human plasma renin in 45-kb human renin transgenic mice. Circ Res 83: 1279-1288, 1998.
148. Sinn PL, Davis DR and Sigmund CD. Highly regulated cell type-restricted expression of human renin in mice containing 140- or 160-kilobase pair P1 phage artificial chromosome transgenes. J Biol Chem 274: 35785-35793, 1999.
149. Zhou X, Davis DR and Sigmund CD. The human renin kidney enhancer is required to maintain base-line renin expression but is dispensable for tissue-specific, cell-specific, and regulated expression. J Biol Chem 281: 35296-35304, 2006.
150. Zhou X and Sigmund CD. Chorionic enhancer is dispensable for regulated expression of the human renin gene. Am J Physiol Regul Integr Comp Physiol 294: R279-R287, 2008.
151. Awad TA, Bigler J, Ulmer JE, Hu YJ, Moore JM, Lutz M, Neiman PE, Collins SJ, Renkawitz R, Lobanenkov VV and Filippova GN. Negative transcriptional regulation mediated by thyroid hormone response element 144 requires binding of the multivalent factor CTCF to a novel target DNA sequence. J Biol Chem 274: 27092-27098, 1999.
152. Kim TH, Abdullaev ZK, Smith AD, Ching KA, Loukinov DI, Green RD, Zhang MQ, Lobanenkov VV and Ren B. Analysis of the vertebrate insulator protein CTCF-binding sites in the human genome. Cell 128: 1231-1245, 2007.
153. Suzuki Y, Suzuki A, Tamaru A, Katsukawa C and Oda H. Rapid detection of pyrazinamide-resistant Mycobacterium tuberculosis by a PCR-based in vitro system. J Clin Microbiol 40: 501-507, 2002.
154. Farrell CM, West AG and Felsenfeld G. Conserved CTCF insulator elements flank the mouse and human beta-globin loci. Mol Cell Biol 22: 3820-3831, 2002.
155. Mukhopadhyay R, Yu W, Whitehead J, Xu J, Lezcano M, Pack S, Kanduri C, Kanduri M, Ginjala V, Vostrov A, Quitschke W, Chernukhin I, Klenova E, Lobanenkov V and Ohlsson R. The binding sites for the chromatin insulator protein CTCF map to DNA methylation-free domains genome-wide. Genome Res 14: 1594-1602, 2004.
156. Barski A, Cuddapah S, Cui K, Roh TY, Schones DE, Wang Z, Wei G, Chepelev I and Zhao K. High-resolution profiling of histone methylations in the human genome. Cell 129: 823-837, 2007.
157. Kunarso G, Chia NY, Jeyakani J, Hwang C, Lu X, Chan YS, Ng HH and Bourque G. Transposable elements have rewired the core regulatory network of human embryonic stem cells. Nat Genet 42: 631-634, 2010.
158. Adli M, Zhu J and Bernstein BE. Genome-wide chromatin maps derived from limited numbers of hematopoietic progenitors. Nat Methods 7: 615-618, 2010.
159. Chen X, Xu H, Yuan P, Fang F, Huss M, Vega VB, Wong E, Orlov YL, Zhang W, Jiang J, Loh YH, Yeo HC, Yeo ZX, Narang V, Govindarajan KR, Leong B, Shahab A, Ruan Y, Bourque G, Sung WK, Clarke ND, Wei CL and Ng HH. Integration of external signaling pathways with the core transcriptional network in embryonic stem cells. Cell 133: 1106-1117, 2008.
93
160. Kagey MH, Newman JJ, Bilodeau S, Zhan Y, Orlando DA, van Berkum NL, Ebmeier CC, Goossens J, Rahl PB, Levine SS, Taatjes DJ, Dekker J and Young RA. Mediator and cohesin connect gene expression and chromatin architecture. Nature 467: 430-435, 2010.
161. Kanduri C, Pant V, Loukinov D, Pugacheva E, Qi CF, Wolffe A, Ohlsson R and Lobanenkov VV. Functional association of CTCF with the insulator upstream of the H19 gene is parent of origin-specific and methylation-sensitive. Curr Biol 10: 853-856, 2000.
162. Voigtlander T, Ganten D and Bader M. Transcriptional regulation of the rat renin gene by regulatory elements in intron I. Hypertension 33: 303-311, 1999.
163. Germain S, Philippe J, Fuchs S, Lengronne A, Corvol P and Pinet F. Regulation of human renin secretion and gene transcription in Calu-6 cells. FEBS Lett 407: 177-183, 1997.
164. Lang JA, Ying LH, Morris BJ and Sigmund CD. Transcriptional and posttranscriptional mechanisms regulate human renin gene expression in Calu-6 cells. Am J Physiol 271: F94-100, 1996.
165. Filippova GN, Fagerlie S, Klenova EM, Myers C, Dehner Y, Goodwin G, Neiman PE, Collins SJ and Lobanenkov VV. An exceptionally conserved transcriptional repressor, CTCF, employs different combinations of zinc fingers to bind diverged promoter sequences of avian and mammalian c-myc oncogenes. Mol Cell Biol 16: 2802-2813, 1996.
166. Lobanenkov VV, Nicolas RH, Adler VV, Paterson H, Klenova EM, Polotskaja AV and Goodwin GH. A novel sequence-specific DNA binding protein which interacts with three regularly spaced direct repeats of the CCCTC-motif in the 5'-flanking sequence of the chicken c-myc gene. Oncogene 5: 1743-1753, 1990.
167. Bowers SR, Mirabella F, Calero-Nieto FJ, Valeaux S, Hadjur S, Baxter EW, Merkenschlager M and Cockerill PN. A conserved insulator that recruits CTCF and cohesin exists between the closely related but divergently regulated interleukin-3 and granulocyte-macrophage colony-stimulating factor genes. Mol Cell Biol 29: 1682-1693, 2009.
168. Rubio ED, Reiss DJ, Welcsh PL, Disteche CM, Filippova GN, Baliga NS, Aebersold R, Ranish JA and Krumm A. CTCF physically links cohesin to chromatin. Proc Natl Acad Sci U S A 105: 8309-8314, 2008.
169. Wendt KS, Yoshida K, Itoh T, Bando M, Koch B, Schirghuber E, Tsutsumi S, Nagae G, Ishihara K, Mishiro T, Yahata K, Imamoto F, Aburatani H, Nakao M, Imamoto N, Maeshima K, Shirahige K and Peters JM. Cohesin mediates transcriptional insulation by CCCTC-binding factor. Nature 451: 796-801, 2008.
170. Zhou X, Weatherford ET, Liu X, Born E, Keen HL and Sigmund CD. Dysregulated human renin expression in transgenic mice carrying truncated genomic constructs: evidence supporting the presence of insulators at the renin locus. Am J Physiol Renal Physiol 295: F642-F653, 2008.
94
171. Palstra RJ, Tolhuis B, Splinter E, Nijmeijer R, Grosveld F and de Laat W. The beta-globin nuclear compartment in development and erythroid differentiation. Nat Genet 35: 190-194, 2003.
172. Splinter E, Heath H, Kooren J, Palstra RJ, Klous P, Grosveld F, Galjart N and de Laat W. CTCF mediates long-range chromatin looping and local histone modification in the beta-globin locus. Genes Dev 20: 2349-2354, 2006.
173. Ito M, Oliverio MI, Mannon PJ, Best CF, Maeda N, Smithies O and Coffman TM.
Regulation of blood pressure by the type 1A angiotensin II receptor gene. Proc Natl Acad Sci U S A 92: 3521-3525, 1995.
174. Krege JH, Moyer JS, Langenbach LL, Peng L, Zhang SH, Maeda N, Reddick RL and Smithies O. Angiotensin-converting enzyme gene and atherosclerosis. Arterioscler Thromb Vasc Biol 17: 1245-1250, 1997.
175. Takahashi N, Lopez ML, Cowhig JE, Jr., Taylor MA, Hatada T, Riggs E, Lee G, Gomez RA, Kim HS and Smithies O. Ren1c homozygous null mice are hypotensive and polyuric, but heterozygotes are indistinguishable from wild-type. J Am Soc Nephrol 16: 125-132, 2005.
176. Tanimoto K, Sugiyama F, Goto Y, Ishida J, Takimoto E, Yagami K, Fukamizu A and Murakami K. Angiotensinogen-deficient mice with hypotension. J Biol Chem 269: 31334-31337, 1994.
177. Xu D, Borges GR, Grobe JL, Pelham CJ, Yang B and Sigmund CD. Preservation of intracellular renin expression is insufficient to compensate for genetic loss of secreted renin. Hypertension 54: 1240-1247, 2009.
178. Gribouval O, Gonzales M, Neuhaus T, Aziza J, Bieth E, Laurent N, Bouton JM, Feuillet F, Makni S, Ben Amar H, Laube G, Delezoide AL, Bouvier R, Dijoud F, Ollagnon-Roman E, Roume J, Joubert M, Antignac C and Gubler MC. Mutations in genes in the renin-angiotensin system are associated with autosomal recessive renal tubular dysgenesis. Nat Genet 37: 964-968, 2005.
179. Hilgers KF, Reddi V, Krege JH, Smithies O and Gomez RA. Aberrant renal vascular morphology and renin expression in mutant mice lacking angiotensin-converting enzyme. Hypertension 29: 216-221, 1997.
180. Kim HS, Maeda N, Oh GT, Fernandez LG, Gomez RA and Smithies O. Homeostasis in mice with genetically decreased angiotensinogen is primarily by an increased number of renin-producing cells. J Biol Chem 274: 14210-14217, 1999.
181. Oliverio MI, Kim HS, Ito M, Le T, Audoly L, Best CF, Hiller S, Kluckman K, Maeda N, Smithies O and Coffman TM. Reduced growth, abnormal kidney structure, and type 2 (AT2) angiotensin receptor-mediated blood pressure regulation in mice lacking both AT1A and AT1B receptors for angiotensin II. Proc Natl Acad Sci U S A 95: 15496-15501, 1998.
182. Chen JF, Murchison EP, Tang R, Callis TE, Tatsuguchi M, Deng Z, Rojas M, Hammond SM, Schneider MD, Selzman CH, Meissner G, Patterson C, Hannon GJ and Wang DZ. Targeted deletion of Dicer in the heart leads to dilated cardiomyopathy and heart failure. Proc Natl Acad Sci U S A 105: 2111-2116, 2008.
95
183. Damiani D, Alexander JJ, O'Rourke JR, McManus M, Jadhav AP, Cepko CL, Hauswirth WW, Harfe BD and Strettoi E. Dicer inactivation leads to progressive functional and structural degeneration of the mouse retina. J Neurosci 28: 4878-4887, 2008.
184. Papaioannou MD, Pitetti JL, Ro S, Park C, Aubry F, Schaad O, Vejnar CE, Kuhne F, Descombes P, Zdobnov EM, McManus MT, Guillou F, Harfe BD, Yan W, Jegou B and Nef S. Sertoli cell Dicer is essential for spermatogenesis in mice. Dev Biol 326: 250-259, 2009.
185. Song L and Tuan RS. MicroRNAs and cell differentiation in mammalian development. Birth Defects Res C Embryo Today 78: 140-149, 2006.
186. Stefani G and Slack FJ. Small non-coding RNAs in animal development. Nat Rev Mol Cell Biol 9: 219-230, 2008.
187. Harvey SJ, Jarad G, Cunningham J, Goldberg S, Schermer B, Harfe BD, McManus MT, Benzing T and Miner JH. Podocyte-specific deletion of dicer alters cytoskeletal dynamics and causes glomerular disease. J Am Soc Nephrol 19: 2150-2158, 2008.
188. Ho J, Ng KH, Rosen S, Dostal A, Gregory RI and Kreidberg JA. Podocyte-specific loss of functional microRNAs leads to rapid glomerular and tubular injury. J Am Soc Nephrol 19: 2069-2075, 2008.
189. Nagalakshmi VK, Ren Q, Pugh MM, Valerius MT, McMahon AP and Yu J. Dicer regulates the development of nephrogenic and ureteric compartments in the mammalian kidney. Kidney Int 2010.
190. Harfe BD, McManus MT, Mansfield JH, Hornstein E and Tabin CJ. The RNaseIII enzyme Dicer is required for morphogenesis but not patterning of the vertebrate limb. Proc Natl Acad Sci U S A 102: 10898-10903, 2005.
191. Sequeira Lopez ML, Pentz ES, Nomasa T, Smithies O and Gomez RA. Renin cells are precursors for multiple cell types that switch to the renin phenotype when homeostasis is threatened. Dev Cell 6: 719-728, 2004.
192. Gomez RA, Pentz ES, Jin X, Cordaillat M and Sequeira Lopez ML. CBP and p300 are essential for renin cell identity and morphological integrity of the kidney. Am J Physiol Heart Circ Physiol 296: H1255-H1262, 2009.
193. Wang B, Koh P, Winbanks C, Coughlan MT, McClelland A, Watson A, Jandeleit-Dahm K, Burns WC, Thomas MC, Cooper ME and Kantharidis P. miR-200a prevents renal fibrogenesis through repression of TGF-{beta}2 expression. Diabetes 2010.
194. Eddy AA. Molecular insights into renal interstitial fibrosis. J Am Soc Nephrol 7: 2495-2508, 1996.
195. Giresi PG, Kim J, McDaniell RM, Iyer VR and Lieb JD. FAIRE (Formaldehyde-Assisted Isolation of Regulatory Elements) isolates active regulatory elements from human chromatin. Genome Res 17: 877-885, 2007.
196. Bell AC, West AG and Felsenfeld G. The protein CTCF is required for the enhancer blocking activity of vertebrate insulators. Cell 98: 387-396, 1999.
96
197. Chung JH, Whiteley M and Felsenfeld G. A 5' element of the chicken beta-globin domain serves as an insulator in human erythroid cells and protects against position effect in Drosophila. Cell 74: 505-514, 1993.
198. Saitoh N, Bell AC, Recillas-Targa F, West AG, Simpson M, Pikaart M and Felsenfeld G. Structural and functional conservation at the boundaries of the chicken beta-globin domain. EMBO J 19: 2315-2322, 2000.
199. Wood WI and Felsenfeld G. Chromatin structure of the chicken beta-globin gene region. Sensitivity to DNase I, micrococcal nuclease, and DNase II. J Biol Chem 257: 7730-7736, 1982.
200. Pentz ES, Lopez ML, Cordaillat M and Gomez RA. Identity of the renin cell is mediated by cAMP and chromatin remodeling: an in vitro model for studying cell recruitment and plasticity. Am J Physiol Heart Circ Physiol 294: H699-H707, 2008.
201. Butter F, Kappei D, Buchholz F, Vermeulen M and Mann M. A domesticated transposon mediates the effects of a single-nucleotide polymorphism responsible for enhanced muscle growth. EMBO Rep 11: 305-311, 2010.