Embed Size (px)
Citation preview
Regulation of immunity through T-cell competition for interleukin-2
Shannon TelescoAdvisor: Ravi Radhakrishnan,
PhD
Regulation of the immune system
T helper (Th) cells are a type of white blood cell that is part of the body’s immune response. Th cells recognize foreign antigens and activate additional immune cells to mount an inflammatory reaction.
T regulatory (Treg) cells are a specialized subpopulation of T cells that act to suppress activation of the immune system and thereby maintain immune system homeostasis and tolerance to self-antigens.
Th and Treg cells compete for a common growth factor called interleukin-2 (IL-2). The outcome of this competition determines whether the immune system will become activated or suppressed.

Competition for IL-2 Treg are controlled by Th
cells via the level of available IL-2.
Under tolerogenic conditions, Th cells produce low amounts of IL-2 in response to self-antigen (Ag) stimulation.
Under immunogenic conditions, Th cells produce high amounts of IL-2, allowing activation of both Th and Treg cells.
Scheffold, A., Huhn, J., & Hofer, T (2005). Regulation of CD4+CD25+ regulatory T cell activity: it takes (IL-)two to tango. Eur. J. Immunol. 35:1336.
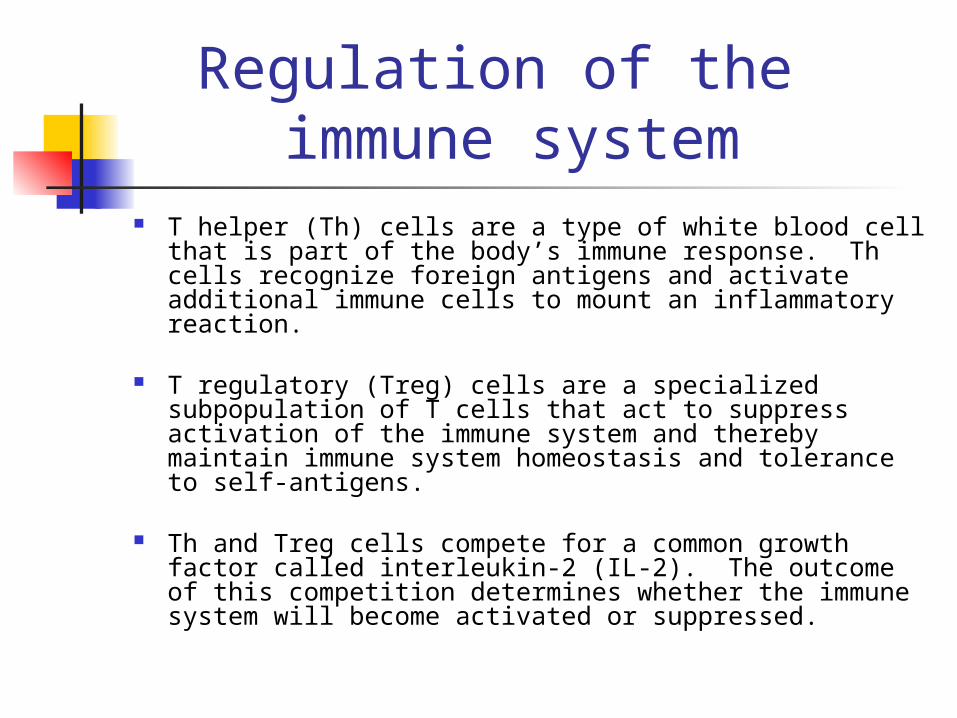
The IL-2 trafficking system
ksynsktkoffkkonk CkVRkCkRLkdt
dR
kekoffkkonk CkCkRLk
dt
dC
kktkrekkfek RikRkCikRiLik
dt
dRideg
kekkrekkfek CkCikCikRiLik
dt
dCi deg
krecAe
krekkfek LikNV
CikRiLik
dt
dLi
kon
koff
kdegkrec
k=1 (Th cell) or k=2 (Treg cell)

Scaling the System
off
t
k
k
off
syn
k
k
offe
e
kk
k
off
re
k
k
offk
kdeg
offt
e
kk
kk degeAoff
sfe
VNkk
Vk
deg
off
rec
k
k
CRCRLtd
Rd )1(
CRL
td
Cd
1
1
)()(
RiRRiLiCitd
Rid
CCiCiRiLitd
Cid )(
LiRiLiCitd
Lid )(
Scaled Parameters:
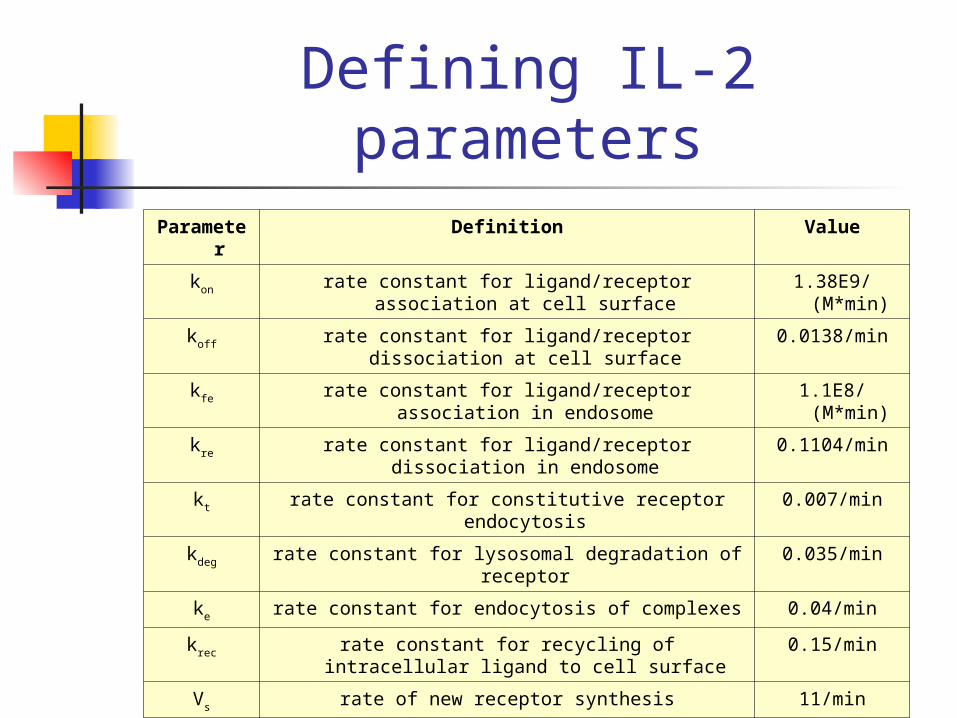
Defining IL-2 parametersParameter Definition Value
kon rate constant for ligand/receptor association at cell surface 1.38E9/(M*min)
koff rate constant for ligand/receptor dissociation at cell surface 0.0138/min
kfe rate constant for ligand/receptor association in endosome 1.1E8/(M*min)
kre rate constant for ligand/receptor dissociation in endosome 0.1104/min
kt rate constant for constitutive receptor endocytosis 0.007/min
kdeg rate constant for lysosomal degradation of receptor 0.035/min
ke rate constant for endocytosis of complexes 0.04/min
krec rate constant for recycling of intracellular ligand to cell surface 0.15/min
Vs rate of new receptor synthesis 11/min
Ve endosomal volume 1E-14 L
NA Avogadro’s number 6.02E23
Q Rate of ligand secretion by Th cell 10-500/min
kmed Rate of ligand degradation in extracellular space 0.02/min
H Distance between Th and Treg (scaled by rcell) 5 μm

Ligand diffusion in spherical coordinates
0)(2
2
2
rLr
L
rr
L
D
kr medcell2
r
r
r
rrL
)cosh()sinh()( 21
11111| LikCkLRkQr
LD recoffonr
2222| LikCkLRkr
LD recoffonHr
where
Boundary conditions:
Solution:
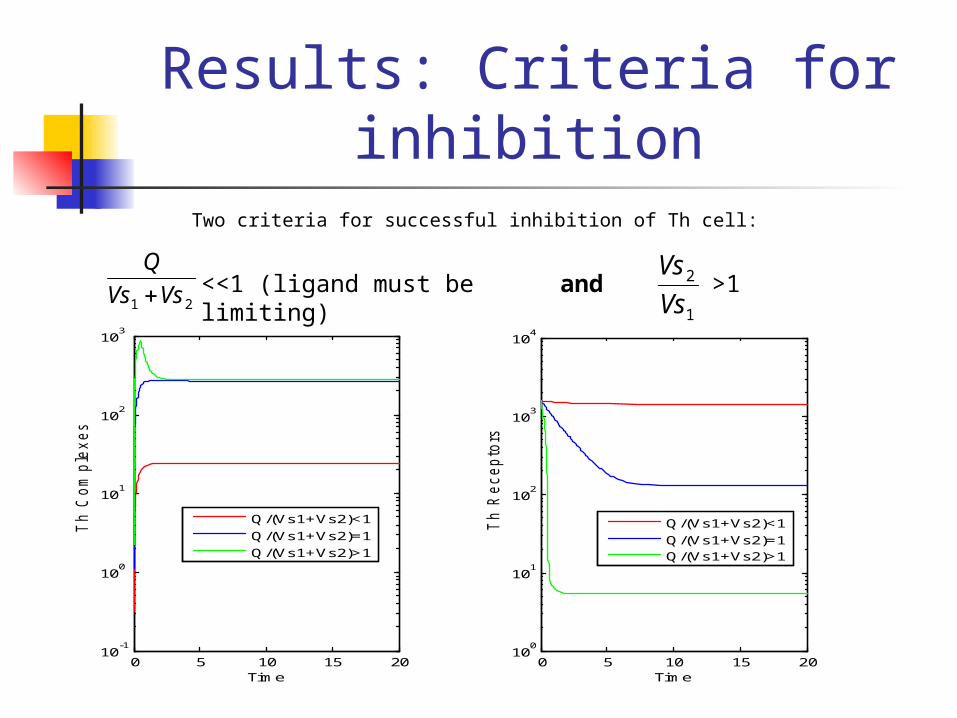
Results: Criteria for inhibition
Two criteria for successful inhibition of Th cell:
0 5 10 15 2010
-1
100
101
102
103
Time
Th C
om
ple
xes
0 5 10 15 2010
0
101
102
103
104
Time
Th R
ecepto
rs
Q/(Vs1+Vs2)<1
Q/(Vs1+Vs2)=1
Q/(Vs1+Vs2)>1
Q/(Vs1+Vs2)<1
Q/(Vs1+Vs2)=1Q/(Vs1+Vs2)>1
21 VsVs
Q
<<1 (ligand must be limiting) 1
2
Vs
Vs>1and
0 5 10 15 2010
-1
100
101
102
103
Time
Th C
om
ple
xes
0 5 10 15 2010
0
101
102
103
104
Time
Th R
ecepto
rs
Q/(Vs1+Vs2)<1
Q/(Vs1+Vs2)=1
Q/(Vs1+Vs2)>1
Q/(Vs1+Vs2)<1
Q/(Vs1+Vs2)=1Q/(Vs1+Vs2)>1
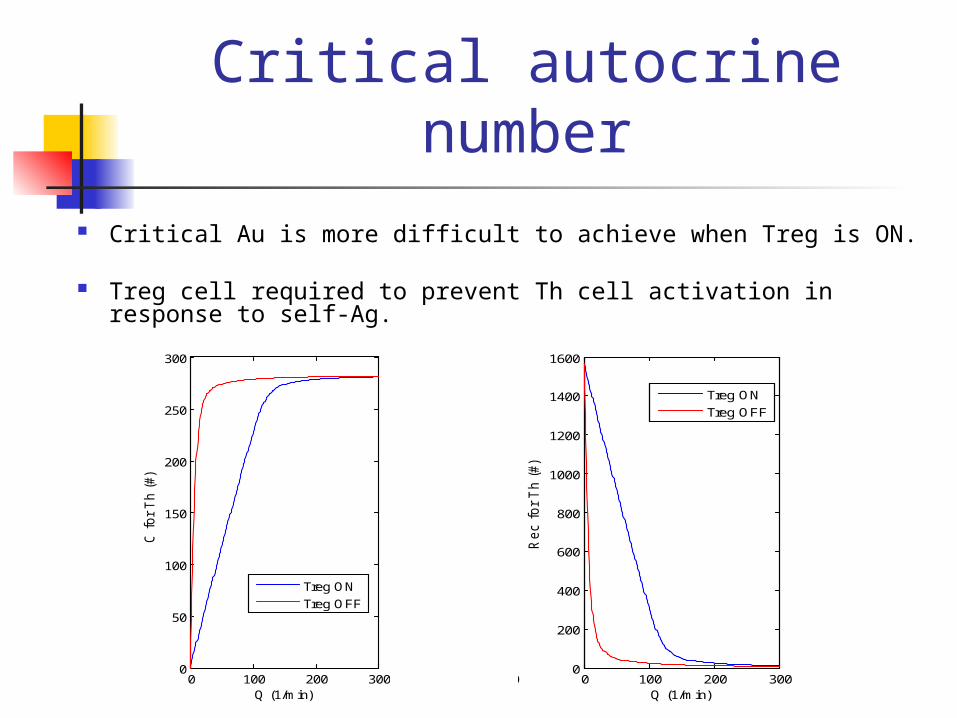
Critical autocrine number Critical Au is more difficult to achieve when Treg is ON.
Treg cell required to prevent Th cell activation in response to self-Ag.
0 100 200 3000
50
100
150
200
250
300
Q (1/min)
C f
or
Th (
#)
0 100 200 3000
200
400
600
800
1000
1200
1400
1600
Q (1/min)
Rec f
or
Th (
#)
Treg ON
Treg OFF
Treg ON
Treg OFF
0 100 200 3000
50
100
150
200
250
300
Q (1/min)
C f
or
Th (
#)
0 100 200 3000
200
400
600
800
1000
1200
1400
1600
Q (1/min)
Rec f
or
Th (
#)
Treg ON
Treg OFF
Treg ON
Treg OFF
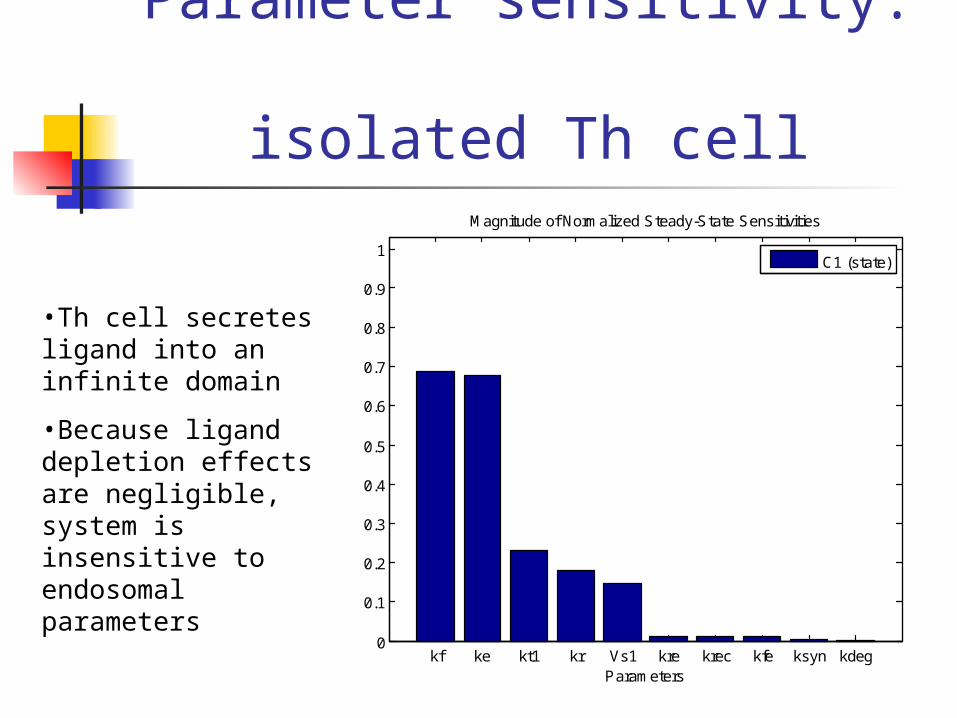
Parameter sensitivity: isolated Th cell
kf ke kt1 kr Vs1 kre krec kfe ksyn kdeg0
0.1
0.2
0.3
0.4
0.5
0.6
0.7
0.8
0.9
1
Parameters
Magnitude of Normalized Steady-State Sensitivities
C1 (state)
•Th cell secretes ligand into an infinite domain
•Because ligand depletion effects are negligible, system is insensitive to endosomal parameters
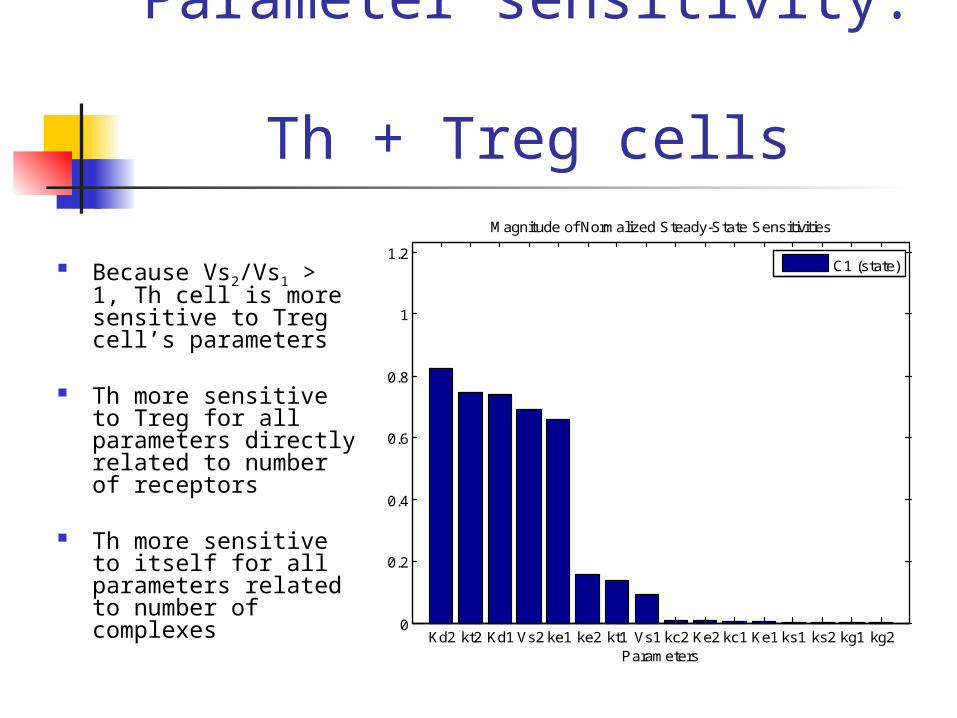
Parameter sensitivity: Th + Treg cells
Because Vs2/Vs1 > 1, Th cell is more sensitive to Treg cell’s parameters
Th more sensitive to Treg for all parameters directly related to number of receptors
Th more sensitive to itself for all parameters related to number of complexes
Kd2 kt2 Kd1 Vs2 ke1 ke2 kt1 Vs1 kc2 Ke2 kc1 Ke1 ks1 ks2 kg1 kg20
0.2
0.4
0.6
0.8
1
1.2
Parameters
Magnitude of Normalized Steady-State Sensitivities
C1 (state)

Parameter sensitivity: Th + Treg cells
kt2 Kd2 ke2 Vs2 Kd1 Vs1 kt1 ke1 Ke2 kc2 kc1 Ke1 ks1 ks2 kg1 kg20
0.2
0.4
0.6
0.8
1
1.2
Parameters
Magnitude of Normalized Steady-State Sensitivities
C2 (state)•Because Vs2/Vs1 > 1, Treg is more sensitive to its own parameters
•Treg is relatively sensitive to Kd1, but not to any of Th parameters that directly relate to receptor number
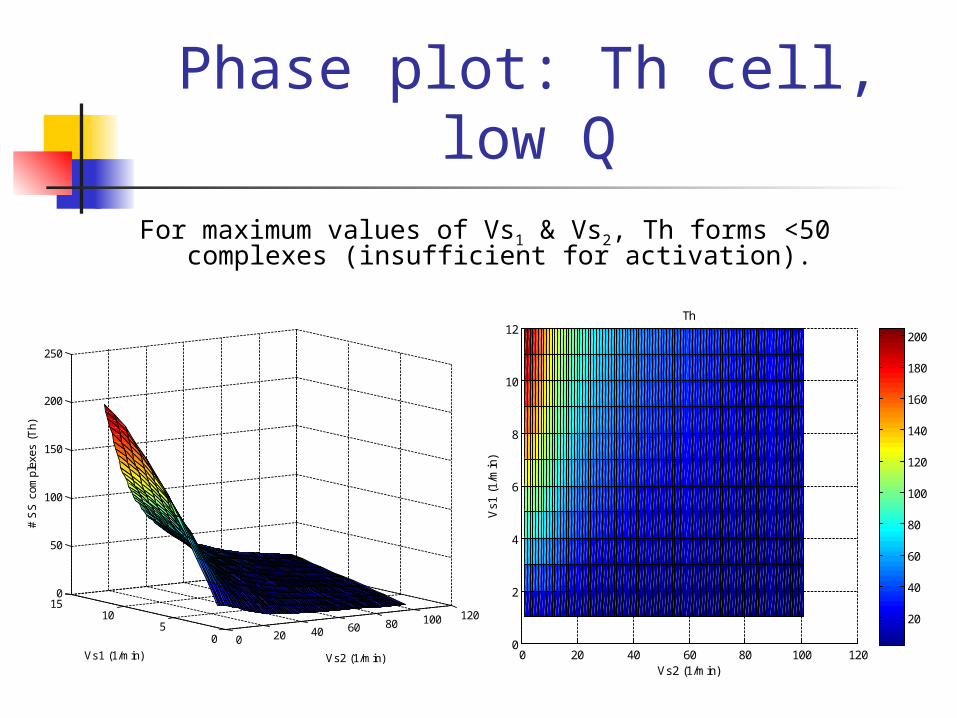
Phase plot: Th cell, low QFor maximum values of Vs1 & Vs2, Th forms <50
complexes (insufficient for activation).
0 20 40 60 80 100 1200
2
4
6
8
10
12
Vs2 (1/min)
Th
Vs1
(1/
min
)
20
40
60
80
100
120
140
160
180
200
0 20 40 60 80 100 120
05
10150
50
100
150
200
250
Vs2 (1/min)Vs1 (1/min)
# S
S c
ompl
exes
(T
h)
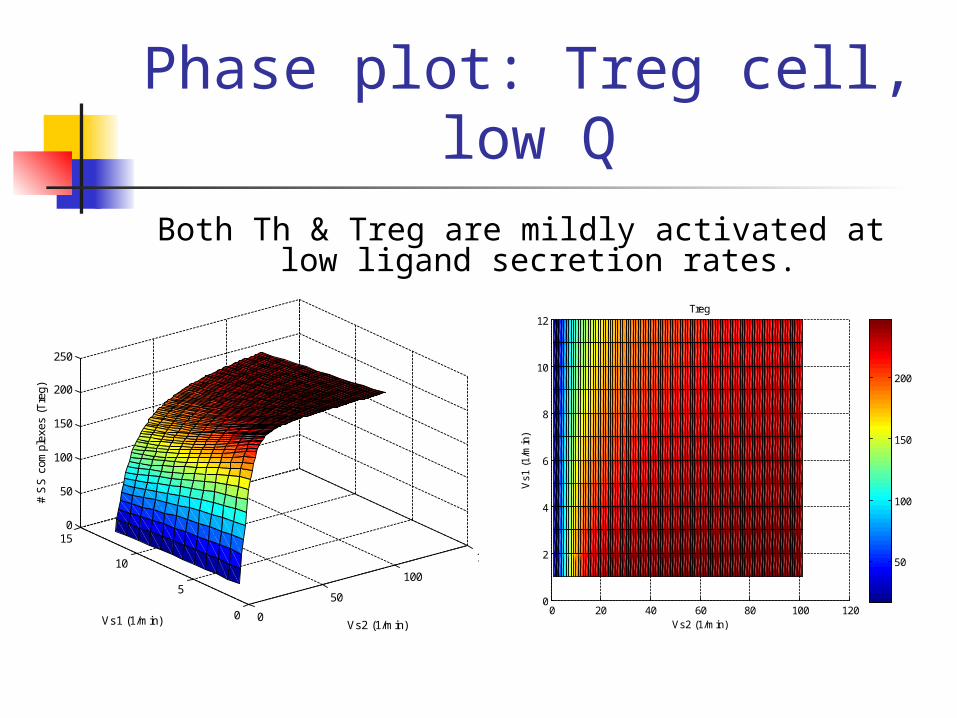
Phase plot: Treg cell, low Q
Both Th & Treg are mildly activated at low ligand secretion rates.
0 20 40 60 80 100 1200
2
4
6
8
10
12
Vs2 (1/min)
Treg
Vs1
(1/
min
)
50
100
150
200
0
50
100
150
0
5
10
150
50
100
150
200
250
Vs2 (1/min)Vs1 (1/min)
# S
S c
ompl
exes
(T
reg)
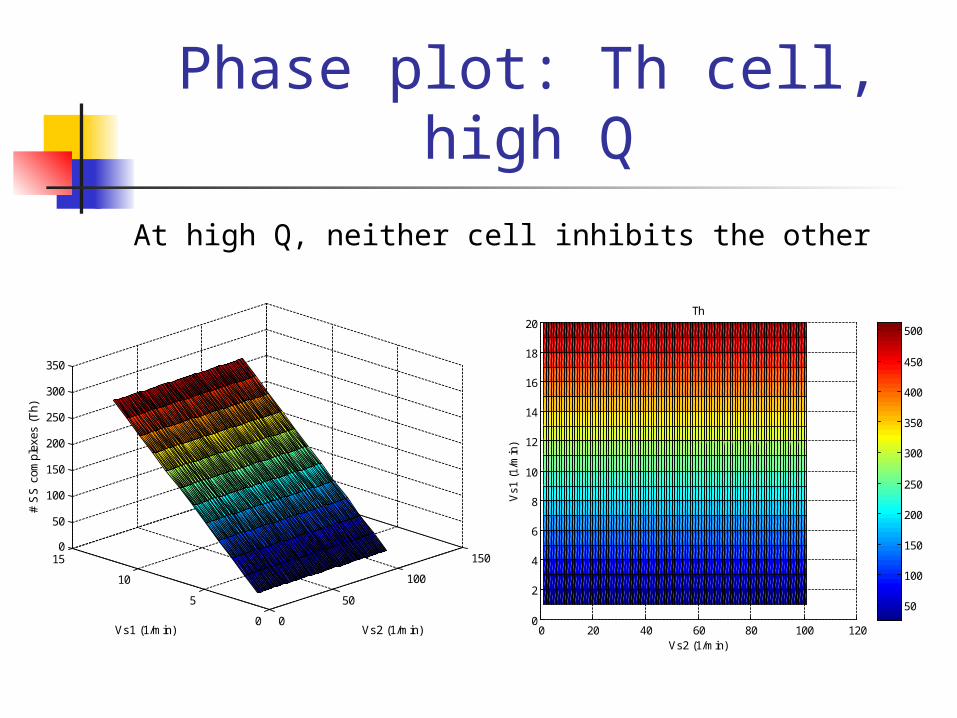
Phase plot: Th cell, high Q
At high Q, neither cell inhibits the other
0 20 40 60 80 100 1200
2
4
6
8
10
12
14
16
18
20
Vs2 (1/min)
Th
Vs1
(1/
min
)
50
100
150
200
250
300
350
400
450
500
0
50
100
150
0
5
10
150
50
100
150
200
250
300
350
Vs2 (1/min)Vs1 (1/min)
# S
S c
ompl
exes
(T
h)

Phase plot: Treg cell, high Q
Both Th & Treg are fully activated at high Q
0 20 40 60 80 100 1200
2
4
6
8
10
12
14
16
18
20
Vs2 (1/min)
Treg
Vs1
(1/
min
)
500
1000
1500
2000
2500
0 20 40 60 80 100 120
05
10150
500
1000
1500
2000
2500
3000
Vs2 (1/min)Vs1 (1/min)
# S
S c
ompl
exes
(T
reg)
Regulation of immunity
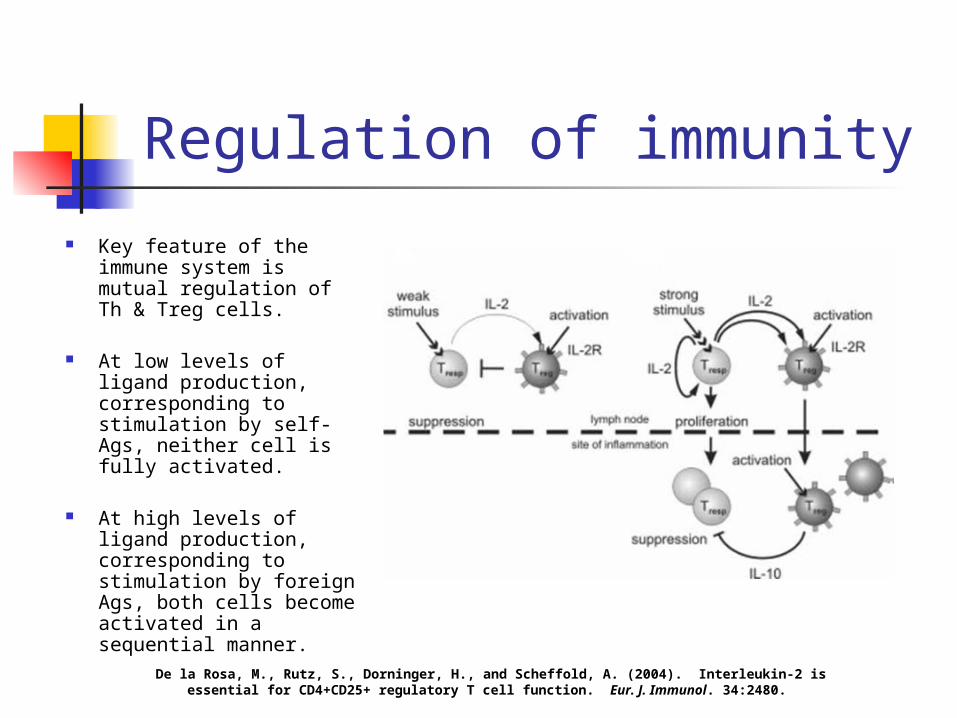
Key feature of the immune system is mutual regulation of Th & Treg cells.
At low levels of ligand production, corresponding to stimulation by self-Ags, neither cell is fully activated.
At high levels of ligand production, corresponding to stimulation by foreign Ags, both cells become activated in a sequential manner.
De la Rosa, M., Rutz, S., Dorninger, H., and Scheffold, A. (2004). Interleukin-2 is essential for CD4+CD25+ regulatory T cell function. Eur. J. Immunol. 34:2480.

Food for thought Can additional immunological states be
identified as a function of the cell-cell distance?
What are the effects of multiple Treg cells on suppression of Th cell?
How is Th/Treg cell interaction affected by mediation by an antigen-presenting cell (APC)?
Acknowledgments
Ravi Radhakrishnan, PhD
Casim Sarkar, PhD
ReferencesBaecher-Allan, C., Wolf, E., & Hafler, DA (2005). Functional analysis of highly defined, FACS-isolated
populations of human regulatory CD4+CD25+ T cells. Clinical Immunology 115:10.
Barthlott, T., Moncrieffe, H., Veldhoen, M., Atkins, C., Christensen, J., O’Garra, A., and Stockinger, B. (2005). CD25+ CD4+ T cells compete with naïve CD4+ T cells for IL-2 and exploit it for the induction of IL-10 production. International Immunology 17:279.
Batsilas, L., Berezhkovskii, A.M., & Shvartsman, S.Y. (2003). Stochastic model of autocrine and paracrine signals in cell culture assays. Biophysical J. 85:3659.
Fallon, E.M., Liparoto, S.F., Lee, K.J., Ciardelli, T.L., & Lauffenburger, D.A. (2000). Increased endosomal sorting of ligand to recycling enhances potency of an interleukin-2 analog. JBC 275(10):6790.
Oberg, H-H, Wesch, D., Lenke, J., & Kabelitz, D (2006). An optimized method for the functional analysis of human regulatory T cells. Scandinavian Journal of Immunology 64:353.
Rao, B.M., Girvin, A.T., Ciardelli, T., Lauffenburger, D.A., & Wittrup, K.D. (2003). Interleukin-2 mutants with enhanced α–receptor subunit binding affinity. Protein Engineering 16(12):1081.
Rao, B.M., Driver, I., Lauffenburger, D.A., & Wittrup, K.D. (2004). Interleukin 2 (IL-2) variants engineered for increased IL-2 receptor α–subunit affinity exhibit increased potency arising from a cell surface ligand reservoir effect. Molecular Pharmacology 66:864.
Scheffold, A., Huhn, J., & Hofer, T (2005). Regulation of CD4+CD25+ regulatory T cell activity: it takes (IL-)two to tango. Eur. J. Immunol. 35:1336.
Smith, K.A. (2004). The Quantal Theory of how the Immune System Discriminates Between Self and Non-self. Medical Immunology 3:3.
Thornton, A.M., Donovan, E.E., Piccirillo, C.A., & Shevach, E.M. (2004). Cutting edge: IL-2 is critically required for the in vitro activation of CD4+CD25+ T cell suppressor function. J Immunology 172:6519.


![Radhakrishnan FINAL REPORT[1]](https://img.pdfslide.us/doc/110x75/577d392f1a28ab3a6b993d7c/radhakrishnan-final-report1.jpg)