Embed Size (px)
Citation preview
AD-A257 852
REGIONAL WAVE ATTENUATION IN EURASIA
Kin-Yip Chun
Tianfei Zhu
Xiao Rung Shih
University of Toronto
Department of Physics
60 St George Street
Toronto, Ontario D T ICM5S 1A7, Canada ECTEI
iOV23 199211
October 1992 S D .
Scientific Report Number 2
27 September 1991 - 27 September 1992
Approved for Public Release; Distribution Unlimited
Sponsored by
Defense Advanced Research Project Agency
Nuclear Monitoring Research Office
Contract Number: F29601-91-C-DB24
DEFENSE TECHNICAL INFORMATION CENTER
9230039 _J-•9 ,:*
Form Approved
REPORT DOCUMENTATION PAGE o F No. 070-0188
*.;#i.c eo'-Pting o~•ura Cor tr.u €•c1 .irl o of nioamatiorn i estoma'•nat 0 to erge a Four I m ou rw';0= o ,,.n o tre t .•l r•.e Icf review• nn7, ltlO*n. o w.rraons ersn ng ex atlou: r
atn d~ 'n •awnthmnn te 3ats ne,"e".. ano cofolJfng and reii-wenq V*e coliection O tnfOemauon. oend comnent$ r r t -h3re is ?h bwio, estimate or any otrie asoe. c. : ICO 't O ,,noImatnOf. Intluo.ng Suggelt$ OSft for reauCing thit ourdmn. 10 Washington mebooumrten Serices. Otre..orate !o. InfOr'Faton Ooerations am
9enort. 1215 l effe'so,
O ii~ qnav• N/ . $u=se 1204. Arhfi ~nu IA 22202-4302. anS tO tthe O ffce of Managemenrt ands Suoa .. Paoerworit AeouctiOn Prolect (v7C.Vl4418). Washington. DC 20503.
7. AGENCY USE ONLY (Leave Olank) 2. REPORT DATE 3. REPORT TYPE AND DATES COVEREDOctober 1992 Annual Tech Rep 9/27/91-9/30/92
4. TITLE AND SUBTITLE S. FUNDING NUMBERS
REGIONAL WAVE ATTENUATION IN EURASIA
6. AUTOR(S)F29601-91-C-DB24
Kin-Yip Chun Tienfei Zhu Xiao Rung Shih FD
7. PERFORMING ORGANIZATION NAME(S) AND ADORESS(ES) B. PERFORMING ORGANZATION
Geophysics Division, Department of Physics REPORT NUMBER
University of Toronto, 60 St. George Street
Toronto, Ontario M5S 1A7 Canada NA
9. SPONSORING / MONITORING AGENCY NAME(S) AND ADDRESS(ES) 10. SPONSORING / MONITORINGAGENCY REPORT NUMBER
DARPA/NMRO, 3701 North Fairfax Drive,
Arlinton, VA 22203-1714Contracting Officer Representative: NA
Dr. Alan S. Ryall11. SUPPLEMENTARY NOTES
12a. DI$TRIBUTIONAVAILABILITY STATEMENT 12b. DISTRIBUTION CODE
APPROVED FOR PUBLIC RELEASE
DISTRIBUTION UNLIMITED
13. ABSTRACT (Maximum 200worcs)
Presented in the Scientific Report Number 2 are our research efforts in the first year of ourtwo-year project in regional wave studies in Eurasia. Based on the reversed two-station method(RTSM), our research has led to development in methodology, i.e., formulation of the sourcepair/receiver pair (SPRP) method and the extended RTSM, suitable for attenuation study usingdata from sparsely-located stations. These methods are more flexible in making use of theregional data from Eurasia. Compared to the RTSM, results from either method lead to meas-urements of the frequency-dependent anelastic, attenuation in an area instead of inter-station(event) paths. Application of the SPRP method to the CDSN/IRIS data from regional and far-regional distances has shown that L. attenuation at low frequencies (0.1-1.0 Hz) exhibitsgreater stability and consistency than its higher-frequency counterpart. Application of theextended RTSM to the local anJ regional recordings from Beijing Telemetered Network (BTN)has shown that the area under BTN is characterized by relatively high L, attenuation, com-pared to the non-Tibetan portion of the Eurasian continent.
"14. SUBJECT TERMS 15. NUMBER OF PAGES
Lg ATTENUATION EURASIA IRIS CDSN BTN 1.PRICECODE
TIME-DOMAIN ANALYSIS REGIONALIZATION17. SECURITY CLASSIFICATION 18.S ECURITY CLASSIFICATION 19. SECURITY CLASSIFICATION 20. UMITATION OFABSTRACTOF REPORT OF THIS PAGE OF ABSTRACT
Unclassified Unclassified Unclassified SARNSN 7540-01-280-5500 Standard Form 298 (Rev 2-89)
Pilmrbea bp ANSI Sd Z39.T292-102
TABLE OF CONTENTS
Table of Contents ............................................................................................. iSection I. Introduction ..................................................................................... 1
1.1. Background ....................................................................................... 11.2. Research on Methodology of Regional Wave Attenuation .............. 11.3. Organization of the Report ............................................................... 2
Section II. Time-Domain Analysis of Lg Wave Attenuation in Eurasia ........ 32.1. Introduction ...................................................................................... 32.2. The Source Pair/Receiver Pair Method ............................................ 32.3. Lg Wave Attenuation in Eurasia ...................................................... 52.4. Lg Wave Attenuation under Selected CDSN Station Pairs ............. 12
Section III. Preliminary Analysis of Lg Wave Attenuation under BeijingTelemetered Network (BTN) .................................................................. 153.1. Introduction ...................................................................................... 15
3.2. The Extended Reversed Two Station Method ................................. 153.3. Preliminary Results of Lg Wave Attenuation ................... 18
Section IV. Discussion and Conclusions ......................................................... 254.1 Summary of the Research Program ................................................... 254.2 Research Plan for the Second Year ................................................... 25
Achnowledgements .......................................................................................... 26References ....................................................................................................... . 26
SAcce~ior For
-"•-"':-..;NTIS CPAaM
" 51c " DTIC TARUr, urmcw .'.: 'd
J:1stif1Cat;v',-
By... .......... o......
AvI i . i.- - "-,.
Dist
I. INTRODUCTION
1.1 Background
Over the years the DARPA research program to develop regional discrimination pro-cedures has produced numerous advances in our understanding of the regional phases gen-erated by seismic sources. The installation of the IRIS/CDSN stations in the former SovietUnion and the People's Republic of China and well-managed data transition from these sta-tions to the Center of Seismic Studies (CSS) have provided opportunities to study regionalwave propagation in Eurasia with high-quality three-component recordings. These havebrought advances in understanding the characteristics of the wave propagation and sourcediscrimination in the region as evidenced by the 14th PL/DARPA Annual Meeting. The objec-tive of our program under DARPA funding is to obtain frequency-dependent P,, and Lgattenuation measurements that are accurate enough to result in significant improvement inseismic monitoring in nuclear verification. Scientifically, our research intends to investigate thefrequency-dependent attenuation of the regional phases in Central Asia, especially in China,where the aspect has never been studied. Technically, we emphasize developments in metho-dology to isolate frequency-dependent, non-propagating contaminants (geological site effects,instrument response error, etc.) from seismic wave propagation effects (geometrical spreadingand attenuation).
To fulfill the above objectives, we have transcribed and processed data from two data-bases, i.e., three-component broadband data from the IRIS/CDSN stations in Eurasia andsingle-component data from the Beijing Telemetered Network (BTN). Although data from theIRIS and CDSN stations may contain information of wave propagation under a very largeregion, an intrinsic difference between the two recording systems is that the CDSN stationswere set to triggered mode while the IRIS stations record continuously. We have transcribeddata from events with magnitude greater than 5 (mb) so that for a single event, there are rea-sonable number of good S/N records from both CDSN and IRIS stations. By the end of thefirst year, we have developed procedures, which are capable of providing consistert site/sourcecorrected attenuation measurements with data collected by sparsely located broadband stationsin Eurasia. To study frequency-dependent attenuation in Eurasia, data from the BTN appears tobe an important component as the network records seismicity at local and regional distanceranges from neighboring regions of active tectonics. In contrast to the distribution of thebroadband stations in Eurasia, recordings from the relatively dense array of the BTN provideopportunities to test and develop procedures with different geometric considerations, and tocompare with the existing methods, which have been successfully applied elsewhere.
1.2 Research on Methodology of Regional Wave Attenuation
Chun et al. (1987) have shown that by using reversed two-station method (RTSM), Lgattenuation along short Canadian Shield (high-Q) paths can be accurately measured in the pres-ence of strong site effects and unknown instrument response errors. The method was extended,with a least-squares inversion scheme, to obtain the frequency dependence of both geometrical
2
spreading (n) and anelastic attenuation (y) for Pn, wave propagation in Eastern Canada (Zhu etal., 1991). Central to our project is to develop a generalized method for the regional wave
attenuation study in Eurasia, based on the procedures that were successfully applied in EasternCanada. The development in methodology considered here emphasizes the application suitablefor data from sparsely-located network stations.
Two methods have been formulated and tested during the first year of our project, i.e.,
source pair/receiver pair method (SPRP) and the extended reversed two station method(extended RTSM). Compared to the RTSM, the geometric restriction on the input ray paths to
the SPRP method is relaxed in the situation where there are not enough collinear station-eventpairs, i.e., ray paths from the seismic events to stations along the great-circle paths. When theeffect of the source radiation pattern is considered minor as in the case of Lg wave propagation,relaxation of the geometric restriction increases the number of station-event pairs and there-
fore, leads to statistically stable results. However, the effect of the source radiation pattern can-not be entirely neglected as in the case of Pn or S,, wave propagation. Hence, we havedeveloped the extended RTSM, the first step of which requires ray paths between the two sta-tions and one event be collinear to cancel the source effect. To accommodate the situationwhere the collinear reversal does not exist, the extended RTSM employs a triangularconfiguration, which cancels the site effect by combining three station-event pairs. Further, the
formulation of the two methods has shown that with slight difference in computer program-
ming, we can carry out the simultaneous site and source correction regardless the stationsstraddle the events or vice versa. The report provides a description of each method and itsapplication in the Lg wave attenuation studies.
1.3 Organization of the Report
This report is divided into four sections including this introduction. Section II comprises a
brief derivation of the SPRP method and its time-domain application to the Lg wave attenua-tion study in Eurasia. Earthquakes of regional and far-regional distances are used in thisanalysis. Previous studies in the region have mostly employed techniques in the frequencydomain. We present it in time domain because (1) the result is directly applicable to the sourcescaling and discrimination, and (2) at the distance range from a few hundreds to five thousandskilometers, we found in the same data set the results from the time-domain analysis is superior
than those in frequency domain as shown previously by Chun et al. (1992). Section HIcomprises a brief derivation of the extended RTSM, and its application to the Lg wave attenua-tion study in data from BTN. Preliminary results from the frequency-domain analysis show thatattenuation in the area under BTN is relatively high. The analysis has also revealed that largediscrepancies may exist between the time- and frequency-domain results. Finally, Section IVprovides a summary of our research effort in the first year and identifies the future plans.
3
IL TIME-DOMAIN ANALYSIS OF Lg
WAVE ATTENUATION IN EURASIA
2.1 Introduction
Knowledge of regional wave attenuation, especially that of the Lg waves, is prerequisite toreliable seismic source parameter retrieval. While seismic attenuation studies have beennumerous over the past two decades, most published results pertain to frequency-domain meas-urements which have paid little attention to the time-resolution or waveform features of theregional signatures being studied. It is thus interesting to observe that modem waveform(time-domain) analysis frequently requires attenuation corrections to be applied to a short,specific portion of a seismic record, as exemplified by Nuttli's method (Nuttli, 1986, and 1988)of explosion yield estimation using L. waves. It appears that attenuation estimates derivedfrom a dominant part of an Lg wavetrain could be more useful in seismic verification thanfrequency-domain estimates derived from arbitrarily selected time or group velocity windows,which are typically much longer than the dominant portion of Lg wavetrains.
The current research project seeks to remedy the apparent shortcomings of the frequency-domain attenuation measurement techniques while retaining the unique capability of the RTSMmethod for simultaneous corrections of source and site effects (Chun et al., 1987). The newtechnique, termed SPRP (Chun and Zhu, 1992), is tested on Eurasian seismic data for its per-formance and suitability as a tool to produce high-resolution regional attenuation results. Thetests are conducted as a prelude to the regionalization scheme which we will apply to the studyof attenuation under Eurasia.
2.2 The Source Pair/Receiver Pair Method
We denote by A the narrow-band filtered time-domain Lg amplitude due to Ph sourceand recorded at the j' station. Inserting instrument amplification Ij, site amplification Si andsource radiation pattern Ri, we parameterize Aij as
Ai~j = AiRi/jSjd- '•l3 (sin Ai~j)-t2 e•,(1Ili ~ (1)
where Ai is the source excitation, dij the epicentral distance in kilometers between the i1 h
source and Pth station, and A the same epicentral distance in degrees. The geometrical spread-ing coefficient used here follows Nuttli (1973). 'y is the coefficient of anelastic attenuation, andis related to the quality factor Q(f) as
) f (2)UQ(f)'where U is the group velocity.
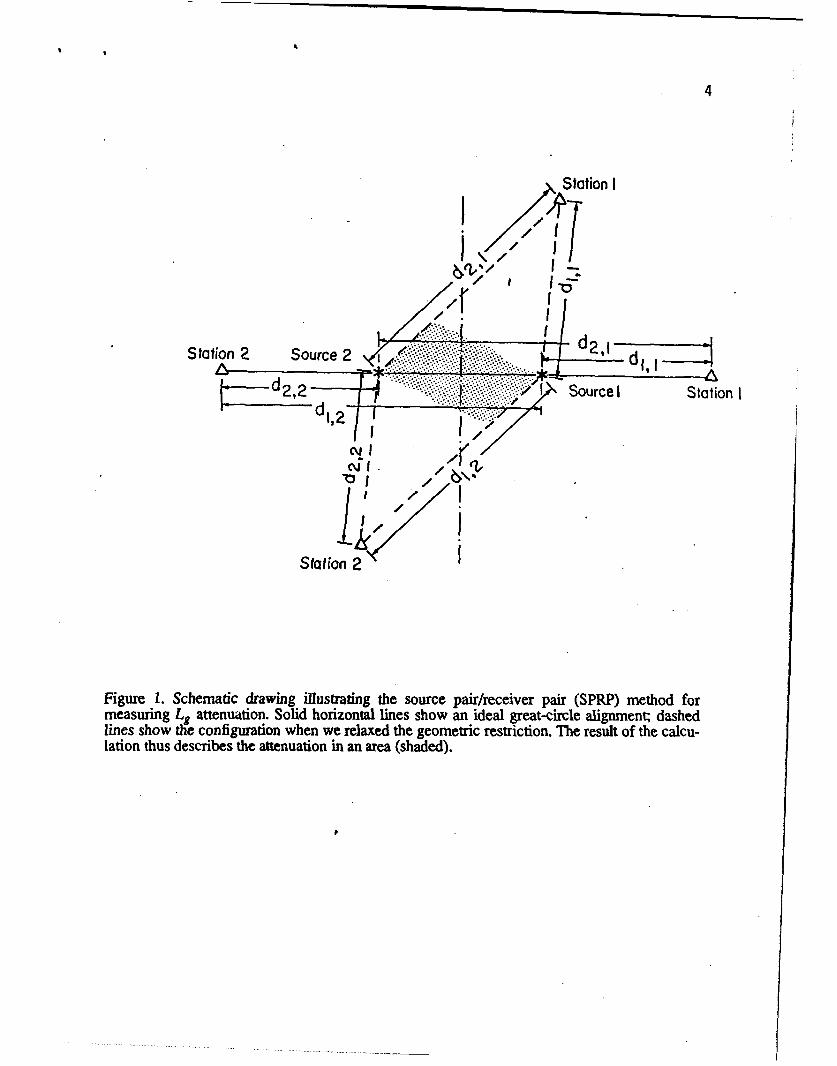
In RTSM (Chun et a., 1987; Zhu et al. 1991), the pairs of sources and stations are along agreat-circle path as shown by the solid lines in Figure 1. It can be readily shown that
4
Station I
Station 2 Source 2 d,
I-2, Source I Station I
i'lk
Station 2 I
Figure 1. Schematic drawing illustrating the source pair/receiver pair (SPRP) method formeasuring L. attenuation. Solid horizontal lines show an ideal great-circle alignment; dashedlines show the configuration when we relaxed the geometric restriction. The result of the calcu-lation thus describes the attenuation in an area (shaded).
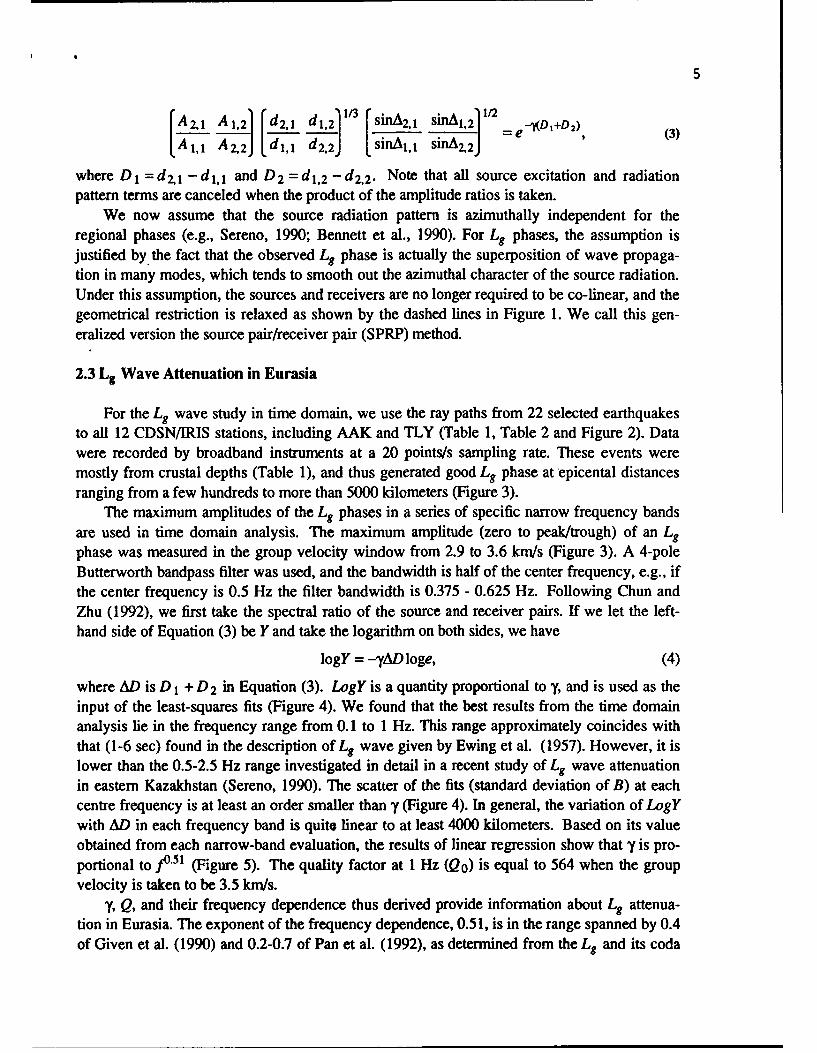
5r A 2 A 1 2] d2, 1/3 sinA2,j sfA 1,2 )1 1 eI+D2 (3)
A, 1, AZ,2 J 1dI --d2J , Sinak,1 SinA 2,2 J
where DI =d2,1 -d 1 , 1 and D 2 =d 1,2 -d 2,2. Note that all source excitation and radiationpattern terms are canceled when the product of the amplitude ratios is taken.
We now assume that the source radiation pattern is azimuthally independent for theregional phases (e.g., Sereno, 1990; Bennett et al., 1990). For Lg phases, the assumption isjustified by the fact that the observed Lg phase is actually the superposition of wave propaga-tion in many modes, which tends to smooth out the azimuthal character of the source radiation.Under this assumption, the sources and receivers are no longer required to be co-linear, and thegeometrical restriction is relaxed as shown by the dashed lines in Figure 1. We call this gen-eralized version the source pair/receiver pair (SPRP) method.
2.3 Lg Wave Attenuation in Eurasia
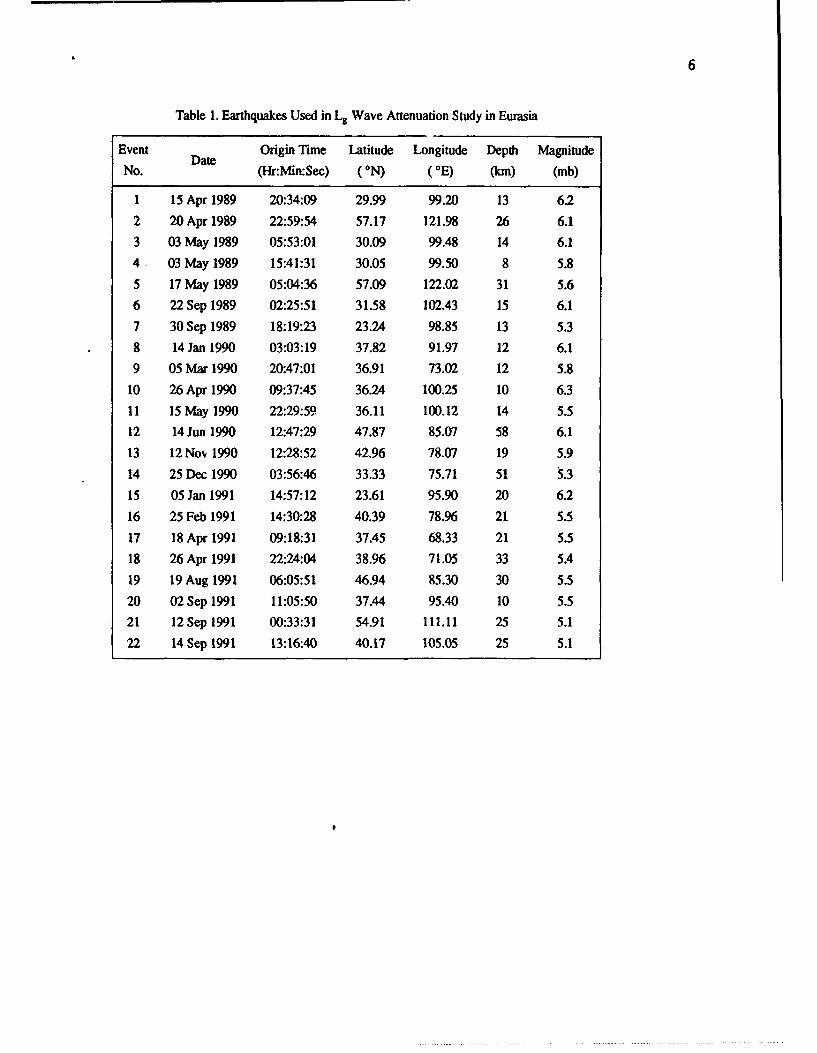
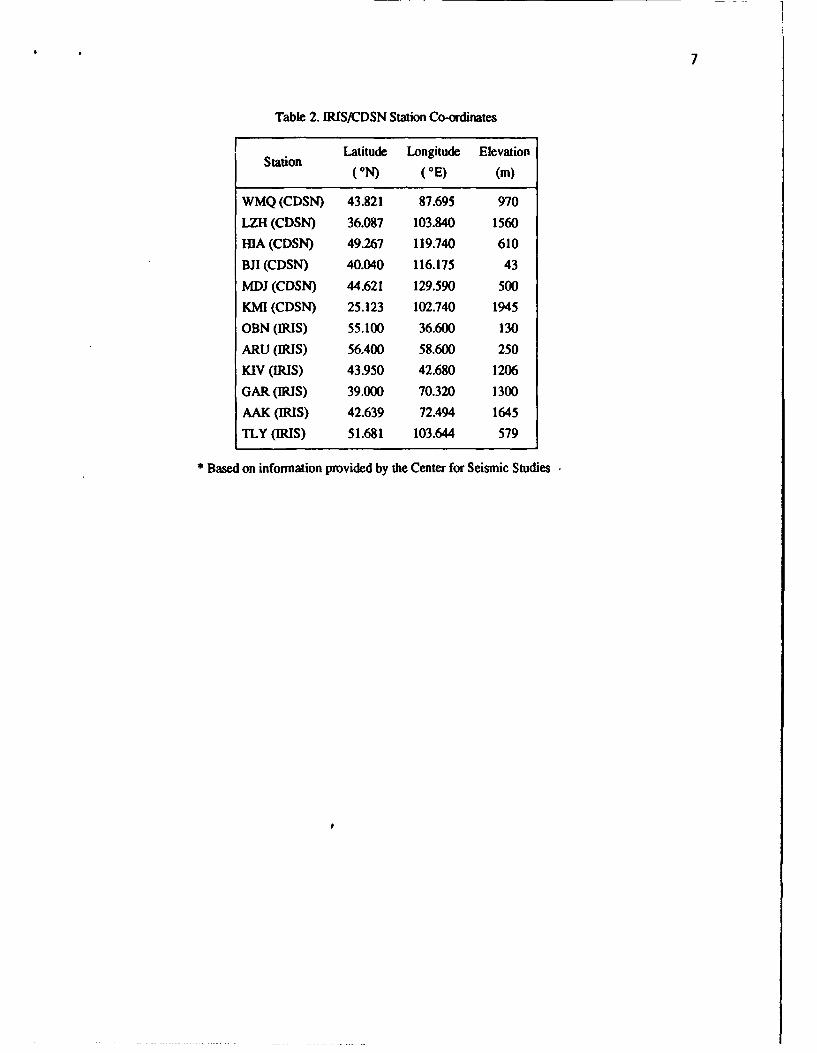
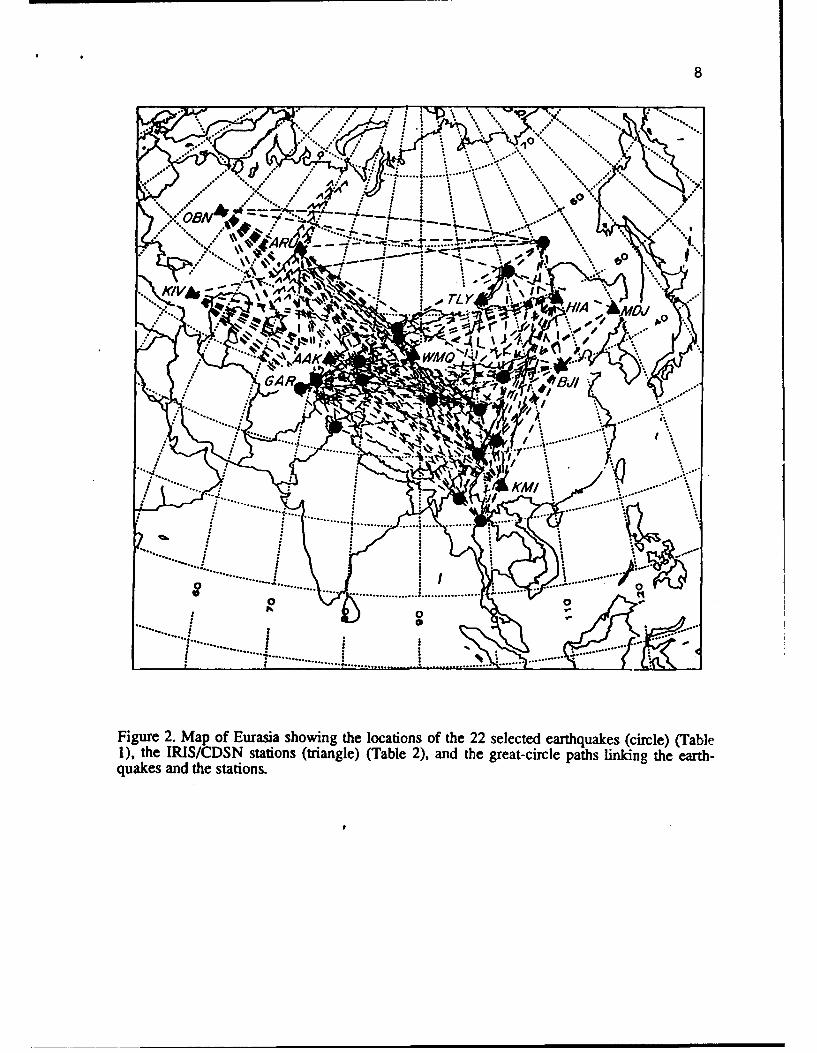
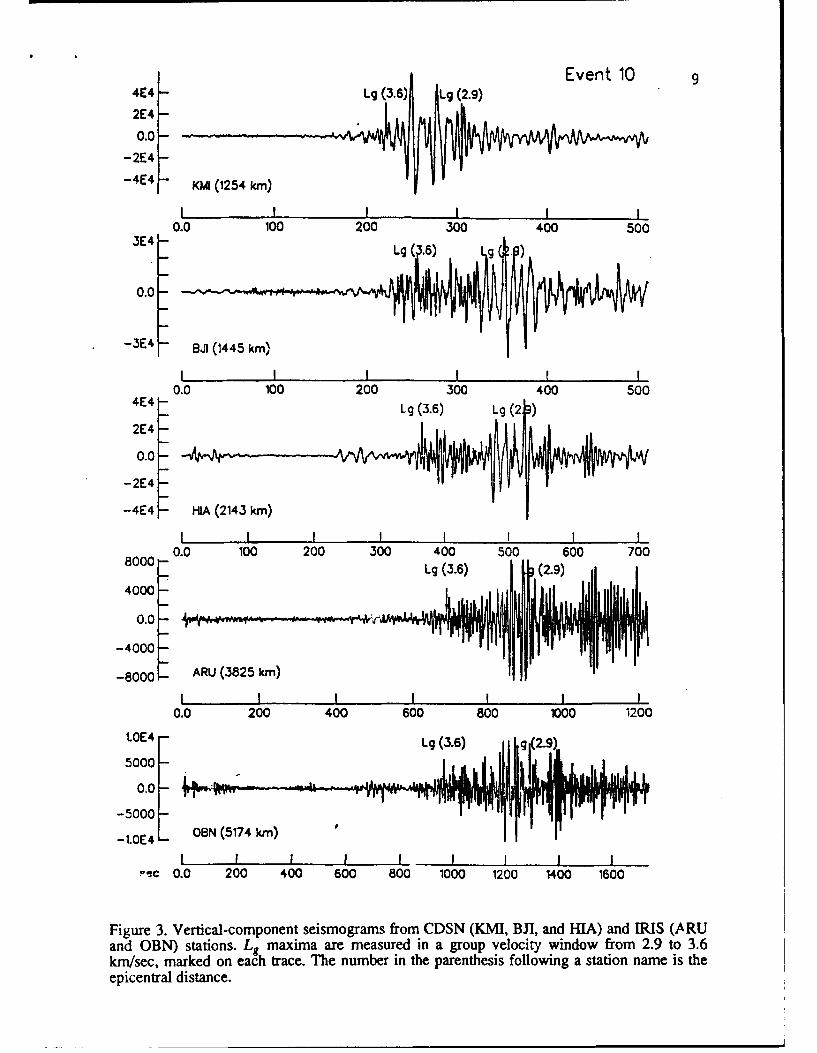
For the L9 wave study in time domain, we use the ray paths from 22 selected earthquakesto all 12 CDSN/IRIS stations, including AAK and TLY (Table 1, Table 2 and Figure 2). Datawere recorded by broadband instruments at a 20 points/s sampling rate. These events weremostly from crustal depths (Table 1), and thus generated good Lg phase at epicental distancesranging from a few hundreds to more than 5000 kilometers (Figure 3).
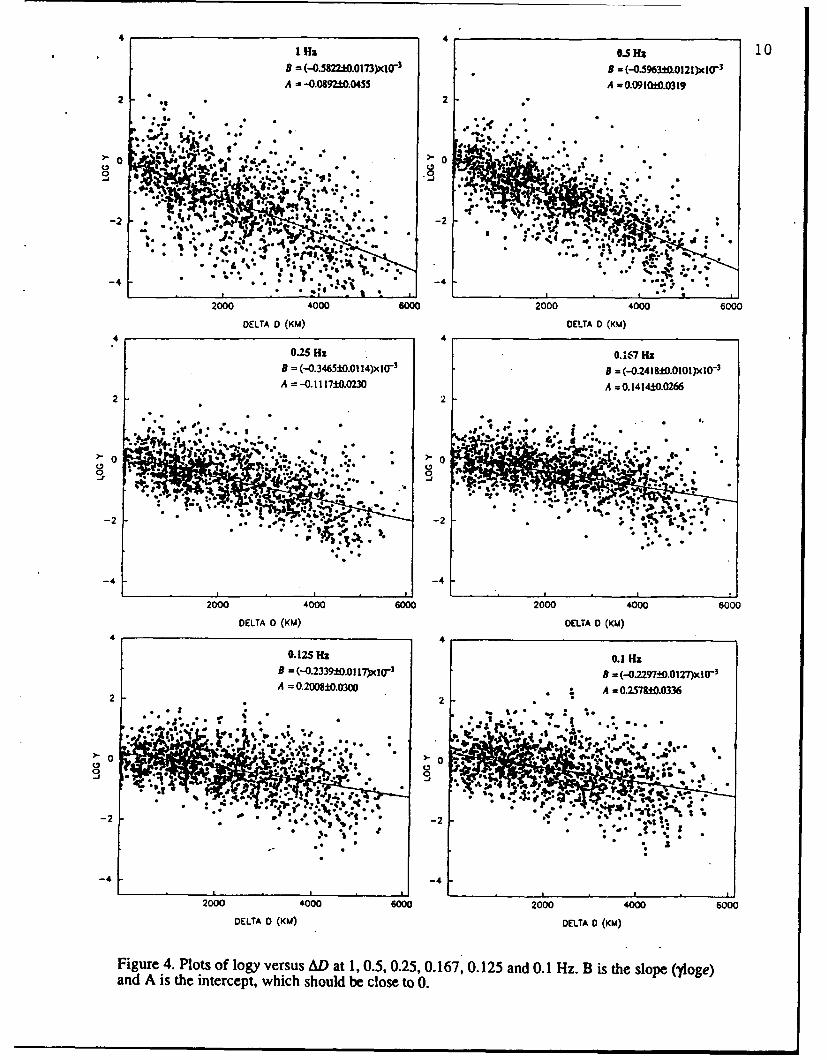
The maximum amplitudes of the Lg phases in a series of specific narrow frequency bandsare used in time domain analysis. The maximum amplitude (zero to peak/trough) of an Lgphase was measured in the group velocity window from 2.9 to 3.6 km/s (Figure 3). A 4-poleButterworth bandpass filter was used, and the bandwidth is half of the center frequency, e.g., ifthe center frequency is 0.5 Hz the filter bandwidth is 0.375 - 0.625 Hz. Following Chun andZhu (1992), we first take the spectral ratio of the source and receiver pairs. If we let the left-hand side of Equation (3) be Y and take the logarithm on both sides, we have
logY = -yAD loge, (4)
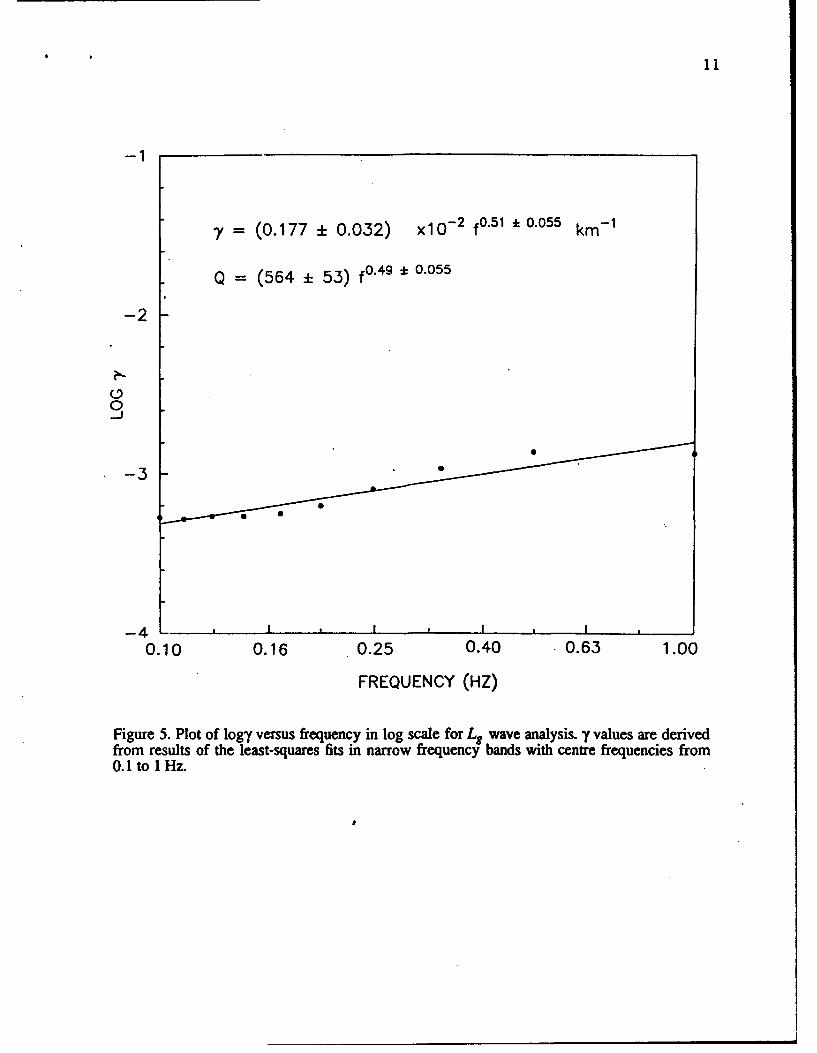
where AD is D I + D 2 in Equation (3). LogY is a quantity proportional to y, and is used as theinput of the least-squares fits (Figure 4). We found that the best results from the time domainanalysis lie in the frequency range from 0.1 to 1 Hz. This range approximately coincides withthat (1-6 sec) found in the description of Lg wave given by Ewing et al. (1957). However, it islower than the 0.5-2.5 Hz range investigated in detail in a recent study of Lg wave attenuationin eastern Kazakhstan (Sereno, 1990). The scatter of the fits (standard deviation of B) at eachcentre frequency is at least an order smaller than y (Figure 4). In general, the variation of LogYwith AD in each frequency band is quito linear to at least 4000 kilometers. Based on its valueobtained from each narrow-band evaluation, the results of linear regression show that y is pro-portional to fJo-5 (Figure 5). The quality factor at 1 Hz (Qo) is equal to 564 when the groupvelocity is taken to be 3.5 km/s.
y, Q, and their frequency dependence thus derived provide information about Lg attenua-tion in Eurasia. The exponent of the frequency dependence, 0.51, is in the range spanned by 0.4of Given et al. (1990) and 0.2-0.7 of Pan et al. (1992), as determined from the Lg and its coda
• 6
Table 1. Earthquakes Used in L. Wave Attenuation Study in Eurasia
Event Origin Time Latitude Longitude Depth Magnitude
No. (Hr:Min:Sec) (°N) (OE) (kcm) (mb)
1 15 Apr 1989 20:34:09 29.99 99.20 13 6.2
2 20 Apr 1989 22:59:54 57.17 121.98 26 6.1
3 03 May 1989 05:53:01 30.09 99.48 14 6.1
4 03 May 1989 15:41:31 30.05 99.50 8 5.8
5 17 May 1989 05:04:36 57.09 122.02 31 5.6
6 22 Sep 1989 02:25:51 31.58 102.43 15 6.1
7 30 Sep 1989 18:19:23 23.24 98.85 13 5.3
8 14 Jan 1990 03:03:19 37.82 91.97 12 6.1
9 05 Mar 1990 20:47:01 36.91 73.02 12 5.8
10 26 Apr 1990 09:37:45 36.24 100.25 10 6.3
11 15 May 1990 22:29:59 36.11 100.12 14 5.5
12 14 Jun 1990 12:47:29 47.87 85.07 58 6.1
13 12 Nov 1990 12:28:52 42.96 78.07 19 5.9
14 25 Dec 1990 03:56:46 33.33 75.71 51 5.3
15 05 Jan 1991 14:57:12 23.61 95.90 20 6.2
16 25 Feb 1991 14:30:28 40.39 78.96 21 5.5
17 18 Apr 1991 09:18:31 37.45 68.33 21 5.5
18 26 Apr 1991 22:24:04 38.96 71.05 33 5.4
19 19 Aug 1991 06:05:51 46.94 85.30 30 5.5
20 02 Sep 1991 11:05:50 37.44 95.40 10 5.5
21 12Sep 1991 00:33:31 54.91 111.11 25 5.1
22 14 Sep 1991 13:16:40 40.17 105.05 25 5.1
' ' 7
Table 2. [RIS/CDSN Station Co-ordinates
Latitude Longitude ElevationStation( ON) ( OE) (W)
WMQ (CDSN) 43.821 87.695 970
LZH (CDSN) 36.087 103.840 1560
HIA (CDSN) 49.267 119.740 610
BJI (CDSN) 40.040 116.175 43
MDJ (CDSN) 44.621 129.590 500
KMI (CDSN) 25.123 102.740 1945
OBN (IRIS) 55.100 36.600 130
ARU (IRIS) 56.400 58.600 250
KIV (IRIS) 43.950 42.680 1206
GAR (IRIS) 39.000 70.320 1300
AAK (IRIS) 42.639 72.494 1645
TLY (IRIS) 51.681 103.644 579
* Based on information provided by the Center for Seismic Studies
8
................
. %
*~ --Tt.
I' *A
Is
.......
..................
Figure 2. Map of Eurasia showing the locations of the 22 selected earthquakes (circle) (Table1), the IRIS/CDSN stations (triangle) (Table 2), and the great-circle paths linking the earth-quakes and the stations.
Event 1094E4 -L 36 L 9
2E4 -
0.0-
-2E4
-4E4 KM (1254 kmn)
I!I I II
0.0 100 200 300 400 5003E4,6L .
0.0-
-3E4 8J (1445 kin)
I I I I
0.0 100 200 300 400 5004E4 - Lg (3.6) Lg (2 )
2E4 -
0.0-
-2E4
-4E4 HIA (2143 kin)
S I I I I I I I
0.0 100 200 300 400 500 600 7008000- . Lg (3.6) (2.9)
4000-
0.0 - •
-4000
-8000 ARU (3825 kin)
I I I I I I
0.0 200 400 600 800 1000 1200
1.0E4 -Ig (3.6) g 2.9)
5000-
0.0- MAF-5000 -
-1.0E4 L- 0N (5174 kM)I I ! I I I I
ý-,ec 0.0 200 400 600 800 1000 1200 1400 1600
Figure 3. Vertical-component seismograms from CDSN (KMI, BJI, and HIA) and IRIS (ARUand OBN) stations. L9 maxima are measured in a group velocity window from 2.9 to 3.6km/sec, marked on each trace. The number in the parenthesis following a station name is theepicentral distance.
I1Hz 0-5 Ha 10B = (-OMM22O.0173)xlr' -=(05963±0.0121)xi10'A - -0.0992±0.0455 A - 0.09 10±0.0319
22
* 02
*~N Mr. . .
-2 -2 -J*.L~ J*
2000 4000 6000 2000 4000 6000
DELTA 0 (KM) DELTA 0 (KU)
0.25 Hz 0.167 Hz
B = (-0.3465±0.01 4)xi(r3 B = (-0.241M±.010l)XIO-3A = -0. 11 17±0.0230 A =0. 1414±0.0266
2
>- 0 0
* 0b~ t* .*.0
-2 2. -2*.
-4 r-4
2000 4000 6000 2000 4000 6000
DELTA 0 (KM) DELTA 0 (KU)44
0. 12S5Hz 0.1 H~zB = (-0.2339±0.01 17)xlor3
B = (-0.22q7±o.oi27hxtO 3
A = 0.2008±0.0300 A027±.362 * 2
-4 -4
2000 4000 6000 2000 4000 6000
DELTA 0 (KM) DEL.TA 0 (KM)
Figure 4. Plots of logy versus AD at 1, 0.5, 0.25, 0.167, 0.125 and 0. 1 Hz. B is the slope (-foge)and A is the intercept, which should be close to 0.
• D 1 1
-1
-y = (0.177 + 0.032) x10- 2 fo.51 k 0.055 km- 1
Q = (564 ± 53) f0.4 9 t 0.055
-2
-3
SS
*-3
0.10 0.16 0.25 0.40 0.63 1.00
FREQUENCY (HZ)
Figure 5. Plot of logy versus frequency in log scale for Lg wave analysis. y values are derivedfrom results of the least-squares fits in narrow frequency bands with centre frequencies from0.1 to 1 Hz.
II
12
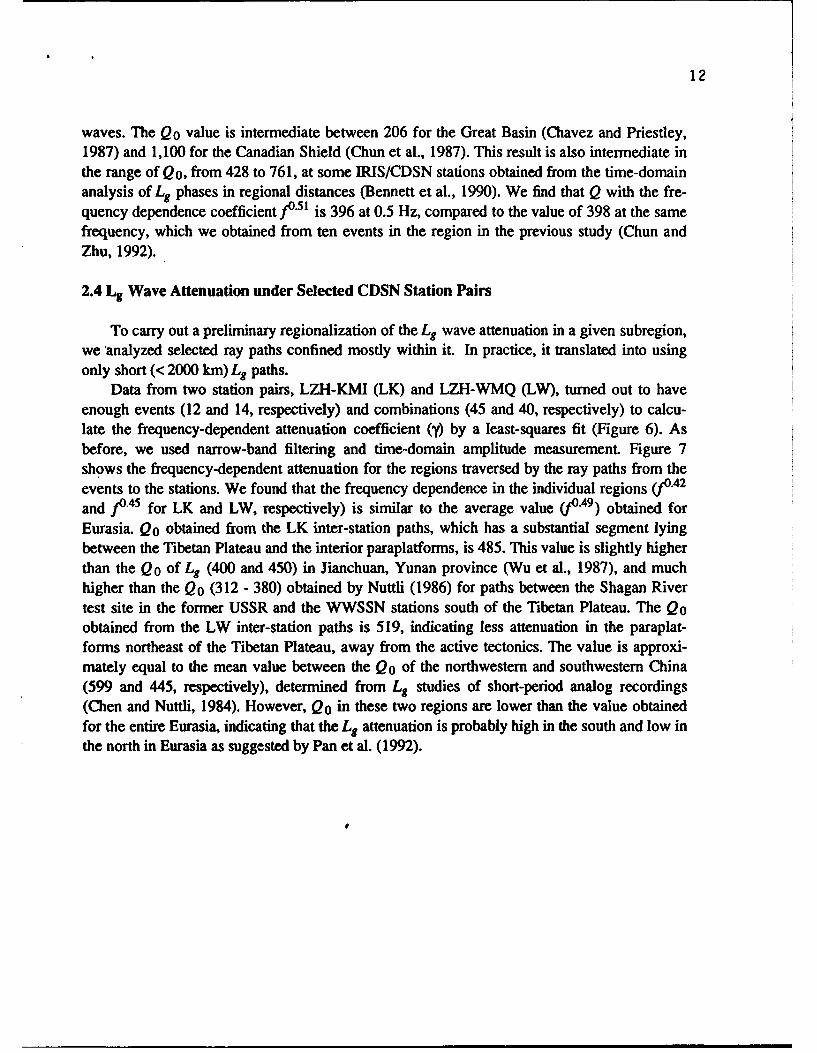
waves. The Qo value is intermediate between 206 for the Great Basin (Chavez and Priestley,1987) and 1,100 for the Canadian Shield (Chun et al., 1987). This result is also intermediate inthe range of Qo, from 428 to 761, at some IRIS/CDSN stations obtained from the time-domainanalysis of Lg phases in regional distances (Bennett et al., 1990). We find that Q with the fre-quency dependence coefficient fo.O1 is 396 at 0.5 Hz, compared to the value of 398 at the samefrequency, which we obtained from ten events in the region in the previous study (Chun andZhu, 1992).
2.4 L9 Wave Attenuation under Selected CDSN Station Pairs
To carry out a preliminary regionalization of the L8 wave attenuation in a given subregion,we analyzed selected ray paths confined mostly within it. In practice, it translated into usingonly short (< 2000 kin) Lg paths.
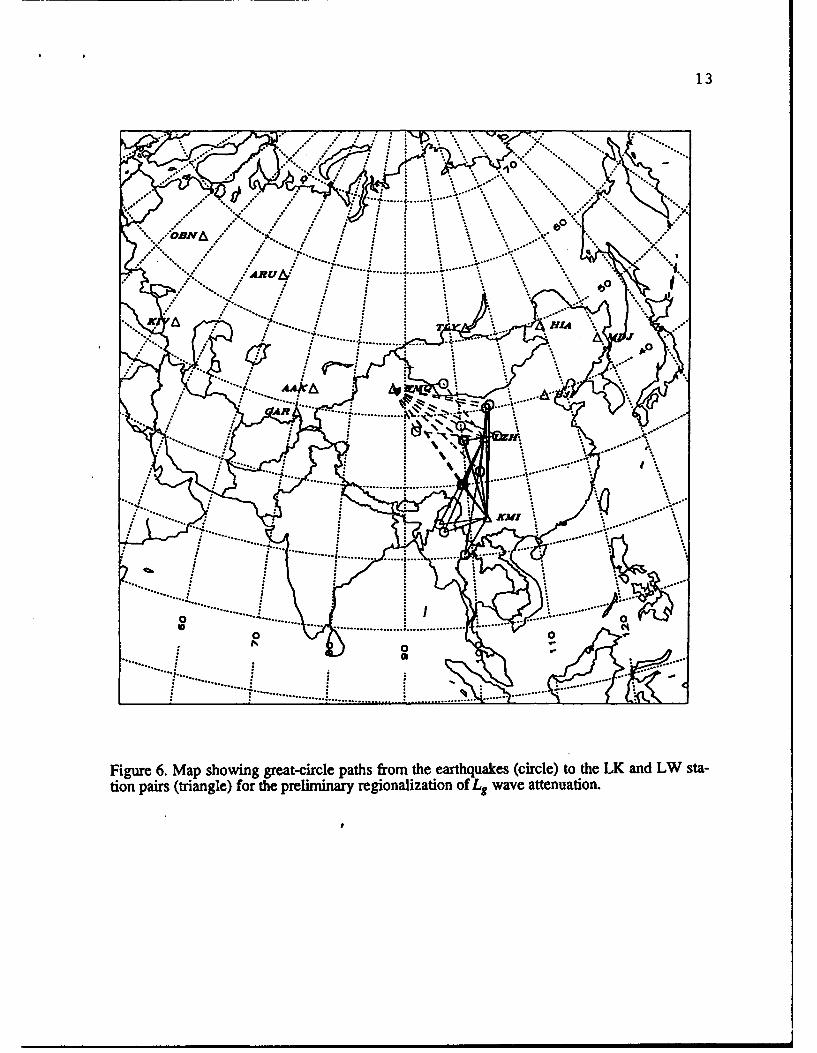
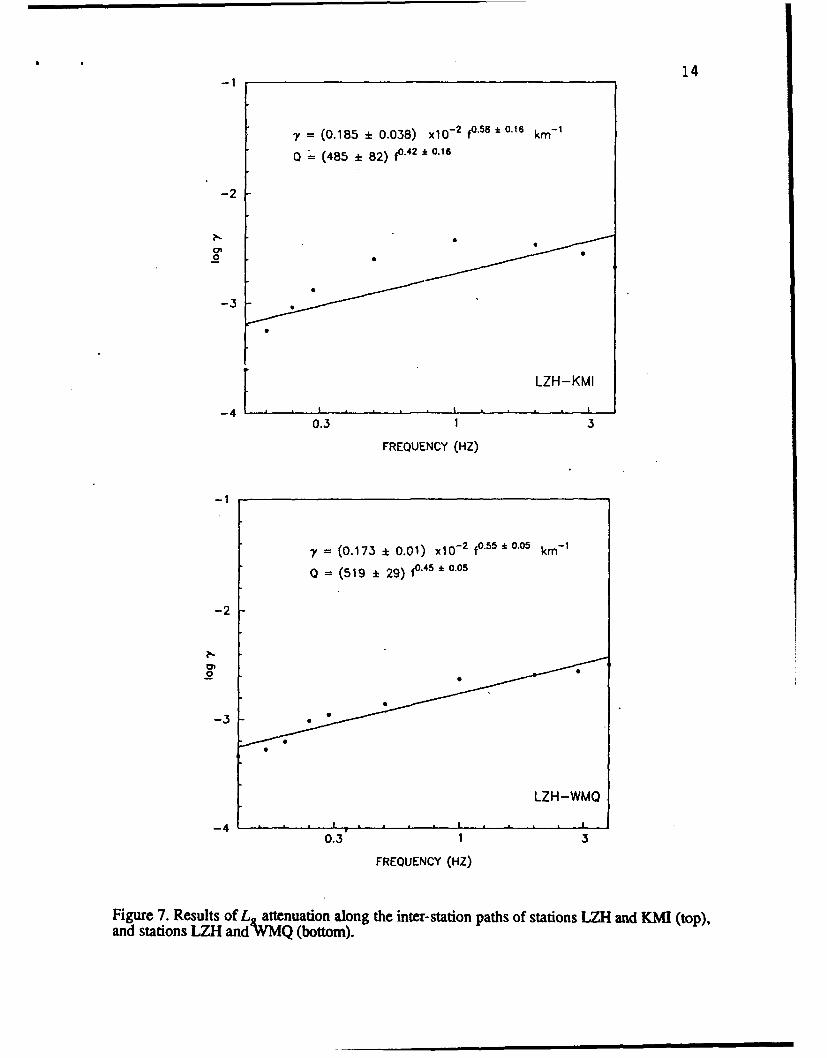
Data from two station pairs, LZH-KMI (LK) and LZH-WMQ (LW), turned out to haveenough events (12 and 14, respectively) and combinations (45 and 40, respectively) to calcu-late the frequency-dependent attenuation coefficient (y) by a Ieast-squares fit (Figure 6). Asbefore, we used narrow-band filtering and time-domain amplitude measurement. Figure 7shows the frequency-dependent attenuation for the regions traversed by the ray paths from theevents to the stations. We found that the frequency dependence in the individual regions (Y0.42
and fo.45 for LK and LW, respectively) is similar to the average value (jo.49) obtained forEurasia. Qo obtained from the LK inter-station paths, which has a substantial segment lyingbetween the Tibetan Plateau and the interior paraplatforms, is 485. This value is slightly higherthan the Qo of Lg (400 and 450) in Jianchuan, Yunan province (Wu et al., 1987), and muchhigher than the Qo (312 - 380) obtained by Nuttli (1986) for paths between the Shagan Rivertest site in the former USSR and the WWSSN stations south of the Tibetan Plateau. The Q0obtained from the LW inter-station paths is 519, indicating less attenuation in the paraplat-forms northeast of the Tibetan Plateau, away from the active tectonics. The value is approxi-mately equal to the mean value between the Qo of the northwestern and southwestern China(599 and 445, respectively), determined from L8 studies of short-period analog recordings(Chen and Nuttli, 1984). However, Qo in these two regions are lower than the value obtainedfor the entire Eurasia, indicating that the L. attenuation is probably high in the south and low inthe north in Eurasia as suggested by Pan et al. (1992).
0'
13
* .X0
00% %A
ARU/&
t 0f%
..........
........... &
Figre . ap hoinggrat-iceptsfrmteerhuke crl)theL n Wsatio pars trange) orthepreimnar reioaPiaino waeatnain
............
14-1
y = (0.185 * 0.038) x10- 2 fO.S 8 0.16 km-1
Q . (485 . 82) fo.4 2 , 0.16
-2
-3
o
LZH-KMI
0.3 1 3
FREQUENCY (HZ)
-1
y = (0.173 * 0.01) x10- 2 fo.55 0.05 km- 1
o = (519 + 29) fo. 0.05
-2
.20
LZH-WMQ
0.3 1 3
FREQUENCY (HZ)
Figure 7. Results of L attenuation along the inter-station paths of stations LZH and KNH (top),and stations LZH and'WMQ (bottom).
15
II. PRELIMINARY ANALYSIS OF Lg WAVEATTENUATION UNDER BEIJING TELEMETERED NETWORK (BTN)
3.1 Introduction
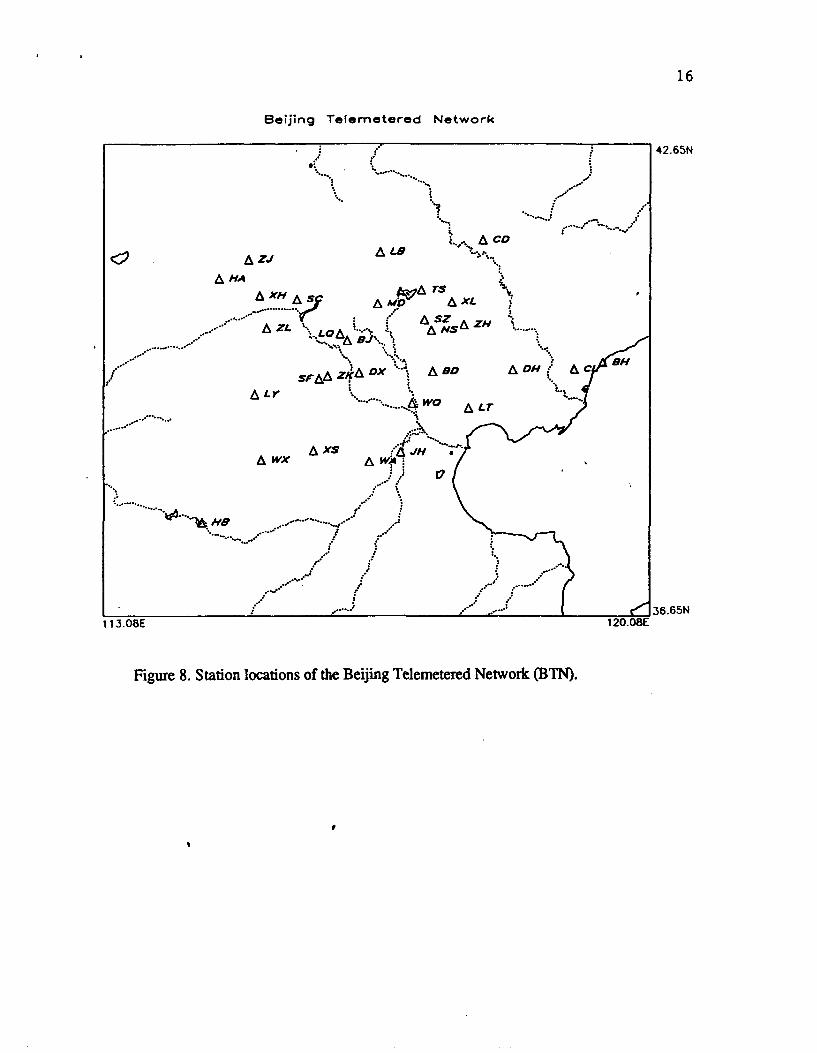
The Beijing Telemetered Network (BTN) consists of 29 vertical-component stations (Fig-ure 8), of which station BJ in Beijing collocates with the CDSN station BJI. Two types ofseismometers, DS-1 and 768, are deployed at BTN stations, both having flat displacementresponse between 0.1 and 10 Hz. The station calibrations are conducted daily. The time codeuses Beijing time and is corrected every two hours with respect to the time signals broadcastedby Shanxi Astronomical Observatory. The system operates in triggered mode, the pretriggertime being 30.72 sec. Data are digitized at 100 points/sec.
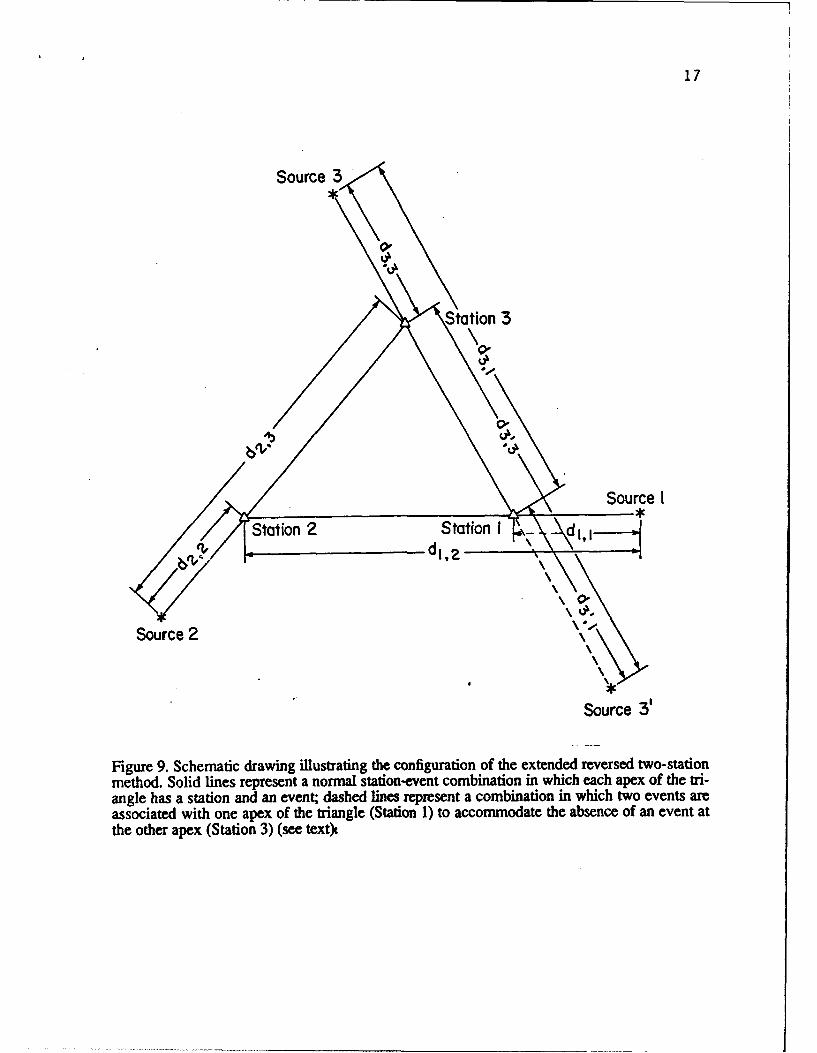
With numerous stations and events, we have tested and developed means, based on thereversed two-station method (RTSM, Chun et al., 1987), to analyze data collected at sparsely-located permanent stations. We here introduce an extended RTSM method, in which we firstcalculate the spectral ratio of seismograms at two stations from one event to cancel the sourceeffects, and then calculate the spectral ratio of a three-event combination to cancel the siteeffects (Figure 9). The method is applied to the Lg wave attenuation study in an area traversedby the ray paths from 13 local and regional earthquakes to the stations of BTN.
3.2 The Extended Reversed Two Station Method
We denote by F the spectral amplitude of the Lg wave. F can be expressed in the form
Fijf,d) = Si(f )Ri(f, )Gij(d)Fij(f d)lj(f )SSj(f ) (5)
where f denotes the frequency, d the epicentral distance, 0 the station azimuth. Fij representsthe Lg spectral amplitude due to the Ph source and recorded at the jth station. The parameterson the right-hand side of the equation include the source excitation function (S), source radia-tion pattern (R), geometrical spreading function (G = d-0-5), instrument response (I), stationsite response (SS), and the anelastic attenuation function, which can be written as
F(f,d) = e-1'. (6)
The coefficient is related to the quality factor Q(f) by Equation (2).Consider the diagram in Figure 9 where stations 1 and 2 are aligned with event 1 along a
great-circle path, the spectral ratio taken at this stage cancels the source terms (S and R). Whenevent 2 is not along the great-circle path with stations 1 and 2 and therefore, a perfect two-station reversal is impossible, we add in station 3 and event 3. If a station-event pair is found tobe nearby each apex of the triangular configuration (solid lines in Figure 9), we have the fol-lowing equation after cancellation of the site response term (SS) and the instrument response(I):
16
Beijing Telemetered Network
*" 42.65N
* ....°.
%I.~ CD
HA.XH r f a, z ~• S..
.................... , A S• zL "s A ZH
.. """...LOA .*...... ....•." --LLQA.-.--•• -., " ASZ
ALY%.... ... .. A...
" ........... , . r36.65N
1 13.08E 1 20.08E
Figure 8. Station locations of the Beijing Telemetered Network (BTN).
S... • " " .• ••. •,.,
Ir
17
Source 3
Si 3
Source I
Station 2 Station I
Source 2
*
Source 3'
Figure 9. Schematic drawing illustrating the configuration of the extended reversed two-stationmethod. Solid lines represent a normal station-event combination in which each apex of the tri-angle has a station and an event; dashed lines represent a combination in which two events areassociated with one apex of the triangle (Station 1) to accommodate the absence of an event atthe other apex (Station 3) (see text)t
18
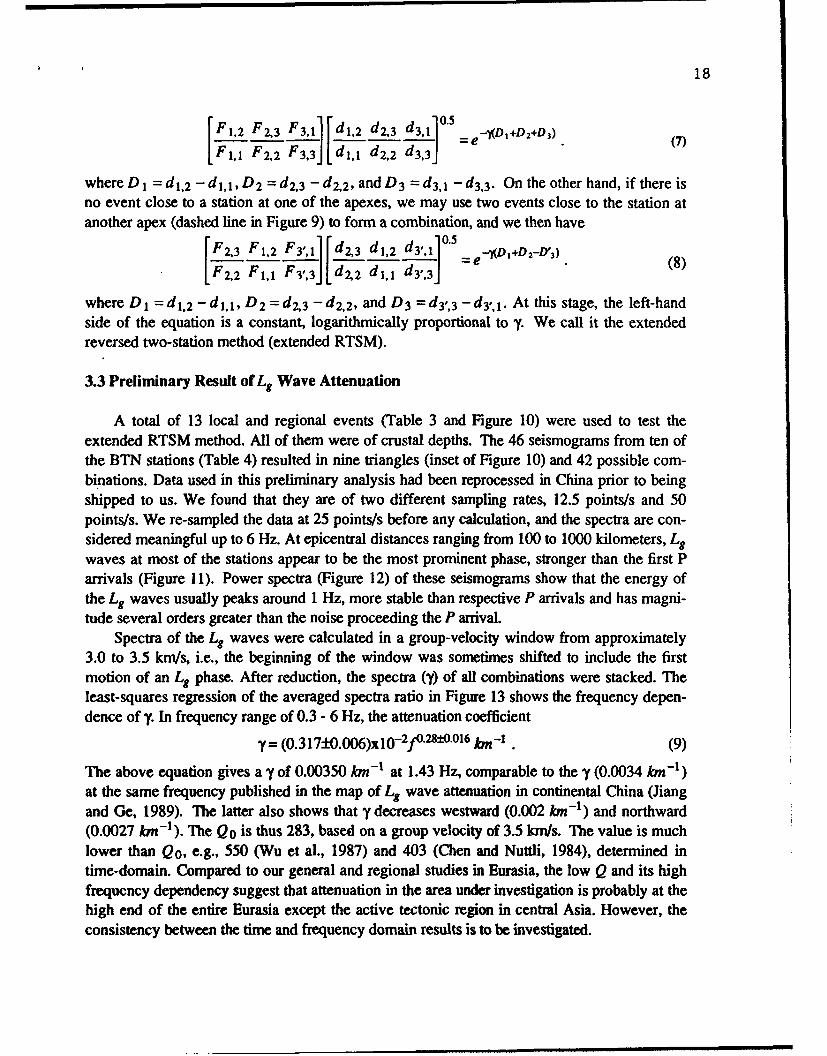
SiF 310.5F1,2 F 2,3 F3, 1 - d1,2 d2,3 d3,1 " 0 -. D 1+DD2+D 3) (7)
F1,1 F2,2 F 3,3] I d1,1 d2,2 d,
where D1 = d1 ,2 - d1 ,1, D 2 = d 2,3 - d 2,2 , and D 3 = d3,1 - d 3,3. On the other hand, if there isno event close to a station at one of the apexes, we may use two events close to the station atanother apex (dashed line in Figure 9) to form a combination, and we then have
F2 .3 F1 ,2 FYJ, d,, 3 d1,2 d3 ',1 0. -IlD I+D 2-D' 3)(8
F 2,2 F 1, 1 F 3',3] dZ2 d1 ,1 d 3',3 •
where D 1 =d 1 ,2 - .d1 j, D 2 =d2,3 - d 2 ,2 , and D 3 =dy, 3 -dy,1. At this stage, the left-handside of the equation is a constant, logarithmically proportional to y. We call it the extendedreversed two-station method (extended RTSM).
3.3 Preliminary Result of Lg Wave Attenuation
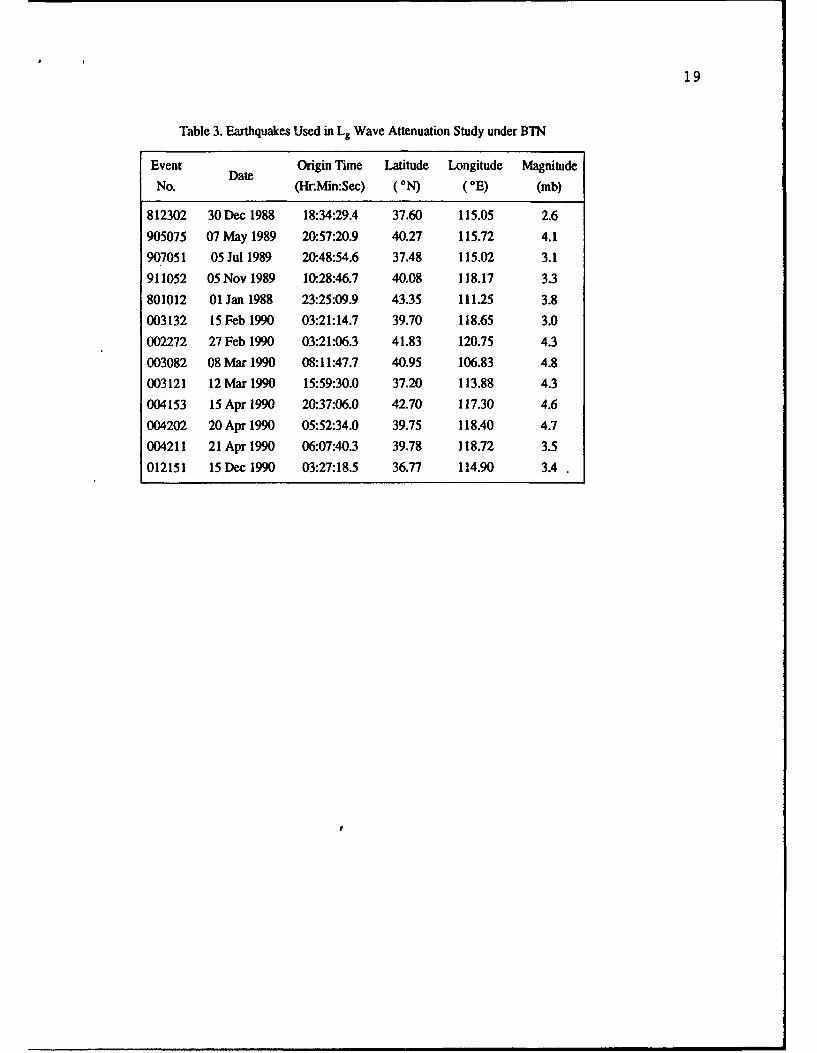
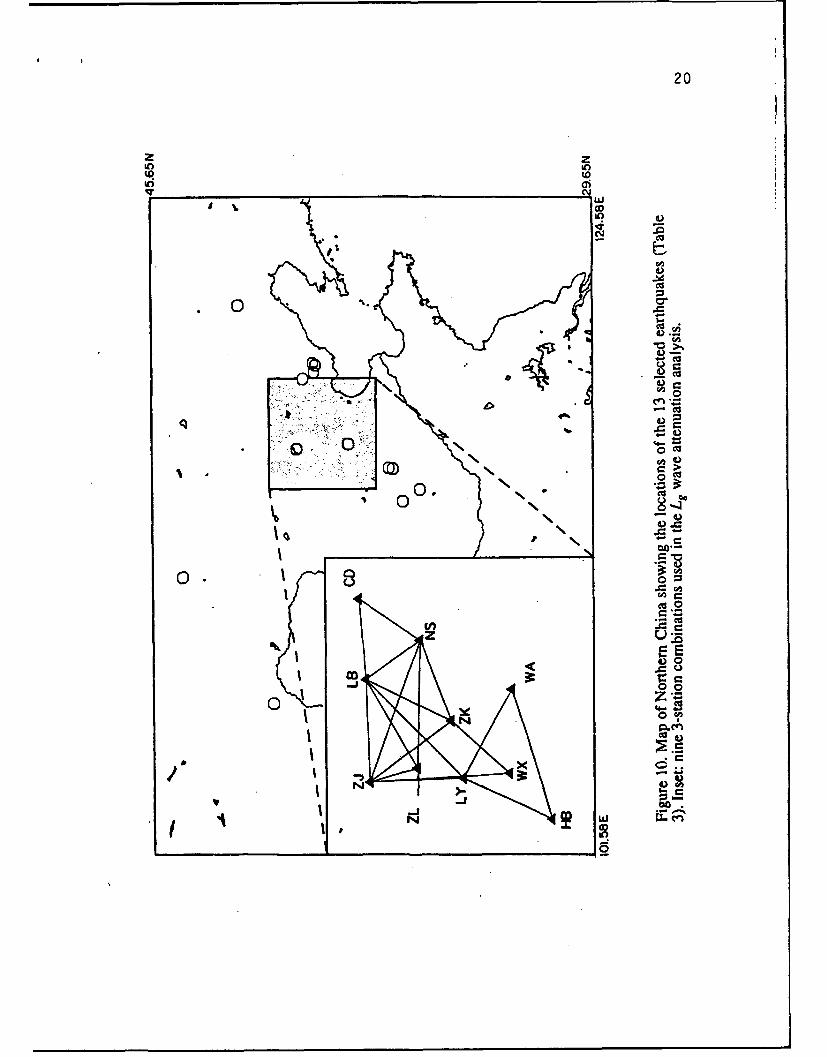
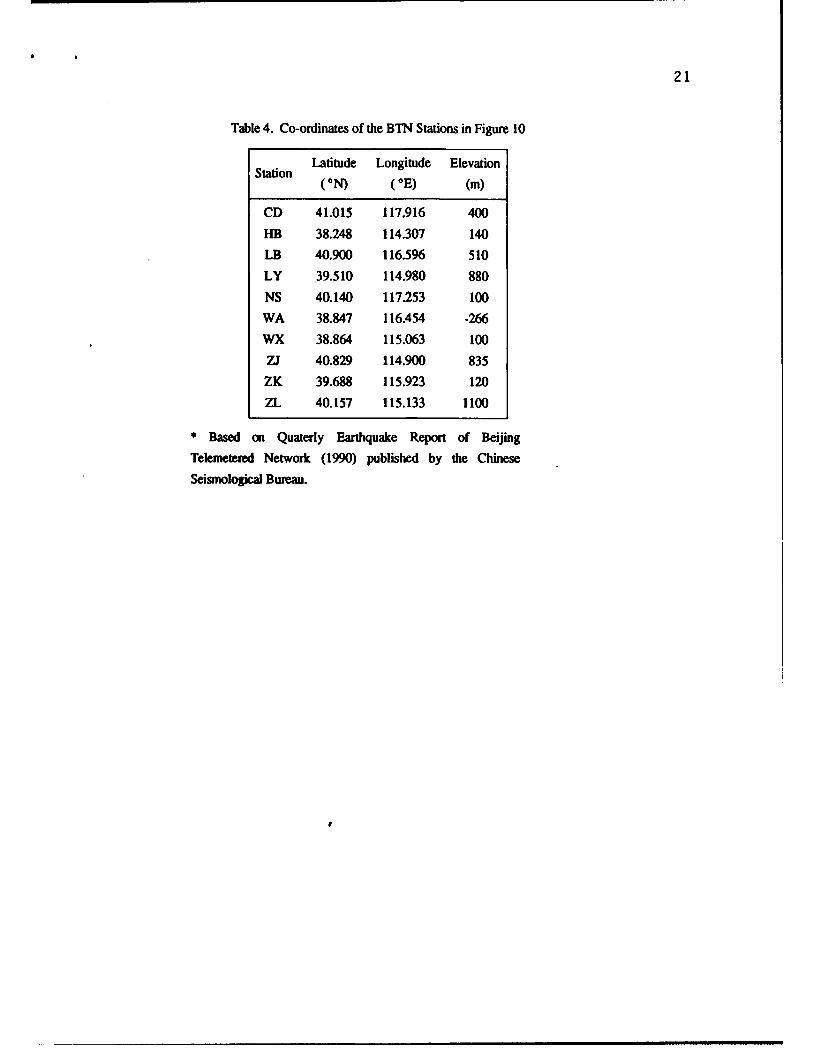
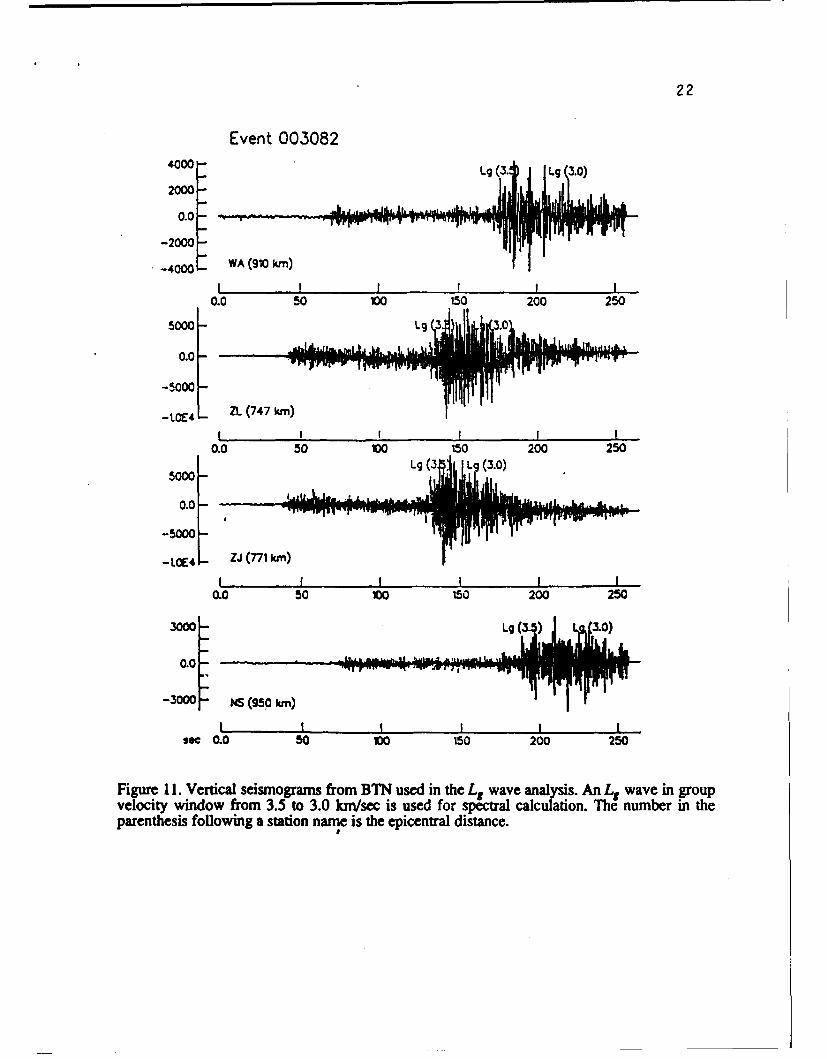
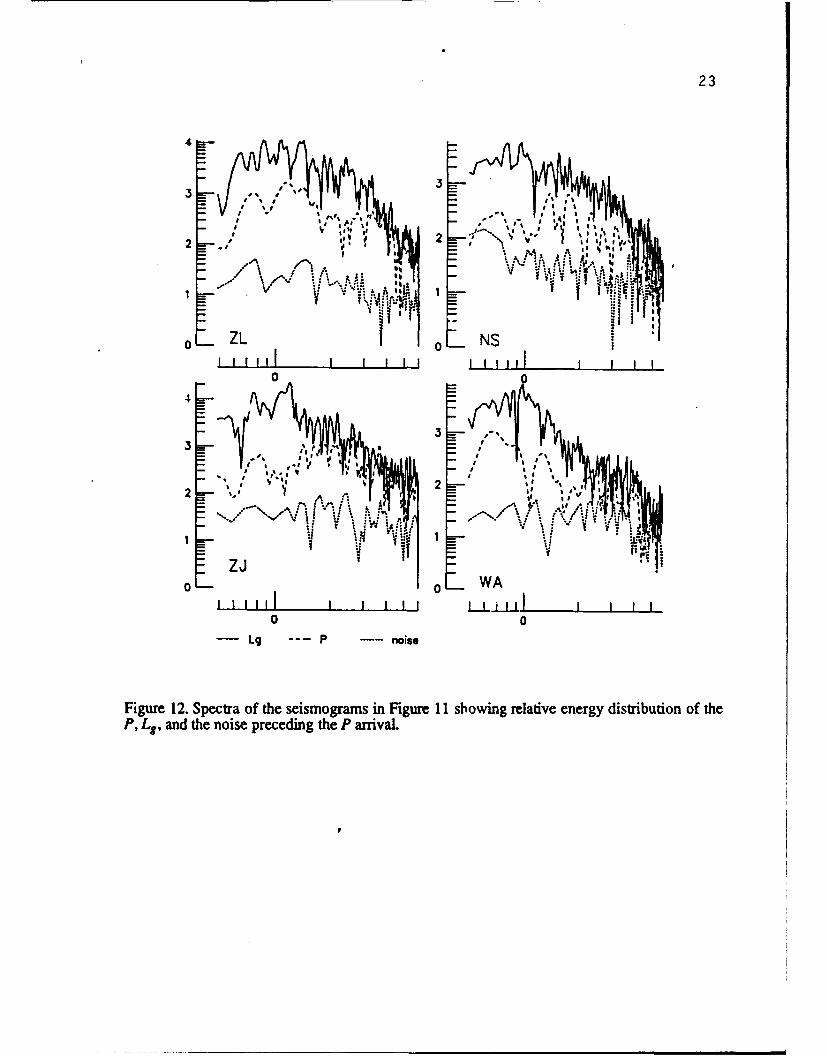
A total of 13 local and regional events (Table 3 and Figure 10) were used to test theextended RTSM method. All of them were of crustal depths. The 46 seismograms from ten ofthe BTN stations (Table 4) resulted in nine triangles (inset of Figure 10) and 42 possible com-binations. Data used in this preliminary analysis had been reprocessed in China prior to beingshipped to us. We found that they are of two different sampling rates, 12.5 points/s and 50points/s. We re-sampled the data at 25 points/s before any calculation, and the spectra are con-sidered meaningful up to 6 Hz. At epicentral distances ranging from 100 to 1000 kilometers, Lgwaves at most of the stations appear to be the most prominent phase, stronger than the first Parrivals (Figure 11). Power spectra (Figure 12) of these seismograms show that the energy ofthe Lg waves usually peaks around 1 Hz, more stable than respective P arrivals and has magni-tude several orders greater than the noise proceeding the P arrival.
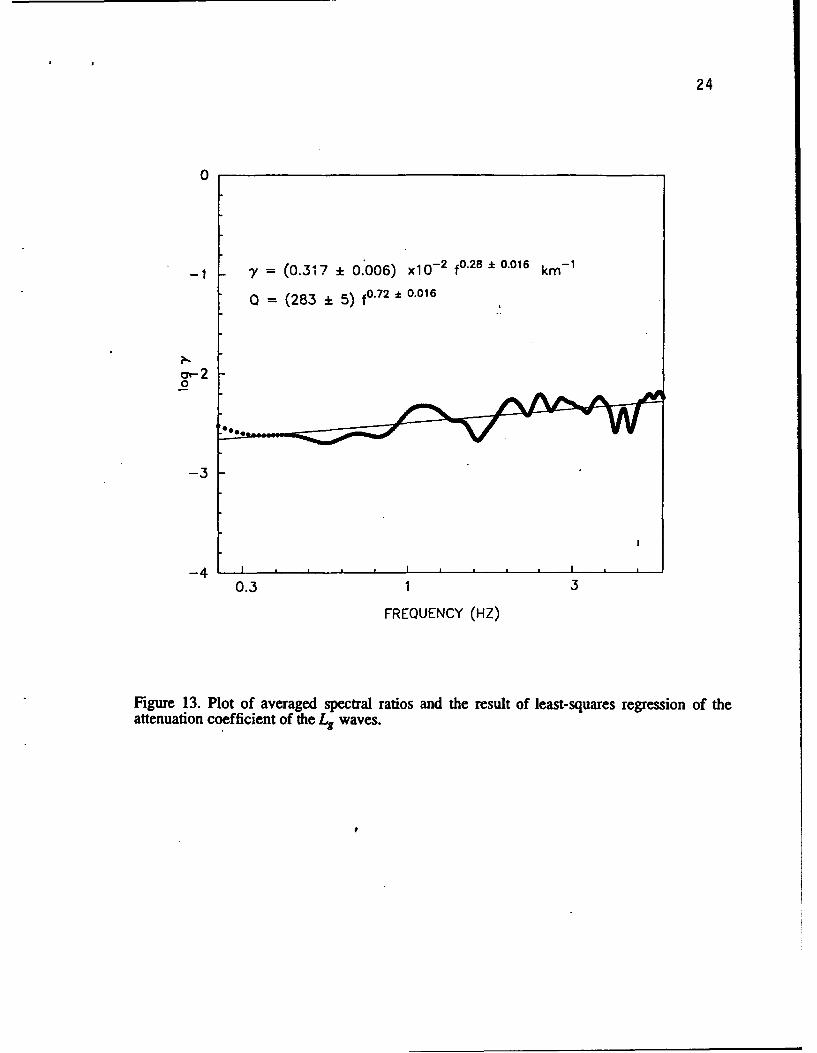
Spectra of the Lg waves were calculated in a group-velocity window from approximately3.0 to 3.5 km/s, i.e., the beginning of the window was sometimes shifted to include the firstmotion of an L. phase. After reduction, the spectra (y) of all combinations were stacked. Theleast-squares regression of the averaged spectra ratio in Figure 13 shows the frequency depen-dence of y. In frequency range of 0.3 - 6 Hz, the attenuation coefficient
y= (0.317±0.006)x10- 2f°.28: 0 °16 km-1. (9)
The above equation gives a y of 0.00350 kmI- at 1.43 Hz, comparable to the y (0.0034 mn-1)at the same frequency published in the map of Lg wave attenuation in continental China (Jiangand Ge, 1989). The latter also shows that y decreases westward (0.002 /on- 1 ) and northward(0.0027 kn- 1 ). The Q0 is thus 283, based on a group velocity of 3.5 km/s. The value is muchlower than Qo, e.g., 550 (Wu et al., 1987) and 403 (Chen and Nuttli, 1984), determined intime-domain. Compared to our general and regional studies in Eurasia, the low Q and its highfrequency dependency suggest that attenuation in the area under investigation is probably at thehigh end of the entire Eurasia except the active tectonic region in central Asia. However, theconsistency between the time and frequency domain results is to be investigated.
19
Table 3. Earthquakes Used in L9 Wave Attenuation Study under BTN
Event Date Origin Time Latitude Longitude Magýtude
No. (Hr:hfin:Sec) (ON) (OE) (mb)
812302 30 Dec 1988 18:34:29.4 37.60 115.05 2.6
905075 07 May 1989 20-57:20.9 40-27 115.72 4.1
907051 05 Jul 1989 20-.48:54.6 37.48 115.02 3.1
911052 05 Nov 1989 10.28:46.7 40.08 118.17 3.3
801012 01 Jan 1988 23:25:09.9 43-35 111.25 3.8
003132 15 Feb 1990 03:21:14.7 39.70 118.65 3.0
002272 27 Feb 1990 03:21:06.3 41.83 120.75 4.3
003082 08 Mar 1990 08:11-47.7 40.95 106.83 4.8
003121 12 Mar 1990 15:59:30.0 37.20 113.88 4.3
004153 15 Apr 1990 20-37:06.0 42.70 117.30 4.6
004202 20 Apr 1990 05:52:34.0 39.75 118.40 4.7
004211 21 Apr 1990 06:07:40.3 39.78 118.72 3.5
012151 15 Dec 1990 03:27:18.5 36.77 114.90 3.4
20
~~co
In oi
oz
Cu
b
0~
4-l
PI-
12
21
Table 4. Co-ordinates of the BTN Stations in Figure 10
Latitude Longitude ElevationStation(ON) (OE) (M)
CD 41.015 117.916 400
HB 38.248 114.307 140
LB 40.900 116.596 510
LY 39.510 114.980 880
NS 40.140 117.253 100
WA 38.847 116.454 -266
WX 38.864 115.063 100
ZJ 40.829 114.900 835
ZK 39.688 115.923 120
ZL 40.157 115.133 1100
* Based on Quaterly Earthquake Report of Beijing
Telemetered Network (1990) published by the Chinese
Seismological Bureau.
22
Event 0030824000- g(. L 302000-
0.0-A a lW
-2000
I I I I I54000 WA(1 M
0.0
I I I I I
0.0 50 100 150 200 250
50000.0' A,-r5000
-tE41 -zJ (747 kmn)
I I I !0.0 50 100 150 200 250
50-0.0-
-Looo - NS (771 k,',')
I T I!!!see 0.0 50 100 150 200 250
Figure 11I. Vertical seismograms from BTN used in the L . wave analysis. An L, wave in groupvelocity window from 3.5 to 3.0 km/sec is used for signtal calculation. Thi number in theparenthesis following a station name is the epicentral distance.
23
4
22
0 Z L 0 N S
4
-WI
Lg P nis
Figue 1. Secta o th sesmogamsin igue II sowig rlatie eerg ditriutin o th
P, ~ L., an---nieprcdngteP arr nival
24
0
y = (0.317 + 0.*006) x10- 2 f0.28, 0.01 6 km-1
0 = (283 + 5) fo.7 2 + 0.016
u--20
-3
0.3 1 3
FREQUENCY (HZ)
Figure 13. Plot of averaged spectral ratios and the result of least-squares regression of theattenuation coefficient of the L. waves.
25
IV. DISCUSSION AND CONCLUSIONS
4.1 Summary of the Research Program
The research described here represents the first-year effort of our two-year projectdesigned to develop methodology for site and source corrected attenuation measurement and tostudy the frequency-dependent attenuation in Eurasia. Our research has been focused onmethodology extended from the RTSM, and their application has brought a general evaluationof the frequency dependent attenuation in Eurasia.
The key difference between the two new methods, i.e., the SPRP method and the extendedRTSM, and the RTSM is that the results from the new methods represent the attenuation of anarea enclosed by the stations/events involved in a combination instead of the inter-station(event) path. The SPRP method is characterized by a greater flexibility than the RTSM. Itallows attenuation measurements to be made using sparse recordings from a seismic networkwith only a brief recording history. Results from our study of IRIS/CDSN data indicate thatisolating the path effect by taking time-domain amplitude ratios following a much relaxedgeometry is justified. The extended RTSM method has shown another possibility of studyingregional wave attenuation for cases in which the reversal of the station-event pairing along thegreat-circle path is impossible. The method is designed for attenuation study of the waves thatare affected by the source characteristics. By simultaneous cancellation of the site and sourceeffect, application of either method leads to frequency-dependent attenuation measurements.Further, we have employed configurations of stations straddling the sources in performing theSPRP method and the sources straddling the stations in performing the extended RTSM. Withslight algebraic difference, either arrangement serves the purpose of canceling the site andsource effects.
We have conducted generalized time-domain analysis of Lg wave attenuation in Eurasia.After a preliminary analysis of a 10-event data set, results from a 22-event data set are con-sistent with the preliminary study, and have shown that L. wave attenuation at low frequencies(0.1-1.0 Hz) exhibits greater stability and consistency than its higher-frequency counterpart.Frequency-dependent attenuation measurements (y, Q0, and f") are intermediate to the valuesin the different areas in Eurasia suggested by previous studies. Preliminary time-domain ana-lyses in the two subregions of Eurasia have shown that while its frequency dependence varieswithin the error bounds of the average value determined for the entire Eurasia, the L, waveattenuation as quantified by the quality factor (Q) may vary considerably across Eurasia. Thevariation seems to be directly related to the current tectonic activity and various geologicalcomponents traversed by long ray paths.
4.2 Research Plan for the Second Year
In the second year of the project, our research will focus on developing methodology toregionalize the site and source corrected attenuation measurements for a sparsely-locatedseismic network such as the IRIS/CDSN stations. Scientifically, we will concentrate on twotopics: (1) determination of frequency-dependent attenuation parameters in the subregions of
26
Eurasia, and (2) investigation of the consistency between the attenuation parameters resultedfrom time- and frequency-domain analyses.
In our proposed scheme for regionalizing L. wave attenuation, we divide the study regioninto rectangular grids, and the y, of each rectangle is to be determined in a 2-D least-squaresinversion. The input for the inversion is the site/source corrected attenuation measurements bythe RTSM and/or SPRP methods, except that the reduction now involves segmented distancesalong a single ray path because of the grids. With fixed geometrical spreading parameter, the yswill be solved through the least-squares inversion with large number of ray paths. Since theinput of the inversion is obtained in a way independent of any source and site effects, weexpect that the inversion will lead to the first stable pure-path determination of the attenuationin individual areas of Eurasia, including detailed information of attenuation under BTN.
.We plan to investigate the large discrepancy of Q values between the time- and frequencydomain analyses under BTN, and the consistency between the attenuation analyses in time andfrequency domains at large, by examining the variation of the attenuation parameters (Y, Q andf") when the same site/source correcting procedures are applied to the analyses in differentdomains. Analyses using IRIS/CDSN data may result in evaluations directly applicable to theattenuation study in Eurasia. However, the dense station distribution and relatively abundantseismic events in the area covered by BTN will provide opportunities for a comparisonbetween the the time- and frequency-domain analyses in local and regional distance ranges.Results from these distance ranges are essential in obtaining accurate measurements in nuclearverification problems.
Achnowledgements
We thank the staff at the Center for Seismic Studies for providing us with valuable techni-cal assistance and for meeting our constant data requests.
References
Bennett, T. J., J. F. Scheimer, A. K. Campanella, and J. R. Murphy (1990). Regionaldiscrimination research and methodology implementation : Analyses of CDSN andSoviet IRIS data, S-Cubed Report SSS-TR-90-11757, Technical Report on Contract No.f 19628-89-C-0043.
Chavez, D. E., and K. F. Priestley (1987). Apparent Q of P. and L. in the Great Basin,paper presented at the 9th Annual DARPA/AFGL Seismic Research Symposium, June1987.
Chen, P. S. and 0. W. Nuttli (1984). Estimates of magnitudes and short-period waveattenuation of Chinese earthquakes from modified Mercalli Intensity data, Bull. Seism.Soc. Am., 74,957-968.
Chun, K.-Y., G. F. West, R. J. Kokoski, and C. Samson (1987). A novel technique for meas-ure Lg attenuation - results from Eastern Canada between 1 to 10 Hz, Bull. Seism. Soc.Am., 77, 398-419.
27
Chun, K.-Y., and T. Zhu (1992). Regional wave attenuation in Eurasia, Semi-Annual Tech.Rep..
Chun, K.-Y., T. Zhu and X. R. Shih (1992). Regional wave attenuation in Eurasia, paperpresented at the 14th Annual PL/DARPA Seismic Research Symposium, September1992.
Ewing, M., W. Jardetzky, and F. Press (1957). Elastic Waves in Layered Media. New York:McGraw-Hill.
Given, H. K., N. T. Tarasov, V. Zhuravlev, F. L. Vernon, J. Berger, and I. L. Nersesov(1990). High-frequency seismic observations in eastern Kazakhstan, USSR, with
emphasis on chemical explosion experiments, J. Geop,.;v. Res., 95, 295-307.Jiang, Y., and H. Ge (1989). Relationships between Lg attenuation and geotectonic charac-
ters in China, Geophysics in China in the Eighties, 317-324.
Nuttli, 0. W. (1973). Seismic wave attenuation and magnitude relations for eastern NorthAmerica, J. Geophys. Res., 78, 876-885.
Nuttli, 0. W. (1986). Lg magnitudes of selected East Kazakhstan underground explosion,Bull. Seism. Soc. Am., 76, 1241-125 1.
Nuttli, 0. W. (1988). Lg magnitudes and yield estimates of Novaya Zemlya nuclear expolo-sions, Bull. Seism. Soc. Am., 78, 873-884.
Pan, Y., B. J. Mitchell, and J. Xie (1992). Lg coda Q across Northern Eurasia, paperpresented at the 14th Annual PL/DARPA Seismic Research Symposium, September1992.
Sereno, T. J. (1990). Frequency-dependent attenuation in eastern Kazakhstan and implica-
tions for seismic detection thresholds in the Soviet Union, Bull. Seism. Soc. Am., 80,2089-2105.
Wu, F., P. Wang, and Y. Chen (1987). Qp and Qs in Beijing and Jianchuan of Yunanregions, ACTA Seismologica Sinica, 9.. 337-346.
Zhu, T., K.-Y. Chun, and F. W. Gordon (1991). Geometrical spreading and Q of Pn waves:An investigative study in eastern Canada, Bull. Seism. Soc. Am., 81, 882-896.