Embed Size (px)
Citation preview
Determination of Shallow Shear-Wave Attenuation in the Mississippi
Embayment Using Vertical Seismic Profiling Data
by Jiandang Ge,* Jose Pujol, Shahram Pezeshk, and Scott Stovall
Abstract We used vertical seismic profiling (VSP) data collected in four shallowboreholes (about 40 to 60 m deep) to study the shear-wave attenuation in theMississippi embayment in southwestern Tennessee. The source was an air-poweredhammer that produces repeatable SH waves that were recorded by monitor geophonesdeployed on the surface very close to the source. The spectral ratio method was used toestimate the shear-wave quality factor (QS). The method assumes that the amplitudesof the seismic waves decay exponentially in the frequency domain. The spectral ratiowas computed using a VSP trace at a certain depth and the corresponding monitortrace. Using the source monitor trace as reference eliminates possible artifacts thatmay be introduced by changes in the source-ground coupling. The slope of aleast-square line fitted to the logarithm of the spectral ratio versus frequency givesthe attenuation coefficient α�z� for that depth. Then a straight line is fitted to α�z�as a function of z, and the slope of this line is used to estimate an average valueof QS. For the four sites, Shelby Farms, Covington, Brownsville, and Jackson, theQS values are 25:3� 2:6, 18:6� 3:4, 18:4� 7:6, and 16:4� 2:6, respectively. Toassess the reliability of these results, synthetic VSP data were generated from the firstcycles of the monitor traces recorded in the four sites and these QS values. Except forBrownsville, good matches with correlation coefficients equal to 96%–99% were ob-tained between the synthetic VSPs and the actual VSPs, indicating that the QS valueswe obtained are reliable. In addition, these values are also consistent with recent re-sults obtained by others using seismic data generated by small earthquakes recordedby the Japanese strong-motion network Kiban-Kyoshin (KiK-net).
Introduction
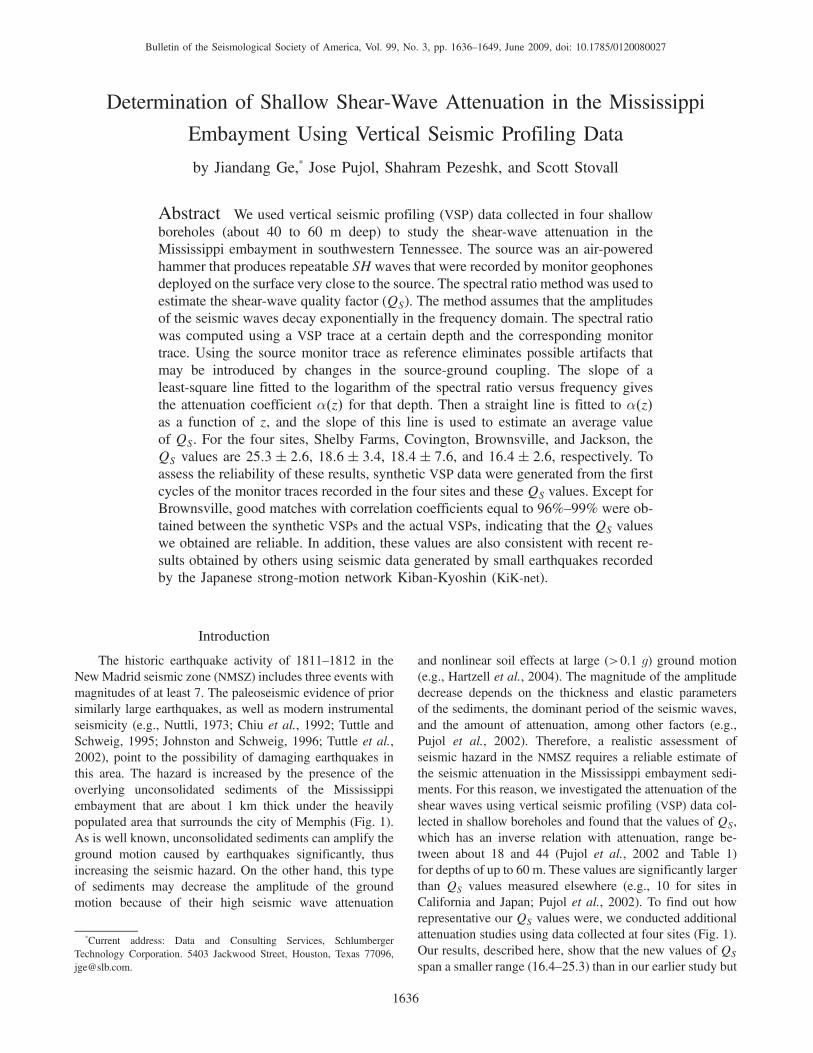
The historic earthquake activity of 1811–1812 in theNewMadrid seismic zone (NMSZ) includes three events withmagnitudes of at least 7. The paleoseismic evidence of priorsimilarly large earthquakes, as well as modern instrumentalseismicity (e.g., Nuttli, 1973; Chiu et al., 1992; Tuttle andSchweig, 1995; Johnston and Schweig, 1996; Tuttle et al.,2002), point to the possibility of damaging earthquakes inthis area. The hazard is increased by the presence of theoverlying unconsolidated sediments of the Mississippiembayment that are about 1 km thick under the heavilypopulated area that surrounds the city of Memphis (Fig. 1).As is well known, unconsolidated sediments can amplify theground motion caused by earthquakes significantly, thusincreasing the seismic hazard. On the other hand, this typeof sediments may decrease the amplitude of the groundmotion because of their high seismic wave attenuation
and nonlinear soil effects at large (>0:1 g) ground motion(e.g., Hartzell et al., 2004). The magnitude of the amplitudedecrease depends on the thickness and elastic parametersof the sediments, the dominant period of the seismic waves,and the amount of attenuation, among other factors (e.g.,Pujol et al., 2002). Therefore, a realistic assessment ofseismic hazard in the NMSZ requires a reliable estimate ofthe seismic attenuation in the Mississippi embayment sedi-ments. For this reason, we investigated the attenuation of theshear waves using vertical seismic profiling (VSP) data col-lected in shallow boreholes and found that the values of QS,which has an inverse relation with attenuation, range be-tween about 18 and 44 (Pujol et al., 2002 and Table 1)for depths of up to 60 m. These values are significantly largerthan QS values measured elsewhere (e.g., 10 for sites inCalifornia and Japan; Pujol et al., 2002). To find out howrepresentative our QS values were, we conducted additionalattenuation studies using data collected at four sites (Fig. 1).Our results, described here, show that the new values of QS
span a smaller range (16.4–25.3) than in our earlier study but
*Current address: Data and Consulting Services, SchlumbergerTechnology Corporation. 5403 Jackwood Street, Houston, Texas 77096,[email protected].
1636
Bulletin of the Seismological Society of America, Vol. 99, No. 3, pp. 1636–1649, June 2009, doi: 10.1785/0120080027
are still consistent with it. In addition, these values are alsoconsistent with those obtained by Assimaki et al. (2008)using seismic data generated by small earthquakes recordedby the Japanese strong-motion network Kiban-Kyoshin(KiK-net; see the Discussion section).
The attenuation within the full sedimentary column ofthe Mississippi embayment was studied by several research-ers. For example, Chen et al. (1994) determined QP �QS
relations based on the use of direct S waves and S to P con-verted waves generated at the base of the unconsolidatedsediments. From these relations it was estimated that QP
andQS range between 25 and 60 and 25 and 30, respectively.The analysis technique used by Chen et al. (1994) was in-troduced by Clouser and Langston (1991). Langston (2003)applied it to synthetic data generated for elastic parametersappropriate for the NMSZ and values of QP and QS equal toinfinity, which implies that the medium is not attenuating.His results showed that the technique produces spuriouslow QS values (QS equal to 42 for QP equal to infinity)
caused by the presence of near-surface site resonanceand reverberations within the unconsolidated sediments. Inaddition, Langston et al. (2005) analyzed Rayleigh wavesand body waves generated by explosions detonated in theMississippi embayment. The frequency ranges for theRayleigh and body waves were 0.4–4.0 Hz and 3–10 Hz,respectively, and by comparison of actual and synthetic datait was concluded that the average values ofQS andQP for thesediments are equal to 100 and 200, respectively.
The different QP and QS values determined by differentauthors point to the difficulties involved in the determinationof reliable values of attenuation. The reason is that attenua-tion is usually determined from the changes in amplitude andfrequency content that affect the seismic waves as they pro-pagate through an attenuating medium, but because thesetwo parameters are also affected by factors such as scatteringby heterogeneities and fine layering, and the presence ofcracks and fluids (e.g., Pujol and Smithson, 1991 and refer-ences therein), the values generally reported in the literaturecorrespond to an effective attenuation rather than to the in-trinsic attenuation of interest. The use of borehole data doesnot eliminate these problems but has the advantage that atleast in some cases, it is possible to assess the contributionof some of the nonintrinsic factors to the effective attenuation(e.g., Pujol and Smithson, 1991) although this requires thedetailed velocity profiles provided by sonic logs. These logsare not available for the boreholes used in this study, whichmeans that the values reported here correspond to the effec-tive attenuation of the sediments. These values were deter-mined using a method based on the computation of spectralratios, and to assess the reliability of our results we comparedthe actual VSP data with synthetic data generated using soft-ware that includes attenuation. From this comparison it ap-pears that our values of QS are reliable.
Method to Determine Q
We use the spectral ratio method described in Pujol et al.(2002). For completeness we summarize the main steps here.For data recorded in a borehole with the source close to it, theamplitude Az�f� of a wavelet at a depth z can be written as
Figure 1. Map of the upper Mississippi embayment. Thecontour lines indicate the thickness of the unconsolidated sedi-ments. Solid squares and stars show the locations of VSP datacollection (squares: this study; stars: Pujol et al., 2002). Crossesindicate the epicenters of microearthquakes within the New Madridseismic zone.
Table 1QS Values in the Mississippi Embayment Computed Using VSP Data
Locations
Site Frequency (Hz) Depth (m) QS Latitude (degrees) Longitude (degrees)
Marked tree * 15–60 9.8–33.6 18� 4 35.55 �90:39Shelby Forest * 20–60 22.6–60.1 22� 2 35.36 �90:02Newport * 10–50 1.5–51.8 44� 11 35.59 �91:09Shelby Farms † 10–50 0–39 25:3� 2:6 35.12 �89:84Covington † 10–50 0–60 18:6� 3:4 35.40 �89:63Jackson † 20–50 0–60 16:4� 2:6 35.64 �89:92Brownsville † 20–40 0–60 18:4� 7:6 35.54 �89:26*From Pujol, et al. (2002).†This study. The site locations are shown in Figure 1.
Shallow Shear-Wave Attenuation in the Mississippi Embayment Using Vertical Seismic Profiling Data 1637
Az�f� � �G0=Gz�e�αfA0�f�; (1)
where f indicates frequency, A0�f� is the amplitude of areference wavelet at depth z0, G0 and Gz are frequency-independent geometric spreading factors for depths z0 andz, respectively, and α is the attenuation coefficient. Assum-ing that the medium is homogeneous, we have
α � πδz=Qv; (2a)
δz � z � z0; (2b)
where v is the velocity of wave propagation. We furtherassume that α is independent of frequency. Then fixing z,
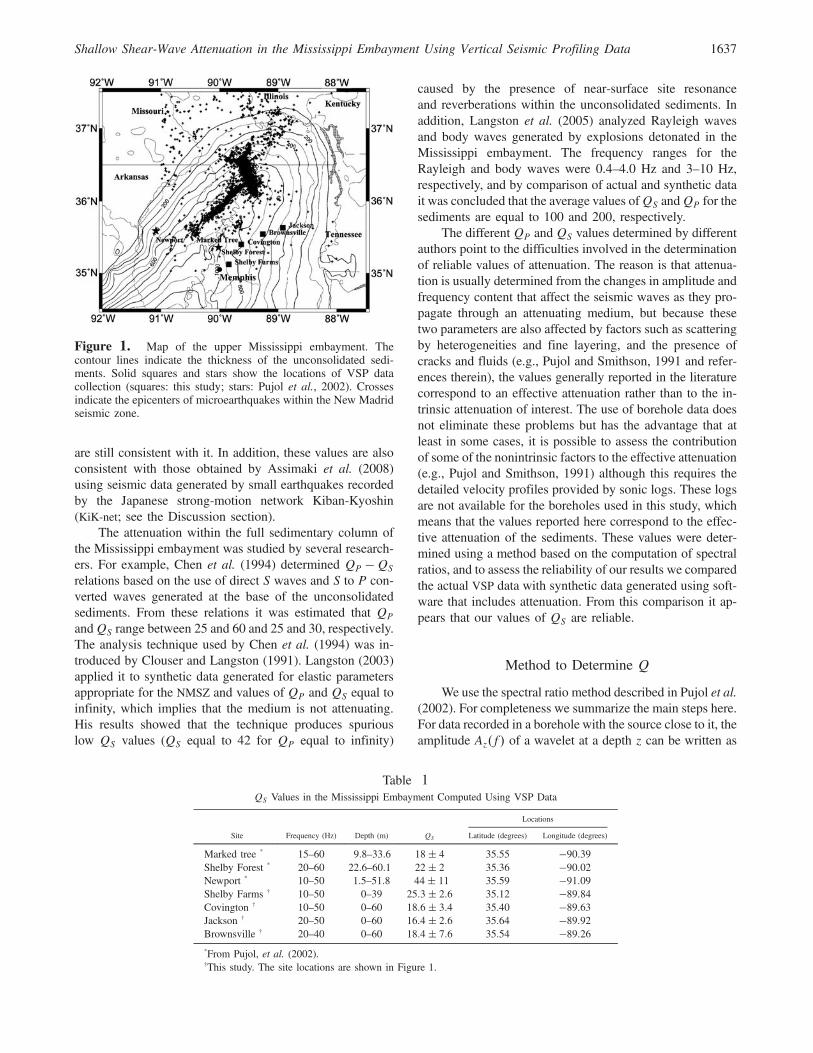
Figure 2. Left: VSP traces recorded in Shelby Farms, Tennessee. The borehole (solid lines) and corresponding monitor traces (dashedlines) are shown. Right: First cycles of the traces on the left used for the attenuation analysis.
Figure 3. Left: Normalized spectra for the Shelby Farms data obtained from analysis of the first cycles shown in Figure 2. The continuousand dashed lines correspond to the VSP andmonitor traces, respectively. Right: Spectral ratios obtained using the VSP andmonitor traces. Thebest-fit least-squares lines in the 10 to 50 Hz range are also shown (bold lines). The slope of each line gives α for the corresponding depth.
1638 J. Ge, J. Pujol, S. Pezeshk, and S. Stovall
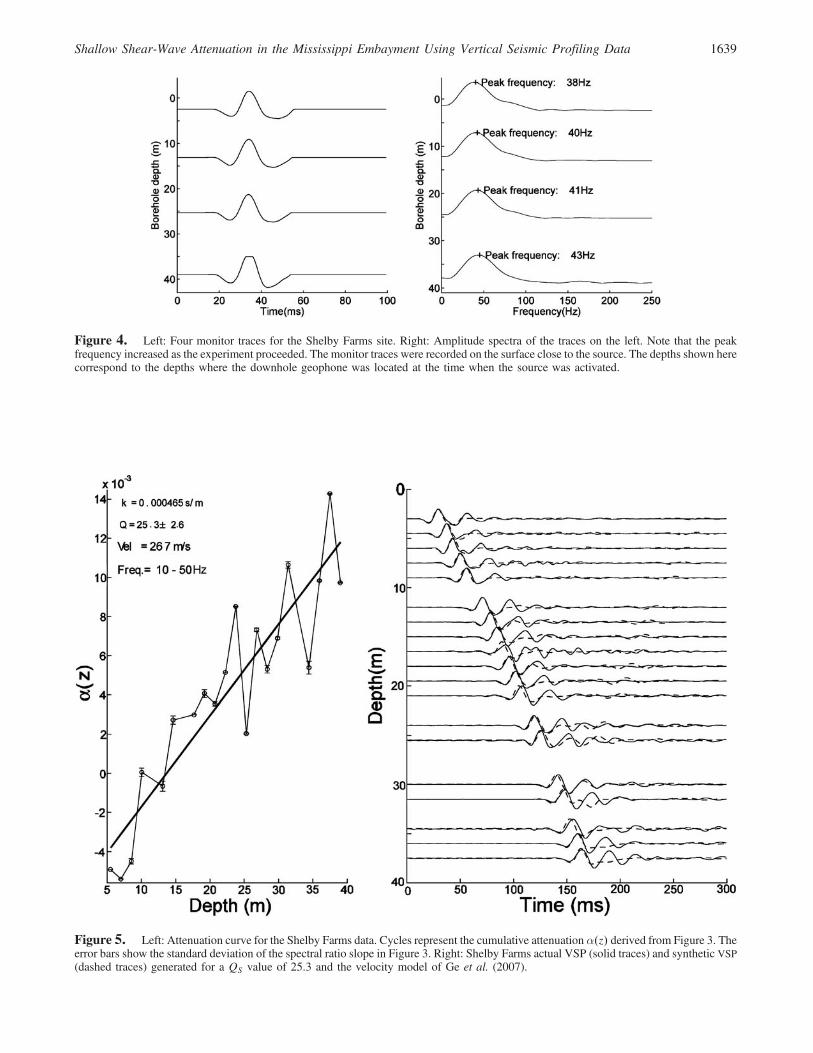
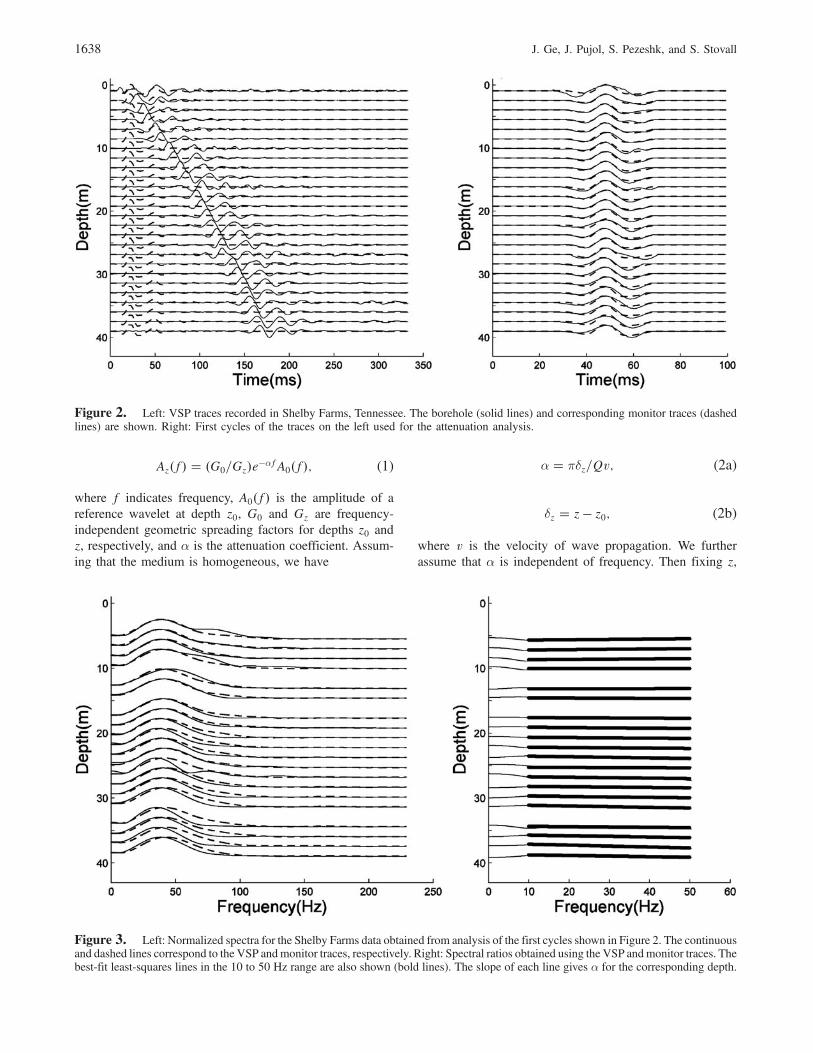
Figure 4. Left: Four monitor traces for the Shelby Farms site. Right: Amplitude spectra of the traces on the left. Note that the peakfrequency increased as the experiment proceeded. The monitor traces were recorded on the surface close to the source. The depths shown herecorrespond to the depths where the downhole geophone was located at the time when the source was activated.
Figure 5. Left: Attenuation curve for the Shelby Farms data. Cycles represent the cumulative attenuation α�z� derived from Figure 3. Theerror bars show the standard deviation of the spectral ratio slope in Figure 3. Right: Shelby Farms actual VSP (solid traces) and synthetic VSP(dashed traces) generated for a QS value of 25.3 and the velocity model of Ge et al. (2007).
Shallow Shear-Wave Attenuation in the Mississippi Embayment Using Vertical Seismic Profiling Data 1639
dividing equation (1) by A0�f�, and taking logarithms onboth sides gives
ln�Az�f�=A0�f�� � �α�z�f� ln�G0=Gz�; (3)
which is the equation of a straight line in f. In this formula-tion α is a function of z, known as the cumulative attenuationand is determined by fitting a least-squares line to the obser-vations. After computing α�z� for all the depths for whichdata are available, we fit a straight line to α�z� for the cor-responding range of values of z. Letting k indicate the slopeof the best-fit line and using equation (2a) gives k � π=Qv.Therefore,
Q � π=vk (4)
and
α�z� � kδz: (5)
The Q value computed using equation (4) is an average overthe range of interest under the assumption that it is frequencyindependent. The standard deviation of Q is estimated using
σQ �����dQ
dk
����σk �Q
kσk; (6)
where
σ2k �
σ2
PNi�1�zi � �z�2 : (7)
N is the number of values α�zi�, �z is the average of the depthszi, and σ is estimated from
σ2 � 1
N � 2
XN
i�1
�α�zi� � kzi � b�2; (8)
where b is the intercept of best-fit line (Pujol et al., 2002).This method has the advantage of not requiring correctionsfor amplitude changes produced by geometric spreading be-cause it appears in the intercept of the straight line, not in theslope. It has the disadvantage, however, that it assumes that α(and therefore Q) is independent of frequency. When thisassumption is not valid, other methods must be used (e.g.,Pujol and Smithson, 1991).
The first step in applying the procedure just described isto have the data time shifted to align the first arrivals and thentruncated to isolate the portion of the data to be analyzed.The second step requires the selection of a truncation win-dow that usually is tapered at the ends. However, these
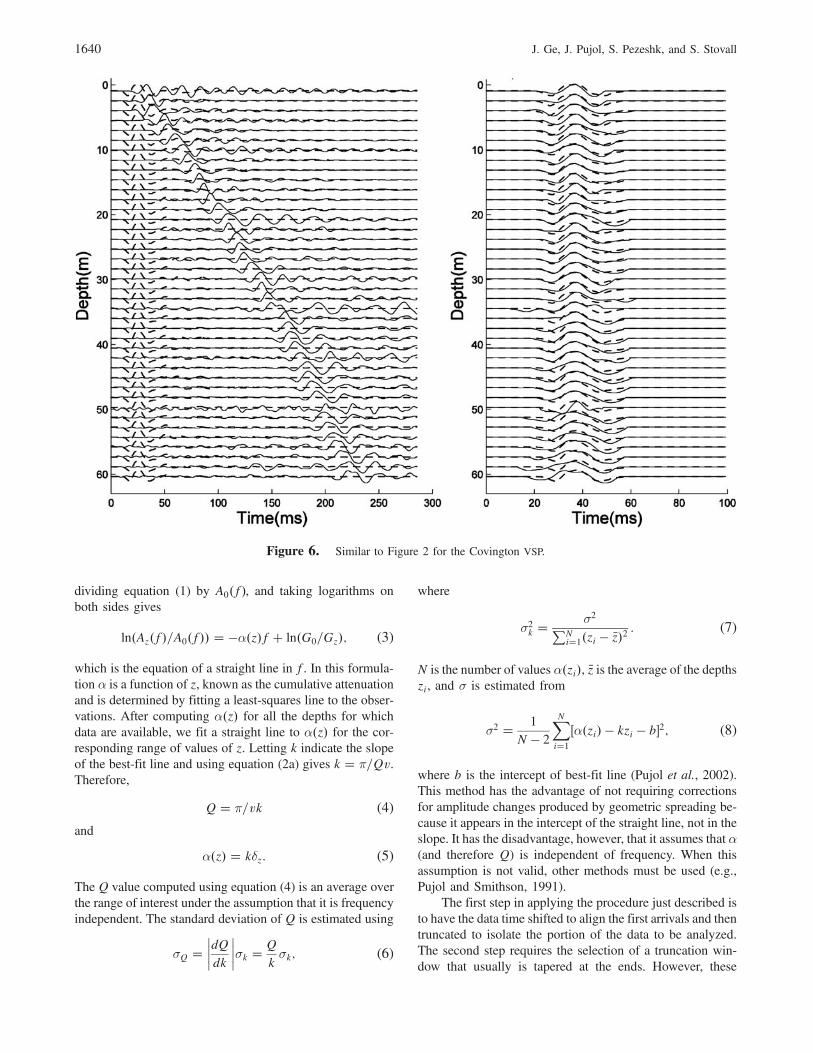
Figure 6. Similar to Figure 2 for the Covington VSP.
1640 J. Ge, J. Pujol, S. Pezeshk, and S. Stovall
nonrectangular windows may bias the results (Pujol andSmithson, 1991). In fact, the analysis of synthetic VSP datagenerated with the software referred to in the following sec-tion shows that the computed values ofQmay be affected bysignificant errors (Wilson, 1990; Pujol and Smithson, 1991;Ge, 2005). Rectangular windows, on the other hand, mayintroduce errors due to spectral leakage (Pujol and Smithson,1991), but this problem can be avoided by choosing the trun-cation points where the wave amplitudes are zero or close toit (Pujol et al., 2002). For this reason, here we use a rectan-gular window.
Comparison with Synthetic Data
As noted in the Introduction, the values of QS for thesediments of the Mississippi embayment determined usingdifferent techniques are significantly different, and for thisreason we decided to assess the reliability of the QS valuesdetermined with the spectral ratio method by comparing theactual VSP data with synthetic VSP generated for an anelasticmedium. The software used was written by Wu (1983). Thecorresponding algorithm is based on a matrix theory ap-proach and an earth model made of horizontal homogeneouslayers, assumes vertical incidence, and includes attenuation
and dispersion (the latter is optional). The output of the soft-ware is the impulse response in the frequency domain that isthen converted to the time domain and convolved with asource wavelet to obtain the synthetic VSP traces. A briefdescription of the software and relevant references are pro-vided by Ge et al. (2007).
The synthetic VSP software was already used with theVSP data described here to improve the interval velocitiesdetermined using arrival times (Ge et al., 2007). Arrival timepicks are almost invariably affected by some amount of errorthat in some cases may be large enough to introduce spuriouslarge velocity variations. To investigate whether the intervalvelocities we computed were affected by this problem wematched synthetic VSP data to the actual data. This was doneby changing the velocities iteratively. The interval velocitiesobtained from first arrival picks were used as initial model,and the final model was the one that produced the syntheticdata that best matched the actual data. Because the actualgeometric spreading is not exactly known and because thedata are affected by some noise, we only matched the waveshapes in the vicinity of the first arrivals, not absolute am-plitudes. Attenuation was introduced by using the QS valuesobtained in this research, and as source wavelets we used thefirst cycles of monitor traces recorded by a surface geophone
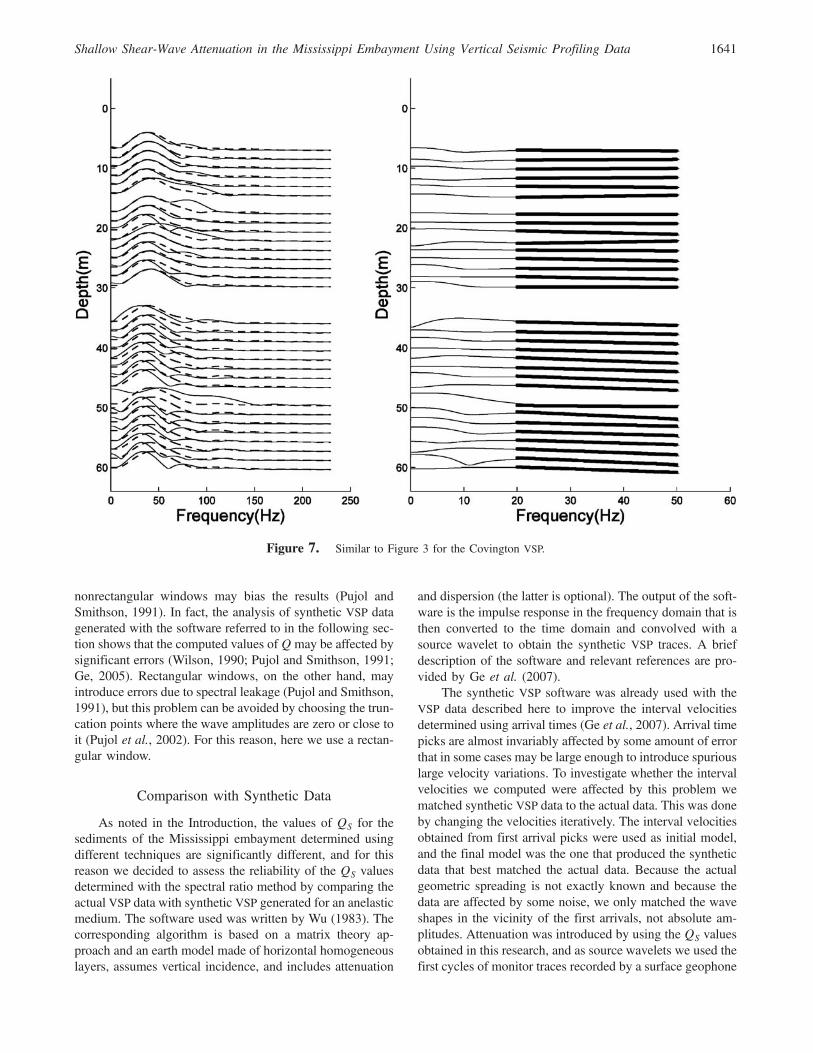
Figure 7. Similar to Figure 3 for the Covington VSP.
Shallow Shear-Wave Attenuation in the Mississippi Embayment Using Vertical Seismic Profiling Data 1641
placed close to the source. To quantify the waveform matchwe used the discrete form of the correlation coefficient ofZoltan et al. (1991).
ρ �P
Nn�1 d�n� · s�n�����������������������������������������������������P
Nn�1 d
2�n� ·PNn�1 s
2�n�p ; (9)
where ρ is the correlation coefficient; d�n� is the nth sampleof the actual data; and s�n� is the nth sample of the syntheticdata. Both the actual data and the synthetic data were normal-ized to unity. We match the first half cycle of the data andcompute ρ for each windowed trace. The correlation coeffi-cients for the Shelby Farms, Covington, and Jackson sites arein the range of 0.96 to 0.99. The velocities computed usingthis waveform-matching approach may be affected by errorsof �10–15%. For the Brownsville site the data are affectedby significant noise and the correlation coefficients arearound 0.7 or less. For this site we matched the data pointsclosest to the first arrivals. The velocities obtained for thissite may be affected by errors of �20–30%. As a result ofthe waveform matching the velocity, models are significantlysmoother than the corresponding initial models, which is anindication that the arrival time picks were, in fact, affected byconsiderable errors.
As noted in the following section the synthetic VSPs inthe vicinity of the first arrivals are somewhat insensitive tomoderate variations in the values of QS. For example, thecorrelation coefficients for one of the traces from the ShelbyFarms site are equal to 0.99 for QS equal to 25.3 (the com-puted value for this site) and 35.4 (40% larger than the com-puted value). However, another important feature that can beused in the comparison between actual and synthetic data isthe amplitude of the reflected waves. The juxtaposition oflayers with significantly different interval velocities gener-ates reflections with amplitudes that depend on both the ve-locity contrasts and attenuation. For the VSPs discussed here,the synthetic data computed using the best-fit velocities andvalues ofQS about 40% larger than those computed using thespectral ratio method produce reflections clearly larger thanthose observed in the actual data. However, when using thecomputed QS values, the amplitudes of the reflections be-come smaller and consistent with the observations (seeDiscussion section).
Data and Results
We determined the shear-wave attenuation using VSPdata collected in four sites in southwestern Tennessee,whose locations are shown in Figure 1. The source was
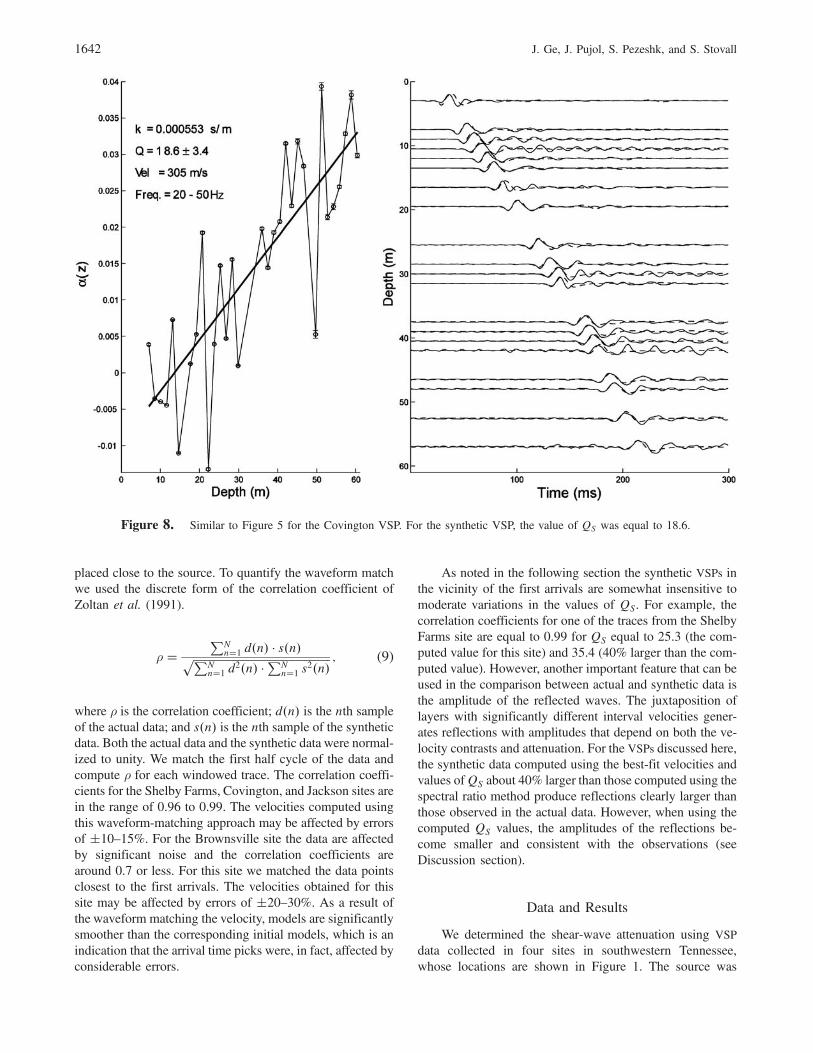
Figure 8. Similar to Figure 5 for the Covington VSP. For the synthetic VSP, the value of QS was equal to 18.6.
1642 J. Ge, J. Pujol, S. Pezeshk, and S. Stovall
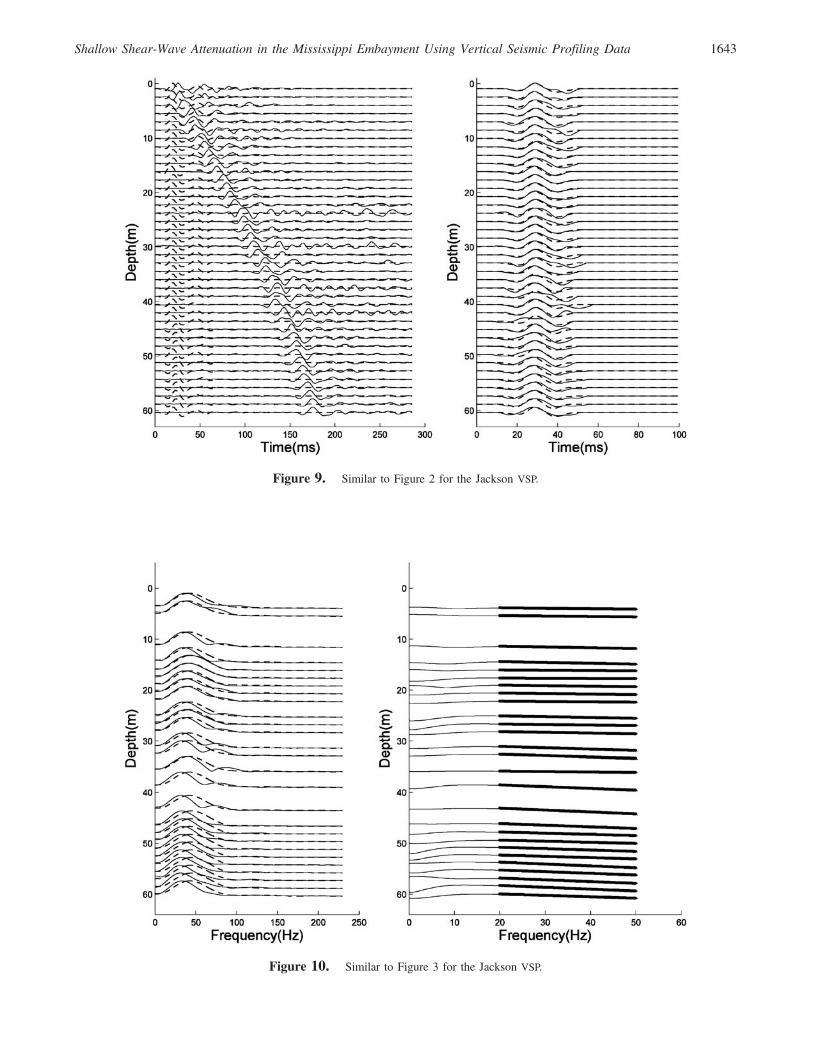
Figure 9. Similar to Figure 2 for the Jackson VSP.
Figure 10. Similar to Figure 3 for the Jackson VSP.
Shallow Shear-Wave Attenuation in the Mississippi Embayment Using Vertical Seismic Profiling Data 1643
an air-powered hammer that produces repeatable SH waves(Liu et al., 1996). As noted earlier, the waves generated bythe source were recorded by a monitor geophone placed onthe surface close to the source. The receivers are all velocitysensors with natural frequency of 10 Hz. Additional acquisi-tion information is provided by Ge et al. (2007).
One of the sites is within the Shelby Farms, a park ap-proximately 20 km east of Memphis. Figure 2 shows the ori-ginal VSP and monitor traces as well as the aligned andwindowed traces. The spectra of the latter and their corre-sponding ratios are shown in Figure 3. Because some ofthe traces were affected by significant noise, they werenot used in the analysis. Note that the spectra of the deeperwavelets have lost some of the higher frequency componentsseen in the spectra of the shallower wavelets as expectedfrom equation (1) when attenuation is significant (Pujol andSmithson, 1991; Pujol et al., 2002). Also note that for themonitor traces the amplitudes of the higher frequencies in-crease with depth, which is possibly the result of an increasein the source-ground coupling as the experiment proceeded.This can be seen more clearly in Figure 4, which shows fourmonitor traces in the time and frequency domains. The fourtraces correspond to borehole geophone depths of 2.4, 13.1,25.3, and 39.0 m (the last trace) and have peak frequenciesof 38, 40, 41, and 43 Hz, respectively. Therefore, a larger
amount of high frequencies was injected into the earth forthe deeper traces that would translate into a higher valueof QS if the monitor traces were not available (or used).For example, a value of 34 became 44 when the monitortraces were not used (Pujol et al., 2002). In this case the spec-trum of a shallow wavelet was used as A0 in equation (3).
The spectral ratios in Figure 3 are essentially linear inthe 10–50 Hz frequency range and were used to computeα�z� (Fig. 5), which in turn was used to compute QS. Usingan average velocity of 267 m=sec we obtain a QS of25:3� 2:6. The actual data and the synthetic data generatedfor the velocity model determined by Ge et al. (2007) and thisvalue of QS are shown in Figure 5.
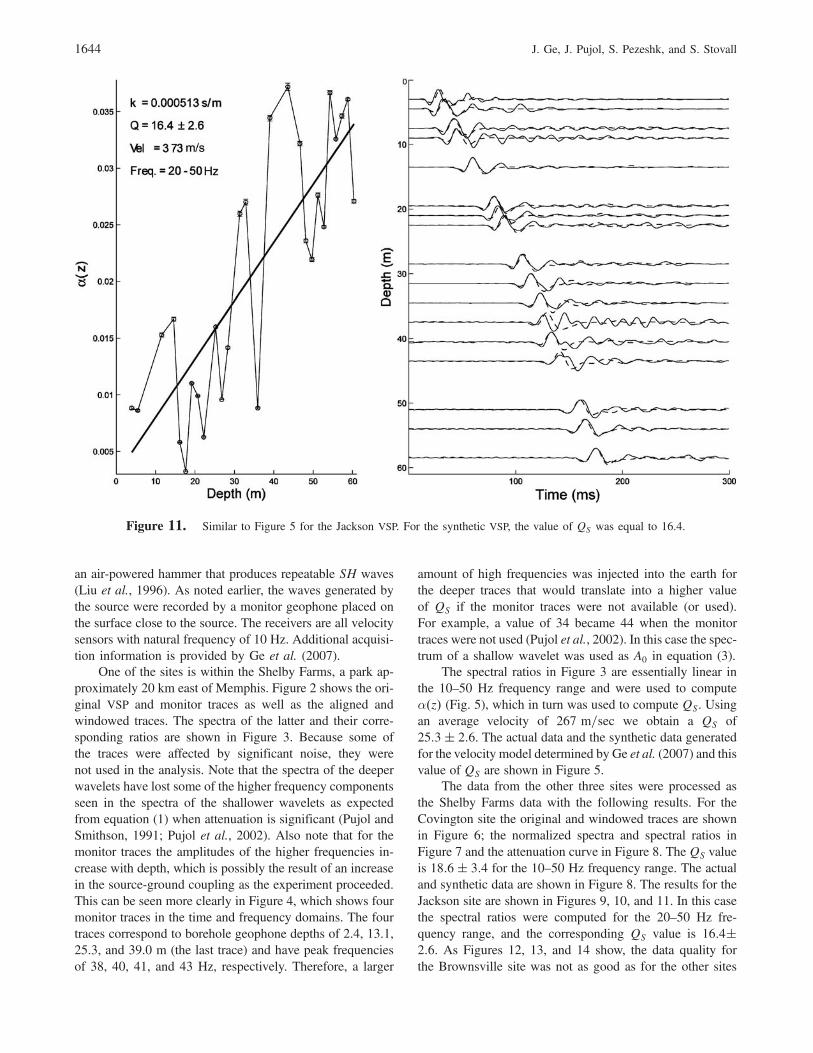
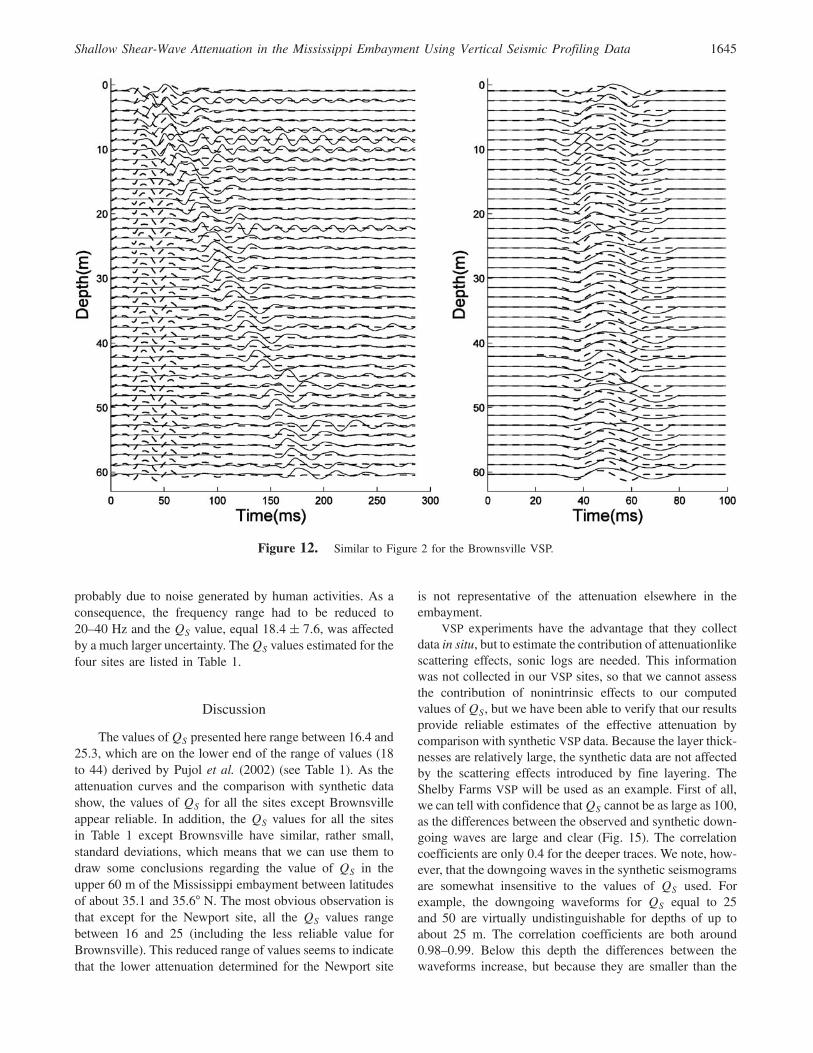
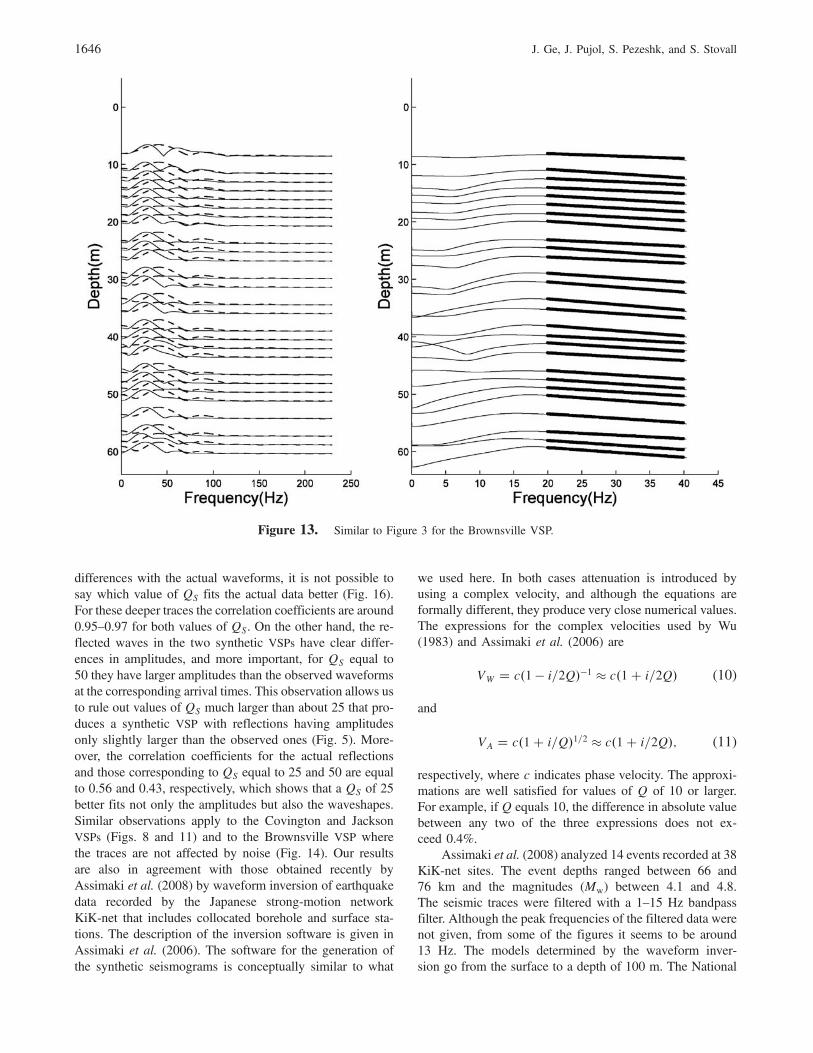
The data from the other three sites were processed asthe Shelby Farms data with the following results. For theCovington site the original and windowed traces are shownin Figure 6; the normalized spectra and spectral ratios inFigure 7 and the attenuation curve in Figure 8. The QS valueis 18:6� 3:4 for the 10–50 Hz frequency range. The actualand synthetic data are shown in Figure 8. The results for theJackson site are shown in Figures 9, 10, and 11. In this casethe spectral ratios were computed for the 20–50 Hz fre-quency range, and the corresponding QS value is 16:4�2:6. As Figures 12, 13, and 14 show, the data quality forthe Brownsville site was not as good as for the other sites
Figure 11. Similar to Figure 5 for the Jackson VSP. For the synthetic VSP, the value of QS was equal to 16.4.
1644 J. Ge, J. Pujol, S. Pezeshk, and S. Stovall
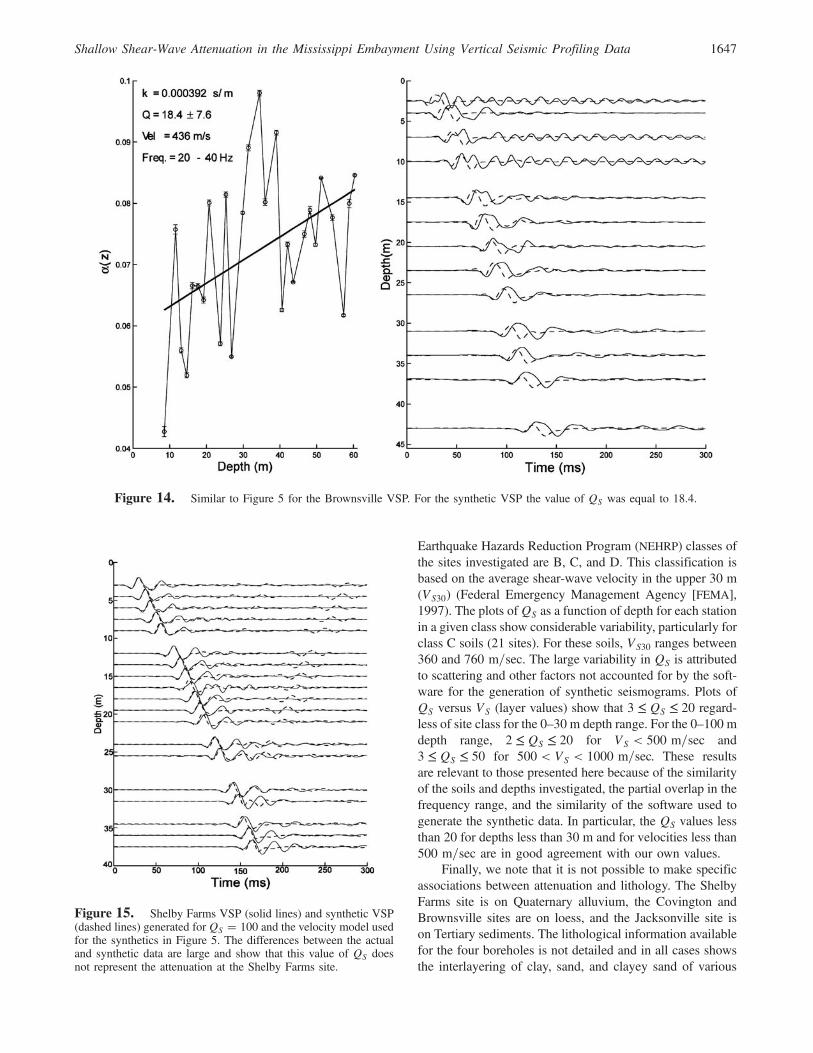
probably due to noise generated by human activities. As aconsequence, the frequency range had to be reduced to20–40 Hz and the QS value, equal 18:4� 7:6, was affectedby a much larger uncertainty. TheQS values estimated for thefour sites are listed in Table 1.
Discussion
The values ofQS presented here range between 16.4 and25.3, which are on the lower end of the range of values (18to 44) derived by Pujol et al. (2002) (see Table 1). As theattenuation curves and the comparison with synthetic datashow, the values of QS for all the sites except Brownsvilleappear reliable. In addition, the QS values for all the sitesin Table 1 except Brownsville have similar, rather small,standard deviations, which means that we can use them todraw some conclusions regarding the value of QS in theupper 60 m of the Mississippi embayment between latitudesof about 35.1 and 35.6° N. The most obvious observation isthat except for the Newport site, all the QS values rangebetween 16 and 25 (including the less reliable value forBrownsville). This reduced range of values seems to indicatethat the lower attenuation determined for the Newport site
is not representative of the attenuation elsewhere in theembayment.
VSP experiments have the advantage that they collectdata in situ, but to estimate the contribution of attenuationlikescattering effects, sonic logs are needed. This informationwas not collected in our VSP sites, so that we cannot assessthe contribution of nonintrinsic effects to our computedvalues of QS, but we have been able to verify that our resultsprovide reliable estimates of the effective attenuation bycomparison with synthetic VSP data. Because the layer thick-nesses are relatively large, the synthetic data are not affectedby the scattering effects introduced by fine layering. TheShelby Farms VSP will be used as an example. First of all,we can tell with confidence thatQS cannot be as large as 100,as the differences between the observed and synthetic down-going waves are large and clear (Fig. 15). The correlationcoefficients are only 0.4 for the deeper traces. We note, how-ever, that the downgoing waves in the synthetic seismogramsare somewhat insensitive to the values of QS used. Forexample, the downgoing waveforms for QS equal to 25and 50 are virtually undistinguishable for depths of up toabout 25 m. The correlation coefficients are both around0.98–0.99. Below this depth the differences between thewaveforms increase, but because they are smaller than the
Figure 12. Similar to Figure 2 for the Brownsville VSP.
Shallow Shear-Wave Attenuation in the Mississippi Embayment Using Vertical Seismic Profiling Data 1645
differences with the actual waveforms, it is not possible tosay which value of QS fits the actual data better (Fig. 16).For these deeper traces the correlation coefficients are around0.95–0.97 for both values of QS. On the other hand, the re-flected waves in the two synthetic VSPs have clear differ-ences in amplitudes, and more important, for QS equal to50 they have larger amplitudes than the observed waveformsat the corresponding arrival times. This observation allows usto rule out values of QS much larger than about 25 that pro-duces a synthetic VSP with reflections having amplitudesonly slightly larger than the observed ones (Fig. 5). More-over, the correlation coefficients for the actual reflectionsand those corresponding to QS equal to 25 and 50 are equalto 0.56 and 0.43, respectively, which shows that a QS of 25better fits not only the amplitudes but also the waveshapes.Similar observations apply to the Covington and JacksonVSPs (Figs. 8 and 11) and to the Brownsville VSP wherethe traces are not affected by noise (Fig. 14). Our resultsare also in agreement with those obtained recently byAssimaki et al. (2008) by waveform inversion of earthquakedata recorded by the Japanese strong-motion networkKiK-net that includes collocated borehole and surface sta-tions. The description of the inversion software is given inAssimaki et al. (2006). The software for the generation ofthe synthetic seismograms is conceptually similar to what
we used here. In both cases attenuation is introduced byusing a complex velocity, and although the equations areformally different, they produce very close numerical values.The expressions for the complex velocities used by Wu(1983) and Assimaki et al. (2006) are
VW � c�1 � i=2Q��1 ≈ c�1� i=2Q� (10)
and
VA � c�1� i=Q�1=2 ≈ c�1� i=2Q�; (11)
respectively, where c indicates phase velocity. The approxi-mations are well satisfied for values of Q of 10 or larger.For example, if Q equals 10, the difference in absolute valuebetween any two of the three expressions does not ex-ceed 0.4%.
Assimaki et al. (2008) analyzed 14 events recorded at 38KiK-net sites. The event depths ranged between 66 and76 km and the magnitudes (Mw) between 4.1 and 4.8.The seismic traces were filtered with a 1–15 Hz bandpassfilter. Although the peak frequencies of the filtered data werenot given, from some of the figures it seems to be around13 Hz. The models determined by the waveform inver-sion go from the surface to a depth of 100 m. The National
Figure 13. Similar to Figure 3 for the Brownsville VSP.
1646 J. Ge, J. Pujol, S. Pezeshk, and S. Stovall
Earthquake Hazards Reduction Program (NEHRP) classes ofthe sites investigated are B, C, and D. This classification isbased on the average shear-wave velocity in the upper 30 m(VS30) (Federal Emergency Management Agency [FEMA],1997). The plots of QS as a function of depth for each stationin a given class show considerable variability, particularly forclass C soils (21 sites). For these soils, VS30 ranges between360 and 760 m=sec. The large variability in QS is attributedto scattering and other factors not accounted for by the soft-ware for the generation of synthetic seismograms. Plots ofQS versus VS (layer values) show that 3 ≤ QS ≤ 20 regard-less of site class for the 0–30 m depth range. For the 0–100 mdepth range, 2 ≤ QS ≤ 20 for VS < 500 m=sec and3 ≤ QS ≤ 50 for 500 < VS < 1000 m=sec. These resultsare relevant to those presented here because of the similarityof the soils and depths investigated, the partial overlap in thefrequency range, and the similarity of the software used togenerate the synthetic data. In particular, the QS values lessthan 20 for depths less than 30 m and for velocities less than500 m=sec are in good agreement with our own values.
Finally, we note that it is not possible to make specificassociations between attenuation and lithology. The ShelbyFarms site is on Quaternary alluvium, the Covington andBrownsville sites are on loess, and the Jacksonville site ison Tertiary sediments. The lithological information availablefor the four boreholes is not detailed and in all cases showsthe interlayering of clay, sand, and clayey sand of various
Figure 14. Similar to Figure 5 for the Brownsville VSP. For the synthetic VSP the value of QS was equal to 18.4.
Figure 15. Shelby Farms VSP (solid lines) and synthetic VSP(dashed lines) generated for QS � 100 and the velocity model usedfor the synthetics in Figure 5. The differences between the actualand synthetic data are large and show that this value of QS doesnot represent the attenuation at the Shelby Farms site.
Shallow Shear-Wave Attenuation in the Mississippi Embayment Using Vertical Seismic Profiling Data 1647
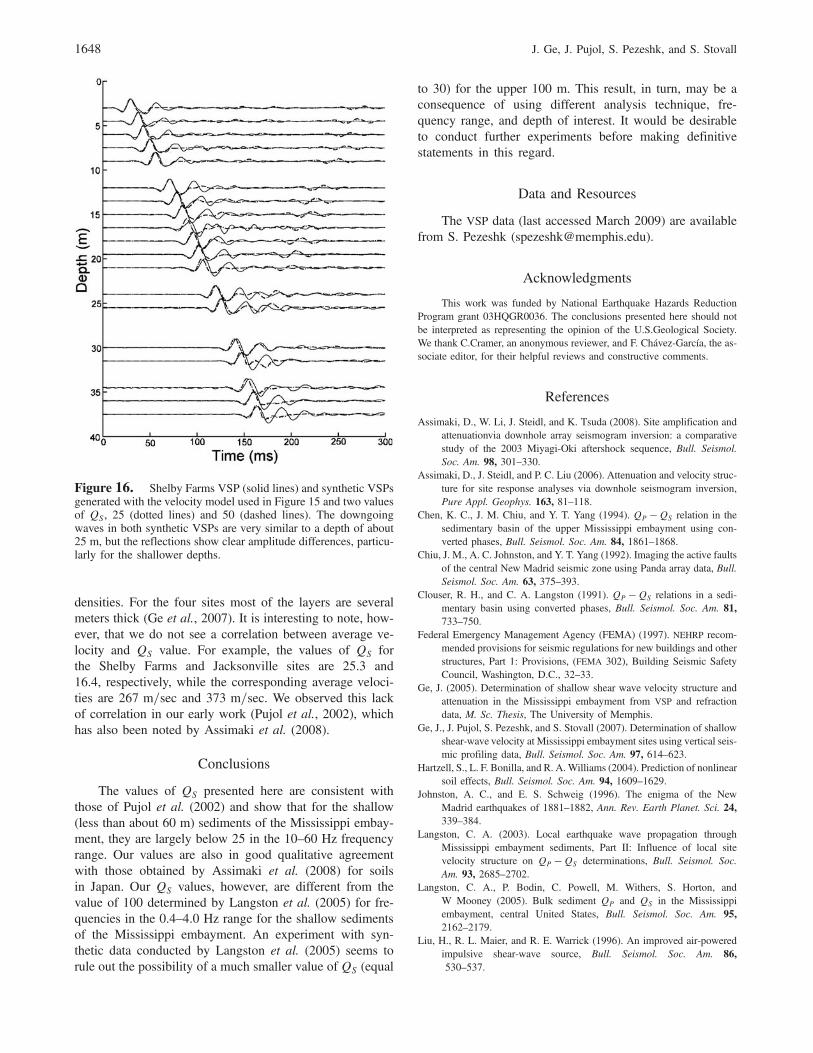
densities. For the four sites most of the layers are severalmeters thick (Ge et al., 2007). It is interesting to note, how-ever, that we do not see a correlation between average ve-locity and QS value. For example, the values of QS forthe Shelby Farms and Jacksonville sites are 25.3 and16.4, respectively, while the corresponding average veloci-ties are 267 m=sec and 373 m=sec. We observed this lackof correlation in our early work (Pujol et al., 2002), whichhas also been noted by Assimaki et al. (2008).
Conclusions
The values of QS presented here are consistent withthose of Pujol et al. (2002) and show that for the shallow(less than about 60 m) sediments of the Mississippi embay-ment, they are largely below 25 in the 10–60 Hz frequencyrange. Our values are also in good qualitative agreementwith those obtained by Assimaki et al. (2008) for soilsin Japan. Our QS values, however, are different from thevalue of 100 determined by Langston et al. (2005) for fre-quencies in the 0.4–4.0 Hz range for the shallow sedimentsof the Mississippi embayment. An experiment with syn-thetic data conducted by Langston et al. (2005) seems torule out the possibility of a much smaller value of QS (equal
to 30) for the upper 100 m. This result, in turn, may be aconsequence of using different analysis technique, fre-quency range, and depth of interest. It would be desirableto conduct further experiments before making definitivestatements in this regard.
Data and Resources
The VSP data (last accessed March 2009) are availablefrom S. Pezeshk ([email protected]).
Acknowledgments
This work was funded by National Earthquake Hazards ReductionProgram grant 03HQGR0036. The conclusions presented here should notbe interpreted as representing the opinion of the U.S.Geological Society.We thank C.Cramer, an anonymous reviewer, and F. Chávez-García, the as-sociate editor, for their helpful reviews and constructive comments.
References
Assimaki, D., W. Li, J. Steidl, and K. Tsuda (2008). Site amplification andattenuationvia downhole array seismogram inversion: a comparativestudy of the 2003 Miyagi-Oki aftershock sequence, Bull. Seismol.Soc. Am. 98, 301–330.
Assimaki, D., J. Steidl, and P. C. Liu (2006). Attenuation and velocity struc-ture for site response analyses via downhole seismogram inversion,Pure Appl. Geophys. 163, 81–118.
Chen, K. C., J. M. Chiu, and Y. T. Yang (1994). QP �QS relation in thesedimentary basin of the upper Mississippi embayment using con-verted phases, Bull. Seismol. Soc. Am. 84, 1861–1868.
Chiu, J. M., A. C. Johnston, and Y. T. Yang (1992). Imaging the active faultsof the central New Madrid seismic zone using Panda array data, Bull.Seismol. Soc. Am. 63, 375–393.
Clouser, R. H., and C. A. Langston (1991). QP �QS relations in a sedi-mentary basin using converted phases, Bull. Seismol. Soc. Am. 81,733–750.
Federal Emergency Management Agency (FEMA) (1997). NEHRP recom-mended provisions for seismic regulations for new buildings and otherstructures, Part 1: Provisions, (FEMA 302), Building Seismic SafetyCouncil, Washington, D.C., 32–33.
Ge, J. (2005). Determination of shallow shear wave velocity structure andattenuation in the Mississippi embayment from VSP and refractiondata, M. Sc. Thesis, The University of Memphis.
Ge, J., J. Pujol, S. Pezeshk, and S. Stovall (2007). Determination of shallowshear-wave velocity at Mississippi embayment sites using vertical seis-mic profiling data, Bull. Seismol. Soc. Am. 97, 614–623.
Hartzell, S., L. F. Bonilla, and R. A.Williams (2004). Prediction of nonlinearsoil effects, Bull. Seismol. Soc. Am. 94, 1609–1629.
Johnston, A. C., and E. S. Schweig (1996). The enigma of the NewMadrid earthquakes of 1881–1882, Ann. Rev. Earth Planet. Sci. 24,339–384.
Langston, C. A. (2003). Local earthquake wave propagation throughMississippi embayment sediments, Part II: Influence of local sitevelocity structure on QP �QS determinations, Bull. Seismol. Soc.Am. 93, 2685–2702.
Langston, C. A., P. Bodin, C. Powell, M. Withers, S. Horton, andW Mooney (2005). Bulk sediment QP and QS in the Mississippiembayment, central United States, Bull. Seismol. Soc. Am. 95,2162–2179.
Liu, H., R. L. Maier, and R. E. Warrick (1996). An improved air-poweredimpulsive shear-wave source, Bull. Seismol. Soc. Am. 86,530–537.
Figure 16. Shelby Farms VSP (solid lines) and synthetic VSPsgenerated with the velocity model used in Figure 15 and two valuesof QS, 25 (dotted lines) and 50 (dashed lines). The downgoingwaves in both synthetic VSPs are very similar to a depth of about25 m, but the reflections show clear amplitude differences, particu-larly for the shallower depths.
1648 J. Ge, J. Pujol, S. Pezeshk, and S. Stovall
Nuttli, O. (1973). The Mississippi Valley earthquakes of 1811 and 1812;Intensities, ground motion, and magnitudes, Bull. Seismol. Soc.Am.63, 227–248.
Pujol, J., and S. Smithson (1991). Seismic attenuation in volcanic rocks fromVSP experiments, Geophysics 56, 1441–1455.
Pujol, J., S. Pezeshk, Y. Zhang, and C. Zhao (2002). Unexpected values ofQS in the unconsolidated sediments of the Mississippi embayment,Bull. Seismol. Soc. Am. 92, 1117–1128.
Tuttle, M. P., and E. S. Schweig (1995). Archeological and pedological evi-dence for large prehistoric earthquakes in the New Madrid seismiczone, central United States, Geology 23, 253–256.
Tuttle, M. P., E. S. Schweig, J. D. Sims, R. H. Lafferty, L. W.Wolf, andM. L.Haynes (2002). The earthquake potential of the New Madrid seismiczone, Bull. Seismol. Soc. Am. 92, 2080–2089.
Wilson, A. (1990). Computer software for the processing and interpretationof VSP data including the study of seismic wave attenuation, M.Sc.Thesis, Memphis State University.
Wu, R. C. (1983). Frequency domain computation of synthetic verticalseismic profiles, M.Sc. Thesis, Texas A&M University.
Zoltan, D. A., R. H. Shumway, and M. R. Hirano (1991). Time domainwaveform inversion—a frequency domain view: How well we needto match waveforms?, Bull. Seismol. Soc. Am. 81, 2351–2370.
Center for Earthquake Research and InformationThe University of Memphis3876 Central AvenueMemphis, Tennessee [email protected]
(J.G.)
Department of Earth SciencesThe University of MemphisMemphis, Tennessee [email protected]
(J.P.)
Department of Civil EngineeringThe University of MemphisMemphis, Tennessee [email protected]@memphis.edu
(S.P., S.S.)
Manuscript received 10 April 2008
Shallow Shear-Wave Attenuation in the Mississippi Embayment Using Vertical Seismic Profiling Data 1649