Embed Size (px)
Citation preview
UK Regional Trade in Goods Statistics, Quarter 2 2021
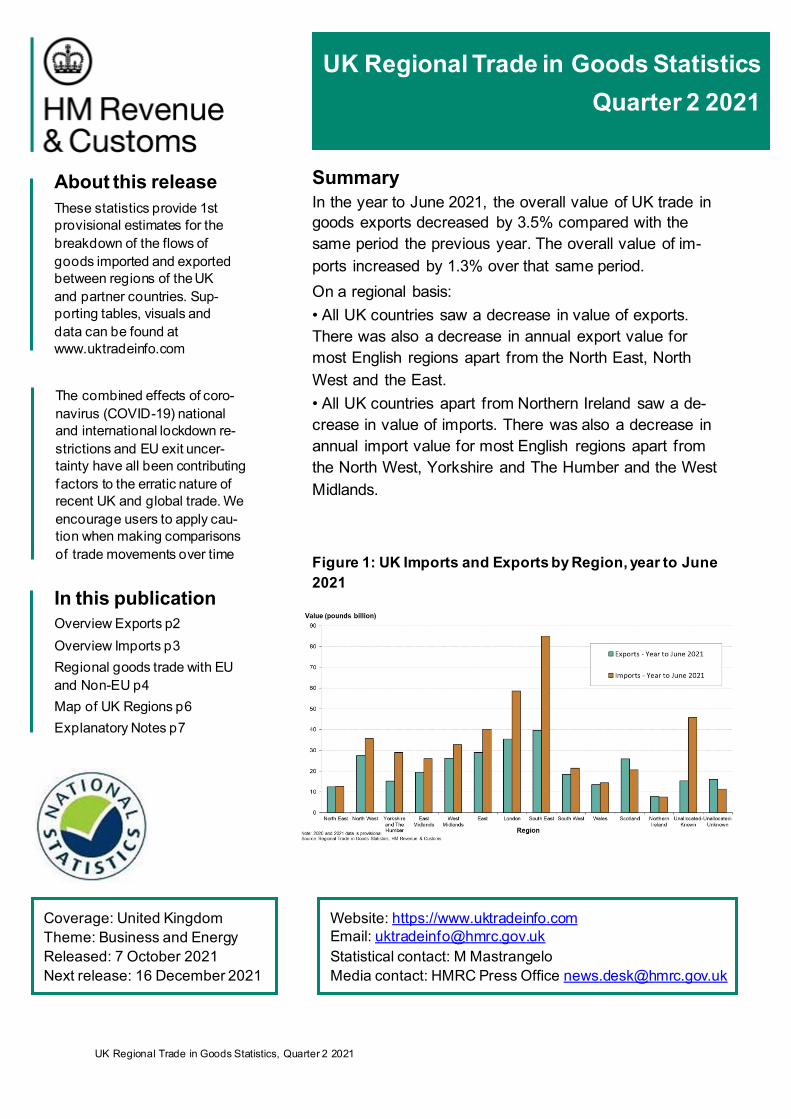
Summary In the year to June 2021, the overall value of UK trade in goods exports decreased by 3.5% compared with the same period the previous year. The overall value of im-ports increased by 1.3% over that same period. On a regional basis: • All UK countries saw a decrease in value of exports.There was also a decrease in annual export value formost English regions apart from the North East, NorthWest and the East.• All UK countries apart from Northern Ireland saw a de-crease in value of imports. There was also a decrease inannual import value for most English regions apart fromthe North West, Yorkshire and The Humber and the WestMidlands.
Figure 1: UK Imports and Exports by Region, year to June 2021
UK Regional Trade in Goods StatisticsQuarter 2 2021
About this release These statistics provide 1st provisional estimates for the breakdown of the flows of goods imported and exported between regions of the UK and partner countries. Sup-porting tables, visuals and data can be found at www.uktradeinfo.com
In this publication Overview Exports p2 Overview Imports p3 Regional goods trade with EU and Non-EU p4 Map of UK Regions p6 Explanatory Notes p7
Coverage: United Kingdom Theme: Business and Energy Released: 7 October 2021 Next release: 16 December 2021
Website: https://www.uktradeinfo.com Email: [email protected] Statistical contact: M Mastrangelo Media contact: HMRC Press Office [email protected]
The combined effects of coro-navirus (COVID-19) national and international lockdown re-strictions and EU exit uncer-tainty have all been contributing factors to the erratic nature of recent UK and global trade. We encourage users to apply cau-tion when making comparisons of trade movements over time
UK Regional Trade in Goods Statistics, Quarter 2 2021 2
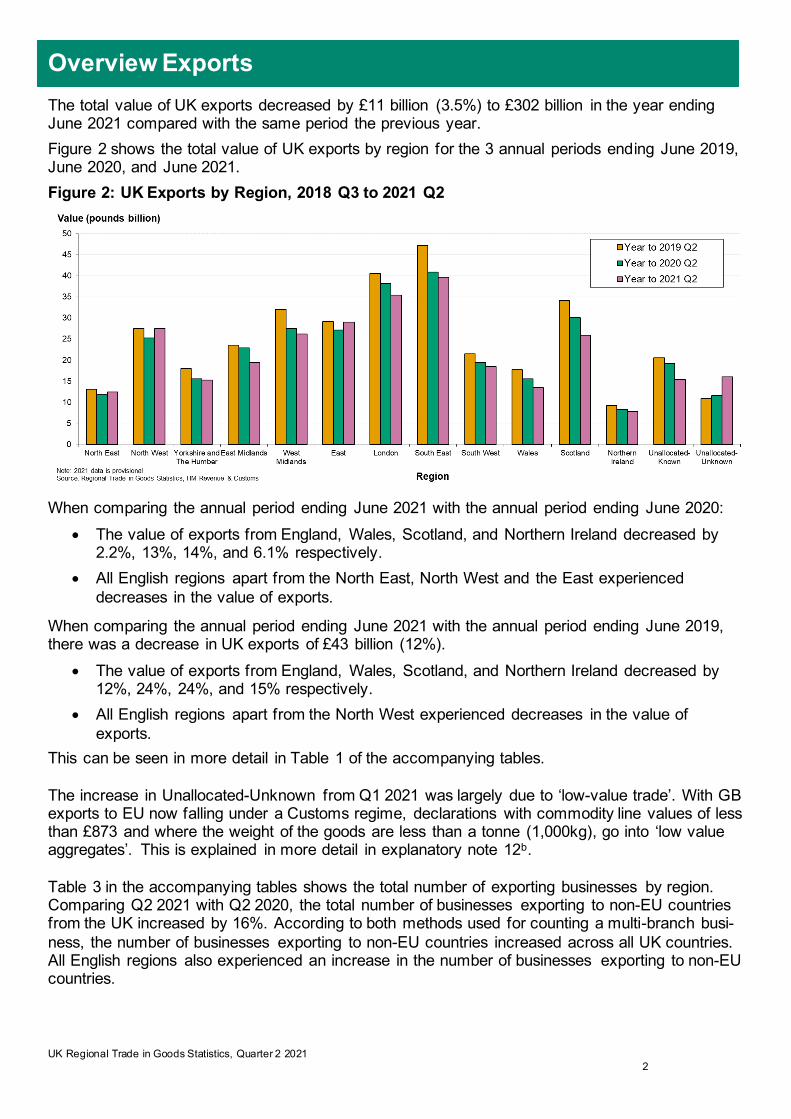
The total value of UK exports decreased by £11 billion (3.5%) to £302 billion in the year ending June 2021 compared with the same period the previous year. Figure 2 shows the total value of UK exports by region for the 3 annual periods ending June 2019, June 2020, and June 2021. Figure 2: UK Exports by Region, 2018 Q3 to 2021 Q2
When comparing the annual period ending June 2021 with the annual period ending June 2020: • The value of exports from England, Wales, Scotland, and Northern Ireland decreased by
2.2%, 13%, 14%, and 6.1% respectively.• All English regions apart from the North East, North West and the East experienced
decreases in the value of exports.
When comparing the annual period ending June 2021 with the annual period ending June 2019, there was a decrease in UK exports of £43 billion (12%).
• The value of exports from England, Wales, Scotland, and Northern Ireland decreased by12%, 24%, 24%, and 15% respectively.
• All English regions apart from the North West experienced decreases in the value ofexports.
This can be seen in more detail in Table 1 of the accompanying tables.
The increase in Unallocated-Unknown from Q1 2021 was largely due to ‘low-value trade’. With GB exports to EU now falling under a Customs regime, declarations with commodity line values of less than £873 and where the weight of the goods are less than a tonne (1,000kg), go into ‘low value aggregates’. This is explained in more detail in explanatory note 12b.
Table 3 in the accompanying tables shows the total number of exporting businesses by region. Comparing Q2 2021 with Q2 2020, the total number of businesses exporting to non-EU countries from the UK increased by 16%. According to both methods used for counting a multi-branch busi-ness, the number of businesses exporting to non-EU countries increased across all UK countries. All English regions also experienced an increase in the number of businesses exporting to non-EU countries.
Overview Exports
UK Regional Trade in Goods Statistics, Quarter 2 2021 3
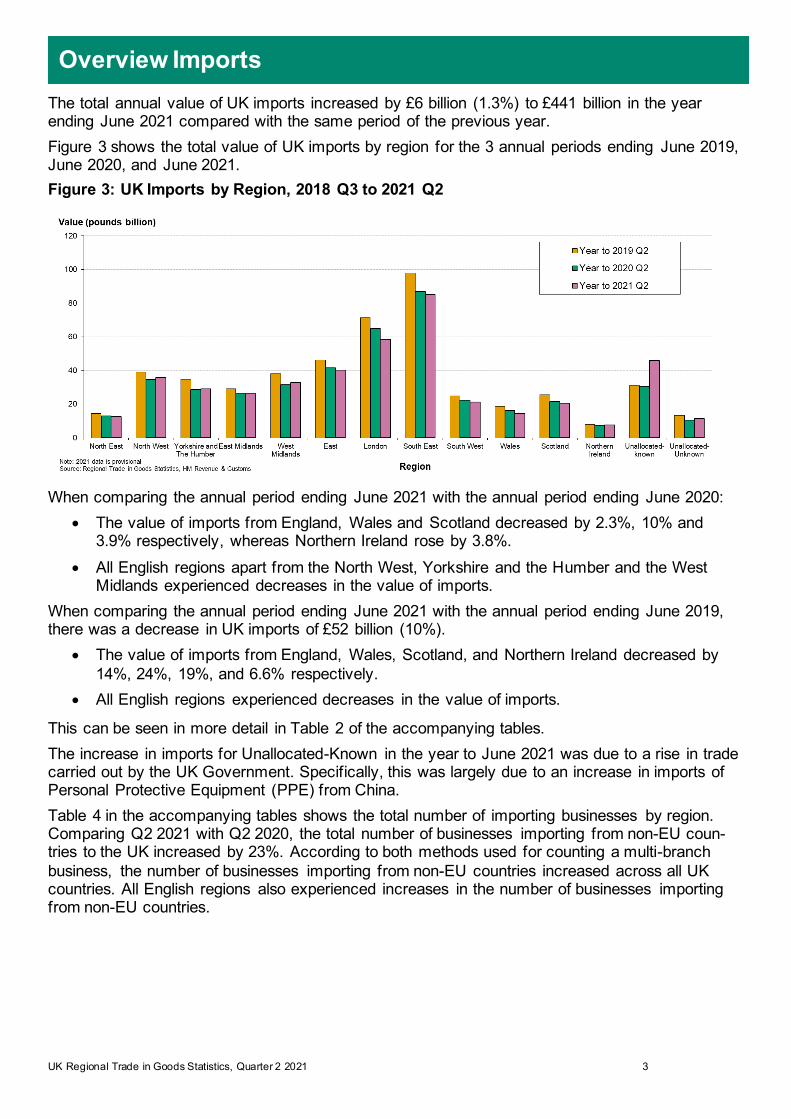
The total annual value of UK imports increased by £6 billion (1.3%) to £441 billion in the year ending June 2021 compared with the same period of the previous year. Figure 3 shows the total value of UK imports by region for the 3 annual periods ending June 2019, June 2020, and June 2021. Figure 3: UK Imports by Region, 2018 Q3 to 2021 Q2
When comparing the annual period ending June 2021 with the annual period ending June 2020: • The value of imports from England, Wales and Scotland decreased by 2.3%, 10% and
3.9% respectively, whereas Northern Ireland rose by 3.8%.• All English regions apart from the North West, Yorkshire and the Humber and the West
Midlands experienced decreases in the value of imports.When comparing the annual period ending June 2021 with the annual period ending June 2019, there was a decrease in UK imports of £52 billion (10%).
• The value of imports from England, Wales, Scotland, and Northern Ireland decreased by14%, 24%, 19%, and 6.6% respectively.
• All English regions experienced decreases in the value of imports.
This can be seen in more detail in Table 2 of the accompanying tables. The increase in imports for Unallocated-Known in the year to June 2021 was due to a rise in trade carried out by the UK Government. Specifically, this was largely due to an increase in imports of Personal Protective Equipment (PPE) from China. Table 4 in the accompanying tables shows the total number of importing businesses by region. Comparing Q2 2021 with Q2 2020, the total number of businesses importing from non-EU coun-tries to the UK increased by 23%. According to both methods used for counting a multi-branch business, the number of businesses importing from non-EU countries increased across all UK countries. All English regions also experienced increases in the number of businesses importing from non-EU countries.
Overview Imports
UK Regional Trade in Goods Statistics, Quarter 2 2021 4
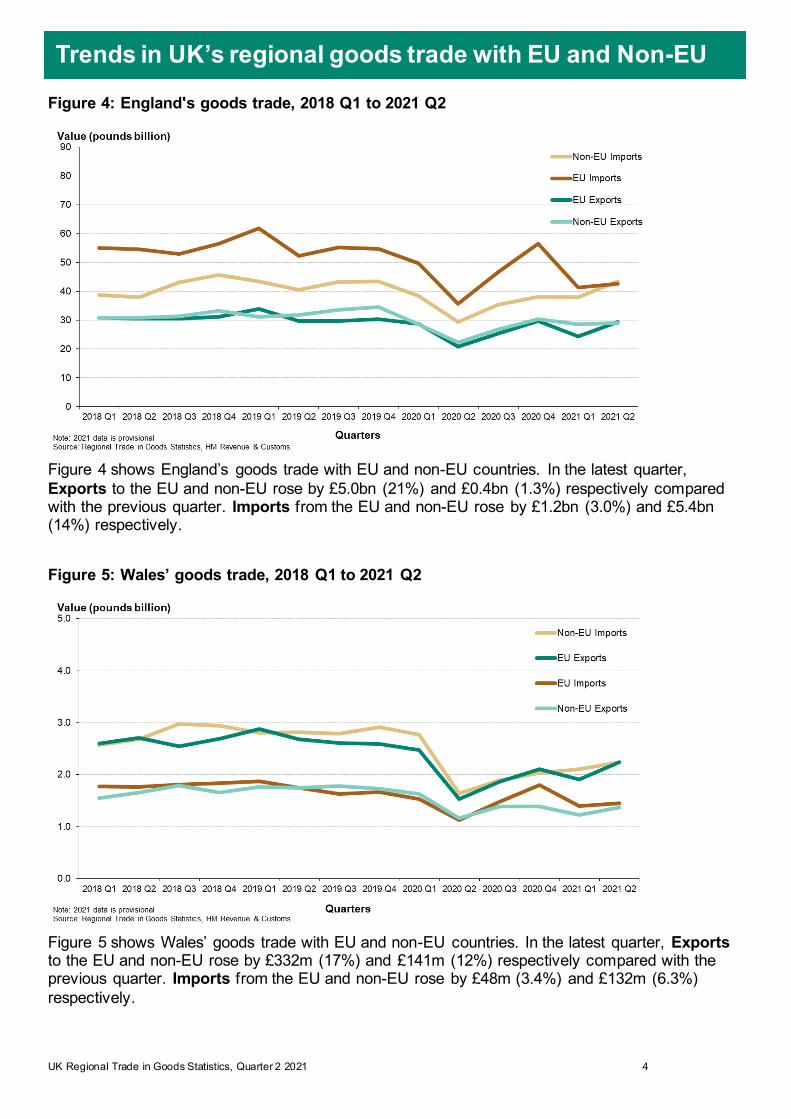
Figure 4: England's goods trade, 2018 Q1 to 2021 Q2
Figure 4 shows England’s goods trade with EU and non-EU countries. In the latest quarter, Exports to the EU and non-EU rose by £5.0bn (21%) and £0.4bn (1.3%) respectively compared with the previous quarter. Imports from the EU and non-EU rose by £1.2bn (3.0%) and £5.4bn (14%) respectively.
Figure 5: Wales’ goods trade, 2018 Q1 to 2021 Q2
Figure 5 shows Wales’ goods trade with EU and non-EU countries. In the latest quarter, Exports to the EU and non-EU rose by £332m (17%) and £141m (12%) respectively compared with the previous quarter. Imports from the EU and non-EU rose by £48m (3.4%) and £132m (6.3%) respectively.
Trends in UK’s regional goods trade with EU and Non-EU coucouncountriescountries
UK Regional Trade in Goods Statistics, Quarter 2 2021 5
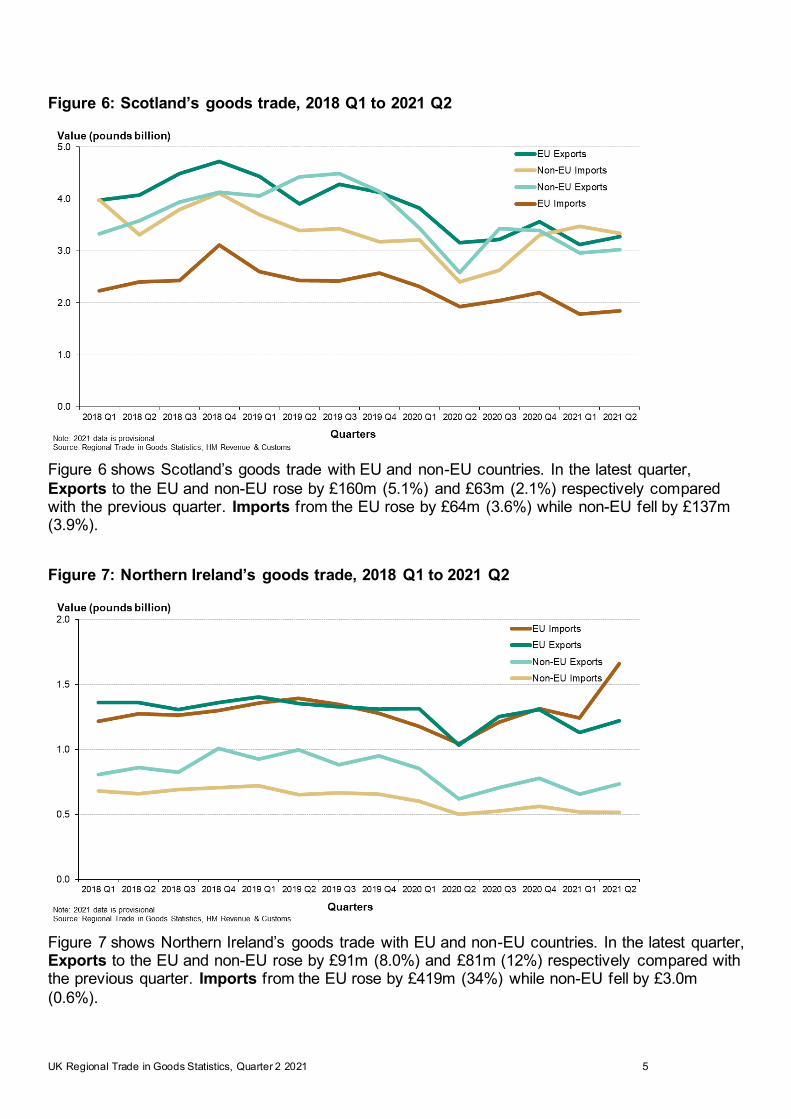
Figure 6: Scotland’s goods trade, 2018 Q1 to 2021 Q2
Figure 6 shows Scotland’s goods trade with EU and non-EU countries. In the latest quarter, Exports to the EU and non-EU rose by £160m (5.1%) and £63m (2.1%) respectively compared with the previous quarter. Imports from the EU rose by £64m (3.6%) while non-EU fell by £137m (3.9%).
Figure 7: Northern Ireland’s goods trade, 2018 Q1 to 2021 Q2
Figure 7 shows Northern Ireland’s goods trade with EU and non-EU countries. In the latest quarter, Exports to the EU and non-EU rose by £91m (8.0%) and £81m (12%) respectively compared with the previous quarter. Imports from the EU rose by £419m (34%) while non-EU fell by £3.0m (0.6%).
UK Regional Trade in Goods Statistics, Quarter 2 2021 6
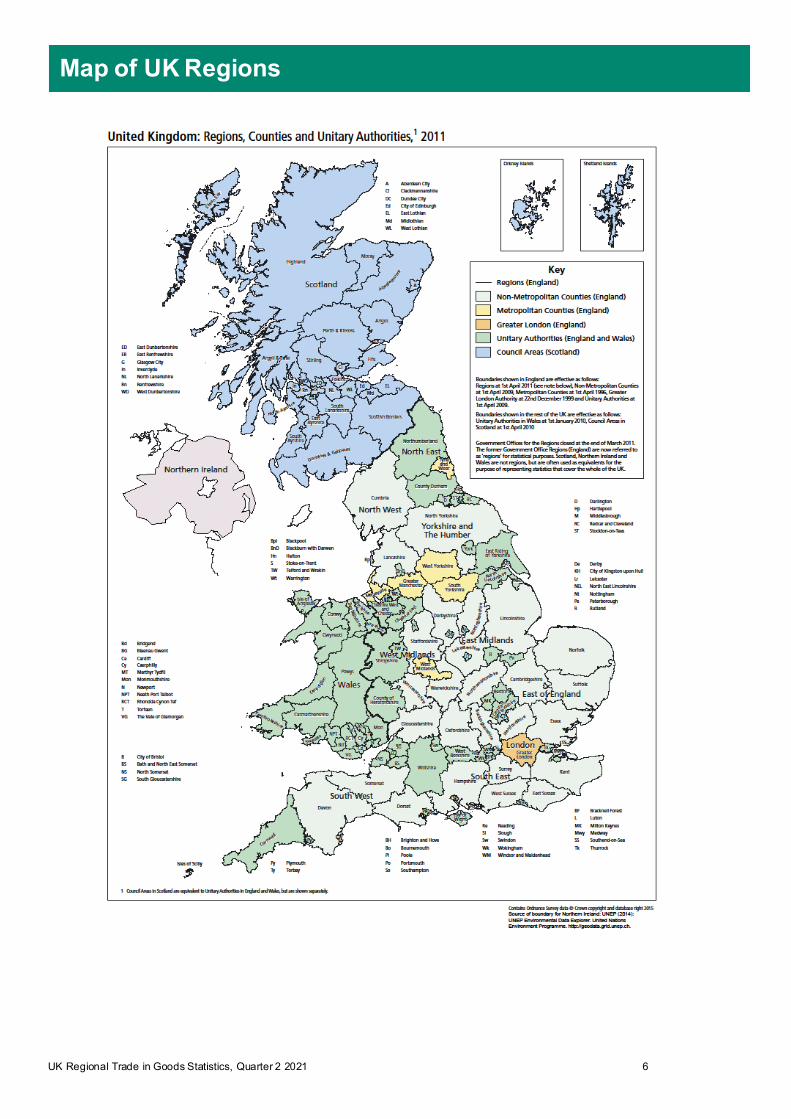
Map of UK Regions
UK Regional Trade in Goods Statistics, Quarter 2 2021 7
Introduction 1. HM Revenue & Customs (HMRC) is responsible for collecting the UK's international trade in
goods data, which are published as two National Statistics series - the 'Overseas Trade inGoods Statistics (OTS)' and the 'Regional Trade in Goods Statistics (RTS)'. The RTS ispublished quarterly showing trade at summary product and country level, split by UK regionsand devolved administrations.
2. The latest statistics on Regional Trade in Goods were released on 7 July 2021 by HMRC underarrangements set out in the Code of Practice for Statistics. This release includes the firstprovisional estimates of trade in goods for Q2 2021. At the same time revisions for previouslypublished regional data for 2021 Q1, and 2020 data covering Q1, Q2, Q3, and Q4 are beingreleased.
3. Aggregated tables are produced to allow time series analysis; these tables are provided in aseparate document released in conjunction with this release.
4. The following tables can be found in the ‘Accompanying Tables’ document.Table 1 Value (£ millions) of Exports (EU / Non-EU) by Region
Table 2 Value (£ millions) of Imports (EU / Non-EU) by Region
Table 3 Count of Exporters (EU / Non-EU) by Region for both Whole Number method and Proportion method
Table 4 Count of Importers (EU / Non-EU) by Region for both Whole Number method and Proportion method
Table 5 Value (£ millions) of Trade by SITC Section and Country Group (separate ta-bles for each region)
Please note, the count of EU exporters and EU importers are unavailable from Q1 2021 onwards. See explanatory note 12a for more details.
Changes to data sources
UK to EU exports
5. Up to 31 December 2020, UK to EU export statistics were collected via the Intrastat statisticalsurvey, which required traders to declare the value and volume of commodities exported to EUMember States within the relevant month of physical goods movement.
6. For goods moving from 1 January 2021, GB to EU export statistics are compiled direct fromcustoms export declarations made according to the requirements of the Taxation (CrossBorder Trade) Act. The customs declaration requirements are more complex than the singlemonthly aggregated Intrastat return, and can result in differences between dates of declarationand actual movement of the goods out of the country.
7. The OTS compilation methodology relies upon the acceptance date of the customs exportdeclaration for its inclusion within the relevant month of account, rather than the declaredphysical movement date used from the Intrastat survey.
8. Intrastat survey returns continue to be collected for goods exported from Northern Ireland tothe EU, under the terms of the Northern Ireland Protocol.
9. Both the GB to EU customs export declaration data and NI Intrastat export (dispatch) data areincorporated into the overall UK to EU export dataset.
Explanatory Notes
UK Regional Trade in Goods Statistics, Quarter 2 2021 8
10. As a result of the changes and differences outlined above, there is a break in the timeseriesfor published UK to EU export statistics from January 2021. Users are advised to note thischange when making comparisons to previous quarters/years.
UK imports from EU
11. For UK imports from the EU, the Intrastat survey continues to operate for all UK (GB and NI)imports (arrivals) from the EU, to mitigate the effects of staged customs controls, and to com-ply with the Northern Ireland Protocol. However, there are changes to other data sources usedfor RTS, notably the VAT returns now only capture NI trade with the EU where previously thiscaptured all UK trade.
Subsequent changes to the RTS
12. From the 2021 Q1 2021 publication, there are 2 consequences of the changes in datasources:
a. EU and total UK business counts will no longer be available. However, businesscounts will continue to be available for trade with non-EU countries.
With moving to the custom declarations for GB exports from the EU, we no longerreceive detailed business level information for low-value trade. This is already thecase for UK imports and exports with non-EU countries. However, for EU exports,the number/proportion of businesses carrying out these smaller trade transactions ismuch larger and therefore has a much greater impact on the accuracy of the countfor EU exporters. We are also unable to produce any data prior to 2021, meaningthe figure in isolation has no comparator/baseline, and would not be comparable onany level with previous figures.For EU imports, it is the change in the VAT collection that impacts here. Without thisdata, we are unable to identify the businesses (and therefore allocate to the regions)solely trading under the Intrastat threshold, which equates to around 90% ofbusinesses. Therefore, not a true representation of the number of businessesundertaking EU imports.
b. Customs export declarations to the EU that fall under the statistical value thresholdof £873 (in value) or 1,000kg (in net mass), cannot be assigned to a UK region andtherefore will be reported under “Unallocated-unknown” category.Declarations with commodity line values of less than £873 and where the weight ofthe goods are less than a tonne (1,000kg), go into ‘low value aggregates’. We do notreceive business information on these traders as part of the UK trade in goodsprocessing. As a result, we cannot assign this trade to a UK region, therefore thevalue is assigned to the Unallocated-unknown ‘region’.This is in line with the RTS methods used for trade with non-EU countries, which arealso sourced from Customs declarations.
13. These changes result in a break in time series. For further information on the RTS changestaking place, please refer to the updated RTS methodology.
Explanatory Notes
UK Regional Trade in Goods Statistics, Quarter 2 2021 9
Overseas Trade in Goods Statistics
14. Data is taken primarily from Customs systems (for non-EU trade and GB exports to EU coun-tries) and the Intrastat survey (for EU imports trade and Northern Ireland exports to EU coun-tries). HMRC does not receive information in respect of goods that move wholly within the UK,nor in intangibles and services such as banking or tourism.
15. The Overseas Trade in Goods Statistics (OTS) were published on a Special Trade basis fromMay 2016 account onwards. This change has been reflected in the RTS from 2016 Q2 releaseonwards. All data in this release has been compiled on a Special Trade basis to allow compar-isons across periods to be made. More information on general and special trade systems canbe found in the OTS and RTS methodologies.
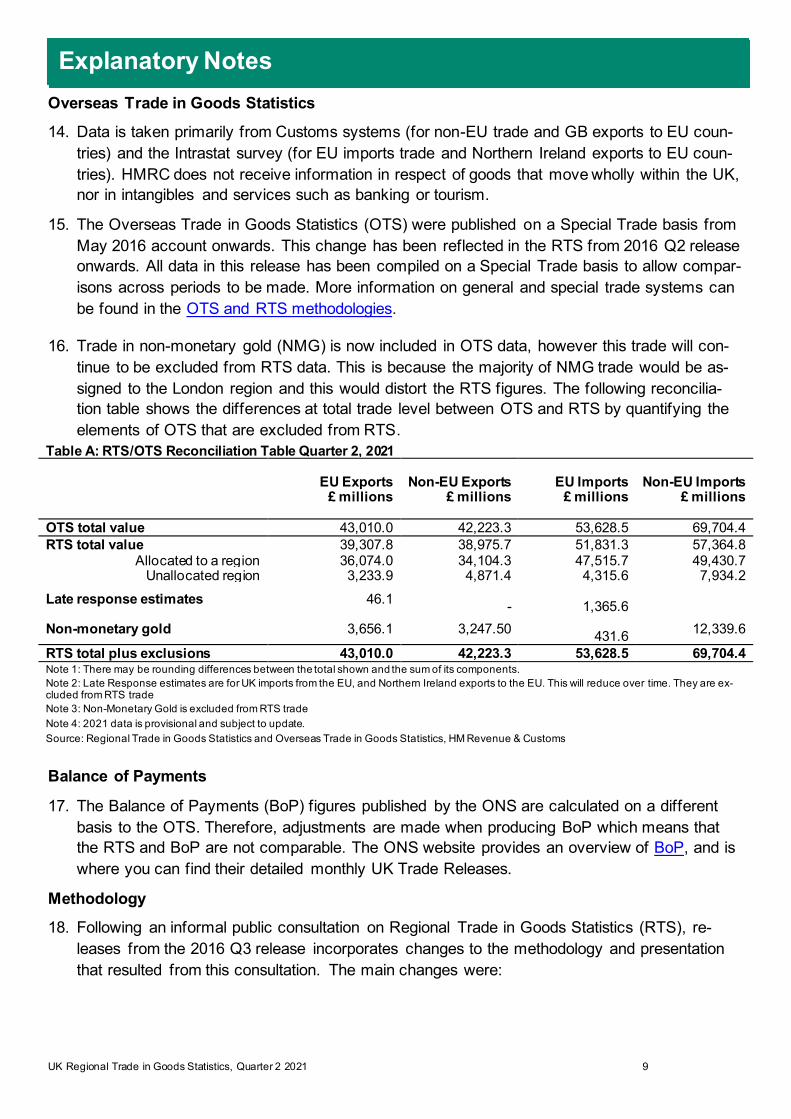
16. Trade in non-monetary gold (NMG) is now included in OTS data, however this trade will con-tinue to be excluded from RTS data. This is because the majority of NMG trade would be as-signed to the London region and this would distort the RTS figures. The following reconcilia-tion table shows the differences at total trade level between OTS and RTS by quantifying theelements of OTS that are excluded from RTS.
Balance of Payments
17. The Balance of Payments (BoP) figures published by the ONS are calculated on a differentbasis to the OTS. Therefore, adjustments are made when producing BoP which means thatthe RTS and BoP are not comparable. The ONS website provides an overview of BoP, and iswhere you can find their detailed monthly UK Trade Releases.
Methodology
18. Following an informal public consultation on Regional Trade in Goods Statistics (RTS), re-leases from the 2016 Q3 release incorporates changes to the methodology and presentationthat resulted from this consultation. The main changes were:
Table A: RTS/OTS Reconciliation Table Quarter 2, 2021
EU Exports £ millions
Non-EU Exports £ millions
EU Imports £ millions
Non-EU Imports £ millions
OTS total value 43,010.0 42,223.3 53,628.5 69,704.4 RTS total value 39,307.8 38,975.7 51,831.3 57,364.8
Allocated to a region 36,074.0 34,104.3 47,515.7 49,430.7 Unallocated region 3,233.9 4,871.4 4,315.6 7,934.2
Late response estimates 46.1 - 1,365.6Non-monetary gold 3,656.1 3,247.50 431.6 12,339.6
RTS total plus exclusions 43,010.0 42,223.3 53,628.5 69,704.4 Note 1: There may be rounding differences between the total shown and the sum of its components. Note 2: Late Response estimates are for UK imports from the EU, and Northern Ireland exports to the EU. This will reduce over time. They are ex-cluded from RTS trade Note 3: Non-Monetary Gold is excluded from RTS trade Note 4: 2021 data is provisional and subject to update. Source: Regional Trade in Goods Statistics and Overseas Trade in Goods Statistics, HM Revenue & Customs
Explanatory NotesExplanatory Notes
UK Regional Trade in Goods Statistics, Quarter 2 2021 10
• Allocating a business’ trade to a region based on their proportion of employees in that re-gion rather than where the location of the Head Office of the business is.
• Dividing trade that cannot be allocated to a region into ‘Known’ and ‘Unknown’.• For specific energy goods using data received by HMRC direct from interconnector and rig
operators rather than the business doing the trade.• The number of businesses now includes all VAT Registered traders rather than just those
who are required to make full declarations to HMRC for their EU trade. Please see explan-atory note 7 above for changes to business counts from Q1 2021 onwards.
19. RTS data is compiled by merging trade data collected by HMRC with employment data fromthe Interdepartmental Business Register (IDBR). A business’ trade is allocated to a regionbased on the proportion of its employees employed in that region. Where a trader is notmatched with the IDBR, its trade is matched with Office for National Statistics postcode data toobtain the region in which the Head Office of the VAT registered business (importer or ex-porter) is based.
20. Not all trade can be assigned to one of the 9 English Regions, Wales, Scotland and NorthernIreland. Where appropriate, this is referred to in the tables as the ‘Unallocated Trade’.Unallocated Trade is split into:
i.‘Unallocated – Known’: where we have virtually full details of the trade but it is not appro-priate to allocate it to a region. This covers:
• Trade going into or out of the Channel Islands or the Isle of Man;
• Trade carried out by overseas based traders who have a VAT presence in the UK;
• Trade carried out by the UK Government; and
• Parcel post trade that is dealt with centrally (trade with non-EU countries and GBexports to EU).
ii.‘Unallocated – Unknown’: This includes:
▪ Trade where business details submitted are invalid
▪ Un-registered businesses (trade with non-EU countries and GB exports to EU)
▪ Private Individuals (trade with non-EU countries and GB exports to EU); and
▪ Low Value Trade (trade with non-EU countries and GB exports to EU).
21. For specific energy goods only, trade is allocated to the region where the goods enter or leavethe UK rather than the location / employment of the business doing the trade. This is becauseHMRC receives details of the trade in these goods directly from grid operators rather than thebusiness. The goods concerned are Electrical energy, Natural Gas in a gaseous state andCrude Oil exported directly from offshore oil rigs. Crude Oil imported to the UK and exportedfrom terminals is still allocated to the region of the business.
22. The business count is derived from trade declarations and is a count of all VAT Registeredbusinesses importing and exporting. Please see explanatory note 7 above for changes to busi-ness counts from Q1 2021 onwards.
Explanatory Notes
UK Regional Trade in Goods Statistics, Quarter 2 2021 11
Where businesses have branches in multiple regions, there are two ways of deriving the count:
• Whole Number Method: A business will be counted as one in every region theyhave employees. This represents the actual count of businesses in any region. How-ever, it will mean the sum of the trader count for each region will be greater than thatfor the UK.
• Proportion Method: A business will be counted as a fraction in each region theytrade based on the proportion of their employees in each region. An individual busi-ness counts as one business in the UK. The sum of businesses (whole and frac-tions) gives the total business count for a region.
We show results from both methods in the table 3 of the accompanying data tables
23. RTS data is categorised by partner country and Standard International Trade Classification,Rev.4. (SITC) at division level (2-digit). The SITC is a relatively broad classification of goodsand is not as detailed as the commodity classification available in the OTS. In this releaseRTS data is analysed at partner country and SITC section (1-digit) level, with references toSITC divisions where appropriate.
24. More information can be found in the RTS methodology document.
25. Northern Ireland Statistics and Research Agency (NISRA) publish the Broad Economic Salesand Exports Statistics (BESES). These are an experimental measure, based on an annualsurvey of local businesses’ sales to markets outside Northern Ireland. Due to methodologicaldifferences, the BESES and the RTS are not directly comparable.
Governance
26. The United Kingdom Statistics Authority has designated these statistics as National Statistics,in accordance with the Statistics and Registration Service Act 2007 and signifying compliancewith the Code of Practice for Official Statistics. Designation can be broadly interpreted to meanthat the statistics:
• meet identified user needs;
• are well explained and readily accessible;
• are produced according to sound methods, and
• are managed impartially and objectively in the public interest.
Once statistics have been designated as National Statistics it is a statutory requirement that the Code of Practice shall continue to be observed.
27. The Regional Trade in Goods figures undergo regular quality assurance reviews to ensurethey meet customer needs. These reviews are published as a Government Statistical ServiceQuality report.
28. The RTS has been reviewed as part of an assessment made of the OTS by the UK StatisticsAuthority.
Explanatory Notes
UK Regional Trade in Goods Statistics, Quarter 2 2021 12
29. There is a limited service to provide RTS outputs directly from HMRC Trade Statistics wherethe data cannot be obtained from other sources. This service is subject to HMRC standarddisclosure rules applied to previously un-published data.
30. Now that the UK has left the EU, it is important that our statistics continue to be of high qualityand are internationally comparable. All releases continue to be produced in accordance withthe UK Statistics Authority’s Code of Practice for Statistics as well as internationally agreedstatistical guidance and standards.
Statistical contact:
M Mastrangelo e-mail: [email protected]
The OTS and RTS data series are published in HMRC’s trade data website www.uktradeinfo.com. Detailed data is available within an interactive database.
Next release: 16 December 2021 at 9:30am
© Crown copyright 2021.
If using specific facts contained in this release, please check the information is still current.
Explanatory Notes