Embed Size (px)
Citation preview
Regional Statistics, Vol. 9. No. 2. 2019: 213–234; DOI: 10.15196/RS090211
Public service as an indicator of competitiveness
Tamás SzabóDoctoral School of
Regional Policy and Economics, University of Pécs,
Hungary E-mail: [email protected]
Keywords:public services,
public goods, competitiveness,
territoriality, regionalism,
equal opportunities, model, t-test,
endogenous resources, hypothesis test
The practice of the integrated organisation of public services is partly the result of budgetary constraints. In the course of financial and task fulfilment planning, unequal public service accessibility is an issue in many cases. It most-ly affects disadvantaged regions and penalizes the concerned resident population by causing adverse selection with respect to wellbeing and living conditions. In this study, the author analyses the relationship between public ser-vice practices and economic competitiveness at the county level for Hungarian regions. The study also examines the relationship between the provision of consumable and non-consumable public goods and economic com-petitiveness. Using a latent variable model, the author presents the relationship between cer-tain public services and economic indicators with respect to the examined territorial units. Subsequently, following the subdivision of the examined territorial units into lower-level ad-ministrative units, the author draws a parallel between the endogenous resources and public services in each territorial unit, and tests the hypotheses with a two-sample t-test on cross-sectional data.
Introduction
Research studies during the field-work have defined competitiveness in several ways. However, reflecting on each context presented in these studies, one can easily acknowledge that the notion of territorial competitiveness is so complex that a ho-listic approach has to be applied (Piwowarski 2018). The state’s service delivery system and the consistency of its regulatory mechanisms have a prominent role in supporting the economy, addressing social needs, and ensuring competitiveness. The lack of a consistent and reasonable legal environment in public services may hamper the sustainable development of the above mentioned sectors.
This situation may occur because public services are organised under the influ-ence of state financing and state pressure in many cases. Thus, the quality and scale
214 Tamás Szabó
Regional Statistics, Vol. 9. No. 2. 2019: 213–234; DOI: 10.15196/RS090211
of services cannot be maintained at the same level with the changing conditions of subsidies (Bódi–Horváth 2013).
Territorial capital items promote competitiveness. The point is that the munici-pality network has institutionalized so-called communities from geographically in-terconnected and coherent groups of municipalities based on their demographic and territorial peculiarities. The literature differentiates three types of communities in Hungary (Bódi–Horváth 2013, Vida 2016):
– a community of municipalities surrounding a city – an interrelated urbanised group of municipalities with at least half a million inhabitants (5% of the permanent population);
– a community of municipalities that have become part of an agglomeration – interrelated and urbanised group of municipalities inhabited by at least 50,000 people altogether and located around one or more municipalities with more than 15,000 inhabitants in each;
– an urban community of small and mid-sized municipalities – interrelated and completely built-up urbanised area inhabited by 3,500–50,000 people.
The above mentioned concentration somehow reflects the evolution of the Hungarian economy, with special regard to the territorially stigmatic features and social processes of socialist industrialisation (Sebők 2015). These features and pro-cesses are discussed in relevant research studies on Hungary (Csath 2014, Dicső 2010). The studies reveal the territorial and demographic features of socialist indus-trialisation in relation to the current public administration units (counties) in Hunga-ry. These were also considered to be the relevant public administration units1 during the period examined by the authors. The oversized public administration system and the often superfluous public services provided greater security and exerted spatial concentration on the society to a lesser extent.
If the country’s competitiveness is examined on a management basis with longi-tudinal data, the process comes to an end in the years after the system change (Gyuris 2014), when the social and economic structures were altered. The period witnessed the emergence of new economic, social, and demographic trends. Mean-while, the unintended consequences and spill-over effects of the establishment of industrial centres spread through the economy and the social space (Kovács–Somlyódiné 2008, Kövesdi 1986), posing a challenge to the concerned local self-government institutions, public administration entities, and the local inhabitants. At the same time public administration reform forced municipalities most affected by emigration and population ageing to undertake a large-scale rationalisation regarding the concerned bodies and infrastructures. (Kincses–Bálint 2016a, b, Lados–Hegedűs 2019). Thus, the municipalities concerned entered into a cycle that causes adverse selection in terms of demography. As a result, public health care and education ser-
1 Since 2011, this has slightly changed as a result of the EU-funded Magyary Zoltán Public Administration De-velopment Programme for the implementation of the complex institutional and territorial rationalisation of the Hungarian public administration system.
Public service as an indicator of competitiveness 215
Regional Statistics, Vol. 9. No. 2. 2019: 213–234; DOI: 10.15196/RS090211
vices in the concerned territories deteriorated as well (Kincses–Tóth 2015). This kind of public service rationalisation may widen the gap between the lagging and well-performing regions. An examination of territorial competitiveness needs to consider two important aspects: territorial cohesion – optimally, with a homogene-ous demographic structure – and equal access to public goods.
Territorial cohesion is an essential goal of territorial development policy. The French define regions as territorial units that are, on the one hand, capable of estab-lishing networks between different structural levels and, on the other hand, are able to exploit endogenous resources (Lengyel 2003).
Ultimately, modernisation promotes a new principle that is contrary to the cen-tre–periphery model: small and mid-sized towns, which are the main components of the French municipality network. Thus, theory and practice indicate a duality that rationalisation of public services and public administration units may impair equal access to public services. This may threaten territorial cohesion within the nation state. According to some scientific approaches, the number of central municipalities must be reduced anyway (Pütz–Spangenberg 2006).
By and large, as a result of population decline and the depletion of public re-sources experts expect the elaboration of the strategy of decentralised concentra-tion, but they also expect that new forms of public service (mobile and online) may provide a solution to the problem (Maribel et al. 2014). Their explanation is as fol-lows: a decentralised network of municipalities can only be sustained by economi-cally strong centres and agglomerations; therefore, concentration of activities is essential for municipalities. The conference of ministers for territorial development agreed on a catalogue of minimum services in 1968. This is acceptable based on the principle of effectiveness – especially in regard to sustainably providing equal access to public services – and cost efficiency, because accessibility of the service delivery system can be improved via resource allocation (Kaiser 2014).
Connection of competitiveness
According to Lengyel, a Hungarian regionalist economist, territorial competitiveness is ‘the ability of companies, industrial sectors, regions, nations and supranational regions to generate a relatively high income and to reach a relatively high level of employment’ (2003 p. 75.). According to a game theory interpretation, a market actor can presumably gain only as much as the others lose (Bork 1977). Therefore, territorial or public administration units competing against each other within nation states can gain an advantage only at the expense of others.
It is important to note that throughout the literature there are numerous defini-tions of competitiveness based on GDP as an indicator. But these approaches are not applicable in comparative analyses focusing on territories within a nation state. This is because, on the one hand, the exact location of the output cannot be exam-ined in space. On the other hand, for a more exact picture, one should preferably
216 Tamás Szabó
Regional Statistics, Vol. 9. No. 2. 2019: 213–234; DOI: 10.15196/RS090211
consider the volume of industrial production as an indicator when comparing inner territories or public administration units.
At the corporate level, companies can be considered competitive if they are able to contribute to the growth of the national economy (Nemes Nagy–Lőcsei 2015) and adapt to the changing demands of consumers (Ozdemir et al. 2016). According to this logic, citizens who are able to adapt to the challenges of the labour market and cope with labour market competition can be considered competitive.
An important prerequisite to individual competitiveness is the existence of pub-lic service (education, health care, and cultural goods in particular) conditions which are a necessary but not sufficient condition of corporate competitiveness (Csath 2014). One of the centres of research on public services in Hungary is the so-called Good State Research Workshop,2 where researchers aim to develop complex indica-tors in order to make the performance of public administration and public services measureable. In a chapter on competitiveness in a multivolume work (Ozdemir et al. 2016), the author includes population-related indicators accessible via public services in a group of composite indexes. Research on public goods describe their subject on the basis of a neoclassical economic concept which categorises goods according to their right of use (Gyuris 2014, Kincses–Tóth 2015).
Accordingly, public goods are classified into rivalling and non-rivalling types. The chances of public goods participation have no upper limit, but the state is re-sponsible for quality assurance in a certain part of this category (mainly infrastruc-ture). In the case of rivalling public goods whose consumption is limited, the chance of equal access is nullified. Another group of rivalling public goods comprises club goods whose consumption is tied to certain conditions. These goods are mainly related to costly infrastructure, where consumers must pay some sort of service provider fee in order to get access to these goods. (Rácz 2017, Tóth–Nagy 2016).
The latter two-fold categorisation of public goods shows – particularly with re-gard to the differentiation of the resident population of territories within the same country – that the chances of their provision are influenced by the geographical dimension as well. When it comes to redistribution and the maintenance of public goods, the fact remains that the residents of each region do not benefit equally from the public goods because their environment and their financial capabilities deter-mine their consumption opportunities (e.g. one who does not own a car cannot use public roads to the same extent as one who does).
Modern constitutions of countries which are based on the rule of law usually ad-here to the principle of uniformity when regulating citizens’ right to healthy life and equal opportunities. This principle prevails moderately in Hungary with recently introduced reforms regarding equal access to public services (Lakatos et al. 2015). In my opinion, the amount of public services provided to citizens has a significant influence on (labour market) competitiveness and equal access to health care and
2 The workshop operates at the National University of Public Service.
Public service as an indicator of competitiveness 217
Regional Statistics, Vol. 9. No. 2. 2019: 213–234; DOI: 10.15196/RS090211
education for the regional population. The quality of education and health care ser-vices (which are public goods) exert an impact on the quality of life because of the above mentioned factors. The features of public services (Siska–Szabó 2015) are enlisted below:
– every member or group of the community is equally entitled to these services; – the use of services is passive; there is no need for a separate agreement or for
the active participation of the ones concerned; – there is no competition among consumers for the services. It can be deduced that if access to the service (e.g. education and health care sys-
tem) is reduced, the regional community of residents may find itself in a more dis-advantageous situation.
Territorial differences in public services
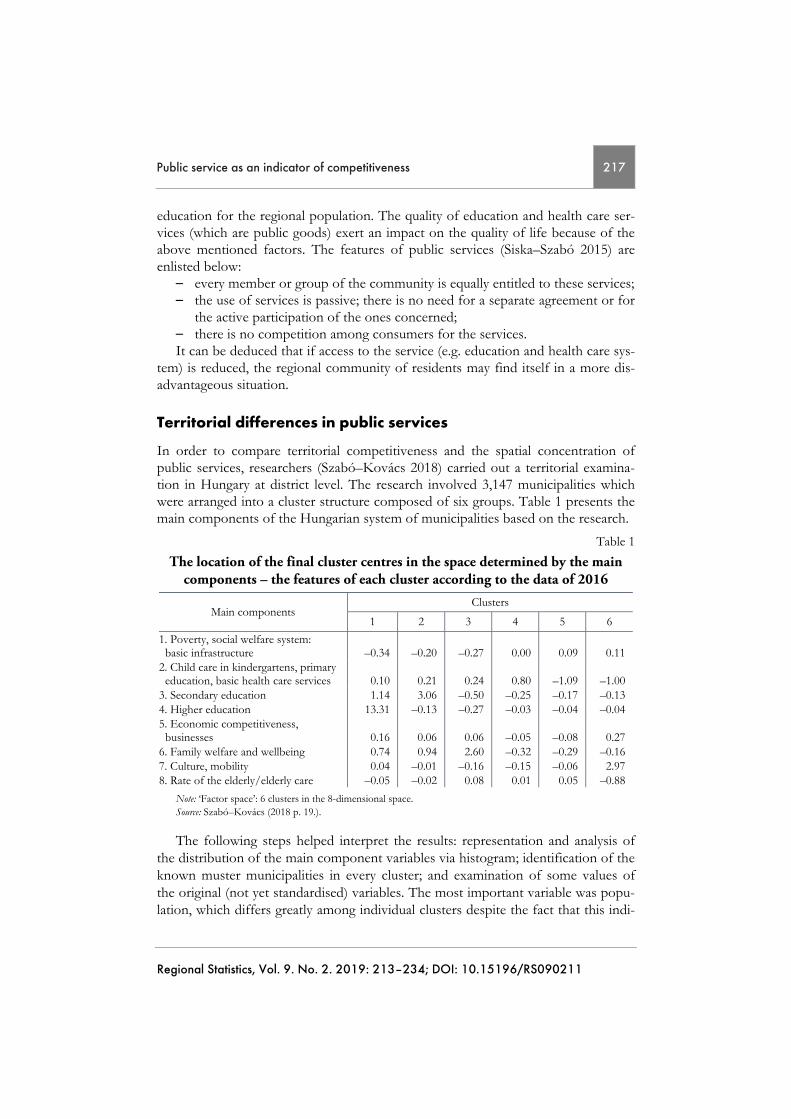
In order to compare territorial competitiveness and the spatial concentration of public services, researchers (Szabó–Kovács 2018) carried out a territorial examina-tion in Hungary at district level. The research involved 3,147 municipalities which were arranged into a cluster structure composed of six groups. Table 1 presents the main components of the Hungarian system of municipalities based on the research.
Table 1
The location of the final cluster centres in the space determined by the main components – the features of each cluster according to the data of 2016
Main components Clusters
1 2 3 4 5 6
1. Poverty, social welfare system: basic infrastructure –0.34 –0.20 –0.27 0.00 0.09 0.11 2. Child care in kindergartens, primary education, basic health care services 0.10 0.21 0.24 0.80 –1.09 –1.00 3. Secondary education 1.14 3.06 –0.50 –0.25 –0.17 –0.13 4. Higher education 13.31 –0.13 –0.27 –0.03 –0.04 –0.04 5. Economic competitiveness, businesses 0.16 0.06 0.06 –0.05 –0.08 0.27 6. Family welfare and wellbeing 0.74 0.94 2.60 –0.32 –0.29 –0.16 7. Culture, mobility 0.04 –0.01 –0.16 –0.15 –0.06 2.97 8. Rate of the elderly/elderly care –0.05 –0.02 0.08 0.01 0.05 –0.88
Note: ‘Factor space’: 6 clusters in the 8-dimensional space. Source: Szabó–Kovács (2018 p. 19.).
The following steps helped interpret the results: representation and analysis of the distribution of the main component variables via histogram; identification of the known muster municipalities in every cluster; and examination of some values of the original (not yet standardised) variables. The most important variable was popu-lation, which differs greatly among individual clusters despite the fact that this indi-
218 Tamás Szabó
Regional Statistics, Vol. 9. No. 2. 2019: 213–234; DOI: 10.15196/RS090211
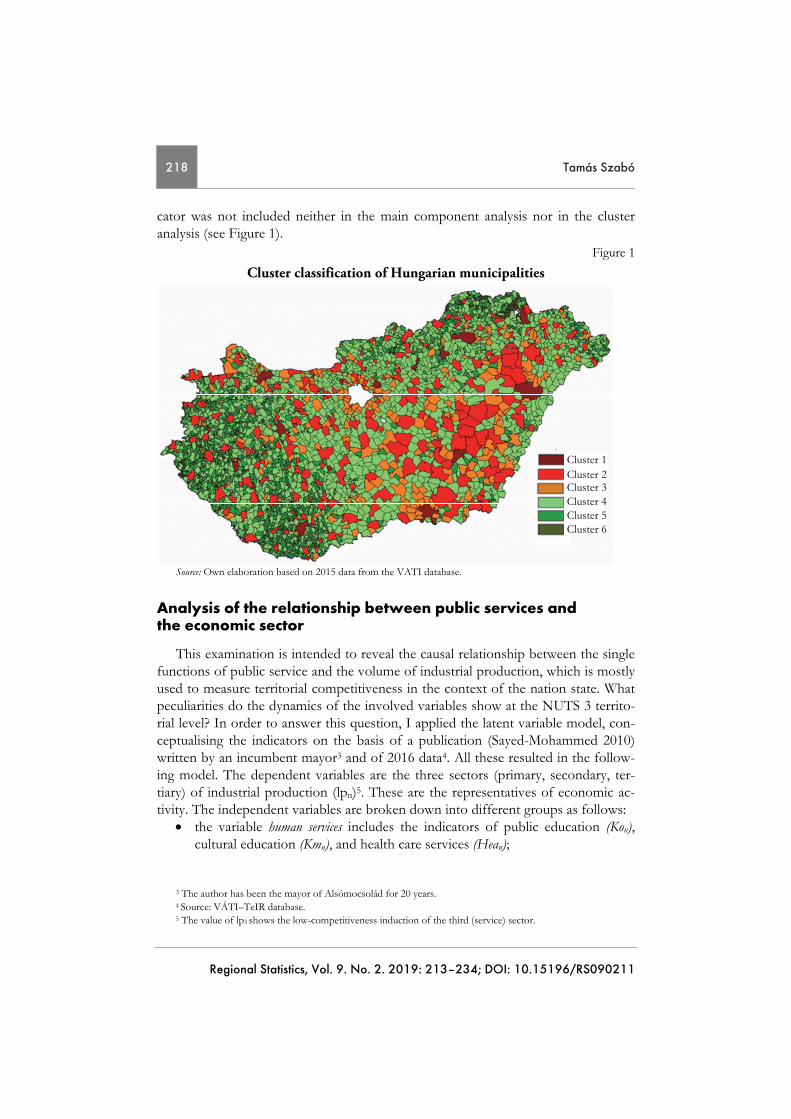
cator was not included neither in the main component analysis nor in the cluster analysis (see Figure 1).
Figure 1
Cluster classification of Hungarian municipalities
Cluster 1 Cluster 2 Cluster 3 Cluster 4 Cluster 5 Cluster 6
Source: Own elaboration based on 2015 data from the VATI database.
Analysis of the relationship between public services and the economic sector
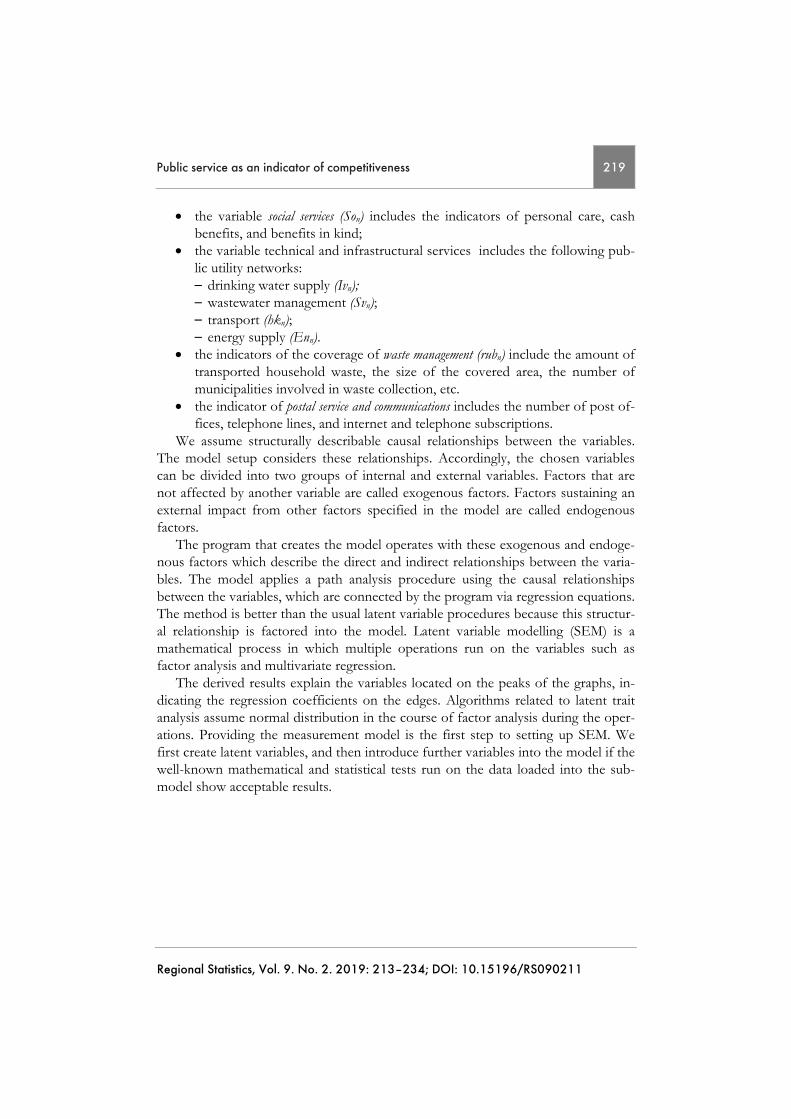
This examination is intended to reveal the causal relationship between the single functions of public service and the volume of industrial production, which is mostly used to measure territorial competitiveness in the context of the nation state. What peculiarities do the dynamics of the involved variables show at the NUTS 3 territo-rial level? In order to answer this question, I applied the latent variable model, con-ceptualising the indicators on the basis of a publication (Sayed-Mohammed 2010) written by an incumbent mayor3 and of 2016 data4. All these resulted in the follow-ing model. The dependent variables are the three sectors (primary, secondary, ter-tiary) of industrial production (lpn)5. These are the representatives of economic ac-tivity. The independent variables are broken down into different groups as follows:
the variable human services includes the indicators of public education (Kon), cultural education (Kmn), and health care services (Hean);
3 The author has been the mayor of Alsómocsolád for 20 years. 4 Source: VÁTI–TeIR database. 5 The value of lp3 shows the low-competitiveness induction of the third (service) sector.
Public service as an indicator of competitiveness 219
Regional Statistics, Vol. 9. No. 2. 2019: 213–234; DOI: 10.15196/RS090211
the variable social services (Son) includes the indicators of personal care, cash benefits, and benefits in kind;
the variable technical and infrastructural services includes the following pub-lic utility networks: – drinking water supply (Ivn); – wastewater management (Svn); – transport (hkn); – energy supply (Enn).
the indicators of the coverage of waste management (rubn) include the amount of transported household waste, the size of the covered area, the number of municipalities involved in waste collection, etc.
the indicator of postal service and communications includes the number of post of-fices, telephone lines, and internet and telephone subscriptions.
We assume structurally describable causal relationships between the variables. The model setup considers these relationships. Accordingly, the chosen variables can be divided into two groups of internal and external variables. Factors that are not affected by another variable are called exogenous factors. Factors sustaining an external impact from other factors specified in the model are called endogenous factors.
The program that creates the model operates with these exogenous and endoge-nous factors which describe the direct and indirect relationships between the varia-bles. The model applies a path analysis procedure using the causal relationships between the variables, which are connected by the program via regression equations. The method is better than the usual latent variable procedures because this structur-al relationship is factored into the model. Latent variable modelling (SEM) is a mathematical process in which multiple operations run on the variables such as factor analysis and multivariate regression.
The derived results explain the variables located on the peaks of the graphs, in-dicating the regression coefficients on the edges. Algorithms related to latent trait analysis assume normal distribution in the course of factor analysis during the oper-ations. Providing the measurement model is the first step to setting up SEM. We first create latent variables, and then introduce further variables into the model if the well-known mathematical and statistical tests run on the data loaded into the sub-model show acceptable results.
220 Tamás Szabó
Regional Statistics, Vol. 9. No. 2. 2019: 213–234; DOI: 10.15196/RS090211
Figure 2
Latent variable modelling
Sour
ce: A
utho
r’s o
wn
elab
orat
ion
with
Sm
artP
LS
3.0.
Public service as an indicator of competitiveness 221
Regional Statistics, Vol. 9. No. 2. 2019: 213–234; DOI: 10.15196/RS090211
Among the indicators of drinking water supply, the variable ‘number of households connected to the public utility drinking water network’ (lv2) is significant for competitiveness and logically acceptable6, since an increase in housing construction represents eco-nomic boom and a favourable legal environment. The length of pipelines in the drinking water network and number of households connected to this network are more static, and therefore less able to indicate economic processes, as clearly re-vealed by the values of lv1 and lv3. Among wastewater management indicators, only the investment-intensive indicators (Sv2, Sv3, Sv5, Sv6) represent economic develop-ment, though at a high significance level (≤ 0.7). In the human services category, the number of service hours of the general practitioner per week (Hea1) is not a signifi-cant indicator from an economic aspect, while other indicators in relation to health care infrastructure and access to medical specialists (Hea1-9) may have strong effects since concentration of population is a prerequisite for high access to doctors’ ser-vices. At the same time, when examined separately, these high-degree causal links – particularly the number of doctor’s visits (Hea5) – could refer to a bad health con-dition in the resident population or even to an ageing society. However, this is not the case here since competitiveness and human services are internal factors affecting each other significantly (0.898).
For cultural education, the variables ‘number of creative educational communities’ (Km1) and ‘number of members of creative educational communities’ (Km6) are irrelevant to competi-tiveness (Egedy et al. 2018). The same goes for ‘number of computers in public educational institutions (considering the seat of the institution)’ (Ko1) since it also has a low (and moreo-ver negative7) value.
The link between competitiveness and social status can also be observed in the social provision for the regional resident population. Although one indicator (‘the number of daytime nurses and carers employed in basic social provision’ (So2)) may be consid-ered as low, the other dimensions (So1 and So3-5) – public services provided to the elderly and social benefits – show strong causal links. The dynamics of the internal model between competitiveness and social provisions is negative (–2.012), with a strong indirect effect between the two variables.
One observes an opposite effect between the competitiveness of a region and the level of use of its social provision system. In relation to local transport, the model shows three weak indicators (hk1, hk4 and hk5). The variables ‘average age of buses’, ‘number of relations in local transport’, and ‘number of buses in local transport’ depend on the density of the region’s resident population and, according to the result (0.05–0.4), cannot be directly linked to competitiveness. However, the frequency of transport services, passenger-kilometres, and passenger capacity show strong (0.8–1.0) causal links. The internal model shows a slight indirect effect (0.46)
6 According to the cited literature, the acceptable value is ≤ 0.5. 7 We assume an indirect effect, which may arise from the location concentration.
222 Tamás Szabó
Regional Statistics, Vol. 9. No. 2. 2019: 213–234; DOI: 10.15196/RS090211
between mobility and competitiveness which can be explained by the centre-periphery effect. The deployment of mobility infrastructure and satisfactory access to public services in some cases – through labour force mobility – exert an opposite effect on competitiveness (Siska–Szabó 2015, Tóth–Nagy 2016).
Among the indicators of ‘energy supply’, only ‘amount of electricity provided to the house-holds’ appears to be irrelevant (En2 = 0.239), while other parameters, which are also infrastructure dependent, have very strong causal relationships with competitive-ness. It is also clear that the energy supply variable has only a moderately significant effect on competitiveness. Higher values, which relate to network deployment, in-frastructure provision and energy consumption, show the same level of variation.
Weak (kh2) or unacceptable (kh9,10) indicator values of the ‘post and communica-tions’ variable refer to postal services, while stronger values (≤ 0.70–1.016) are relat-ed to the deployment of network services (e.g. telephone and internet subscrip-tions). Among the indicators of competitiveness industrial production (lp1) exerts a very strong, and manufacturing (lp2) a moderately strong effect on the territorial competitiveness at the Hungarian NUTS 3 level. Public services have a significant correlation with competitiveness in both the endogenous and exogenous parts of the model.
The relationship between endogenous resources and public services
The issue of resource allocation of public goods is quite often addressed in the in-ternational literature (Samuelson–Nordhaus 2012, Huang et al. 2015). According to Jones–Williams (1998), the answer is in the limit of substitution. The authors claim that the input for the production of one public service is dispensable during the production process, and replaceable with an additional unit of the production of another public service, with the supply level remaining unchanged. Therefore, if we assume that the technical substitution disadvantage for capital and labour during the production of a public good is equal to one unit, then the replacement loss for the public good is equal to the technical substitution disadvantage for capital and the value of production. This fiscal approach is acceptable, but the territorial lack of social latent functions, quantifiable costs, and public services from a management perspective may trigger an erosion8 that may damage the economy.
Therefore, the substitutability of public services is not evident in all cases be-cause, according to Marshall’s theory,9 the consumption disadvantage emerging from the lack of two different types of public goods is not the same because their
8 Examples are domestic migration, alteration of the demographic and/or cohort structure of the municipalities. 9 Alfred Marshall’s consumer surplus theory culminates in the consumer limit: a family’s opportunities to
replace public services are hampered by its financial conditions.
Public service as an indicator of competitiveness 223
Regional Statistics, Vol. 9. No. 2. 2019: 213–234; DOI: 10.15196/RS090211
replacement differentiates between them (Bódi–Horváth 2012), and exerts a nega-tive external effect on the basis of social status and financial position.
The competitiveness impact of public services lies in supply. As the previously outlined model shows, public goods which arise from public services may have a population concentration effect as well, since consumers centre on a broader market of providers. In the field of social sciences, particularly within economic theories, there are two branches of science which deal with the interpretation of competitive-ness. These are economics and organisation and management sciences. The above mentioned branches of science have different approaches when it comes to compet-itiveness, because their basic assumptions are different (Némethné Gál 2009). In this regard, regional economics focuses on restricted access to goods and on compe-tition between companies for a better economic environment.
Therefore, the territorial units also compete, on the one hand, for economic in-vestors – since they are the key to development – and, on the other hand, for public administration and tax legislation advantages. Effective access to the latter ad-vantages is vital for the expansion of opportunities which can be provided to the investors (Cserny et al. 2016).
Table 2 – which contains the different theoretical approaches – is a summary of the different strategies which determine competition.
Table 2
Summary of tangential theories of territorial competitiveness
Theoretical aspects of the explanation of terri-torial competitiveness
Indicators related to the theories
1. Neoclassical theory Number and volume of investments Initial boundary conditions Human resources
2. New growth theory Endogenous technological factors Intensity of innovation
3. Theory of competition based on cost ad-vantages
Labour cost Cost and price of state inputs
4. Theory of knowledge-based factor Characteristics of input factors Characteristics of output factors
5. Geo-economic theory
Impacts of agglomeration Urbanisation Costs of transportation Economy of scale factors Sectoral specifications
Note: These theories are typically based on measures like high GDP per capita or GDP per working hour. Source: Author’s own elaboration based on Lukovics (2007).
According to the neoclassical theory (Samuelson–Nordhaus 2012), the market facilitates territorial convergence, so market mechanisms do not need state interven-tion. According to the theory, income differences level off due to production factors.
224 Tamás Szabó
Regional Statistics, Vol. 9. No. 2. 2019: 213–234; DOI: 10.15196/RS090211
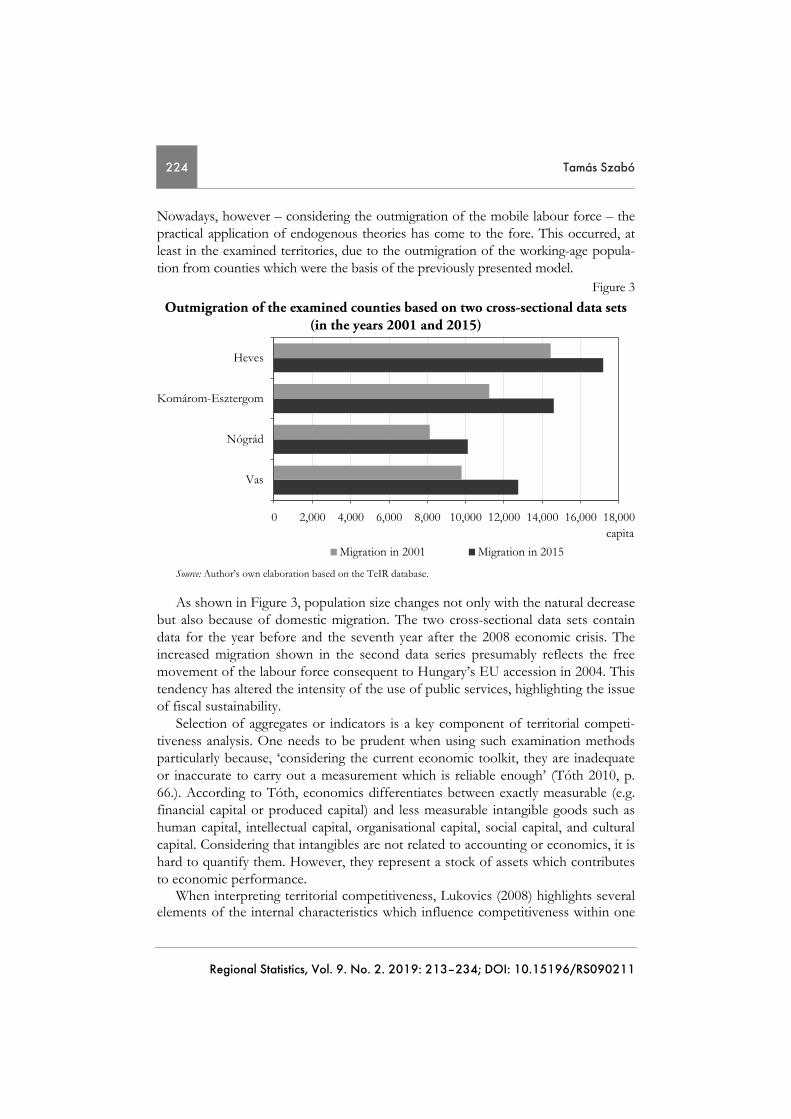
Nowadays, however – considering the outmigration of the mobile labour force – the practical application of endogenous theories has come to the fore. This occurred, at least in the examined territories, due to the outmigration of the working-age popula-tion from counties which were the basis of the previously presented model.
Figure 3
Outmigration of the examined counties based on two cross-sectional data sets (in the years 2001 and 2015)
0 2,000 4,000 6,000 8,000 10,000 12,000 14,000 16,000 18,000
Vas
Nógrád
Komárom-Esztergom
Heves
capita
Migration in 2001 Migration in 2015 Source: Author’s own elaboration based on the TeIR database.
As shown in Figure 3, population size changes not only with the natural decrease but also because of domestic migration. The two cross-sectional data sets contain data for the year before and the seventh year after the 2008 economic crisis. The increased migration shown in the second data series presumably reflects the free movement of the labour force consequent to Hungary’s EU accession in 2004. This tendency has altered the intensity of the use of public services, highlighting the issue of fiscal sustainability.
Selection of aggregates or indicators is a key component of territorial competi-tiveness analysis. One needs to be prudent when using such examination methods particularly because, ‘considering the current economic toolkit, they are inadequate or inaccurate to carry out a measurement which is reliable enough’ (Tóth 2010, p. 66.). According to Tóth, economics differentiates between exactly measurable (e.g. financial capital or produced capital) and less measurable intangible goods such as human capital, intellectual capital, organisational capital, social capital, and cultural capital. Considering that intangibles are not related to accounting or economics, it is hard to quantify them. However, they represent a stock of assets which contributes to economic performance.
When interpreting territorial competitiveness, Lukovics (2008) highlights several elements of the internal characteristics which influence competitiveness within one
Public service as an indicator of competitiveness 225
Regional Statistics, Vol. 9. No. 2. 2019: 213–234; DOI: 10.15196/RS090211
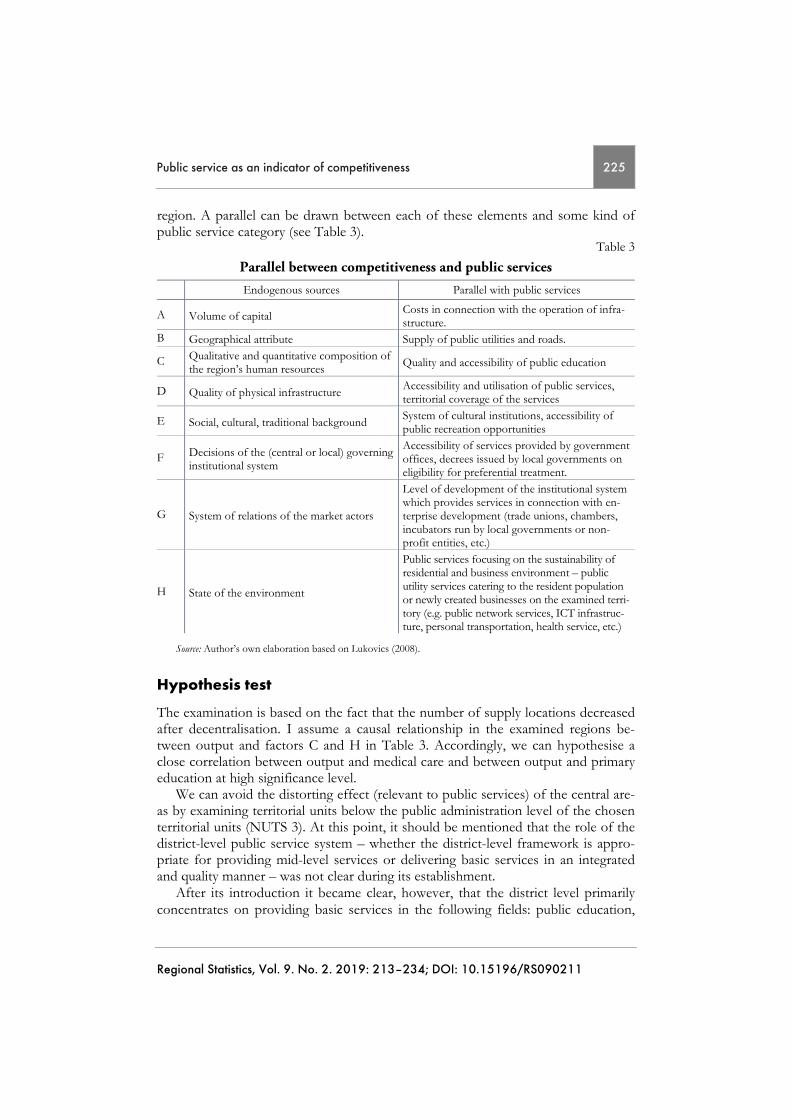
region. A parallel can be drawn between each of these elements and some kind of public service category (see Table 3).
Table 3
Parallel between competitiveness and public services
Endogenous sources Parallel with public services
A Volume of capital Costs in connection with the operation of infra-structure.
B Geographical attribute Supply of public utilities and roads.
C Qualitative and quantitative composition of the region’s human resources Quality and accessibility of public education
D Quality of physical infrastructure Accessibility and utilisation of public services, territorial coverage of the services
E Social, cultural, traditional background System of cultural institutions, accessibility of public recreation opportunities
F Decisions of the (central or local) governing institutional system
Accessibility of services provided by government offices, decrees issued by local governments on eligibility for preferential treatment.
G System of relations of the market actors
Level of development of the institutional system which provides services in connection with en-terprise development (trade unions, chambers, incubators run by local governments or non-profit entities, etc.)
H State of the environment
Public services focusing on the sustainability of residential and business environment – public utility services catering to the resident population or newly created businesses on the examined terri-tory (e.g. public network services, ICT infrastruc-ture, personal transportation, health service, etc.)
Source: Author’s own elaboration based on Lukovics (2008).
Hypothesis test
The examination is based on the fact that the number of supply locations decreased after decentralisation. I assume a causal relationship in the examined regions be-tween output and factors C and H in Table 3. Accordingly, we can hypothesise a close correlation between output and medical care and between output and primary education at high significance level.
We can avoid the distorting effect (relevant to public services) of the central are-as by examining territorial units below the public administration level of the chosen territorial units (NUTS 3). At this point, it should be mentioned that the role of the district-level public service system – whether the district-level framework is appro-priate for providing mid-level services or delivering basic services in an integrated and quality manner – was not clear during its establishment.
After its introduction it became clear, however, that the district level primarily concentrates on providing basic services in the following fields: public education,

226 Tamás Szabó
Regional Statistics, Vol. 9. No. 2. 2019: 213–234; DOI: 10.15196/RS090211
social and health care services, protection of families, children, and the youth, library service, local public transport, public road maintenance and surveillance over local government financial management (Kovács–Somlyódyné 2008).
The examinations carried out on the public education and the health care sys-tems as described above suggest that the county-level relationships have a higher level of significance than the district level.
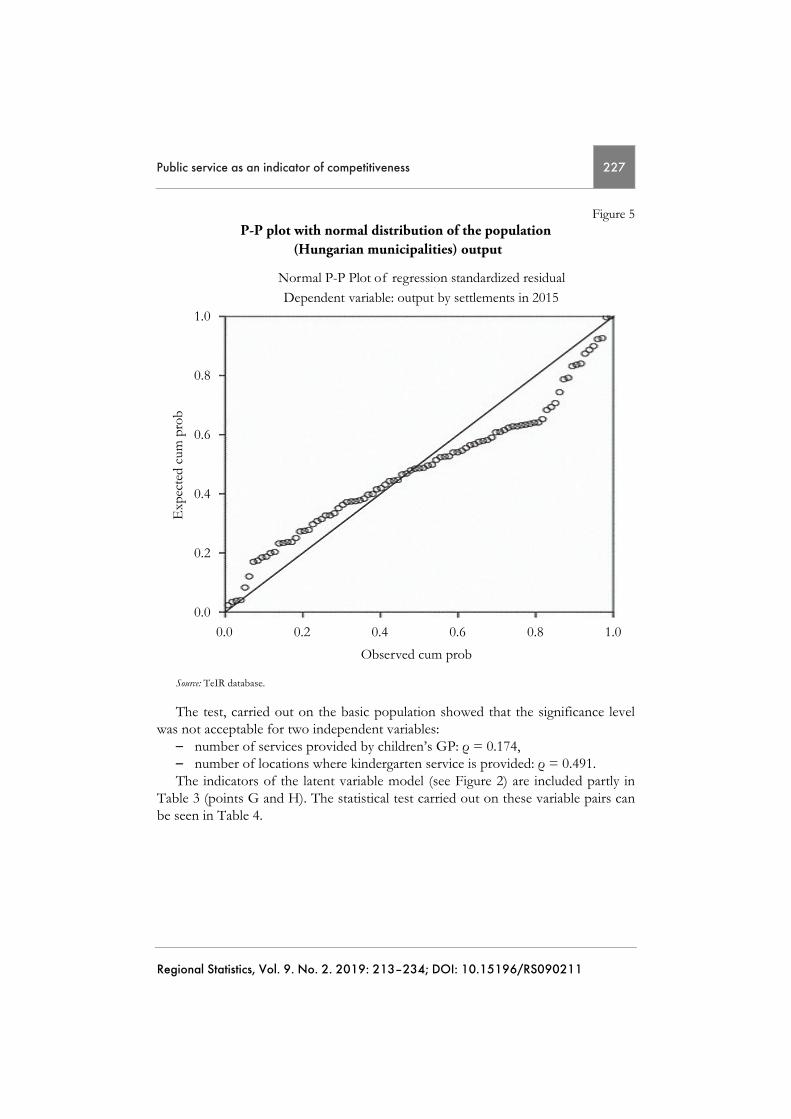
Among the public services affected by the Hungarian public administration re-form, elementary level public education and basic health care were included in the model as independent variables. Output10 was treated as the dependent variable. To demonstrate the adequacy of the criteria laid down for the method (two-sample t-test) chosen for the statistical test, I carried out a normality test on the basic population (of the municipalities of Hungary) examined. A normal distribution is a prerequisite for the two-sample t-test (Neuhauser 2002, Rochon et al. 2012, Rasch et al. 2011). Figures 4 and 5 demonstrate the analysis results of the municipalities’ output data.
Figure 4 Histogram with normal distribution of the population
(Hungarian municipalities) output
06420–2
60
50
40
30
20
10
Freq
uenc
y
Regression standardized residual
Dependent variable: output by settlements in 2015
Mean: 6,17E–16Std.Dev=0.966
N=3,136
Source: TeIR database.
10 I considered output a better indicator of competitiveness because it is free from seasonal effects
(e.g. tourism), unlike the indicator of gross added value.
Public service as an indicator of competitiveness 227
Regional Statistics, Vol. 9. No. 2. 2019: 213–234; DOI: 10.15196/RS090211
Figure 5 P-P plot with normal distribution of the population
(Hungarian municipalities) output
0.0
1.0
0.8
0.6
0.4
0.2
Exp
ecte
d cu
m p
rob
0.0 1.00.80.60.40.2
Observed cum prob
Dependent variable: output by settlements in 2015
Normal P-P Plot of regression standardized residual
Source: TeIR database.
The test, carried out on the basic population showed that the significance level was not acceptable for two independent variables:
– number of services provided by children’s GP: ρ = 0.174, – number of locations where kindergarten service is provided: ρ = 0.491. The indicators of the latent variable model (see Figure 2) are included partly in
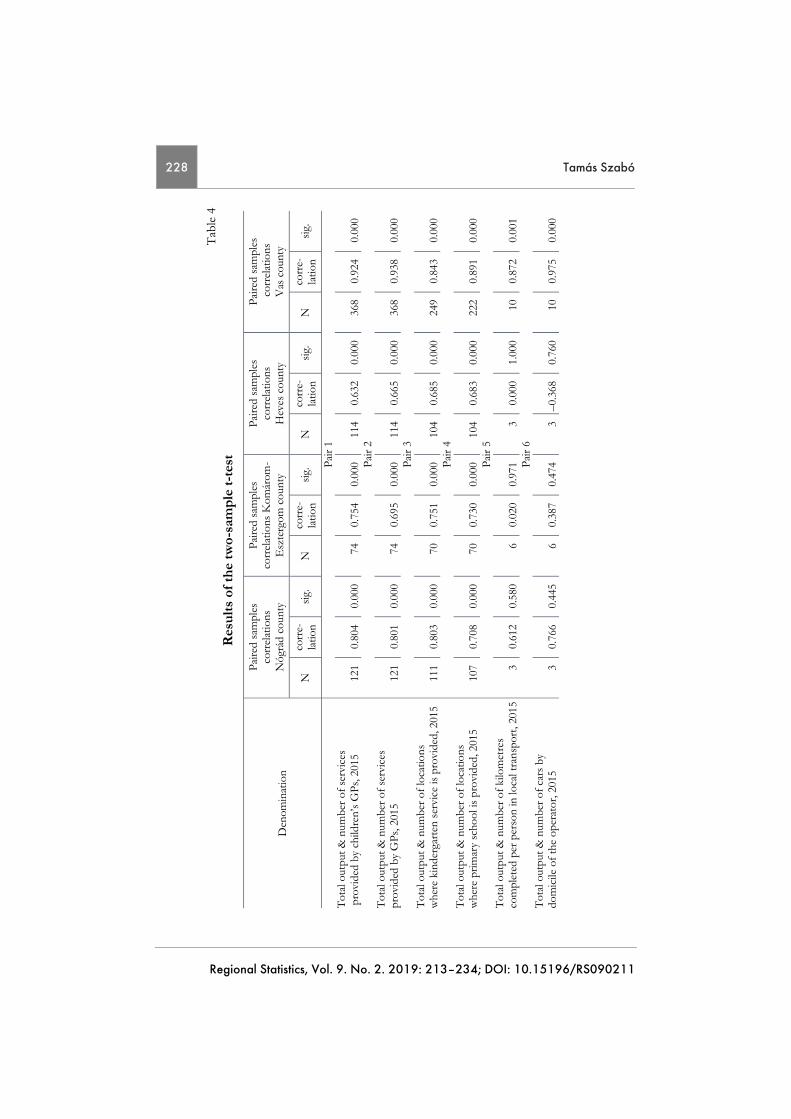
Table 3 (points G and H). The statistical test carried out on these variable pairs can be seen in Table 4.
228 Tamás Szabó
Regional Statistics, Vol. 9. No. 2. 2019: 213–234; DOI: 10.15196/RS090211
Tab
le 4
Res
ults
of t
he tw
o-sa
mpl
e t-t
est
Den
omin
atio
n
Paire
d sa
mpl
es
corr
elat
ions
N
ógrá
d co
unty
Paire
d sa
mpl
es
corr
elat
ions
Kom
árom
-E
szte
rgom
cou
nty
Paire
d sa
mpl
es
corr
elat
ions
H
eves
cou
nty
Paire
d sa
mpl
es
cor
rela
tions
V
as c
ount
y
N
corr
e-la
tion
sig.
N
co
rre-
latio
nsi
g.
N
corr
e-la
tion
sig.
N
co
rre-
latio
n si
g.
Pa
ir 1
Tot
al o
utpu
t & n
umbe
r of
ser
vice
s p
rovi
ded
by c
hild
ren’
s G
Ps, 2
015
121
0.80
4 0.
000
740.
754
0.00
011
40.
632
0.00
0 36
8 0.
924
0.00
0
Pair
2T
otal
out
put &
num
ber
of s
ervi
ces
pr
ovid
ed b
y G
Ps, 2
015
121
0.80
1 0.
000
740.
695
0.00
011
40.
665
0.00
0 36
8 0.
938
0.00
0
Pair
3T
otal
out
put &
num
ber
of lo
catio
ns
whe
re k
inde
rgar
ten
serv
ice
is p
rovi
ded,
201
5 11
1 0.
803
0.00
070
0.75
10.
000
104
0.68
5 0.
000
249
0.84
3 0.
000
Pa
ir 4
Tot
al o
utpu
t & n
umbe
r of
loca
tions
w
here
prim
ary
scho
ol is
pro
vide
d, 2
015
107
0.70
8 0.
000
700.
730
0.00
010
40.
683
0.00
0 22
2 0.
891
0.00
0
Pair
5T
otal
out
put &
num
ber
of k
ilom
etre
s
com
plet
ed p
er p
erso
n in
loca
l tra
nspo
rt, 2
015
3 0.
612
0.58
06
0.02
00.
971
30.
000
1.00
0 10
0.
872
0.00
1
Pair
6T
otal
out
put &
num
ber
of c
ars
by
dom
icile
of
the
oper
ator
, 201
5 3
0.76
6 0.
445
60.
387
0.47
43
–0.3
68
0.76
0 10
0.
975
0.00
0
Public service as an indicator of competitiveness 229
Regional Statistics, Vol. 9. No. 2. 2019: 213–234; DOI: 10.15196/RS090211
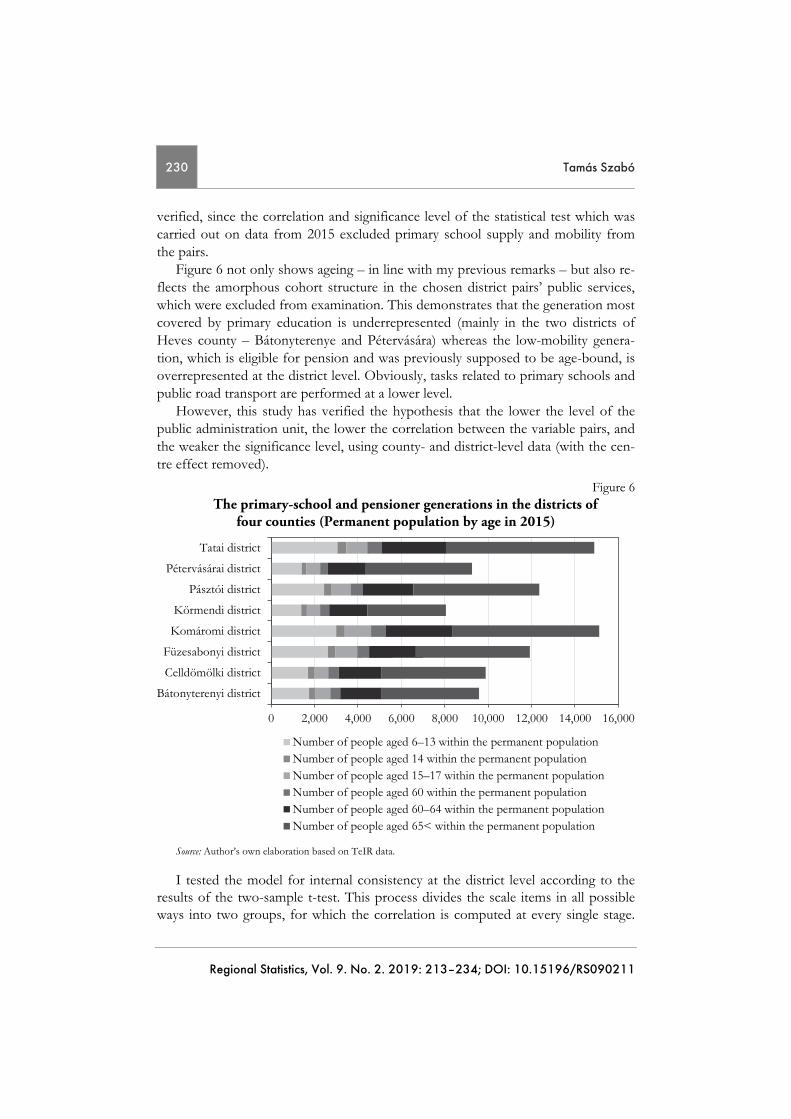
As the table shows, public services and the volume of output clearly have a close relationship in three of the examined Hungarian counties. The relationship between the intensity of GPs’ service provision and public education (pairs 1, 2, 3, and 4) can be considered strong because both correlation (ρ ≤ .75) and significance level (t=.000) are strong. Also, we can find strong correlation between health services and economic activities (see table 5). The results for local (urban) transport are barely interpretable (probably because of the low sample size [Neuhauser 2002]), and a strong connection with the output can be found only for the county of Vas. In addi-tion, the data series refers only to public road transport (pairs 5 and 6), but does not include railway transport. We could obtain sophisticated results with the inclusion of this indicator in the model. Overall, the above mentioned values clearly verify my first hypothesis – namely, that public education and basic health care service have a strong connection with output. This confirms indirectly, that accessibility and sup-ply of services affect territorial competitiveness as well. Figure 6 shows that output exerts a boosting effect on public education in the first two counties (Heves and Komárom-Esztergom). Furthermore, medical care requires a lower level of intensity in these counties. This is certainly because working-age people are concentrated in territories with relatively higher output levels and they need less medical care. This of course raises a question: how do the above mentioned facts differentiate the public administration status of municipalities? A comparison between Figures 3 and 4 reveals that out of the four counties, Nógrád witnessed the lowest change in population size during the period examined and – probably because of the large number of small villages concentrated in the county – provided a low level of medi-cal care (Bódi–Horváth 2012). This fact is representative of the overall picture of an ageing population of permanent residents who are rather unwilling to change their residential status. The two-sample t-test did not produce any interpretable results of mobility indicators and number of basic education institutions for pairs of districts with similar size and number of permanent residents within the same county.
Table 5 Correlations in sample pairs
Denomination N Correlation Sig.
Pair 2 Total output (2015) & Number of services provided by GPs (2015) 8 0.815 0.014
Pair 3 Total output (2015) & Number of services provided by children’s GPs (2015) 8 0.711 0.048
The above result may be due to a demographic or ethnic factor while the lack of accessible services within the examined location and the travelling habits of the ageing generation may result in the lack of mobility as well (Siska–Szabó 2015). The first presumption about district-level public administration has only been partly
230 Tamás Szabó
Regional Statistics, Vol. 9. No. 2. 2019: 213–234; DOI: 10.15196/RS090211
verified, since the correlation and significance level of the statistical test which was carried out on data from 2015 excluded primary school supply and mobility from the pairs.
Figure 6 not only shows ageing – in line with my previous remarks – but also re-flects the amorphous cohort structure in the chosen district pairs’ public services, which were excluded from examination. This demonstrates that the generation most covered by primary education is underrepresented (mainly in the two districts of Heves county – Bátonyterenye and Pétervására) whereas the low-mobility genera-tion, which is eligible for pension and was previously supposed to be age-bound, is overrepresented at the district level. Obviously, tasks related to primary schools and public road transport are performed at a lower level.
However, this study has verified the hypothesis that the lower the level of the public administration unit, the lower the correlation between the variable pairs, and the weaker the significance level, using county- and district-level data (with the cen-tre effect removed).
Figure 6 The primary-school and pensioner generations in the districts of
four counties (Permanent population by age in 2015)
0 2,000 4,000 6,000 8,000 10,000 12,000 14,000 16,000
Bátonyterenyi district
Celldömölki district
Füzesabonyi district
Komáromi district
Körmendi district
Pásztói district
Pétervásárai district
Tatai district
Number of people aged 6–13 within the permanent populationNumber of people aged 14 within the permanent populationNumber of people aged 15–17 within the permanent populationNumber of people aged 60 within the permanent populationNumber of people aged 60–64 within the permanent populationNumber of people aged 65< within the permanent population
Source: Author’s own elaboration based on TeIR data.
I tested the model for internal consistency at the district level according to the results of the two-sample t-test. This process divides the scale items in all possible ways into two groups, for which the correlation is computed at every single stage.
Public service as an indicator of competitiveness 231
Regional Statistics, Vol. 9. No. 2. 2019: 213–234; DOI: 10.15196/RS090211
The Cronbach’s alpha indicator is the average of all these correlation values. This is the indicator that is most often applied to measure internal consistency, which must reach a threshold of 0.6. The result shows strong internal consistency for the four variable pairs (Cronbach’s alpha = 9.68), (Hair et al. 2017) and even for the inde-pendent variable of the two variable pairs (basic service provision of schools and mobility) which were excluded from the process. However, this result strengthens the hypotheses of two examinations, also verified at the public administration level, namely, that the centralised public service system disadvantages the permanent resi-dent population of the small village regions. It is particularly true for the non-mobile resident population. For them, supplies which are part of the basic supply of public services are hardly – if at all – accessible.
Conclusion
The literature-based examination revealed public service groups which directly af-fect territorial competitiveness. Beside its positive effect, territorial concentration has several non-intended functions among its latent ones because the negative ex-ternalities of economic concentration expand with an increase in population density. Furthermore, the resultant population-draining effect may induce the working-age generation of the surrounding regions11 to migrate (Sayed-Mohammed 2010). In parallel, the villages begin to age, resulting, obviously, in a partial decline of public services.
This paper attempts to analyse the relationship between the regional presence of the state as the provider of public services and the competitiveness factors of the examined area at county and district levels.
It also systematises the potential economic functions of public services and in-ternal resources; furthermore, it points out that such exogenous and endogenous variables are worth including in the model to reveal the connections. These variables have explanatory power regarding competitiveness.
The analysis reveals that an infrastructure-intensive public service environment presupposes strong municipalities as far as competitiveness is concerned. This may lead to resident population concentration, which is a prerequisite for capital inflows. Therefore, the diffusion of public services throughout the regions is a significant factor of competitiveness.
11 NUTS 3 territorial units.
232 Tamás Szabó
Regional Statistics, Vol. 9. No. 2. 2019: 213–234; DOI: 10.15196/RS090211
REFERENCES
BÓDI, F.–HORVÁTH, ZS. (2012): Shadows and ghosts in rural welfare system. In: BODI, F.: Local organization of social services in Hungary: crises – reactions – changes pp. 147–162., Studies in Comparative Social Pedagogies and International Social Work and So-cial Policy (22), Bremen.
BORK, B. H. (1977): Antitrust and the theory of concentrated markets Antitrust Law Journal 46 (3): 873–881.
CSATH, M. (2014): Kormányzati képességek a gazdaságfejlesztésben: pénzügyi stabilitás, gazdasági innováció, versenyképesség. In: KAISER, T. Jó állam mérhetősége II. 75–96., Dialog Campus, Budapest.
CSERNY, Á.–FEKETE, L.–KÁDÁR, K.–KOWALIK, T.–TÓZSA, R.–UGRÓSDY, M. (2016): Ha-tékony közigazgatás. In: BÁGER, G.– BUKOVICS, I.– CSATH, M. –CSERNY, Á.–
FEJES, Z.– GÁRDOS-OROSZ, F.– SZENTE, Z.: A jó állam mérhetősége pp. 233–267., NKE Szolgáltató Kft., Budapest.
DICSŐ, L. (2010): A helyi közszolgáltatások szervezése Települési Önkormányzatok Országos Szövetsége, Budapest.
EGEDY, T.–KOVÁCS, Z.–SZABÓ, B. (2018): Changing geography of the creative economy in Hungary at the beginning of the 21st century Hungarian Geographical Bulletin 67 (3): 275–291. https://doi.org/10.15201/hungeobull.67.3.5
GYURIS, F. (2014): A közjavak térbelisége Tér és Társadalom 28 (4): 15–39. https://doi.org/10.17649/TET.28.4.2650.
HAIR, J. F.–HULT, G. T. M.–RINGLE, C. M.–SARSTEDT, M. (2017): A primer on partial least squares structural equation modeling. 2nd Ed. Thousand Oaks: Sage.
HUANG, K.–WANG, T.–YUAN, C.–ZHENG, X. (2015): Effect of heterogeneous investments on the evolution of cooperation in spatial public goods game PLoS ONE 10 (3): e0120317 https://doi.org/10.1371/journal.pone.0120317
JONES, CHARLES I.–WILLIAMS, JOHN C. (1998): Measuring the Social Return to R&D, The Quarterly Journal of Economics, 113 (4): 1119–1135. https://doi.org/10.1162/003355398555856
KAISER, T. (2014): A kormányzás új formái és a teljesítménymérés problematikája. In: KAI-
SER, T. (szerk.): Hatékony kӧzszolgálat és jó kӧzigazgatás: nemzetkӧzi és európai dimen-ziók pp. 57–94., Nemzeti Közszolgálati Egyetem, Budapest.
KINCSES, Á.–TÓTH, G. (2015): Accessibility models based on the gravity analogy Regional Statistics 5 (1): 137–158. https://doi.org/10.15201/hungeobull.67.3.5
KINCSES, Á.–BÁLINT, L. (2016a): Vándorlási települési hálózatok a Kárpát-medencében. Területi Statisztika 56 (1): 89–108. https://doi.org/10.15196/TS560106
KINCSES, Á.–BÁLINT, L. (2016b): Migration settlement networks in the Carpathian Basin, 2001–2011 Regional Statistics 6 (2): 95–113. https://doi.org/10.15196/RS06205
KOVÁCS, K.–SOMLYÓDINÉ, P. E. (2008): Függőben: Közszolgáltatás-szervezés a kistelepülések világában KSZK, Budapest.
KÖVESDI, L. (1986): A szocialista iparosítás társadalmi és gazdasági feltételeinek kialakulása Vas megyében. In: MÁRIA, K.: Vas megye múltjából pp. 331–353. Szombathelyi Levéltár, Szombathely.
Public service as an indicator of competitiveness 233
Regional Statistics, Vol. 9. No. 2. 2019: 213–234; DOI: 10.15196/RS090211
LADOS, G.–HEGEDŰS, G: (2019): Return migration and identity change: A Hungarian case study Regional Statistics 9 (1): 150–167. https://doi.org/10.15196/RS090109
LAKATOS, M.–RÉDEI, M.–KAPITÁNY, G. (2015): Mobilitás és foglalkoztatás Területi Statiszti-ka 55 (2): 157–179.
LENGYEL, I. (2003): Verseny és területi fejlődés JATEPress, Szeged. LUKOVICS, M. (2007): A lokális térségek versenyképességének elemzése Phd-értekezés, Szegedi
Tudományegyetem, Közgazdaságtudományi Kar, Közgazdaságtudományi Doktori Iskola, Szeged.
LUKOVICS, M. (2008): Térségek versenyképességének mérése, JATEPress, Szeged. MARIBEL, G.–DAVID, U.–ALAIN, F. (2014): Entrepreneurial activity and regional competi-
tiveness: evidence from European entrepreneurial universities The Journal of Tech-nology Transfer 41 (1): 105–131. https://doi.org/10.1007/s10961-014-9377-4
NEMES NAGY, J.–LŐCSEI, H. (2015): Hosszú távú megyei ipari növekedési pályák (1964–2013) Területi Statisztika 55(2): 100–121.
NÉMETHNÉ G., A. (2009): A kis- és középvállalkozások versenyképessége PhD-értekezés, Szé-chenyi István Egyetem, Regionális- és Gazdaságtudományi Doktori Iskola, Győr.
NEUHAUSER, M. (2002): Two-sample tests when variances are unequal Animal Behaviour 63 (4): 823–825. https://doi.org/10.1006/anbe.2002.1993
OZDEMIR, S.–JOHNSON, F. R.–WHITTINGTON, D. (2016): Ideology, public goods and wel-fare valuation: An experiment on allocating government budgets The Journal of Choice Modelling 20: 61–72. https://doi.org/10.1016/j.jocm.2016.07.003
PIWOWARSKI, J. (2018): The concept of sustainable development – The factor of a local security culture, Security Dimensions International and National Studies 25: 30–42. https://doi.org/10.24356/SD/25/1
PÜTZ, T.–SPANGENBERG, M. (2006): Zukünftige Sicherung der Saseinvorsorge. Wie viele Zentrale Orte sind erfordelich? In Informationen zur Raumwnwicklung Heft 6/7.2006: 337–344.
RÁCZ, S. (2017): A posztszocialista Délkelet-Európa térszerkezeti és városhálózati folyamatai Doktori értekezés Pécsi Tudományegyetem, Közgazdaságtudományi Kar, Regionális Poli-tika és Gazdaságtan Doktori Iskola, Pécs.
RASCH, D.–KUBINGER, K. D.–MODER, K. (2011): The two-sample t test: pre-testing its assumptions does not pay off Statistical Papers 52 (1): 219–231.
https://doi.org/10.1007/s00362-009-0224-x ROCHON, J.–GONDAN, M.–KIESER, M. (2012): To test or not to test: Preliminary assessment
of normality when comparing two independent samples BMC Medical Research Methodology 12: 81. https://doi.org/10.1186/1471-2288-12-81
SAMUELSON, P. A.–NORDHAUS, W. D. (2012): Közgazdaságtan Akadémia Kiadó, Budapest. SAYED-MOHAMMED, E. (2010): Falu-város migráció, szegregáció vagy dezurbanizáció? – Kié
legyen a magyar falu? In: BUDAY-SÁNTHA, A.– ERDŐSI, F.–HORVÁTH, GY.: „Félidőben" – Évkönyv 2010/3/7 Pécsi Tudományegyetem, Pécs.
SEBŐK, B. (2015): A szocialista iparosítás társadalmi következményei Szolnok megyében (1950–1970). I–III. Jász-Nagykun-Szolnok Megyei Levéltár Közleményei 13., Szolnok.
SISKA, M.–SZABÓ, T. (2015): Közlekedési preferenciák Magyaroroszágon. Tér Ember Társada-lom 3 (3): 81–100.

234 Tamás Szabó
Regional Statistics, Vol. 9. No. 2. 2019: 213–234; DOI: 10.15196/RS090211
SZABÓ, T.–KOVÁCS, E. (2018): Közszolgáltatások és térbeli koncentráció Polgári Szemle 14 (1–3): 361–382. https://doi.org/10.24307/psz.2018.0829
TÓTH, B. I. (2010): Az immateriális és a területi tőke összefüggései, Tér és Társadalom 24(1): 65–81. https://doi.org/10.17649/TET.24.1.1296
TÓTH, G.–NAGY, Z. (2016): Centrum periféria viszonyok Kelet-Közép-Európa térszerkeze-tében Észak-magyarországi Stratégiai Füzetek 13: 18–31.
VIDA, G. (2016): A vidéki agglomerációk, agglomerálódó térségek és nagyvárosi településegyüttesek versenyképességének sajátosságai. In: LENGYEL, I.–BENEDEK, N.: Térségek versenyképessége, intelligens szakosodása és újraiparsodása pp. 204–222., JATEPress, Szeged.


![ERADIOCARBON, VOL. · ERADIOCARBON, VOL. 8, 1966, P. 213-234] COPENHAGEN RADIOCARBON DATES VII HENRIK TAUBER Carbon-14 Dating Laboratory T)epartment of Natural Sciences, National](https://img.pdfslide.us/doc/110x75/5f692e29411eef2bb00b77cb/eradiocarbon-vol-eradiocarbon-vol-8-1966-p-213-234-copenhagen-radiocarbon.jpg)