Embed Size (px)
Citation preview

Project Title: Regional Socio-Economic Viability Assessment of Shellfish Aquaculture
Jackie Rickards
11/15/2008
This project was funded by the Virginia Coastal Zone Management Program at the
Department of Environmental Quality through Grant FY06 NA06NOS4190241 Task 1.05 of the U.S. Department of Commerce, National Oceanic and Atmospheric Administration, under the Coastal Zone Management Act of 1972, as amended.
The views expressed herein are those of the authors and do not necessarily reflect the views of the U.S. Department of Commerce, NOAA, or any of its subagencies.

Table of Contents
Introduction………………………………………………………………………………………………………..…………….…1 Product 1: Socio-economic regional assessment of select PDC’s in relation to expansion of shellfish aquaculture as an industry……………………………………………………………………..….………….2 2. Approach……………………………………………………………………………….………………………………………….2
3. Findings……………………………………………………………………………………………………………………....…...4
3.1. Aquaculture…………………………………………………………….………………………….…..………..4
3.2. Sustainable Aquaculture………………………………………………………………………….………..5
3.3. An alternative: shellfish aquaculture vs harvesting wild shellfish population..... 6
3.4. Shellfish aquaculture………………………………………………………………………………………….7
3.5. Species involved in shellfish aquaculture…………………………………………………………..9
3.6. Factors or stresses that might contribute to the morality or the poor growth of
these organisms………………………………………………………………………………………..……...10
3.7. Differences between shellfish aquaculture and other forms of aquaculture
(ie. finfish)……………………………………………………………………………………………………………..…11
3.8. Challenges of shellfish aquaculture……………..……………………………………………………..12
3.9. Coexisting with other regional industries…………………………..……………………………....14
3.10. Social, economic or environmental impacts of shellfish aquaculture………….…….14
3.11. Regional advantages gained from shellfish aquaculture………………………………..….15
3.12. Fitting into regional dynamics…………………………………………………………………….……..16
3.13. Managed and/or regulated in the future……………………………………………………..…...17
3.14. Improving dialogue about shellfish aquaculture……………………………………….….…...18
4. Conclusion………………………………………………………………………………………………………………….………..19
5. Discussion………………………………………………………………………………………………………………….………...20
Product 2: Economic impact of alternative wastewater treatment technologies in response to water quality requirements for enhancing aquaculture………………………………………………….…..21 6. Regulations……………………………………………………………………………………………………………………..…...21
7. Technology Summary……………………………………………………………...………………………………………..…23
7.1. Septic tank….………………………………………………………………...........................................24
7.2. Aerobic Treatment Unit (ATU)…………………………………………………………..………….…......24
7.3. Media Filters……………………………………………………………………......................................25
7.4. Marshland Upwelling System…...............................................................................27
7.5. Constructed Wetlands………………………………………………………..……………………..………..28
7.6. Membrane Bioreactor…………………………………………………….…………………………….…..…28
8. Disinfection methods…………………………………………………………….…………………………………..…..……29
8.1. Chemical Disinfection………………………………………………….………………………………….…….29
8.2. Physical Disinfection………………………………………………….…………………………………….…..31
8.3. Photochemical Disinfection………………………………………….…………………………………..….31
9. Effluent dispersal ……………………………………………………………………………………………………………...…32
9.1. Subsurface dispersal……………………………………………………………………………………..….....33
9.2. Surface discharge………………………………………………………………………………………..……..…35
10. Cost assessment……………………………………………………………………....……………………………..……..…35
11. Conducting an alternatives analysis……………………………………………………………………………….……38
12. Work Cited…………………………………………………………………………………………………………….……...…...39
Appendix A: Technology Summary………………………………………………..............................................41
Appendix B: Subsurface Disposal…………………………………………………..............................................46
Introduction
In response to Governor Kaine’s initiative to safeguard shellfish habitat areas and the
sustainability of Virginia’s shellfish aquaculture industry, the Virginia Coastal Zone Management
(CZM) Program and Virginia Department of Environmental Quality (DEQ) combined efforts to
promote shellfish aquaculture across Virginia’s coastal waters and the Eastern Shore. In
September 2007, a Notice of Intended Regulatory Action (NOIRA) was proposed to consider the
establishment of “aquaculture enhancement areas” on the Eastern Shore of Virginia. This
rulemaking did not intend to revise the existing Shellfish Buffer Zone Public Hearing section (9
VAC 25-260-270), but rather it focused on providing additional protection to high quality water.
Besides requiring point source dischargers to conduct an analysis of alternative options to
discharging effluent into designated “aquaculture enhancement areas”, but the Water Board
would be given the ability to disapprove a permit proposal if, through the analysis, it was found
that there was an alternative discharging option that had less of an environmental impact.
Although the Commonwealth has taken initiative to promote shellfish aquaculture, a
need was recognized for a regional evaluation of the usefulness and implications of promoting
shellfish aquaculture across three Planning District Commissions (PDCs), including Accomack-
Northampton, the Middle Peninsula and the Northern Neck. This project considered to aspects
of promoting shellfish aquaculture within the selected PDC regions.
First, a social informant analysis was conducted through key informant interviews in
order to captured stakeholder’s knowledge base and perceptions of aquaculture, population
growth, land/water use conflicts, regulations, and waterfront access. While specific issues often
vary across the three PDCs, there is a need for a social understanding of shellfish aquaculture.
A critical aspect of ensuring the growth and survival of Virginia’s shellfish aquaculture
industry, in the face of increasing coastal population growth, is to maintain stringent water
quality conditions, and thus, a review of alternative wastewater treatment options. This part of
the project will include a cost-effectiveness analysis of alternative wastewater treatment
technologies. The need to evaluate the economic costs of alternative uses for wastewater
treatment is not only desired by DEQ, but local town planners and PDC staff may find this
assessment beneficial.
1

Product 1: Socio-economic regional assessment of select PDC’s in relation to
expansion of shellfish aquaculture as an industry
According to the Virginia Marine Resource Commission (VMRC), shellfish aquaculture is
the propagation, rearing, enhancement and harvesting of hatchery produced molluscan
organisms in controlled or selected environments, which are conducted on the tidal waters of
the Commonwealth. Aquaculture within the Commonwealth of Virginia ranks eighth in the
United States based on the value of total aquaculture products sold (USDA, 2003). It is valued at
approximately $40.9 million (USDA, 2003). Furthermore in 2003, shellfish aquaculture
production in Virginia accounted for approximately 77.3% of all aquaculture saltwater organism
sales (NASS and VDACS, 2003). Respectfully, of the 77.3%, clams (mature) accounted for 76.5%
of those sales (NASS and VDACS, 2003). Though the clam farms in the Commonwealth lead the
nation in the culture of hard clams, both the clam and oyster aquaculture industry continue to
grow.
Decisions regarding the shellfish aquaculture industry in the Commonwealth are a
collaborative effort between a variety of stakeholders, including agriculturalists, local
government, the aquaculture industry, community groups, and realtors/developers. According
to Grimble and Wellard (1997) as well as Petts and Leach (2000), stakeholders are individuals or
groups (organized or unorganized) who have an interest in a particular issue or system. Their
interest may be financial, moral, legal, personal, community based, direct or indirect.
Stakeholders may affect (determine) decisions or actions, while others are affected by decisions
or actions (positive or negative) (Mazur et al., 2004). Finally, it is important to note that
stakeholders have varying degrees of influence in the decision making process as well as varying
degrees of participation (ie. active or passive) (Mazur et al., 2004).
2. Approach
Social perception assessments of aquaculture are few and far between. However,
sociologists studying aquaculture believe that social science can make an important contribution
to understanding the prospects of aquaculture development since many problems related to
this innovation are social and institutional, rather than technical in nature (Bailey, Jentoft, and
Sinclair, 1996). Within countries where the aquaculture industry has shown economic
sustainability in the global market, including Australia, China, Canada, and some Mediterranean
countries, social perceptions have been captured through the implementation of public surveys
2

and key informant interviews. As a result of a thorough literature review a study from the
Australian Government, Bureau of Rural Science in regards to capturing community perceptions
of aquaculture (Mazur, Aslin and Byron, 2005) was used as a model for the construction of the
interview guide used in this project.
Key informant interviews were conducted to collect qualitative data in regards to
shellfish aquaculture. Key informants covered a range of stakeholder groups including local
government, community groups, the aquaculture industry, the agricultural industry and
realtors/developers. In general, key informants are particularly knowledgeable and can
articulate ideas about an issue, and may also provide useful information about what is
happening in subgroups within a community (Patton, 1980). Through a stratified sampling
method key informants were chosen based on particular elements or characteristics of the
homogenous population (Babbie, 1973). In this project geography and occupation (ie.
stakeholder group) were the selection elements. The researcher selected key informants from
the population based on their availability and/or accessibility. Through a convenience sampling
technique, 9 key informants were chosen. The researcher intended to have a total of 10 key
informants for the project, two key informants from each stakeholder group, however due to
the unavailability of realtors/developers as well as a lack of interest, in some cases, in
participating in this project, only one key informant was interviewed for this stakeholder group.
The target population was three PDC regions:
Planning District Commission Counties
Northern Neck Lancaster, Northumberland, Richmond and Westmoreland
Middle Peninsula Essex, Middlesex, Mathews, King and Queen, King William and Gloucester
Accomack-Northampton (Eastern Shore) Northampton and Accomack
Each PDC region falls in “Tidewater Virginia”. According to the Chesapeake Bay
Preservation Act “Tidewater Virginia” is a jurisdictional boundary that defines Virginia’s Coastal
Zone.
Interviews were conducted face-to-face, and over the phone, on a date and at a time
compromised between the key informant and the interviewer. The overall objective was to
gather specific information and insight about shellfish aquaculture from key informants. With
this said, in some interviews the interview guide, which consisted on eleven questions, was
followed in sequential order, while there were other interviews where questions were answered
in no particular order. Not only was the sequence of the interview was dependent by the
3
answers provided by the interviewee, but the researcher used her discretion to order to create a
logical and congruent flow to the interview. Ultimately the questions provided direction for the
answers and questions were adjusted to gain the desired information (Marshall, 2005).
Moreover the questions were open ended to provide the key informant direction in his/her
answer, but the freedom to express their perceptions, opinions, and knowledge of shellfish
aquaculture. Standardized open-ended format, as applied in this study, reduced some inherent
biases which results from interviewing.
Once interviews were conducted, they were transcribed and analyzed. Through a
content analysis, major themes were identified and denote d. Themes encompassed phrases,
words, and concepts that were associated with each other. For instance husbandry was
identified as a theme. While the word husbandry was only specifically mentioned by one
respondent, the theme of husbandry encompassed “raising”, “taking care of”, “cultivation” and
“production” since the definitions of these words all intertwined.
3. Findings
This diverse group of stakeholders, including aquaculturists, agriculturists,
realtors/developers, local government, and community groups, provided information that
spanned the entire knowledge spectrum of shellfish aquaculture. This section will profile a
summary of findings for each question. Within the tables provided below, common themes and
words have been highlighted to showcase repetition amongst the stakeholder groups. It is
important to note that in the majority of cases, when respondents were asked one question
their response answered other questions within the interview guide. The following section
references the question that was asked, however the responses may not have been a direct
response to the question, but information that was provided throughout the entire interview.
3.1. Aquaculture
When respondents were asked to explain aquaculture, in general, or to define
aquaculture, there were two major concepts that were mentioned by interviewees, including
“husbandry” and “harvesting” the organism (Table 1). Although respondents did not
consistently know the particular types of organisms involved in aquaculture, when asked about
aquaculture, at least one respondent from each stakeholder group specifically spoke of shellfish
aquaculture. One respondent from the community group and a respondent from the
4
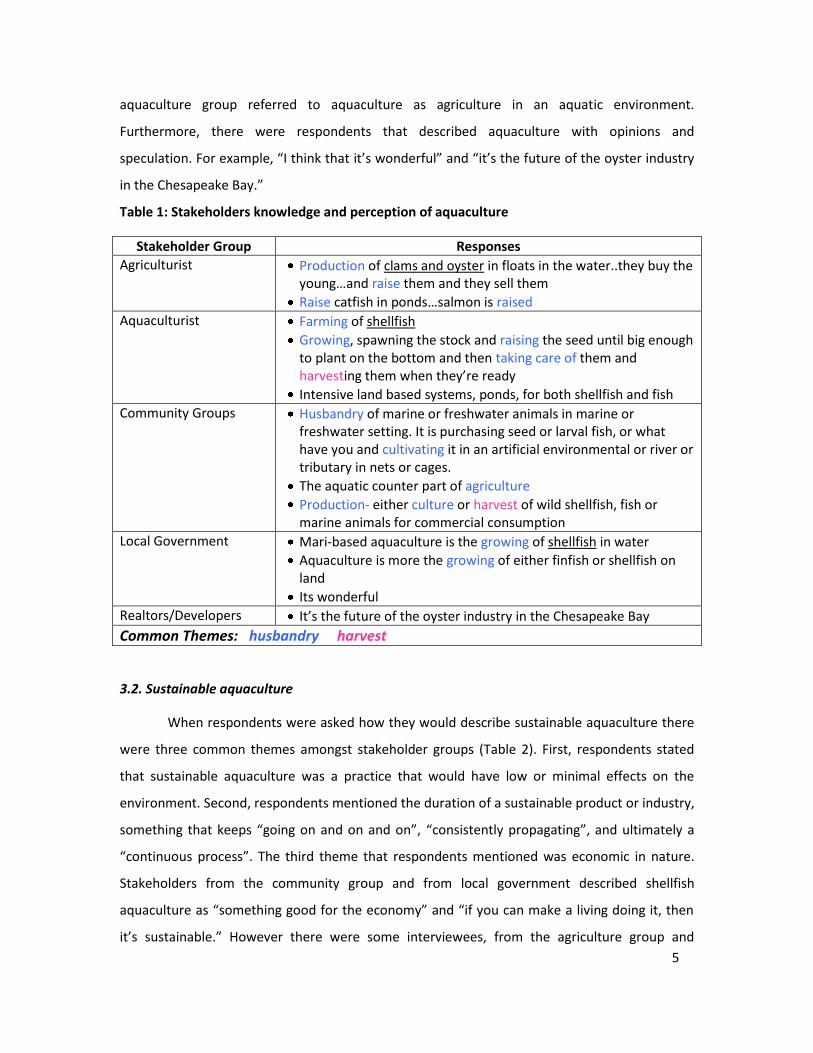
aquaculture group referred to aquaculture as agriculture in an aquatic environment.
Furthermore, there were respondents that described aquaculture with opinions and
speculation. For example, “I think that it’s wonderful” and “it’s the future of the oyster industry
in the Chesapeake Bay.”
Table 1: Stakeholders knowledge and perception of aquaculture
Stakeholder Group Responses
Agriculturist Production of clams and oyster in floats in the water..they buy the young…and raise them and they sell them
Raise catfish in ponds…salmon is raised
Aquaculturist Farming of shellfish
Growing, spawning the stock and raising the seed until big enough to plant on the bottom and then taking care of them and harvesting them when they’re ready
Intensive land based systems, ponds, for both shellfish and fish
Community Groups Husbandry of marine or freshwater animals in marine or freshwater setting. It is purchasing seed or larval fish, or what have you and cultivating it in an artificial environmental or river or tributary in nets or cages.
The aquatic counter part of agriculture
Production- either culture or harvest of wild shellfish, fish or marine animals for commercial consumption
Local Government Mari-based aquaculture is the growing of shellfish in water
Aquaculture is more the growing of either finfish or shellfish on land
Its wonderful
Realtors/Developers It’s the future of the oyster industry in the Chesapeake Bay
Common Themes: husbandry harvest
3.2. Sustainable aquaculture
When respondents were asked how they would describe sustainable aquaculture there
were three common themes amongst stakeholder groups (Table 2). First, respondents stated
that sustainable aquaculture was a practice that would have low or minimal effects on the
environment. Second, respondents mentioned the duration of a sustainable product or industry,
something that keeps “going on and on and on”, “consistently propagating”, and ultimately a
“continuous process”. The third theme that respondents mentioned was economic in nature.
Stakeholders from the community group and from local government described shellfish
aquaculture as “something good for the economy” and “if you can make a living doing it, then
it’s sustainable.” However there were some interviewees, from the agriculture group and
5

realtor/developer group that just commented on the current state of the aquaculture industry
and did not necessarily provide a clear understanding of sustainable aquaculture.
Table 2: Stakeholders knowledge and perception of aquaculture
Stakeholder Group Responses
Agriculturist Low impact…would not impact the environment as much as the environment probably impacts them [shellfish]
It’s good
Aquaculturist Keep it going on and on and on
Consistently propagate a product or an animal with minimal environmental impact
What are you producing, how much negative impact are you having, how much positive impact are you having, how does that balance out
Community Groups Continuing basis producing a quality good product for human consumption with minimal environmental impacts
Something that is good for the environment and something that is good for the economy
Continue in the long term without degrading the resource, while simultaneously being productive and commercially viable
Local Government governmental framework, whether or not the part of the economy is functioning correctly, and whether or not you want that [shellfish aquaculture] as part of your economy
private sector considers it from a profit and loss perceptive, whether or not you can make a living doing it. If you can make a living doing it, then it’s sustainable
Water quality is the bottom line for sustainable aquaculture
Realtors/Developers Hard to get a sustainable with predators in the bay
Common Themes: Environmental Duration Economy
3.3. An alternative: shellfish aquaculture vs harvesting wild shellfish populations
Respondents were asked whether they believed that shellfish aquaculture is an
alternative to harvesting wild shellfish populations. With the exception of one participant
shellfish aquaculture was considered an alternative to harvesting wild shellfish populations
amongst all stakeholder groups. In some cases the respondent matter-of-factly answered the
question with one word, “Sure”, “Yes”, or “Absolutely.” On the contrary one respondent did not
believe that a comparison could be made between shellfish aquaculture and the harvesting of
wild shellfish:
6

“When you harvest wild populations all you do is take….I took hard clams,
and when you harvest the wild populations all you do is take and you never
put anything back. With aquaculture you’re really only taking what you’re
putting in the wild…”
3.4. Shellfish aquaculture
When asked to describe or define shellfish aquaculture there were two major themes
common in responses, husbandry and the technical aspect of shellfish aquaculture (Table 3). All
stakeholder groups, except for the realtor/developer group mentioned a word that could be
associated with husbandry. The second theme that was consistent throughout all stakeholder
groups, to some degree, was the mention of the technical aspect of the shellfish aquaculture.
7
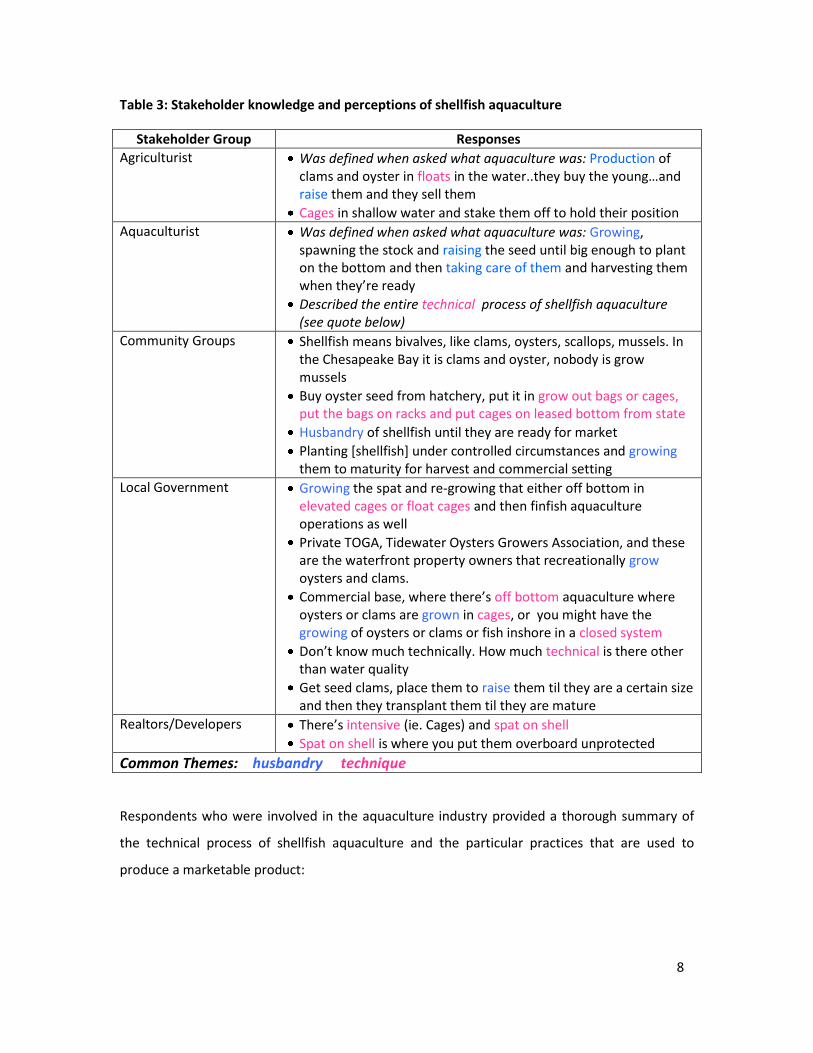
Table 3: Stakeholder knowledge and perceptions of shellfish aquaculture
Stakeholder Group Responses
Agriculturist Was defined when asked what aquaculture was: Production of clams and oyster in floats in the water..they buy the young…and raise them and they sell them
Cages in shallow water and stake them off to hold their position
Aquaculturist Was defined when asked what aquaculture was: Growing, spawning the stock and raising the seed until big enough to plant on the bottom and then taking care of them and harvesting them when they’re ready
Described the entire technical process of shellfish aquaculture (see quote below)
Community Groups Shellfish means bivalves, like clams, oysters, scallops, mussels. In the Chesapeake Bay it is clams and oyster, nobody is grow mussels
Buy oyster seed from hatchery, put it in grow out bags or cages, put the bags on racks and put cages on leased bottom from state
Husbandry of shellfish until they are ready for market
Planting [shellfish] under controlled circumstances and growing them to maturity for harvest and commercial setting
Local Government Growing the spat and re-growing that either off bottom in elevated cages or float cages and then finfish aquaculture operations as well
Private TOGA, Tidewater Oysters Growers Association, and these are the waterfront property owners that recreationally grow oysters and clams.
Commercial base, where there’s off bottom aquaculture where oysters or clams are grown in cages, or you might have the growing of oysters or clams or fish inshore in a closed system
Don’t know much technically. How much technical is there other than water quality
Get seed clams, place them to raise them til they are a certain size and then they transplant them til they are mature
Realtors/Developers There’s intensive (ie. Cages) and spat on shell
Spat on shell is where you put them overboard unprotected
Common Themes: husbandry technique
Respondents who were involved in the aquaculture industry provided a thorough summary of
the technical process of shellfish aquaculture and the particular practices that are used to
produce a marketable product:
8
“*Shellfish aquaculture+ starts with the propagation of mono cultures of
micro algae which is grown in a facility with a combination of UV treatment
and filtration, a small amount of, a very minuscule amount of fertilizer which
is absorbed in the process of propagating the algae and when sufficient
cultures and , in gallons per day, are obtained which takes….about 6
weeks…..simply feed genetically chosen brood stock of virginica oysters or
mercenaria hard clams…for 6 to 8 weeks and then through a temperature
manipulation spawn the brood stock and produce swimming fertilized eggs
and swimming larvae and a post set juvenile animal which is maybe 250
microns in size and at this point these animals are taken out of still culture,
aerated still culture, and put in recirculating systems for a short period of
time, maybe 2 weeks to a month. And eventually you put [them] in an open
flow through system grown for 4 to 6 weeks until they are placed out in the
field in a variety of different procedures to obtain size large enough that
eventually you winter a clam over after its about 10 months old and at that
point you begin…..field propagation or grow out that takes an additional
couple of years until clams are eventually sold to market, or……seed is sold
in various sizes and stages through the propagation process to other field
growers.”
3.5. Species involved in shellfish aquaculture
When asked what species may be involved in shellfish aquaculture, there were a variety
of answers (Table 4). The majority of interviewees knew that in Virginia, oysters and clams were
involved in shellfish aquaculture. Some respondents provided common names of the hard clam
that referenced the size of the hard clam (ie. little neck, cherrystone, middle neck, and top
neck), while there were other respondents that could identify the hard clam (Mercenaria
mercenaria) and the Virginia’s native eastern oyster (Crassostra virginica) by their genius and
specie names.
9

Table 4: Types of “species” that are involved in shellfish aquaculture in Virginia
Stakeholder Group Responses
Agriculturist Oysters
Chinese or Japanese oyster
Clams
Aquaculturist mercenaria hard clam
virginica
hard shell clam
little necks, middle neck and top necks
Community Groups Virginia’s native eastern oyster, Crassostra virginica
Hard clam, Mercenaria mercenaria
Little neck
Cherrystone
Local Government Native Virginia Oysters
Native Virginia clams
Clam
Oyster
Asian oyster
Realtors/Developers Asian oyster
Virginia oyster
3.6. Factors or stresses that might contribute to the mortality or the poor growth of these
organisms
There were a variety of key concepts that were mentioned by respondents, however
“water quality” and environmental factors were the overwhelming answers. One respondent
from the local government group stated, “the temperature of the water is one thing, the dying
off of the vegetation” was a specific contributing factor. Moreover a respondent from the
community group mentioned that due to poor water quality they “have lost 65% of our oyster
crop here in this creek due to persistent algae blooms” and that “low DO levels may make
oysters more susceptible to two protozoan parasites *Dermo and MSX+.” Runoff from agriculture
and urban areas, sedimentation, overboard discharge (point source discharges) and storms were
also mentioned as contributing environmental factors that affected the morality or poor growth
of shellfish. Other concepts were economic, including the initial capital costs, and the demand of
the product, and social, including the stealing of products, use conflict, and the manual labor
involved.
10
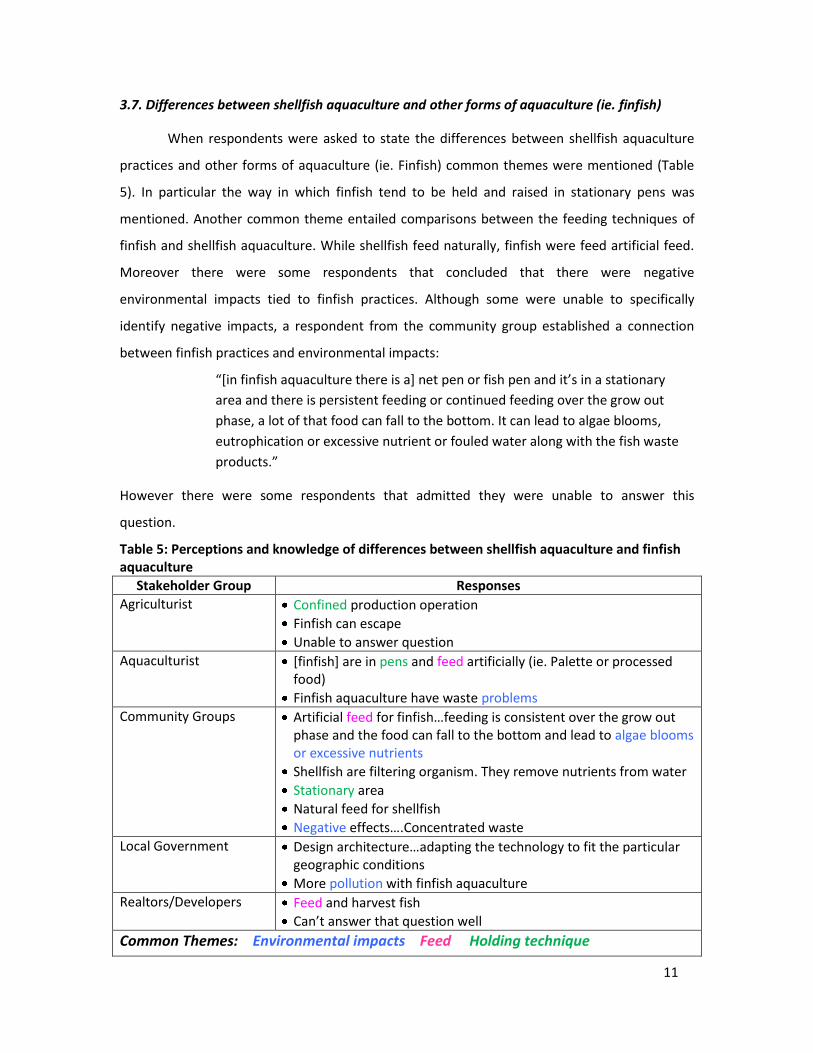
3.7. Differences between shellfish aquaculture and other forms of aquaculture (ie. finfish)
When respondents were asked to state the differences between shellfish aquaculture
practices and other forms of aquaculture (ie. Finfish) common themes were mentioned (Table
5). In particular the way in which finfish tend to be held and raised in stationary pens was
mentioned. Another common theme entailed comparisons between the feeding techniques of
finfish and shellfish aquaculture. While shellfish feed naturally, finfish were feed artificial feed.
Moreover there were some respondents that concluded that there were negative
environmental impacts tied to finfish practices. Although some were unable to specifically
identify negative impacts, a respondent from the community group established a connection
between finfish practices and environmental impacts:
“*in finfish aquaculture there is a+ net pen or fish pen and it’s in a stationary
area and there is persistent feeding or continued feeding over the grow out
phase, a lot of that food can fall to the bottom. It can lead to algae blooms,
eutrophication or excessive nutrient or fouled water along with the fish waste
products.”
However there were some respondents that admitted they were unable to answer this
question.
Table 5: Perceptions and knowledge of differences between shellfish aquaculture and finfish aquaculture
Stakeholder Group Responses
Agriculturist Confined production operation
Finfish can escape
Unable to answer question
Aquaculturist [finfish] are in pens and feed artificially (ie. Palette or processed food)
Finfish aquaculture have waste problems
Community Groups Artificial feed for finfish…feeding is consistent over the grow out phase and the food can fall to the bottom and lead to algae blooms or excessive nutrients
Shellfish are filtering organism. They remove nutrients from water
Stationary area
Natural feed for shellfish
Negative effects….Concentrated waste
Local Government Design architecture…adapting the technology to fit the particular geographic conditions
More pollution with finfish aquaculture
Realtors/Developers Feed and harvest fish
Can’t answer that question well
Common Themes: Environmental impacts Feed Holding technique
11
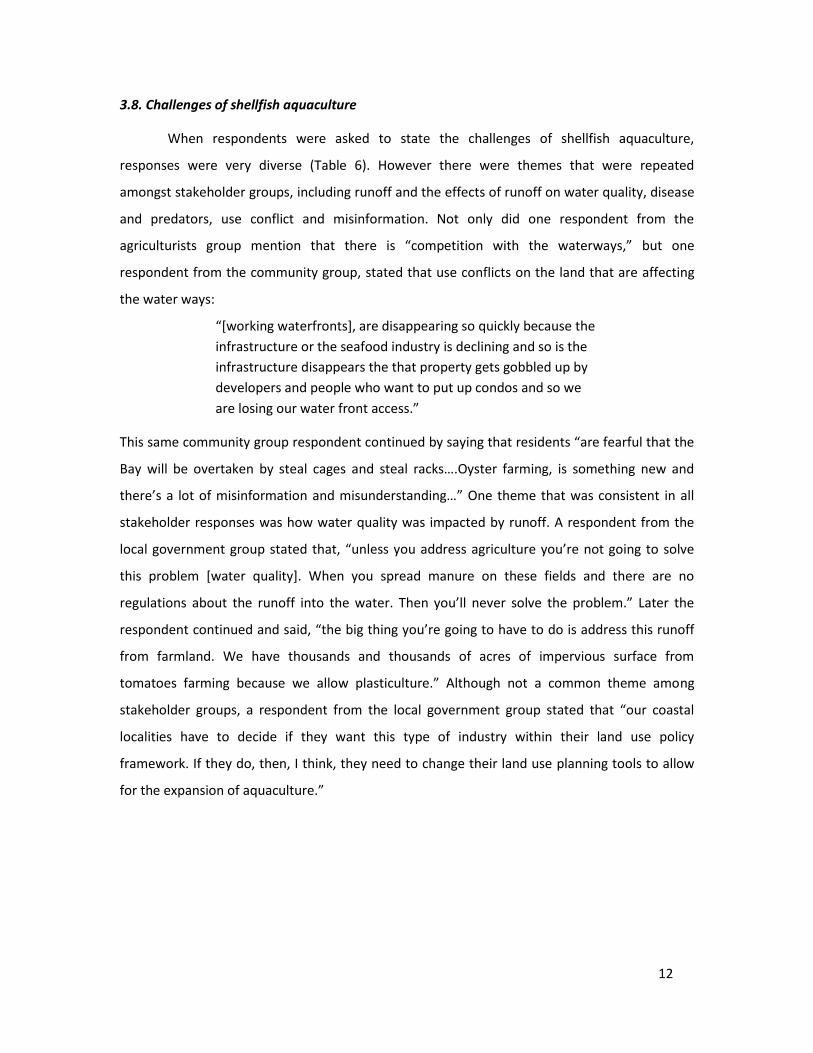
3.8. Challenges of shellfish aquaculture
When respondents were asked to state the challenges of shellfish aquaculture,
responses were very diverse (Table 6). However there were themes that were repeated
amongst stakeholder groups, including runoff and the effects of runoff on water quality, disease
and predators, use conflict and misinformation. Not only did one respondent from the
agriculturists group mention that there is “competition with the waterways,” but one
respondent from the community group, stated that use conflicts on the land that are affecting
the water ways:
“*working waterfronts+, are disappearing so quickly because the
infrastructure or the seafood industry is declining and so is the
infrastructure disappears the that property gets gobbled up by
developers and people who want to put up condos and so we
are losing our water front access.”
This same community group respondent continued by saying that residents “are fearful that the
Bay will be overtaken by steal cages and steal racks….Oyster farming, is something new and
there’s a lot of misinformation and misunderstanding…” One theme that was consistent in all
stakeholder responses was how water quality was impacted by runoff. A respondent from the
local government group stated that, “unless you address agriculture you’re not going to solve
this problem [water quality]. When you spread manure on these fields and there are no
regulations about the runoff into the water. Then you’ll never solve the problem.” Later the
respondent continued and said, “the big thing you’re going to have to do is address this runoff
from farmland. We have thousands and thousands of acres of impervious surface from
tomatoes farming because we allow plasticulture.” Although not a common theme among
stakeholder groups, a respondent from the local government group stated that “our coastal
localities have to decide if they want this type of industry within their land use policy
framework. If they do, then, I think, they need to change their land use planning tools to allow
for the expansion of aquaculture.”
12

Table 6: Perceptions of challenges of shellfish aquaculture
Stakeholder Group Responses
Agriculturist “Finger blithe” – people stealing the product from grounds
Storms
Runoff
High element of risk and success is dependent on environment
use conflicts
Aquaculturist Predators (ie. Crabs, bullfish, cownose ray)
“Bringing agriculture to the table and have the agriculture people understand that the sheet flows and the sedimentation flows are going off the agriculture areas into the waterways”
Unreasonable farm practices
Community Groups Persistent algae blooms
Disease – Dermo and MSX
Disease in juvenile clams
Use conflict
Misinformation – “*Fear+ that the Bay will be overtaken by steal cages and steal rakes
Misinformation and misunderstanding amongst all user groups
Working waterfront is disappearing.
Water access is being lost due to privatization of property.
Labor intensive
Is the demand there?
Local Government Land use policy framework
Public policy
Agriculture runoff and urban runoff
“Government doesn’t tell the people the truth”
Wild populations have been over worked
Disease: MSX and Dermo
Clean water
There are lots of variables, development, discharge of sewage, treated effluent, change of the shoreline, etc
The market will make a difference in how aquaculture is promoted
Management of wastewater discharge
Discharge from chicken houses into water
Realtors/Developers Money – “watermen do not have the resources to go out there start a hatchery and be putting stuff on the bottom”
Predators (ie. Cow nose ray)
Disease (ie. MSX and Dermo)
Water quality
Common Themes: disease/predators runoff and water quality misinformation use conflicts
13
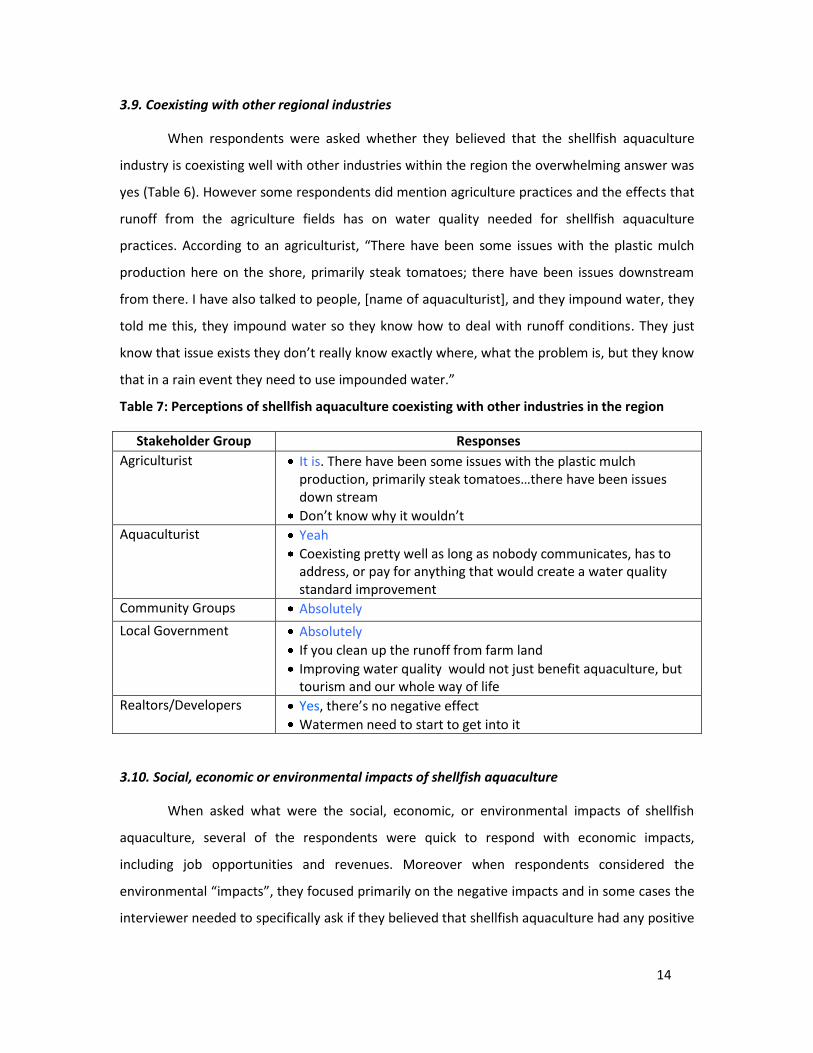
3.9. Coexisting with other regional industries
When respondents were asked whether they believed that the shellfish aquaculture
industry is coexisting well with other industries within the region the overwhelming answer was
yes (Table 6). However some respondents did mention agriculture practices and the effects that
runoff from the agriculture fields has on water quality needed for shellfish aquaculture
practices. According to an agriculturist, “There have been some issues with the plastic mulch
production here on the shore, primarily steak tomatoes; there have been issues downstream
from there. I have also talked to people, [name of aquaculturist], and they impound water, they
told me this, they impound water so they know how to deal with runoff conditions. They just
know that issue exists they don’t really know exactly where, what the problem is, but they know
that in a rain event they need to use impounded water.”
Table 7: Perceptions of shellfish aquaculture coexisting with other industries in the region
Stakeholder Group Responses
Agriculturist It is. There have been some issues with the plastic mulch production, primarily steak tomatoes…there have been issues down stream
Don’t know why it wouldn’t
Aquaculturist Yeah
Coexisting pretty well as long as nobody communicates, has to address, or pay for anything that would create a water quality standard improvement
Community Groups Absolutely
Local Government Absolutely
If you clean up the runoff from farm land
Improving water quality would not just benefit aquaculture, but tourism and our whole way of life
Realtors/Developers Yes, there’s no negative effect
Watermen need to start to get into it
3.10. Social, economic or environmental impacts of shellfish aquaculture
When asked what were the social, economic, or environmental impacts of shellfish
aquaculture, several of the respondents were quick to respond with economic impacts,
including job opportunities and revenues. Moreover when respondents considered the
environmental “impacts”, they focused primarily on the negative impacts and in some cases the
interviewer needed to specifically ask if they believed that shellfish aquaculture had any positive
14

impacts on the environment. Figure 1 depicts the key social, economic and environmental
impacts of shellfish aquaculture that were mentioned by the respondents.
Figure 1: Social, economic and environmental impacts of shellfish aquaculture.
Social
Economic Environmental
- “Rich long history of shellfish aquaculture” -LG
-“new residence to the area objecting to some things necessary in order to accomplish it *shellfish aquaculture+” -NGO
-”These people who come to the community and kinda bring their own ideas” -NGO
-”opportunity for our commercial watermen to continue what they have always done” - LG
-”The biggest challenge we have in Virginia is use conflict” -NGO
-”oyster farming on the other hand is something new and there’s a lot of misinformation and mis-understanding” -NGO
-”provides a sustainable product” - NGO
-”healthy component of our economy” -LG
-”Money stays in the community
because businesses are locally owned.” -NGO
-”people who are actually working in the industry as
laborers are paid a higher wage than most people on the shore” -LG
-”it has been good economically..it has employed a lot of people on the shore. More and more people are getting in to it because
there seems to be a demand” -AQ
-”aquaculture in Virginia…with clams and oysters is in excess of a $40 million industry
right now. It’s a very, a high risk industry, with a potential for a very high profit
margin.” -AQ
-”shellfish are the bays natural filters” -NGO
-”in a small body of waterprobably the biggest impact is
just excessive fecal material”-NGO
- -”There are some growers that have probably let the used netting escape from them and wash up on shorelines” - NGO
-”We have very limited impact or a verylimited draw off the resource or use of the
resource, negative use of the resources,comparatively to what we produce…If you
have water quality that allows you to propagate in an area then you should be
able to consistently produce the product.” -AQ
3.11. Regional advantages gained from shellfish aquaculture
When asked what advantages the region may gain from shellfish aquaculture answers
were primarily economic and social in nature. However two respondents did recognize that
shellfish aquaculture could improve water quality within the region. Economic factors that could
be gained from aquaculture included employment, locally and regionally, production of a
sustainable product, a viable seafood industry, diversity of revenue, and ultimately revenue.
Socially the Chesapeake Bay region could be nationally recognized for their oyster and culturally,
this new industry would provide watermen an option to continue their livelihood on the water.
15

3.12. Fitting into regional dynamics
When respondents were asked to provide some insight into how shellfish aquaculture
might fit into their regional dynamics, as population and industrial and residential development
increases, respondents took a variety of approaches (Table 8) to answer this question. However
there was one common theme throughout stakeholder groups, with the exception of the local
government group, which were issues associated with water quality. Two respondents, one
from the local government group and one from the aquaculturist group, shared a common
belief that industrial development was not a concern. Another theme that was mentioned by
the community and local government group was the concept of planning, managing and
changing local policy. According to the local government respondent, “It’s a question of public
policy. If your local governments want this sector of their economy to grow they’re going to
need to change their public policy to allow it to grow. If not, it will exist as its own just like
commercial crabbing does, just like commercial gill netting does where it’s a market segment.
But aquaculture is such a specialized operation that if it’s to exist and expand local government
needs to develop policy to do that.”
16
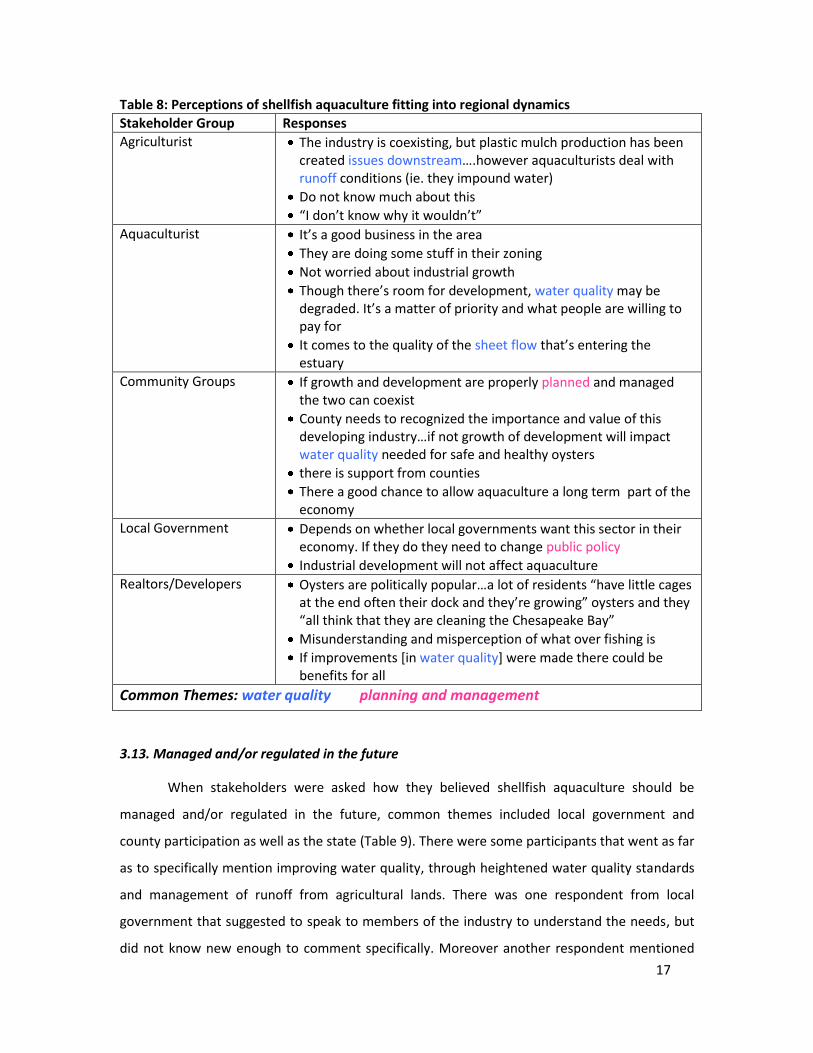
Table 8: Perceptions of shellfish aquaculture fitting into regional dynamics
Stakeholder Group Responses
Agriculturist The industry is coexisting, but plastic mulch production has been created issues downstream….however aquaculturists deal with runoff conditions (ie. they impound water)
Do not know much about this
“I don’t know why it wouldn’t”
Aquaculturist It’s a good business in the area
They are doing some stuff in their zoning
Not worried about industrial growth
Though there’s room for development, water quality may be degraded. It’s a matter of priority and what people are willing to pay for
It comes to the quality of the sheet flow that’s entering the estuary
Community Groups If growth and development are properly planned and managed the two can coexist
County needs to recognized the importance and value of this developing industry…if not growth of development will impact water quality needed for safe and healthy oysters
there is support from counties
There a good chance to allow aquaculture a long term part of the economy
Local Government Depends on whether local governments want this sector in their economy. If they do they need to change public policy
Industrial development will not affect aquaculture
Realtors/Developers Oysters are politically popular…a lot of residents “have little cages at the end often their dock and they’re growing” oysters and they “all think that they are cleaning the Chesapeake Bay”
Misunderstanding and misperception of what over fishing is
If improvements [in water quality] were made there could be benefits for all
Common Themes: water quality planning and management
3.13. Managed and/or regulated in the future
When stakeholders were asked how they believed shellfish aquaculture should be
managed and/or regulated in the future, common themes included local government and
county participation as well as the state (Table 9). There were some participants that went as far
as to specifically mention improving water quality, through heightened water quality standards
and management of runoff from agricultural lands. There was one respondent from local
government that suggested to speak to members of the industry to understand the needs, but
did not know new enough to comment specifically. Moreover another respondent mentioned
17

that the Chesapeake Bay should be managed under one ecosystem management plan, rather
than following a single specie management plan.
Table 9: Perceptions of how shellfish aquaculture should be managed and/or regulated in the future
Stakeholder Group Responses
Agriculturist Implied that there was a lot of paper work involved and was empathic to their situation
Counties should be supportive
Aquaculturist VMRC (Virginia Marine Resource Commission)
Current regulation is not overwhelming but is substantial
“Don’t know if anyone possibly going to figure out anyway…. to regulate us to much more.”
Preserve water quality statewide….Do something locality to improve current minimum standard for water quality
Address agriculture minimum standards
Community Groups Regulated and managed by the state
If each locality regulated tan industry “it’s just going to be so screwed up”
Needs regulation to stabilize the conditions in which it works
Local Government VMRC to manage natural resources including clams, fish and products that are harvested
Local government to manage use, industry the actual harvest of resources, the transporting of the resource and the regulating and the permitting of the infrastructure
Local governments need to develop policy to expand aquaculture
“I would like to hear what the industry itself has to say…I’m not sure what regulations would be applicable to them in the future.”
Clean up runoff from farms
Not opposed to regulation but there should be justification
Realtors/Developers Manage an ecosystem and stop single species type management….deal with the pollution problems
Provide a replenishment fee to oystermen
Involve the watermen to get the industry back
Common Themes: state government local government water quality
3.14. Improving dialogue about shellfish aquaculture
When respondents were asked to provide some suggestion to improve dialogue about
shellfish aquaculture amongst state and local government, the industry and the community
there were two common themes that prevailed, including education and dialogue. Respondents
from the aquaculture and local government groups believed that bringing “everyone to the
table” will improve dialogue about shellfish aquaculture. Also according to a respondent from
18

the community group the aquaculture industry needs to continue to “minimize their PR
problems. They may also want to take a stronger, positive role too, in disseminating information
about the economic consequences and various other things.”
Table 9: Suggestions to improve dialogue about shellfish aquaculture
Stakeholder Group Responses
Agriculturist Advertising, but may be expensive and can’t measure effectiveness
Provide more information about aquaculture to the community
Aquaculturist Don’t know. Not involved in that end of it.
Bring everyone to the table
Projects to improve water quality is going to create opinion and dialogue and there’s probably no going to be a lot of agreement.
Community Groups Education: brochures and literature
Virginia Seafood Council can promote dialogue
Create a Virginia Shellfish Growers Association to promote education
Minimize PR problems
Take a stronger positive role to provide information about economic consequences, etc.
Advertise
Engage the new section of the community
Have local government understand the situation
Local Government Get a better understanding of what the seafood industry needs
“put them around the table and talk about it”
Allow public to communicate their thoughts to government without fear
Realtors/Developers There is already dialogue…the oyster is politically popular
Common Themes: dialogue education
4. Conclusions:
In summary there were several themes that were repeatedly mentioned amongst
stakeholder groups, including husbandry, harvest, the economy, techniques of aquaculture and
social aspects. However environmental concerns, and more specifically water quality concerns,
were the overwhelming theme. Negative impacts to water quality as a result of agriculture
runoff were mentioned by each stakeholder group, at least once throughout the interview
process. Respondents from the agricultural group recognized that “agriculture is an easy target
from runoff issues,” however mentioned that there was “a study done by George Simmons at
Virginia Tech and he developed a system to determine if the E.coli in the aquatic system was
19
sourced from wild life or humans and he was able to determine that the predominate source of
E. coli in the water was raccoons and deer.” Respondents from the realtor/developer,
aquaculturist, and the local group stressed the importance of water quality needed for shellfish
and believed runoff from agriculture fields needed to be managed. According to a respondent
from the community group, factors or stresses that contribute to the morality or poor growth of
shellfish was not specifically due to poor water quality as a result of agriculture runoff, but it is a
result of “excessive nitrogen and phosphorus entering the water from runoff, from agriculture,
from air deposition, from storm water, from sewage treatment plants, failing septic systems that
promote algae blooms.”
The second theme that each stakeholder group mentioned was economic benefits of
shellfish aquaculture. To some degree each stakeholder articulated the importance of shellfish
aquaculture within their regional dynamics. Although respondents were not able to answer all
questioned asked in the interview they did understand that shellfish aquaculture was a good
thing, that it could not be done without high water quality, and that the future of the seafood
industry and/or the livelihoods of watermen would depend on shellfish aquaculture.
5. Discussion:
Due to the small sample size, the qualitative data provided within this document should
not be used to generalize the thoughts, opinions, and knowledge of shellfish aquaculture
amongst all members of the selected stakeholder groups. However the collected information
does provide a snap shot of concerns from individuals within stakeholder groups, which may
potentially be shared by others.
Further research to capture social perceptions of shellfish aquaculture is recommended.
With the Commonwealth showing an interest in promoting shellfish aquaculture, it is necessary
to understand regional public perceptions and knowledge of shellfish aquaculture. According to
Bardach (1997) social forces may significantly hinder any sustainable aquaculture plan to reach
its full potential, even under ideal biological and economic conditions – yet it is often overlooked
in most designs. This suggests that an understanding of social perceptions of the shellfish
aquaculture industry within the Commonwealth of Virginia may provide assistance to local
coastal resource planners to prioritize and manage shellfish aquaculture and the issues that are
20

associated with this industry. Moreover these perceptions may also provide direction for future
management and discussion points for localities.
Product 2: An economic and technological assessment of alternative wastewater treatments The need to evaluate the economic costs of alternative uses for wastewater treatment
is not only desired by DEQ, but local town planners and PDC staff may find this assessment
beneficial. This assessment may satisfy the knowledge gap associated with meeting water
quality criteria for maintaining the shellfish aquaculture industry while still accommodating
coastal population growth. This quantitative analysis reviews alternative wastewater technology
options, a cost assessment of the options, and how to conduct an alternatives assessment.
6. Regulations
There are several state and federal regulations involved in the protection of water
quality within the Commonwealth of Virginia.
Clean Water Act of 1972, is federal legislation, enabled by the United States
Environmental Protection Agency (USEPA), to protect surface water quality in the United States.
The statute focuses on reducing direct pollutant discharges into waterways, financing municipal
wastewater treatment facilities, and managing polluted runoff, with the objective of restoring
and maintaining the chemical, physical, and biological integrity the water (USEPA, 2008). This
legislation also authorizes the issuing of the National Pollutant Discharge Elimination System
permit.
Specifically in Virginia, there are two types of wastewater permits issued in regards to
discharging wastewater containing any material harmful to health or the environment to surface
water or onto the land where it might enter or cause contamination to surface or groundwater
(DEQ, 2008). The Virginia Pollutant Discharge Elimination System (VPDES) permit is required for
discharges into surface water. It establishes specific water quality standards to be meet by the
discharger in order to provide maximum protection to surface water quality. The other permit
that the Commonwealth may issue is the Virginia Pollution Abatement (VPA) permit. Facilities
with this permit are able to discharge treated wastewater onto land in a manner that does not
result in a discharge into a stream or into the groundwater (DEQ, 2008).
21

To further regulate water quality in Virginia, the State Water Control Law (VAC 25-260)
mandates the protection of the state’s waters through water quality standards, criteria, and an
antidegradation policy. Water quality standards designate all state waters for one the following
uses: recreational activities (ie. swimming and boating), the propagation and growth of
indigenous populations of aquatic life and wildlife, or the production of edible and marketable
natural resources (ie. fish and shellfish) (9 VAC 25-260-10). The criteria for water quality
standards explain that all state waters are to be free from substances that interfere with
designated uses (9 VAC25-260-20). However, due to the difficulty of regulating interferences
with designated uses, the criteria establish numerical standards to simplify enforcement. And
finally the antidegradation policy states that all waters within the Commonwealth shall be
assigned a tier of antidegradation protection (9 VAC 25-260-30) (Table 1). This policy is applied
whenever a proposed activity has the potential to affect existing surface water quality.
Table 1: Antidegradation policy tier classification
Tier Description
Tier 1 Specifies that existing instream water uses and the level of water quality to protect the existing uses shall be maintained and protected. This means that as a minimum, all waters should meet adopted water quality standards.
Tier 2 Protects water that is better than specified water quality standards. Only in limited circumstances may water quality be lowered in these waters.
Tier 3 Are exceptional waters where no new, additional or increased discharge of sewage , industrial wastes or other pollution are allowed. These waters must be specifically listed in the regulation.
Currently, DEQ sets regulations that only pertain to point source discharges, however
according to the USEPA’s National Quality Inventory 2000 report, non point sources in many
areas contribute to the majority of the total nutrient loading into water ways (USEPA, 2002).
Sources may include runoff from agricultural and urban areas, as well as leaking wastewater
treatment systems (ie. onsite systems and centralized systems). Nonpoint sources are
voluntarily managed through best management practices (BMPs) as well as indirectly managed
by the Virginia Department Health (VDH) as they regulate onsite sewage water systems.
The Division of Onsite Sewage of Water Services provides human health protection and
groundwater quality through the implementation of regulations governing private wells, and
onsite wastewater treatment and disposal systems (VDH, 2008). VDH supervises the
construction, location, and operation of alternative discharging sewage treatment systems with
flows less than or equal to 1,000 gallons per day on a yearly average (12 VAC 5-640-10). Recently
22

the VDH, who are the regulatory authority over onsite systems, has recognized the need to
implement inspection and maintenance requirements of onsite systems. Affective July 1, 2009,
the Board of Health, in conjunction with the Board of Waterworks and Wastewater Works
Operators and Onsite Sewage System Professionals, will adopt regulations for the licensure of (i)
onsite soil evaluators; (ii) installers of alternative onsite sewage systems and (iii) operators of
alternative onsite sewage systems. This regulation will require licensed individuals to meet
appropriate educational and training standards, have relevant work experience, demonstrate
knowledge and skill, commit to application fees to cover the costs of the program, renewal fees,
and meet schedules and other criteria set by the Board (State Water Control Board, 2007). This
regulation intends to reduce leaking and outdated onsite systems and ultimately decrease
contamination from onsite systems into adjacent ground and surface water sources.
7. Technology Summary
Treatment systems may be classified as decentralized or centralized systems.
Decentralized systems consist of onsite or clustered systems. According to the US Census Bureau
decentralized systems serve 25% of US households and are implemented in almost 33% of new
development, however more than half these systems are thirty years old (USEPA, 2005). The
remaining 75% of households in the US are served through centralized (public) wastewater
collection and treatment systems (USEPA, 2004).
With advances in wastewater treatment technologies there has been an increased
awareness in wastewater treatment management. Currently onsite wastewater management
focuses primarily on adequate treatment of wastewater and dispersal of treated wastewater at
or near the place of generation (Jantrania and Gross, 2006). The conventional systems,
consisting of a septic tank and drainage field, have seen upgrades with the addition of
alternative secondary and/or tertiary treatment systems. These alternative systems/units treat
the wastewater within the septic tank. Then the water will be recirculated back into the septic
tank for dilution purposes, or the water will be pumped into a tertiary treatment system (ie.
drainage field, chemical disinfection, photochemical disinfection). Moreover, centralized
wastewater treatment systems have also considered alternative secondary and tertiary
wastewater treatment options, to not only become more cost-effective, but to meet new
effluent standards set by the Commonwealth. For instance, effective in 2006, the
23
Commonwealth mandated that the majority of wastewater treatment facilities reduce nitrogen
and phosphorus loads in discharged effluent.
Alternative technologies have the ability to be integrated into decentralized systems as
well as centralized systems; however the quality and quantity of the wastewater, the receiving
environment and the cost of the system will ultimately influence the type of treatment system
that is utilized. Additionally, county ordinances with the intention to manage onsite systems, to
assist as a land use management tool, may also be an influencing factor.
7.1. Septic Tank
Conventional onsite wastewater treatment technologies have typically included a septic
tank and drainage field. As depicted in Figure 1 (Appendix A), wastewater from the residence
enters the septic tank and is eventually dispersed through a drainage field.
The septic tank is a pretreatment unit where separation between the solids and
wastewater occurs (Appendix A: Figure 2). While solids settle to the bottom of the tank, fats and
scum accumulate at the top to create a distinct stratification within the unit. Between the top
and bottom layers, aerobic and/or anaerobic biologic digestion of the waste will occur.
However, digestion of the waste requires the sewage to remain within the tank for
approximately 36-72 hours (Anderson and Gustafson, 2004). Treatment of wastewater within a
septic tank is expected to be less than 45%, while more than 55% of treatment is expected from
a subsurface drain field (Jantrania and Gross, 2006). Although the operation of a septic tank is
simple, which reduces the cost of the septic tank, the system does need regular cleaning every
24 to 36 months (Anderson and Gustafson, 2004).
According to the National Association of Wastewater Transporters, septic tank
capacities for residences are commonly a minimum of 1,000 gallons, or 400 gallons per
bedroom, and for other establishments the capacity is five times the average design flow of the
system (Anderson and Gustafson, 2004).
7.2. Aerobic Treatment Unit (ATU)
Aerobic Treatment Units are secondary treatment systems that introduce oxygen to the
septic tank through aeration (Appendix A: Figure 3). The addition of oxygen promotes the
growth of aerobic bacteria that assist in the digestion of organic wastes. Aerobic microbes
24

convert the organic compounds into energy, new cells, as well as residual matter (Jantrania and
Gross, 2006). Consequently, this increases the removal of biochemical oxygen demand (BOD)
from the water (Anderson and Gustafson, 2004). When water passes through the ATU, it enters
the clarifier where further separation of the solids and effluent will occur. The solids will settle
back into the aeration chamber where they will continue to be biologically digested, while the
effluent will flow into the dispersal system. Ultimately the ATU enhances pretreatment of
wastewater prior to being discharged.
The efficiency of the ATU is dependent on the aeration system supplying the proper
amount of oxygen to the wastewater. Therefore, an ATU requires complex cleaning and, in
some cases, frequent part replacements which are necessary to maintain optimal wastewater
treatment. Although very effective at reducing biochemical oxygen demand (BOD), ATUs are
more expensive to purchase and maintain than other treatment technologies (Ivery, 1995).
7.3. Media Filters
Media filters are a passive secondary and/or tertiary treatment system. They are fixed
materials that provide easy movement of oxygen and water, as well as a surface area for
microbes to establish themselves. As wastewater is sprayed or dripped over the surface of the
media, water comes into contact with the microbes on the media. Through a combination of
filtration and trapping, absorption, biological decomposition, and biochemical transformation,
the media filters offer sufficient wastewater treatment (Jantrania and Gross, 2006).
Consequently, the effluent will have a low BOD and total suspended solids (TSS) concentration
(Jantrania and Gross, 2006).
Media filters can be utilized in one of two ways. First a single pass system will filter the
wastewater once prior to being pumped to the dispersal system. The second option is a
recirculation system which filters wastewater through multiple passes. A portion of water that
passes through the media filter will be recirculated back into the septic tank to dilute the
wastewater in the tank. This recirculation feature allows the wastewater treatment system to
accept high hydraulic and organic loading (Jantrania and Gross, 2006). Therefore the efficiency
of a media filter is dependent on the strength (ie. organic content) of the wastewater as well as
the dispersal rate of the water over the medium.
Media filters may be placed in two major categories (Table 2). First, natural and mineral
filters, including sand or gravel, expanded shale, cinders, limestone, activated carbon, peat or
25
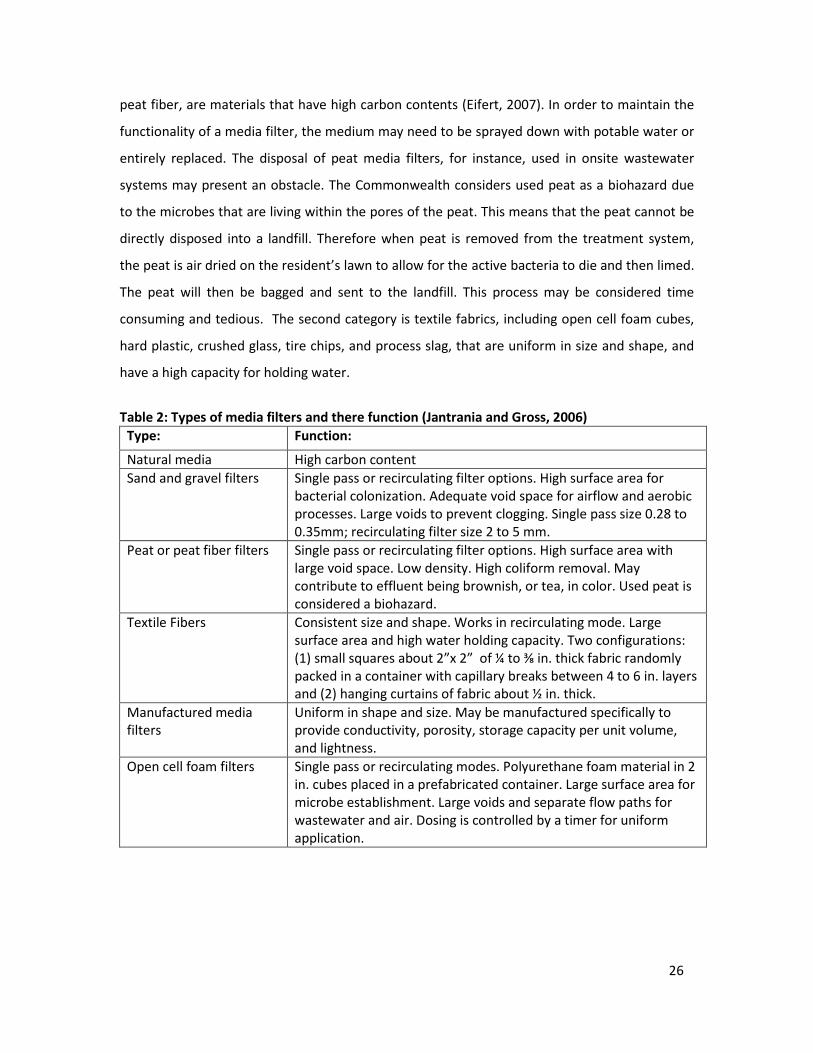
peat fiber, are materials that have high carbon contents (Eifert, 2007). In order to maintain the
functionality of a media filter, the medium may need to be sprayed down with potable water or
entirely replaced. The disposal of peat media filters, for instance, used in onsite wastewater
systems may present an obstacle. The Commonwealth considers used peat as a biohazard due
to the microbes that are living within the pores of the peat. This means that the peat cannot be
directly disposed into a landfill. Therefore when peat is removed from the treatment system,
the peat is air dried on the resident’s lawn to allow for the active bacteria to die and then limed.
The peat will then be bagged and sent to the landfill. This process may be considered time
consuming and tedious. The second category is textile fabrics, including open cell foam cubes,
hard plastic, crushed glass, tire chips, and process slag, that are uniform in size and shape, and
have a high capacity for holding water.
Table 2: Types of media filters and there function (Jantrania and Gross, 2006)
Type: Function:
Natural media High carbon content
Sand and gravel filters Single pass or recirculating filter options. High surface area for bacterial colonization. Adequate void space for airflow and aerobic processes. Large voids to prevent clogging. Single pass size 0.28 to 0.35mm; recirculating filter size 2 to 5 mm.
Peat or peat fiber filters Single pass or recirculating filter options. High surface area with large void space. Low density. High coliform removal. May contribute to effluent being brownish, or tea, in color. Used peat is considered a biohazard.
Textile Fibers Consistent size and shape. Works in recirculating mode. Large surface area and high water holding capacity. Two configurations: (1) small squares about 2”x 2” of ¼ to ⅜ in. thick fabric randomly packed in a container with capillary breaks between 4 to 6 in. layers and (2) hanging curtains of fabric about ½ in. thick.
Manufactured media filters
Uniform in shape and size. May be manufactured specifically to provide conductivity, porosity, storage capacity per unit volume, and lightness.
Open cell foam filters Single pass or recirculating modes. Polyurethane foam material in 2 in. cubes placed in a prefabricated container. Large surface area for microbe establishment. Large voids and separate flow paths for wastewater and air. Dosing is controlled by a timer for uniform application.
26
The choice of filter is dependent on the quantity and quality of wastewater that is entering the
system; however onsite alternative wastewater technology designers and installers may have
product preferences that may factor into the decision.
7.4. Marshland Upwelling System
Marshland upwelling systems (MUS) are designed for the treatment of wastewater from
coastal communities. Typically regional characteristics ideal for MUS include saturated and
anaerobic sediments/soils (Evans and Rusch, 2007). This system utilizes the natural physical,
biological, and chemical operations/processes that wetlands, and wetland sediments, provide in
order to reduce organic matter, fecal pathogens, and nutrients in the wastewater (Evan and
Rusch, 2007).
Although the specific design of the MUS may vary, the basic concept remains constant
(Appendix A: Figure 4). As wastewater flows from the residence, or a cluster of residence, into a
collection/distribution tank, the wastewater settles and is stored. The wastewater is then
injected into the marshland through a well at a particular rate and frequency. There is a timer
that activates and deactivates the pump to generate active and rest periods within the injection
process. While the resting stage dissipates the pressure between the injection events, the active
stages depend on advection forces to disperse the wastewater horizontally away from the point
of injection (Fontenot, Boldor and Rusch, 2006). The injected wastewater becomes confined to a
limited area due to a pressure differential created by the density difference between the saline
groundwater and the wastewater (Watson and Rusch, 2001). This pressure also forces water
toward the surface of the marsh, in the direction of the decreasing density (Watson and Rusch,
2001).
Researchers at Louisiana State University have assessed the MUS’s ability to treat
phosphorus, nitrogen, and fecal coliform loads within wastewater. The MUS was found to
provide 99.6% and 99.7% treatment efficiencies for total phosphorus and ortho-phosphate
(Evans and Rusch, 2007), while nitrogen removal efficiencies were found to be 98% and 98.6%
for total kjeldahl nitrogen and total ammonia nitrogen (Fontenot, Boldor, and Rusch, 2006).
Moreover researchers found that fecal coliform was reduced to levels below 14 MPN, which is
the bacteria concentration standard for the National Shellfish Sanitation Program (Watson and
Rusch, 2001). Although removal of fecal coliform, nitrogen, and phosphorus seems, it is
27
uncertain how this treatment method will impact the future ecological integrity of the
marshland.
7.5. Constructed Wetlands
Constructed wetlands are secondary and/or tertiary treatment systems. They use the
natural physical, biological, and chemical processes that wetlands, and wetland sediments,
provide through a combination of filtration, sedimentation, and bacterial decomposition.
There are two types of constructed wetlands (Appendix A: Figure 5). First, surface-flow
designs allow wastewater to flow through a shallow basin planted with emergent and
submerged macrophytes (Masi and Martinuzzi, 2007). Second, subsurface flow designs are filled
with gravel or sand, or a similar substrate, where macrophytes are rooted (Masi and Martinuzzi,
2007). Macrophytes add oxygen to the system and increase the biological activity within the bed
(Belmont et al., 2004). These systems may be planted with a variety of macrophytes, including
reeds (Pharagmites australis or communis), bulrush (Scirpus sp.), cattail (Typha sp.), calla lily
(Zantedeschia aethiopica), and canna lily (Canna flaccida). They all play an important role in the
removal of various nutrients and metals through filtration, absorption, cation exchange, and
root induced chemical changes in the rhizospheres (Liu et al., 2007). In addition to the
macrophytes contributing to wastewater treatment, permanent or temporary anoxic conditions
in wetland soils immobilize heavy metals (Liu et al., 2007). Masi and Martinuzzi (2007) found
TSS, chemical oxygen demand (COD), BOD, total nitrogen and phosphorus were reduced by 84%,
94%, 95%, 60%, and 94% respectively.
Constructed wetlands are not only advantageous in the fact that they are efficient in
treating wastewater, but a constructed wetland has the flexibility of being integrated into a
centralized or decentralized system. Wetlands constructed for municipal or industrial
wastewater treatment may be acres large. They provide an area for wildlife habitat, recreation,
outdoor education, as well as an aesthetically pleasing view. However these systems are an ideal
breeding ground for mosquitoes and may release an odor. Another aspect to consider is that
constructed wetlands require maintenance and upkeep of the flora to efficiently treat the
wastewater.
28

7.6. Membrane Bioreactor
Membrane bioreactors (MBR) are alternative technologies to traditional activate sludge
processes for the secondary treatment of wastewater. They are fiber membranes with high
surface areas that allow for maximum filtration of wastewater. Membrane bioreactors are
either submerged (ie. immersed or integrated) or external (ie. recirculated or side-stream)
membranes that combine the process of biological treatment with membrane technology.
External membranes are situated outside of the bioreactor and the biomass is recirculated
through a filtration loop (Yang, Cicek and Ilg, 2006). They are considered most suitable for
industrial wastewater that has a high temperature, high organic load, extreme pH, high toxicity,
and low filterability (Yang, Cicek and Ilg, 2006). However due to the high energy consumption of
an external bioreactor, the submerged bioreactor is preferred. A submerged bioreactor
(Appendix A: Figure 6) is introduced into an aeration tank to improve the separation of solids
and water. The system is compact and is typically found in units called cassettes. They are used
as ultra- and microfiltration membranes to retain both bacteria as well as viruses (Rosenberger
et al., 2002).
8. Disinfection Methods
Prior to discharging effluent, in most cases, the wastewater is disinfected in order to
meet state and federal water quality regulations. Typically this is considered tertiary treatment
but depending on the system design may be referred to as quaternary treatment. These
disinfection processes can be used for decentralized and centralized systems, however the
concentration and/or amount of disinfectant is dependent on the quantity as well as the quality
of the wastewater. Disinfection methods may be classified into three categories, including
chemical, physical, and photochemical.
8.1. Chemical Disinfection
Chemical disinfection is based on the oxidization potential of a chemical. The chemical
will oxidize and damage the cell wall of a microorganism and eventually cause lethal damage
(Acher, et al., 1997).
Chlorination, the most common disinfection method in wastewater treatment, can be
used in gas form (Cl2) or a solid form known as sodium hypochlorite (NaOCl). For instance, onsite
29

systems utilize calcium hypochlorite in a dry powder or in a tablet form, while centralized
facilities use liquefied chlorine gas to disinfect. In both cases the chlorine will react with the
ammoniacal-nitrogen and the organic matter in the sewage, as well as with the water (Forster,
2003). In order to disrupt the integrity of the cell membrane and damage the nucleic acids in the
bacteria, the wastewater needs an exposure time of approximately 15-30 minutes. However the
effectiveness of chlorine is dependent on the concentration of chlorine, and the temperature
and pH of the water. Chlorine disinfection is advantageous since it is easy to handle, measure,
dose, and control. Also it has a low capital cost and is considered cost effective. On the contrary,
however, chlorine can react with organic compounds to form trihalomehtanes (THM) which may
have detrimental effects to the receiving environment. Although research has found THM to be
a carcinogen, other research has found that acute exposure to humans is not hazardous, and
uncertainty prevails in regards to the exact affects on the environment (Fresse and Nozaic,
2004). Moreover, research has found that chlorinated water may consist of chloroform,
bromodichloromethane, dibromochloromethane and bromoform (Symons et al., 1975).
Ozone, an alternative to chlorination in centralized systems, is a powerful disinfectant
that kills microbes by targeting the enzymes and nucleic acids of bacterium, and damaging the
nucleic acids of viruses. According to Freese and Nozaic (2004), ozone is more effective than
chlorine in removing faecal streptococci organisms, coliphage organisms, and parasitic cysts and
oocysts. Furthermore ozone has been found to remove more microorganisms at a lower dose
than chlorine (Freese and Nozaic, 2004). Ozone is produced onsite as an electric current (5-25
kilovolts) is passed through dry air which results in a gas that consists of 1-2% V/V of ozonea
(Forster, 2003). The effectiveness of ozone is a function of exposure time and concentration. On
average, exposure time ranges from 5-10 minutes, however viruses and bacteria species vary in
their sensitivities and resistance. Ozone is advantageous due to its ability to create a residual
that is quickly dissipated. This reduces the effluents affects on the receiving environment. On
the contrary, since the residual dissipates so quickly it is often necessary to supplement ozone
disinfection with another disinfection method that has a longer lasting residual to ensure no re-
growth occurs within the distribution system. Another drawback with using ozone is that it has a
high capital cost when compared to other disinfection options.
Peracetic Acid is a manmade chemical which is a mixture of acetic acid (CH3COOH) and
______________________________________________________________________________
a1-2% V/V of ozone means the volume of ozone is 1-2% of the total volume of gas produced
30
hydrogen peroxide (H2O2). It is a relatively new wastewater disinfectant, but due to its
bactericidal, virucidal, fungicidal and sporicidal effectiveness, peracetic acid has been considered
a strong oxidant and therefore a strong disinfectant (Kitis, 2003). Compared to chlorine,
peracetic acid is similar when disinfecting water with fecal and total coliforms as well as faecal
streptococci (Freese and Nozaic, 2004). However peracetic acid was not found to be quite as
efficient as chlorine when deactivating parasitic organisms (Freese and Nozaic, 2004). Optimal
exposure time is 10 minutes. Although effective in disinfecting, peracetic acid is not a cost
effective option due to its limited production. Moreover, the use of peracetic acid as a
disinfectant may increase the amount of organic material in the effluent. This is due to the
presence of acetic acid originally in the peracetic acid mixture, and is a result of the
decomposition of peracetic acid (Kitis, 2004). Therefore an increase in organic content may
result in the re-growth of microbes.
8.2. Physical Disinfection
Physical disinfection occurs when there is physical retention of microorganisms through
filtration (ie. media filters, synthetic membranes or constructed wetlands). These methods have
been previously discussed in the technology summary due to their abilities to reduce suspended
solids, nutrients, and organic compounds in secondary wastewater treatment. Furthermore
these methods provide effective disinfection and polishing before discharge or dispersal.
8.3. Photochemical Disinfection
Photochemical disinfection occurs when light (ie. Ultraviolet irradiation) induces
chemical reactions within microbes.
Ultraviolet irradiation (UV) is a disinfectant that kills bacteria and viruses with a
wavelength ranging from 200-280 nm over an exposure time of 6-10 seconds. This wavelength
penetrates the cell membrane and ultimately damages the cell’s DNA (Kolch, 1999). However if
the dose of UV is not given at the lethal dose level, then the bacterial cells are able to repair the
defective DNA through enzymatic processes (photoreactivation) (Acher et al., 1997). UV
disinfection can be integrated into decentralized and centralized system designs through two
manners: (a) flow-through open channel system or (b) a closed-pipe pressure system. The flow-
through system consists of a mercury lamp in quartz tubes that are submerged at a controlled
liquid depth in an open channel. The water flows parallel to the UV lamps and is exposed to the
31

irradiation at a rate of 30-40 mWs/cm2 (milliwatt seconds per square centimeter) (Acher et al.,
1997). A closed-pipe pressure system, on the other hand, disinfects pressured water at a high
intensity due to the rapid linear flow rate of water through the system. There are three main
types of lamps: low-pressure/low-intensity, low-pressure/high intensity, and medium-
pressure/high-intensity (Table 2). The total output of a lamp is dependent on the length of the
lamp. For instance, the longer the lamp the higher the output. Moreover the effectiveness of UV
disinfection is dependent on the depth, transmissivity, and turbidity of the water being
irradiated as well as the bacterial concentrations (Freese and Nozaic, 2004). Similar to the
ozone, ultraviolet radiation is advantageous since it does not create residuals or by-products as
a result of its interaction with the microbes or the water. UV is also more effective than chlorine
at killing Legionella, Mycobacteria, Aeromonas, Cryptospordium and Giardia lamblia which are
harmful bacteria, parasites and pathogens to humans.
Table 3: Qualities of available UV lamps (Kolch, 1999)
9. Effluent dispersal
As a result of wastewater treatment there are two end products: solid waste and
effluent. Due to the scope of this paper, dispersal and discharge of the effluent will only be
discussed in the following section.
32

9.1. Subsurface Dispersal
Subsurface soil treatment, typically used for only decentralized systems, utilizes the soil
to not only dispose of the effluent, but to purify the effluent. The performance of a subsurface
dispersal system is dependent on the effluent characteristics, methods of application to the soil,
and site characteristics (Jantrania and Gross, 2006).
Soil has a variety of characteristics, including texture, structure, and percolation rates
that make it very effective in removing nutrients, solids, pathogens, chemicals, and organic
matter. Soils consisting of oxygen create an ideal environment for aerobic bacteria to survive
and thus assist in the breakdown of residual organic matter in the effluent. Oxygen in the soil
also indicates unsaturated conditions in the soil. This allows for the wastewater effluent to have
adequate contact time with the soil particles and bacteria for sufficient treatment. The depth of
the soil, however, plays a role in the presence of oxygen. For instance, the amount of oxygen
available at soil depths greater than 48 inches is greatly reduced (Anderson and Gustafson,
2004), which consequently reduces the efficiency of soil treatment. Prior to installation of a
system, soil texture is assessed to determine the amount of sand, silt, and clay particles within
the soil as well as the size of the particles. Though the soil texture is absolutely pertinent when
designing and sizing a system, the flow and loading rate of the system also needs to be
considered (Table 4).
Table 4: Soil Sizing Factors Based on Percolation Rates (Anderson and Gustafson, 2004)
Percolation rate (minutes per inch)
Soil texture Sizing factor (sqft/gal/day)
Loading Rate (gal/day/sqft)
Faster than 0.1a coarse sand 0.83 1.20
0.1 to 5b medium sand, loamy sand 0.83 1.20
0.1 to 5 fine sand 1.67 0.60
6 to 15 sandy loam 1.27 0.79
16 to 30 loam 1.67 0.60
31 to 45 silt, silt loam 2.0 0.50
46 to 60 sandy clay loam, silty clay loam, clay loam
2.2 0.45
61 to 120c silty clay, sandy clay, clay 4.2 0.23
Slower than 120d -- --- a Systems installed in or on these soils must be either mound systems or trench systems with at least 1 foot of clean sand between the distribution medium and the coarse soil of the trench bottom and side walls. b Systems in or on these soils must use pressure distribution or must be divided into at least four parts, none of which is more than 25% of the total system area, and which are in series. c Mounds should be used for system on these soils. d Systems installed in or on these soils should be monitored.
33

Some soil factors that may limit the installation of a dispersal system include bedrock,
sandy soils as well as saturated soils. Bedrock is relatively impermeable to water percolation,
but bedrock may consist of cracks and channels that could potentially direct water flow toward
groundwater aquifers (Anderson and Gustafson, 2004). Saturated soils have reduced oxygen
levels, which decreases the amount of aerobic bacteria present in the soil that are significant for
wastewater treatment. Finally, sandy soils limit efficient soil disposal and treatment due to the
high percolation rate. Such a rate reduces the amount of contact time the effluent has with the
soil and aerobic microbes for digestion. In a 2002 publication by the USEPA recommendations
were made for dispersal systems when considering limiting factors and soil depth (Appendix B:
Figure 1).
There are a variety of soil dispersal systems options that can be utilized in onsite
systems, but may also be considered in cluster wastewater systems. Historically soil treatment
systems such as cesspools, seepage pits, and leaching pits have been used as disposal systems.
Although these systems may still be found in rural areas, they are not highly efficient in treating
wastewater. Fortunately there have been advancements to subsurface treatment systems and
may be grouped in the following categories:
Trenches or beds filled with gravel or other media (Appendix B: Figure 7)
Gravelless trenches or beds with chamber systems (Appendix B: Figure 8)
At-grade or above-grade (Appendix B: Figure 9)
Drip dispersal (Appendix B: Figure 10)
Spray dispersal (Appendix B: Figure 11) Within trenches or dispersal bed systems, piping may be covered with gravel, or other
media, or no gravel at all. The idea is that the gravel, or the media surrounding the piping, will
assist in the final disinfection stage of wastewater treatment.
At-grade systems are built on the original grade or slope of the land (Anderson and
Gustafson, 2004). The system consists of an additional layer of sand, or filtering media, on the
soil surface and is than capped with soil (Middlebrooks, Reed, and Crites, 2005). Above grade
systems, also referred to as mound systems, are built without using clean sand and are
positioned above the natural grade of the land (Anderson and Gustafson, 2004). In both
systems, however, the size and shape of the mound will affect the absorption of effluent.
Research has shown that relatively long and narrow mounds absorb effluent most effectively,
particularly in areas where heavy soils are present (Anderson and Gustafson, 2004).
34

Drip dispersal, otherwise referred to as drip irrigation, has the primary goal of applying
small amounts of effluent to a large area (Anderson and Gustafson, 2004). The effluent from
wastewater treatment technologies are a source of nutrients and moisture for the growth of
vegetation. Consequently, drip dispersal systems can be designed to irrigate an entire yard,
which ultimately decreases the use of potable water to irrigate lawns and/or gardens.
Spray irrigation methods may be integrated into decentralized or centralized system
designs. Application of treated effluent is directly sprayed to the soil surface. Similar to drip
dispersal, spray irrigation utilizes the nutrients in the effluent to irrigate the land. According to a
study from the Pennsylvania Department of Environmental Protection (PDEP) the increasing use
of spray irrigation in residential communities increased the base flow within the watershed as
well as the recharge rate of groundwater, however it was also found to negatively affect the
water quality of shallow aquifers (Schreffler, et.al., 2005).
9.2. Surface discharge
As the name suggests, surface discharge is when treated effluent is discharged directly
onto land or into water (ie. rivers, streams, wetlands, lakes, oceans). This is typically referred to
as a point source discharge since there is a single, end of the pipe discharge that is monitored.
The Commonwealth of Virginia requires all point source discharges into water obtain a VPDES
permit, while a VPA permit is issued for direct land application of effluent.
10. Cost Assessment
The cost of alternative wastewater treatment technologies will vary on a case to case
basis. Factors contributing the cost of the system will include the quantity of water, and the
quality of water being treated as well as the preference of the installers or engineers designing
the system.
A collection of cost estimates of decentralized systems have been assembled in Table 5
from literature, government documents, and from consultants. The total costs include the
capital costs incurred in planning, designing, and constructing the system and the long term
costs associated with maintaining a system with a design flow of 440 gallons per day for a four
bedroom house over a life span of 20-30 years (in most cases) (Hoover, 1997).
35

Table 5: Examples of a total cost summary worksheet to compare alternatives
a.
System
Total materials & installation
Present value of total O&M cost
Total cost over life of system
Amortized monthly materials & installation costs
Avg monthly present value of O&M costs
Avg monthly cost over life of system
Septic tank & gravity distribution Septic tank & gravity distribution with chambers Septic tank & gravity distribution with styrene foam Septic tank & gravity distribution with large diameter pipes
$2,504 $3,336 $2,846 $3,816
$6,845 $7,032 $6,920 $7,156
$9,349 $10,368 $9,767 $10,971
$20 $27 $23 $31
$19 $20 $19 $20
$39 $46 $42 $51
Septic tank & gravity distribution with pressure manifold Septic tank & gravity distribution with pressure manifold and chambers Septic tank & gravity distribution with pressure manifold and styrene foam Septic tank & gravity distribution with pressure manifold large diameter pipes
$4,774 $5,593 $,5,103 $6,073
$7,707 $7,889 $7,777 $8,013
$12,482 $13,482 $12,881 $14,085 $15,356
$38 $45 $41 $49
$21 $22 $22 $22
$60 $67 $63 $71
Septic tank & gravity distribution with sand filter pretreatment Septic tank & gravity distribution with peat filter pretreatment Septic tank & gravity distribution with recirculating sand filter pretreatment
$7,296 $11,808 $6,226
$12,069 $12,604 $12,059
$19,364 $24,412 $18,285
$59 $95 $50
$34 $35 $33
$92 $150 $84
Septic tank & LPP distribution Septic tank & LPP distribution with sand filter pretreatment Septic tank & LPP distribution with recirculating sand filter pretreatment
$4,523 $10,223 $8,232
$12,319 $13,338 $13,007
$16,843 $23,561 $21,239
$36 $82 $66
$34 $37 $36
$71 $119 $102
Septic tank & drip distribution Septic tank & drip distribution with sand filter pretreatment Septic tank & drip distribution with recirculating sand filter pretreatment
$11,163 $15,994 $14,872
$13,082 $14,101 $14,094
$24,245 $30,095 $28,966
$90 $129 $120
$36 $39 $39
$126 $168 $159

Septic tank & drip distribution with sand filter pretreatment & chlorine disinfection Septic tank & drip distrib. with recirc. sand filter pretreatment & chlorine disinfection Septic tank & drip distribution with sand filter pretreatment & UV disinfection Septic tank & drip distribution with recirc. sand filter pretreatment & UV disinfection
$16,408 $15,285 $17,867 $16,744
$21,244 $21,237 $21,655 $21,757
$37,652 $36,522 $39,522 $38,501
$132 $123 $144 $135
$59 $59 $60 $60
$191 $182 $204 $195
Septic tank & spray irrigation with sand filter pretreatment and chlorine disinfection Septic tank & spray irrigation with recirc. sand filter pretreatment and chlorination Septic tank & spray irrigation with sand filter pretreatment and UV Septic tank & spray irrigation with recirculating sand filter pretreatment and UV
$11,890 $10,768 $13,349 $12,227
$20,670 $20,663 $21,190 $21,183
$32,580 $31,431 $34,539 $33,410
$96 $87 $107 $98
$57 $57 $59 $59
$153 $144 $166 $157
Septic tank and gravity distribution with wetland cell Aerobic treatment unit and gravity distribution Denitrification system blackwater & graywater separation and gravity distribution Denitrification system blackwater & graywater separation and LPP distribution
$5,574 $8,037 $9,963 $12,565
$23,231 $36,406 $13,508 $15,070
$28,805 $44,443 $23,471 $27,635
$45 $65 $80 $101
$65 $101 $38 $42
$109 $166 $118 $143
Septic tank & gravity distribution with 18 inch fill mound Septic tank & gravity distribution with 18 inch fill mound and chambers Septic tank & LPP distribution in at-grade system Septic tank & pressure-dosed sand mound system
$4,507 $5,326 $4,590 $4,863
$6,850 $7,032 $12,345 $12,407
$11,357 $12,357 $16,935 $17,269
$36 $43 $37 $39
$19 $20 $34 $34
$55 $62 $71 $74
a Costs displayed are not typical for all states. Costs in other states are significantly higher.
Source: Hoover, 1997.
While MBR technology is consistently improving, the cost has steadily decreased over the last 10
years. MBRs have become a favorable option due to the increasing costs of conventional technologies
that are affected by labor costs and inflationary pressure (Chapman, Leslie, and Law, 2004). Fouling is
considered a major limitation of this technology, but research is exploring new techniques to reduce
fouling effects. Currently chemical cleaning and physical removal of colloidal particles and cell debris
from the membrane, through back washing, is utilized to maintain membrane functionality. However
such processes add to the operation and maintenance costs of this technology option. Ultimately the
depreciation for the mechanical equipment and the replacement of the membranes strongly influence
the annual cost of the installation of the MBR (STOWA, 2006).
The cost of constructing a wetland will depend on the particular project at hand, but the design
flow as well as the types of macrophytes used in the wetland will vary the price. According to a study by
the USAEC and Tennessee Valley Authority the estimated amortizing capital cost of a .12 acre wetland in
Milan, TN over a 10 year period results in a cost of $1.36/Kgal; over a 30 years period, the cost is
$0.45/Kgal (Federal Remediation Technologies, 2008).
11. Conducting an alternatives analysis
This-sub-section profiles the expected economic impact of conducting any “Alternatives
Analysis” so as to better select an ecologically sound and economically cost-effective management
option to manage wastewater and not affect shellfish aquaculture. Each locality proposing a new or
expanded sanitary wastewater discharge may have varying requirements and/or needs in terms of their
adoption of the analysis. Summarized below is a thematic description of the analysis process followed by
a best guess estimate of the potential costs of undertaking such an analysis:
The analysis is comprised of the following two phases.
Phase 1: Technical feasibility This phase would involve an assessment of the land availability for alternative treatment of surface water discharge and also the related soil composition and type. Such an assessment would cost approximately $30,000 and could vary based on the nature and size of expansion. This best-guess estimate is the cost that all permit applicants subject to the regulation would have to incur as Phase 1 s required of all applicants. Phase 2: Environmental analysis and socio-economic impact analysis This phase would typically involve an assessment of the environmental and socio-economic effects of adopting the select alternative technology. Environmental analysis would include a review of groundwater impacts, swimming or recreational impacts and shellfish condemnations.
38
Socio-economic impact analysis of any technically feasible alternative would include an analysis of the affordability of the land, technology, positive and negative tax revenue impacts to the locality, eco-tourism, recreation and aesthetics.
Such an analysis that includes an accounting assessment of the technology options and
mitigation measures and socio-economic welfare assessment for a typical proposed expansion of a
locality’s wastewater discharge could cost the applicant approximately $35,000 to $55,000.
Thus, the total net cost burden to an applicant as a result of conducting any analysis would be in
the range of $30,000 for Phase 1 and total net costs of conducting Phase 1 and 2 analyses would be
$65,000 - $100,000. Conducting such an analysis would provide applicants, community/locality
residents, coastal community planners and regulators with additional information to better protect high
quality waters that are suitable for shellfish growth. Furthermore, it would assist in improving regulatory
consistency and clarity in terms of areas of high quality waters for current and/or future shellfish
resources and also provide necessary guidance on VPDES permit application process for proposed new
or expanding facilities that may have surface discharge of sanitary wastewater. Lastly, it would assist in
assessing the socio-economic impacts of proposed project in terms of its selecting alternative treatment
technology or undertaking surface water discharge.
12. Work Cited Acher, A., Fischer, E., Turnheim, R., and Manor, Y. (1997). Ecologically friendly wastewater disinfection
techniques. Water Resources, 31(6), 1398-1404. Anderson, J., and Gustafson, D. (2004). Introduction to Proper Onside Wastewater Treatment System
Practices. Amber: National Association of Wastewater Transporters, Inc
Babbie, E.R. (1973). Survey Research Methods. Wadsworth Publishing Company. Belmont, CA.
Bailey, C., Jentoft, S., and Sinclair, P. (1996). Aquaculture Development: Social Dimensions of an Emerging Industry. WestviewPress, Oxford. Bardach, J. (1997). Fish as Food and the Case for Aquaculture. In Bardach, J. (ed.) Sustainable Aquaculture. New York: Wiley and Sons. Belmont, M.A., Cantellano, E., Thompson, S., Williamson, M., Sánchez, A., Metcalfe, C.D. (2004).
Treatment of domestic Wastewater in a pilot-scale natural treatment system in central Mexico. Ecological Engineering, 23(4-5), 299-311.
Chapman, S. Leslie, G., and Law, I. (2004). Membrane bioreactors for Municipal wastewater treatment –
an Australian perceptive. Journal of Australian Water Association, 4, 65.
39

Eifert, W.H.. (2007). Natural Media filters for Stormwater and Wastewater Treatment: A Technological Overview with Case Studies. Received from http://www.in.gov/idem/prevention/partners/conference/ppts/eifert_9-1507.ppt#457,3,What are Natural Media Filters?
Evans, D.A., Rusch, K.A. (2007). Phosphorus Treatment capability of the marshland upwelling system
under low background salinity conditions. Ecological Engineering. 30(3), 250-263. Federal Remediation Technologies. (2008). Remediation Technologies Screening Materiel and Reference Guide. Constructed Wetlands. [Online] Available at
http://www.frtr.gov/matrix2/section4/4-43.html Fontenot, J., Boldor, D., Rusch, K.A., Nitrogen removal from domestic wastewater using the marshland
upwelling system. Ecological Engineering, 27(1), 22-36. Forster, Christopher. Wastewater Treatment and Technology. London: Thomas Telford Books, 2003. Freese, S.D., and Nozaic, D.J. (2004). Chlorine: Is it really so bad and what are the alternatives?. Water
SA, 30(5), 18-24. Grimble, Robin and Wellard, K. (1997). Stakeholder methodologies in natural resource management. A
review of principles, contexts, experiences and opportunities. Agricultural Systems Journal, 55(2), 173-193.
Hammond, C, Tyson, T. (1991). Septic Tank Design and Construction. Athens, GA: University of Georgia,
Cooperative Extension Service. Hoover, M.T., 1997. A framework for site evaluation, design, and engineering of on-site technologies
within a management context. Marine Studies Consortium, Waquoit Bay National Estuarine Research Reserve, and ad hoc Task Force for Decentralized Wastewater Management. Marine Studies Consortium, 400 Heath St., Chestnut Hill, MA 02167
Ivery, Graham. (1996). Aerobic treatment units (ATUs): Appropriate technology for onsite wastewater
treatment and re-use. Desalination, 106, 295-303. Jantrania, A.R. and Gross, M.A. Advanced onsite wastewater system stechnologies. Boca Raton: Taylor
and Francis Group, 2006. Kitis, M. (2003). Disinfection of wastewater with peracetic acid: a review. Environment International,
30, 47-55. Kolch, A. (1999). Disinfecting drinking water with UV light. Pollution Engineering, 31(10), 34-36. Liu, J., Dong, Y., Xu, H., Wang, D., Xu, J. (2007). Accumulation of Cd, Pb, and Zn by 19 wetland plant
species in constructed wetland. Journal of Hazardous materials, 147(3), 947-953. Marshall, P.G. (2005) Socratic Method and the irreducible Core of Legal Education. Lecture Minnesota Law Review.
40

Masi, F., Marinuzzi, N. (2007). Constructed wetlands for the Mediterranean countries: Hybrid systems for water reuse and sustainable sanitation. Desalination, 215(1-3), 44-55.
Mazur, N., Asslin, H., Curtis, A., Byron, I., and Magpantay, C. (2004). Community Perceptions of
Aquaculture: Report on the Eyre Peninsula. Bureau of Rural Sciences: Canberra. Middlebrooks, J.E., Reed, S.C., and Crites, R.W. Natural Wastewater Treatment Systems. Boca Raton: Taylor and Francis Group, 2005. Patton, M.Q. (1980). Qualitative Evaluation Methods. Sage Publications, Thousand Oak, Ca.
Petts, J. and B. Leach. 2000. Evaluating Methods for Public Participation: Literature Review. R & Technical report: E2-030. Bristol: Environment Agency.
Rosenberger, S., Krüger, U., Witzig, R., Manz, W., Szewzyk, U., Kraume, M. (2002). Performance of a bioreactor with submerged membranes for aerobic treatment of municipal waste water. Water Research, 36, 413-420.
Schreffler, C.L., Galeone, D.G., Veneziale, J.M., Oslon, L.E., and O’Brien, D.L. (2005). Effects of Spray
Irrigated Treated Effluent on Water Quantity and Quality, and the Fate and Transport of Nitrogen in a Small Watershed, New Garden Township, Chester County, Pennsylvania. U.S. Geological Survey, Scientific Investigations Report 2005-5043.
Selecky, M. (2007). Recommended Standards and Guidance for Performance, Application, Design and
Operation and Maintenance: Gravelless Distribution Products. Washington State Department of Health.
State Water Control Board. (2007). Notice of Intended Regulatory Action: 9 VAC 25-260
and 9 VAC 25-370 [Online] Available at http://www.deq.virginia.gov/export/sites/default/wqs/documents/SHELL_THNOIRA.pdf
STOWA. (2006). Membrane BioReactor (MBR). [Online] Available at: http://www.stowaselectedtechnologies.nl/Sheets/Sheets/Membrane.BioReactor.MBR..html
Symond, J.M., Bellar, T.A., Caswell, J.K., Demarco J., Kropp, K.L., Robeck G.G., Seeger, D.R., Slocum C.J.,
and Smith, B.L. (1975). National organics reconnaissance survey for halogenated organics. Journal of American Water Works Association, 67(11), 635-647.
USEPA (U.S. Environmental Protection Agency). (2002). Onsite Wastewater Treatment Systems Manuel.
Office of Water and Office of Research and Develop, EPA publication 625/R-00/008. USEPA. (2002). National Water Quality Inventory, 2000 Report. Office of Water, EPA
publication 841-R-02-001. USEPA. (2004). Primer for municipal wastewater treatment systems. Office of Water, EPA
no. 832-R-04-001.
41
USEPA. (2005). Handbook for Managing Onsite and Clustered (Decentralized) Wastewater Treatment Systems. Office of Water, EPA no. 832-B-05-001.
USEPA. (2008). Introduction to the Clean Water Act. [Online] Available at
http://www.epa.gov/watertrain/cwa/ Virginia Department of Health. (2008). Division of Onsite Sewage & Water Services. [Online] Available at
http://www.vdh.state.va.us/EnvironmentalHealth/ONSITE/ Watson, R.E., Rusch, K.A. (2001). Performance evaluation of a marshland upwelling system for the
removal of fecal coliform bacteria from domestic wastewater. Water Environment Research, 73(3), 339-350.
Yang, W., Cicek, N., Ilg, J. (2006). State-of-the-art of membrane bioreactors: Worldwide research and
commercial applications in North America. Journal of Membrane Science, 270, 201-211.
Yin, R.K. (2003). Case Study Research: Design and Methods 3rd ed. Sage Publications, Thousand Oaks, CA.
42
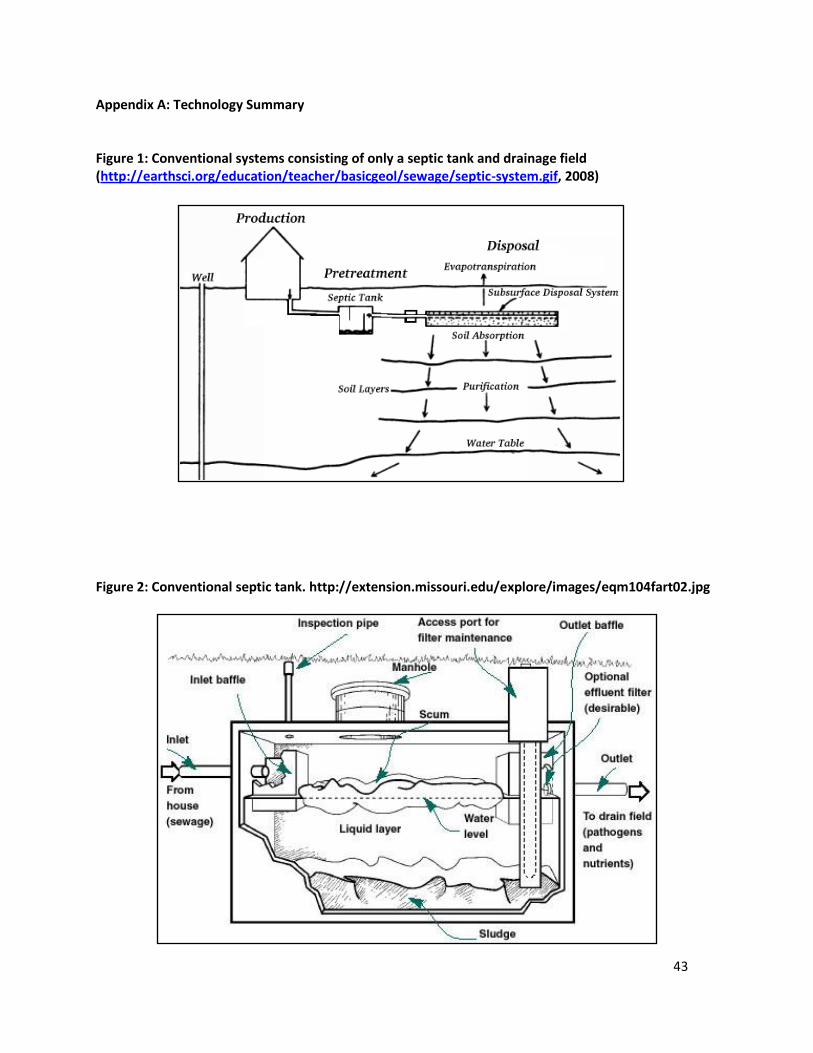
Appendix A: Technology Summary Figure 1: Conventional systems consisting of only a septic tank and drainage field (http://earthsci.org/education/teacher/basicgeol/sewage/septic-system.gif, 2008) Figure 2: Conventional septic tank. http://extension.missouri.edu/explore/images/eqm104fart02.jpg
43

Figure 3: A general design of an aerobic treatment unit (ATU). http://extension.missouri.edu/explore/images/wq0403art02.jpg
Figure 4: Marshland Upwelling System (Evan and Rusch, 2007)
44
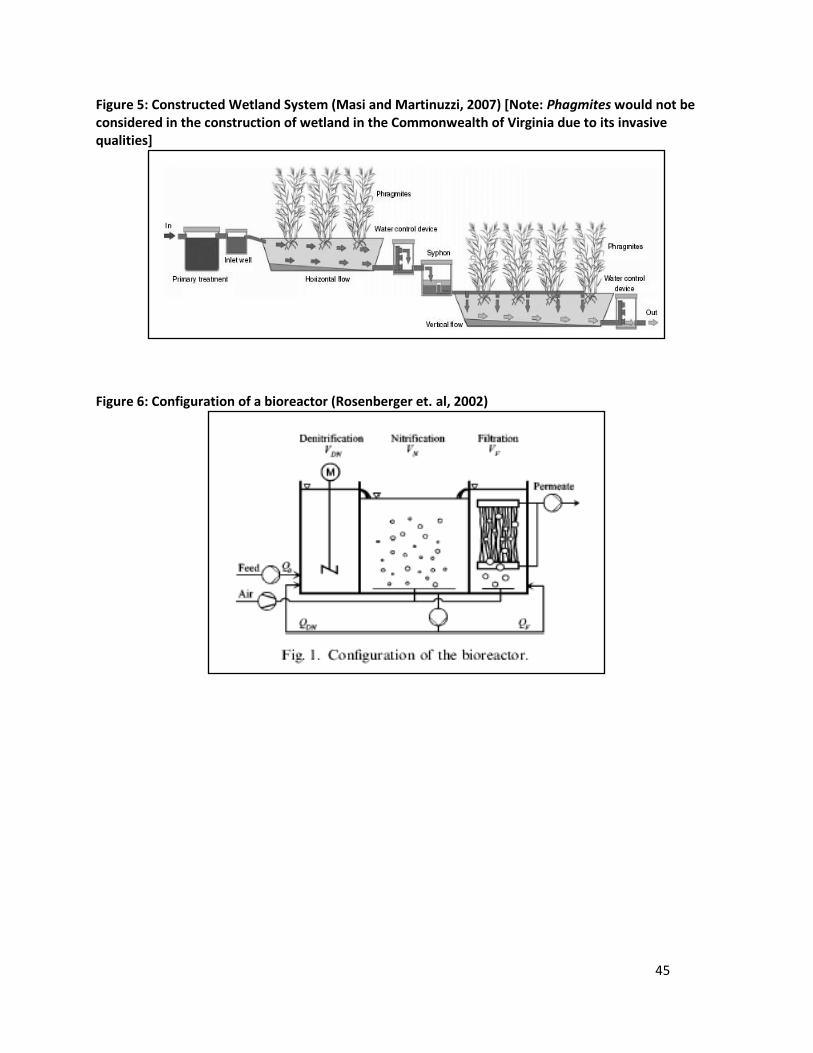
Figure 5: Constructed Wetland System (Masi and Martinuzzi, 2007) [Note: Phagmites would not be considered in the construction of wetland in the Commonwealth of Virginia due to its invasive qualities]
Figure 6: Configuration of a bioreactor (Rosenberger et. al, 2002)
45

Appendix B: Subsurface dispersal Figure 1: Placement of Infiltration system, given limiting factors and soil depth (EPA, 2008)
Figure 2: Gravel filled trench. Gravel is placed around the pipe to maintain the proper contour (Hammond and Tyson, 1991).
46

Figure 3: Cross section of a gravelless trench drainfield (Selecky, 2007)
Figure 4: Above grade mound dispersal system (EPA, 2008)
Figure 5: Drip dispersal and irrigation (ie. Zone 1 and 2) (T.G. Rankin, 2008)
47