Embed Size (px)
DESCRIPTION
Regional-scale OSSEs used to explore the impact of infrared brightness temperature observations Jason Otkin UW-Madison/CIMSS 06 February 2013. Data Assimilation System. Infrared brightness temperature assimilation examined using a regional-scale OSSE approach - PowerPoint PPT Presentation
Citation preview
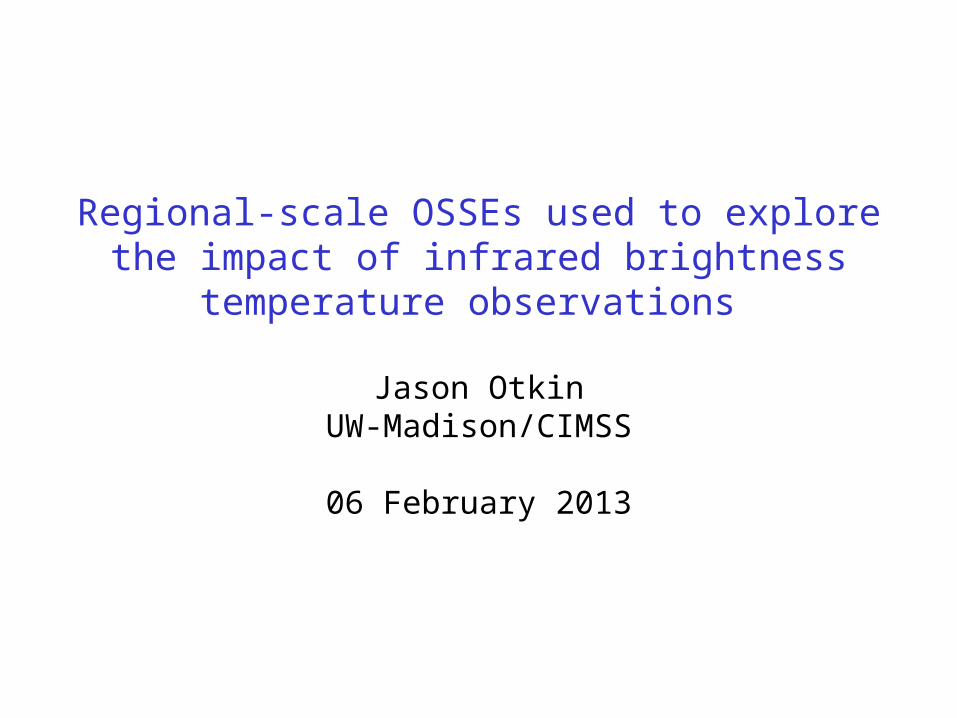
Regional-scale OSSEs used to explore the impact of infrared brightness temperature observations
Jason OtkinUW-Madison/CIMSS
06 February 2013
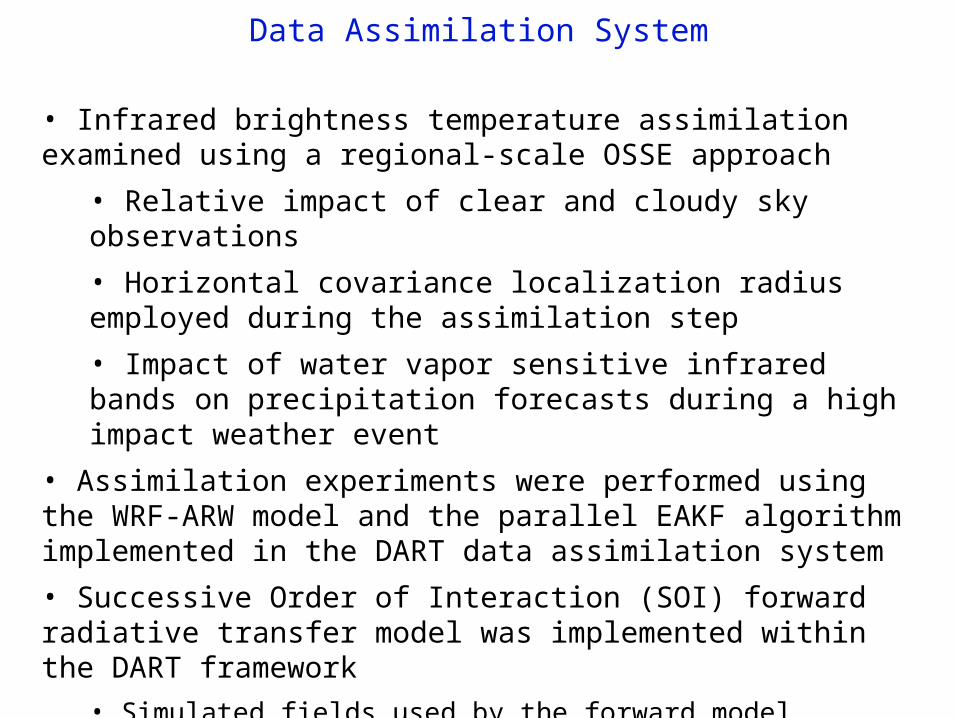
• Infrared brightness temperature assimilation examined using a regional-scale OSSE approach
• Relative impact of clear and cloudy sky observations
• Horizontal covariance localization radius employed during the assimilation step
• Impact of water vapor sensitive infrared bands on precipitation forecasts during a high impact weather event
• Assimilation experiments were performed using the WRF-ARW model and the parallel EAKF algorithm implemented in the DART data assimilation system
• Successive Order of Interaction (SOI) forward radiative transfer model was implemented within the DART framework
• Simulated fields used by the forward model include T, qv, Tskin, 10-m wind speed, and the mixing ratios and effective diameters for five hydrometeor species (cloud water, rain water, ice, snow, and graupel)
Data Assimilation System

Observations assimilated during each experiment:
• B11-ALL – both clear and cloudy sky ABI 8.5 m (band 11) Tb
• B11-CLEAR – clear-sky only ABI 8.5 m Tb
• CONV – conventional observations only
• CONV-B11 – both conventional observations and ABI 8.5 m Tb
• Control – no observations assimilated
• Assimilation experiments were performed using a 40-member ensemble with 12-km horizontal resolution and 37 vertical levels
• Observations were assimilated once per hour during a 12-hr period
• Otkin, J. A., 2010: Clear and cloudy-sky infrared brightness temperature assimilation using an ensemble Kalman filter. J. Geophys Res., 115, D19207, doi:10.1029/2009JD013759.
Clear vs Cloudy Observation Impact -- OSSE Configuration
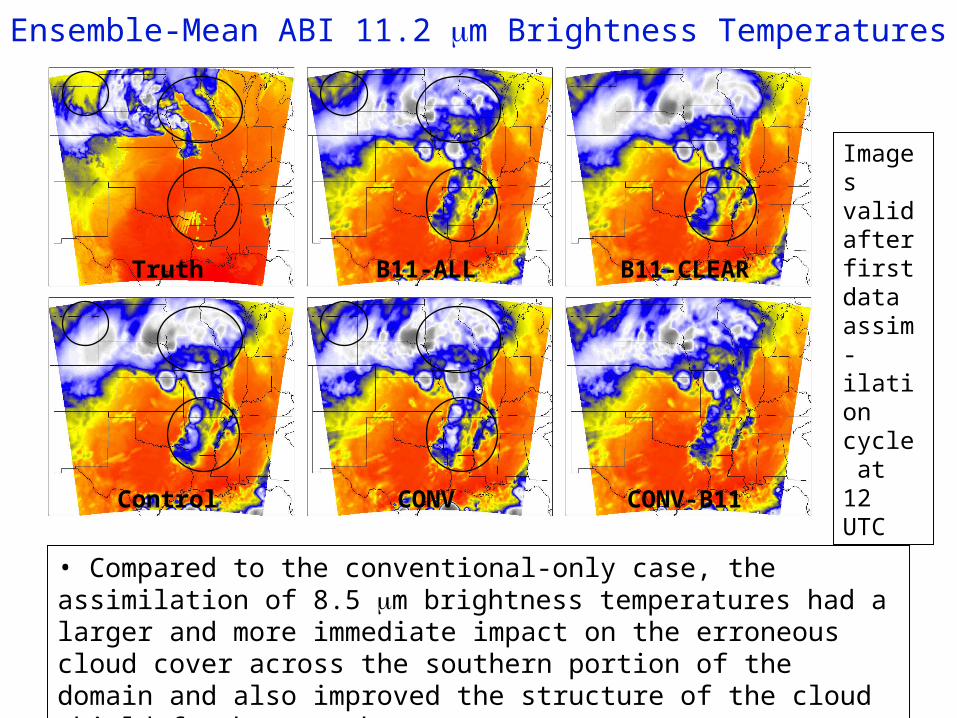
Ensemble-Mean ABI 11.2 m Brightness Temperatures
Images valid after first data assim-ilation cycle at 12 UTC
• Compared to the conventional-only case, the assimilation of 8.5 m brightness temperatures had a larger and more immediate impact on the erroneous cloud cover across the southern portion of the domain and also improved the structure of the cloud shield further north
Truth B11-ALL
CONVControl
B11-CLEAR
CONV-B11
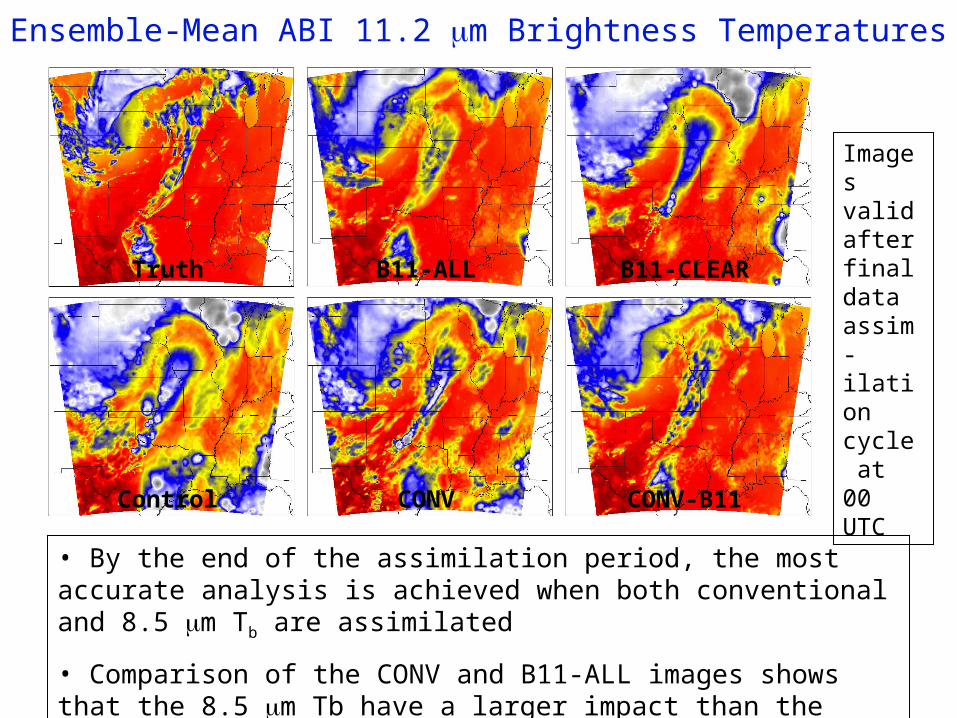
Ensemble-Mean ABI 11.2 m Brightness Temperatures
Images valid after final data assim-ilation cycle at 00 UTC
• By the end of the assimilation period, the most accurate analysis is achieved when both conventional and 8.5 m Tb are assimilated
• Comparison of the CONV and B11-ALL images shows that the 8.5 m Tb have a larger impact than the conventional observations
Truth B11-ALL
CONVControl
B11-CLEAR
CONV-B11
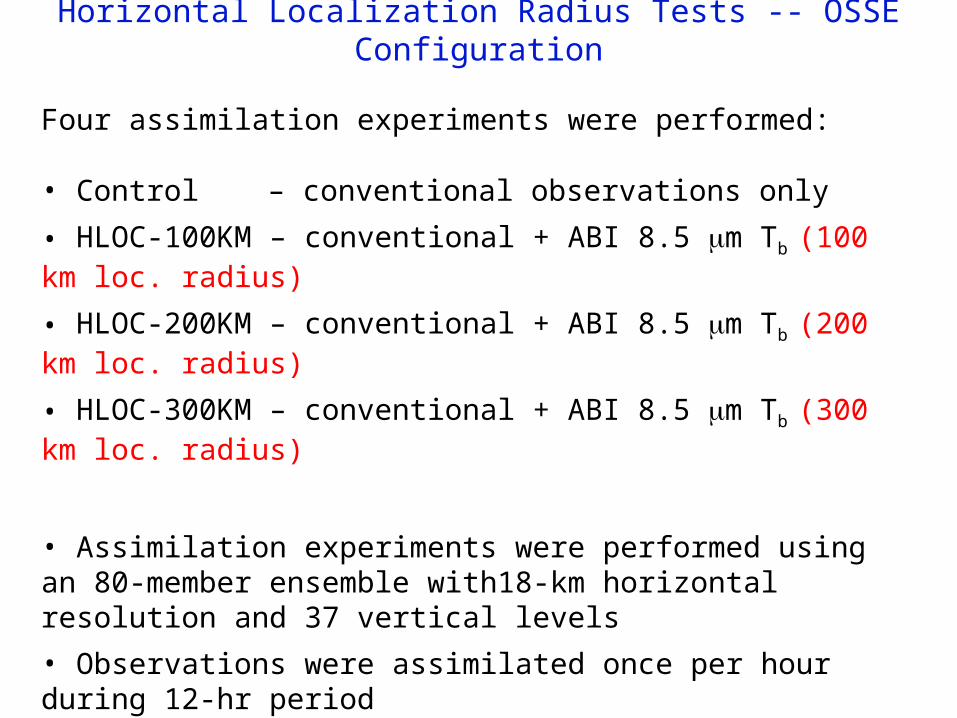
Four assimilation experiments were performed:
• Control – conventional observations only
• HLOC-100KM – conventional + ABI 8.5 m Tb (100 km loc. radius)
• HLOC-200KM – conventional + ABI 8.5 m Tb (200 km loc. radius)
• HLOC-300KM – conventional + ABI 8.5 m Tb (300 km loc. radius)
• Assimilation experiments were performed using an 80-member ensemble with18-km horizontal resolution and 37 vertical levels
• Observations were assimilated once per hour during 12-hr period
• Both clear and cloudy sky ABI 8.5 m brightness temperatures were assimilated
• Otkin, J. A., 2012: Assessing the impact of the covariance localization radius when assimilating infrared brightness temperature observations using an ensemble Kalman filter. Mon. Wea. Rev., 140, 543-561.
Horizontal Localization Radius Tests -- OSSE Configuration
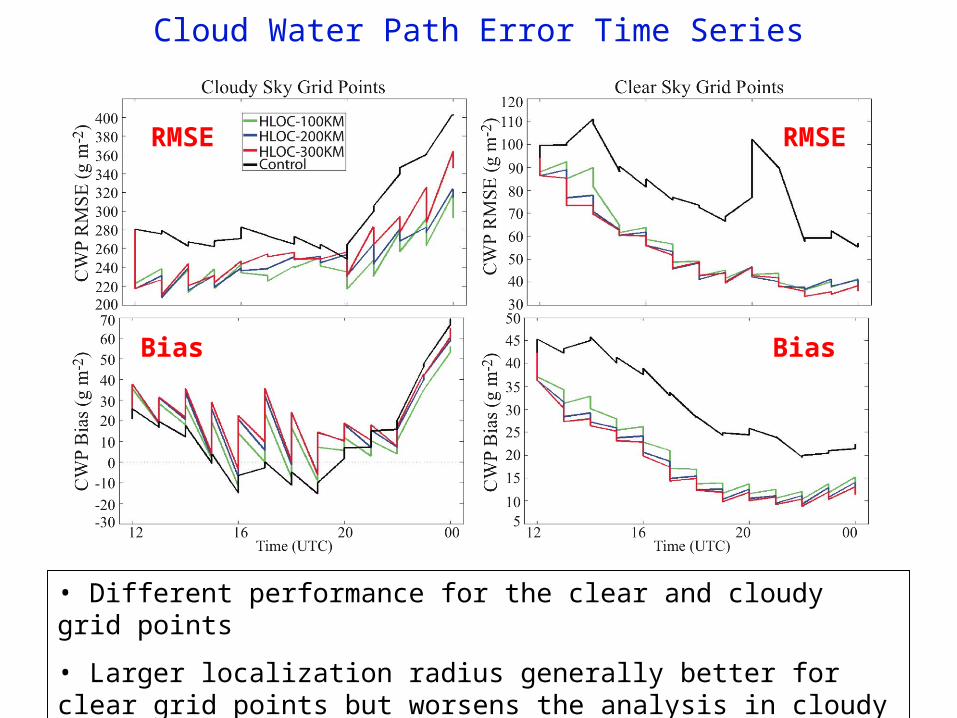
Cloud Water Path Error Time Series
• Different performance for the clear and cloudy grid points
• Larger localization radius generally better for clear grid points but worsens the analysis in cloudy regions
RMSE
BiasBias
RMSE
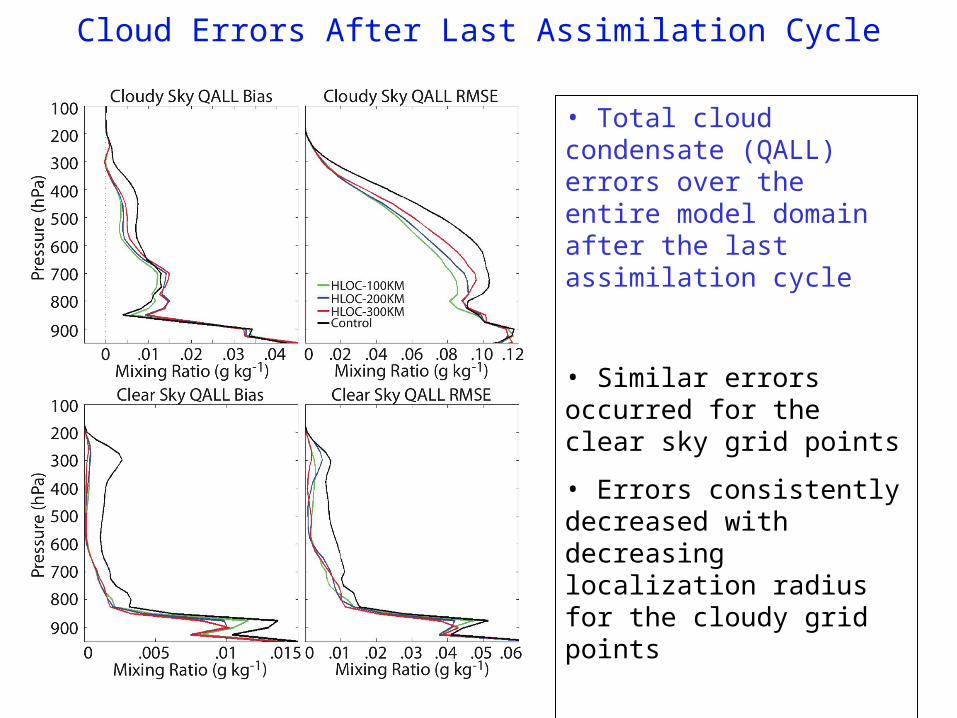
Cloud Errors After Last Assimilation Cycle
• Total cloud condensate (QALL) errors over the entire model domain after the last assimilation cycle
• Similar errors occurred for the clear sky grid points
• Errors consistently decreased with decreasing localization radius for the cloudy grid points
• Suggests different loc. radii should be used for clear and cloudy observations
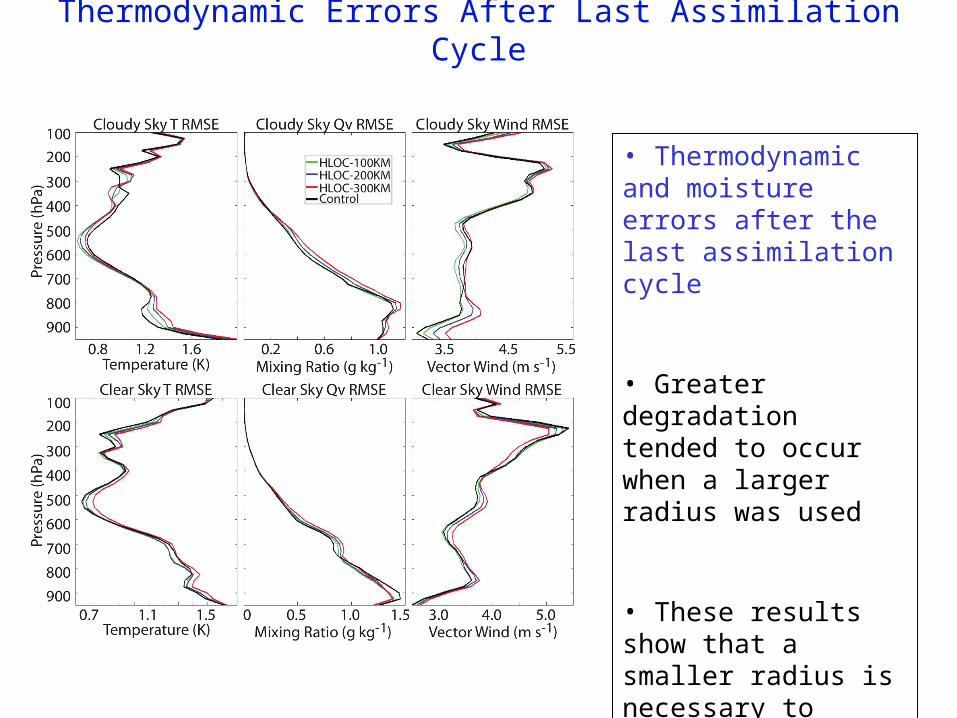
Thermodynamic Errors After Last Assimilation Cycle
• Thermodynamic and moisture errors after the last assimilation cycle
• Greater degradation tended to occur when a larger radius was used
• These results show that a smaller radius is necessary to maintain accuracy relative to Control case
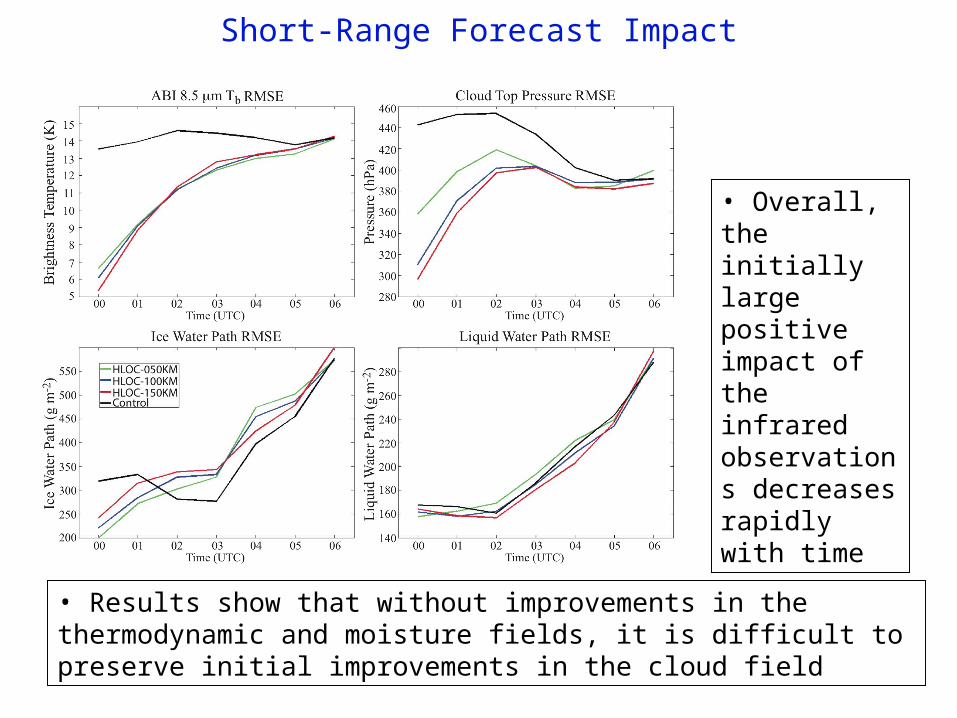
Short-Range Forecast Impact
• Results show that without improvements in the thermodynamic and moisture fields, it is difficult to preserve initial improvements in the cloud field
• Overall, the initially large positive impact of the infrared observations decreases rapidly with time
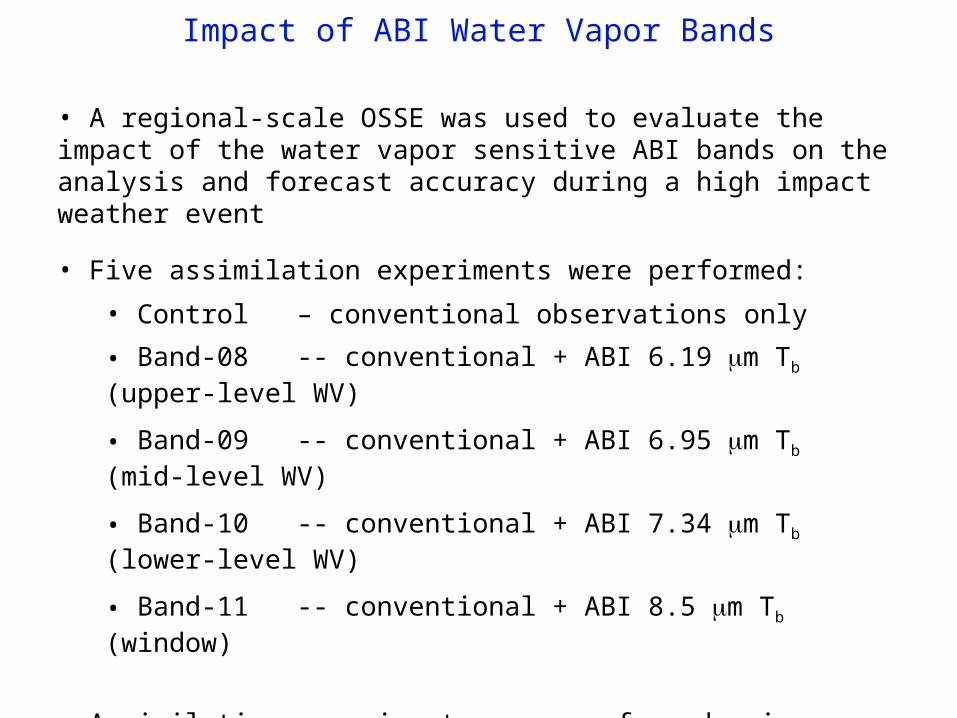
Impact of ABI Water Vapor Bands
• A regional-scale OSSE was used to evaluate the impact of the water vapor sensitive ABI bands on the analysis and forecast accuracy during a high impact weather event
• Five assimilation experiments were performed:
• Control – conventional observations only
• Band-08 -- conventional + ABI 6.19 m Tb (upper-level WV)
• Band-09 -- conventional + ABI 6.95 m Tb (mid-level WV)
• Band-10 -- conventional + ABI 7.34 m Tb (lower-level WV)
• Band-11 -- conventional + ABI 8.5 m Tb (window)
• Assimilation experiments were performed using a 60-member ensemble containing 15-km horizontal resolution and 37 vertical levels• Observations were assimilated every 30 minutes during a 6-hr period
• Otkin, J. A., 2012: Assimilation of water vapor sensitive infrared brightness temperature observations during a high impact weather event. J. Geophys. Res., 117, D19203, doi:10.1029/2012JD017568.
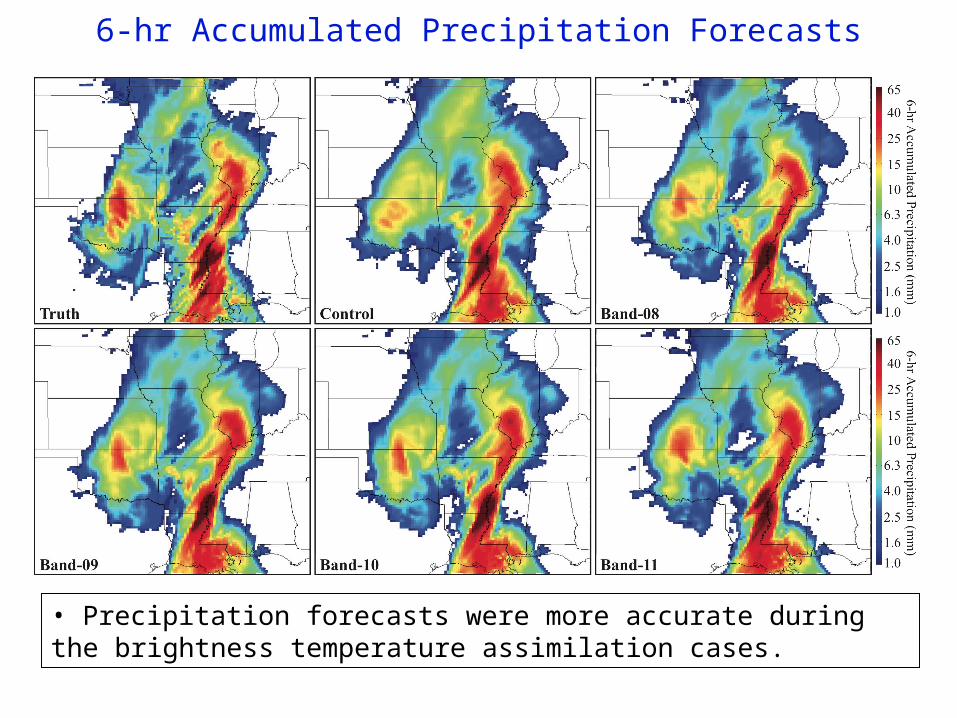
6-hr Accumulated Precipitation Forecasts
• Precipitation forecasts were more accurate during the brightness temperature assimilation cases.
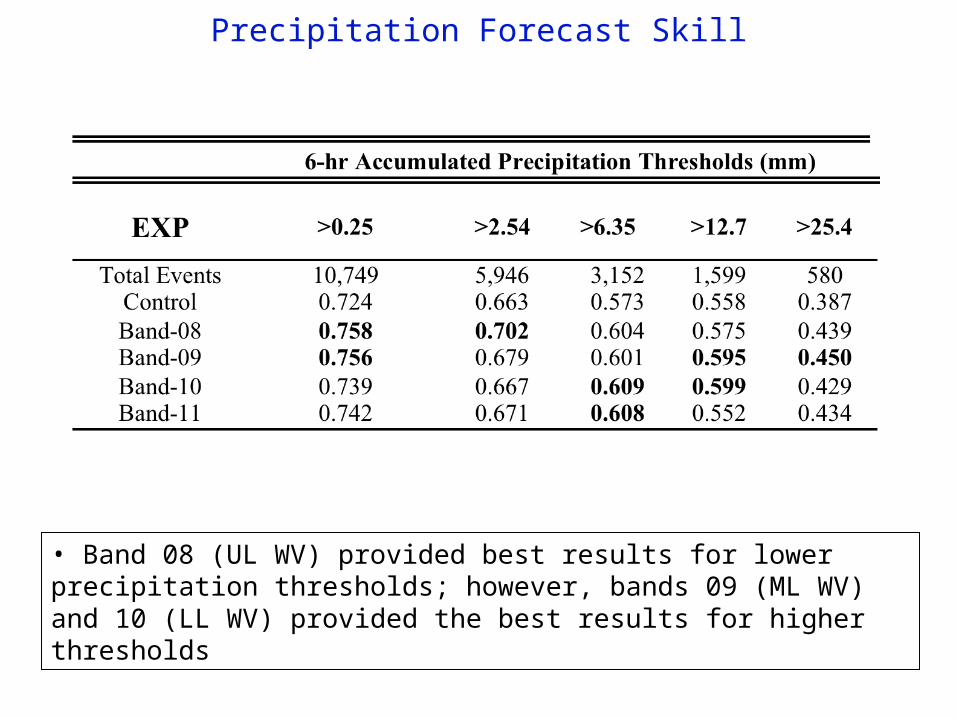
Precipitation Forecast Skill
• Band 08 (UL WV) provided best results for lower precipitation thresholds; however, bands 09 (ML WV) and 10 (LL WV) provided the best results for higher thresholds