Embed Size (px)
Citation preview
REPORT of R.I.P.O.
Regional Register of Orthopedic Prosthetic
Implantology
OVERALL DATA
HIP, KNEE AND SHOULDER ARTHROPLASTY
IN THE EMILIA-ROMAGNA REGION (ITALY)
1st January 2000 – 31st December 2012
PART ONE: HIP PROSTHESES..................................................................................................................14
1. RIPO data collection ................................................................................................................... 15 1.1 Percentage of R.I.P.O. data collection .................................................................................. 15 1.2 Ratio public/private treatment................................................................................................. 15
2. Quality of data ............................................................................................................................ 15
3. Types of surgery .......................................................................................................................... 15
4. Descriptive statistics of patients ................................................................................................. 17 4.1 Age ................................................................................................................................................. 17 4.2 Gender .......................................................................................................................................... 18 4.3 Side of surgery .............................................................................................................................. 18 4.4 Diseases treated with total hip arthroplasty ........................................................................... 18 4.5 Causes for revision ....................................................................................................................... 20
5. Types of prostheses...................................................................................................................... 22 5.1 Cups used in primary surgery .................................................................................................... 22 5.2 Cups used in total revision surgery ........................................................................................... 24 5.3 Stems used in primary surgery ................................................................................................... 25 5.4 Stems used in total revision surgery .......................................................................................... 27 5.5 Number of different types of implant ...................................................................................... 28 5.6 Resurfacing surgery ..................................................................................................................... 29 5.7 Modular neck ............................................................................................................................... 30 5.8 Articular couplings and head diameters ................................................................................ 31 5.9 Prosthesis fixation ......................................................................................................................... 34 5.10 Bone cement ............................................................................................................................. 36 5.11 Surgical techniques (surgical approach, bone graft, reinforcement rings) .................. 37
6. Types of hemiarthroplasty .......................................................................................................... 37 6.1 Heads and stem .......................................................................................................................... 37 6.2 Other characteristics of hemiarthroplasties ........................................................................... 40
7. Blood transfusion .......................................................................................................................... 40
8. Complications occurred during hospitalization ...................................................................... 41 8.1 Deaths during hospitalization .................................................................................................... 42
9. Duration of pre-operative hospitalization ................................................................................ 43
10. Analysis of survival of primary surgery ..................................................................................... 44 10.1 Cox multivariate analysis ......................................................................................................... 44 10.2 Rate of failure ............................................................................................................................. 45 10.3 Survival curves according to Kaplan Meier ......................................................................... 46 10.4 Analysis of survival in primary total hip arthroplasty ........................................................... 46 10.5 Analysis of survival in primary total hip arthroplasty – major revisions ............................. 48 10.6 Analysis of survival according to model of prosthesis ........................................................ 49 10.7 Analysis of survival in primary total hip arthroplasty according to fixation .................... 52 10.8 Analysis of survival in primary total hip arthroplasty according to coupling ................. 55 10.9 Survival analysis of acetabular component ........................................................................ 57 10.10 Analysis of the survivorship of the acetabular cup according to commercial type . 58 10.11 Survival analysis of stem ......................................................................................................... 60 10.12 Analysis of the survivorship of the femoral component according to commercial
type ...................................................................................................................................................... 61 10.13 Survival analysis of total revision ........................................................................................... 63 10.14 Survival analysis of hemiarthroplasty ................................................................................... 64 10.15 Survival analysis of resurfacing ............................................................................................. 65
PART TWO: KNEE PROSTHESIS ...............................................................................................................66
11. RIPO capture .............................................................................................................................. 67 11.1 Percentage of capture ............................................................................................................ 67 11.2 Ratio public/private treatment .............................................................................................. 67
12. Type of operation ...................................................................................................................... 68
13. Descriptive statistics of patients with knee prosthesis ........................................................... 69 13.1 Age .............................................................................................................................................. 69 13.2 Gender ........................................................................................................................................ 70 13.3 Side of surgery ............................................................................................................................ 70 13.4 Bilateral arthroplasty ................................................................................................................. 70 13.5 Diseases treated with unicompartmental knee prosthesis ............................................... 71 13.6 Diseases treated with bi-tricompartmental knee prosthesis ............................................. 71 13.7 Causes of revision and removal ............................................................................................. 72
14. Types of knee prosthesis ........................................................................................................... 73 14.1 Unicompartmental prosthesis ................................................................................................. 73 14.2 Bi-tricompartmental knee prosthesis ..................................................................................... 74 14.3 Revision prosthesis ..................................................................................................................... 75 14.4 Prosthesis fixation ....................................................................................................................... 76 14.5 Type of insert .............................................................................................................................. 77 14.6 Bone Cement ............................................................................................................................. 78
15. Complications occurred during hospitalization .................................................................... 79 15.1 Deaths occurred during hospitalization................................................................................ 80
16. Analysis of survival of primary surgery ..................................................................................... 81 16.1 Cox multivariate analysis ......................................................................................................... 81 16.2 Rate of failure ............................................................................................................................. 82 16.3 Survival curves according to Kaplan Meier ......................................................................... 83 16.4 Analysis of survival in primary uni and bi/tri compartmental knee prosthesis ............... 83 16.5 Mobility of the bearing ............................................................................................................. 85 16.6 Re-operation due to replacement of only the patella component .............................. 86 16.7 Analysis of the survival of unicompartmental prosthesis according to the most widely
used commercial type in Emilia-Romagna .................................................................................. 87 16.8 Analysis of the survival of bicompartmental prosthesis according to the most widely
used commercial type in Emilia-Romagna .................................................................................. 88 PART THREE: SHOULDER PROSTHESIS ....................................................................................................90
17. RIPO capture .............................................................................................................................. 91 17.1 Capture for RIPO ....................................................................................................................... 91 17.2 Ratio public/private treatment .............................................................................................. 91
18. Type of operation ...................................................................................................................... 91
19. Descriptive statistics of patients ............................................................................................... 92 19.1 Gender ........................................................................................................................................ 92 19.2 Age .............................................................................................................................................. 92 19.3 Pathologies ................................................................................................................................. 93
20. Surgical technique, anesthesia and antithromboembolic prophylaxis ............................. 95 20.1 Type of prosthesis ...................................................................................................................... 96 20.2 Type of prosthesis ...................................................................................................................... 96
21. Duration of pre and post-operative hospitalization .............................................................. 97
22. Survival analysis .......................................................................................................................... 98
4
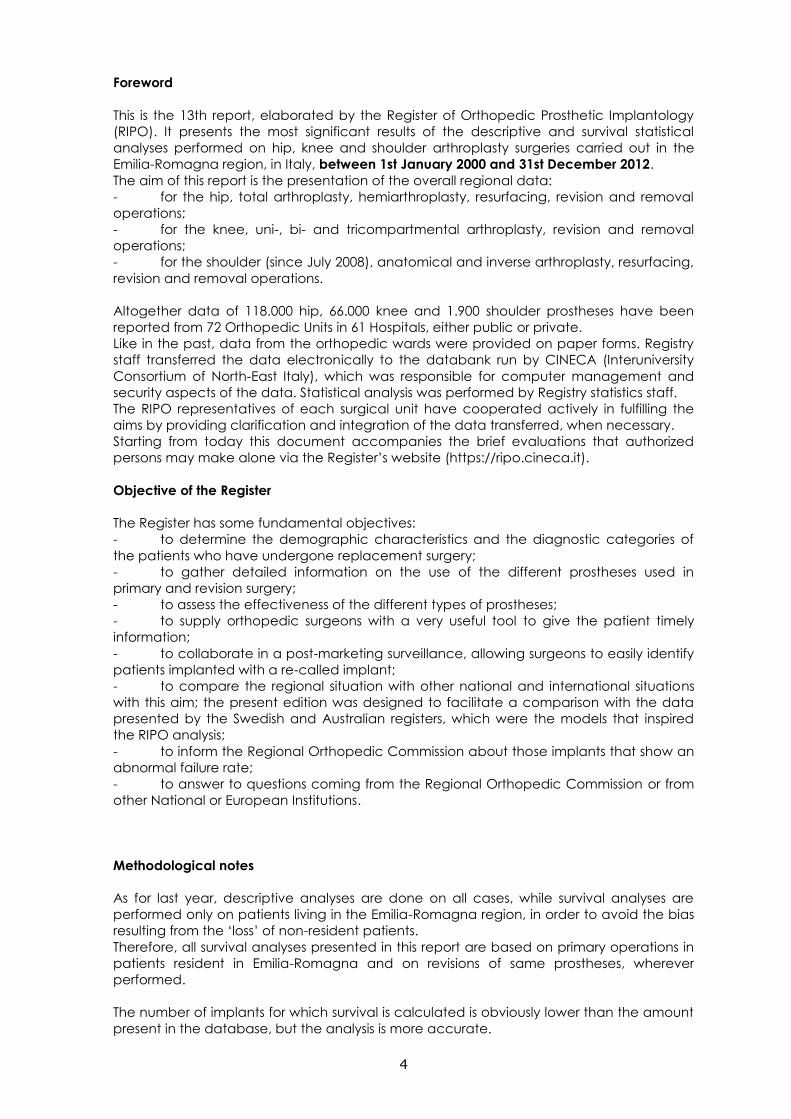
Foreword
This is the 13th report, elaborated by the Register of Orthopedic Prosthetic Implantology
(RIPO). It presents the most significant results of the descriptive and survival statistical
analyses performed on hip, knee and shoulder arthroplasty surgeries carried out in the
Emilia-Romagna region, in Italy, between 1st January 2000 and 31st December 2012.
The aim of this report is the presentation of the overall regional data:
- for the hip, total arthroplasty, hemiarthroplasty, resurfacing, revision and removal
operations;
- for the knee, uni-, bi- and tricompartmental arthroplasty, revision and removal
operations;
- for the shoulder (since July 2008), anatomical and inverse arthroplasty, resurfacing,
revision and removal operations.
Altogether data of 118.000 hip, 66.000 knee and 1.900 shoulder prostheses have been
reported from 72 Orthopedic Units in 61 Hospitals, either public or private.
Like in the past, data from the orthopedic wards were provided on paper forms. Registry
staff transferred the data electronically to the databank run by CINECA (Interuniversity
Consortium of North-East Italy), which was responsible for computer management and
security aspects of the data. Statistical analysis was performed by Registry statistics staff.
The RIPO representatives of each surgical unit have cooperated actively in fulfilling the
aims by providing clarification and integration of the data transferred, when necessary.
Starting from today this document accompanies the brief evaluations that authorized
persons may make alone via the Register’s website (https://ripo.cineca.it).
Objective of the Register
The Register has some fundamental objectives:
- to determine the demographic characteristics and the diagnostic categories of
the patients who have undergone replacement surgery;
- to gather detailed information on the use of the different prostheses used in
primary and revision surgery;
- to assess the effectiveness of the different types of prostheses;
- to supply orthopedic surgeons with a very useful tool to give the patient timely
information;
- to collaborate in a post-marketing surveillance, allowing surgeons to easily identify
patients implanted with a re-called implant;
- to compare the regional situation with other national and international situations
with this aim; the present edition was designed to facilitate a comparison with the data
presented by the Swedish and Australian registers, which were the models that inspired
the RIPO analysis;
- to inform the Regional Orthopedic Commission about those implants that show an
abnormal failure rate;
- to answer to questions coming from the Regional Orthopedic Commission or from
other National or European Institutions.
Methodological notes
As for last year, descriptive analyses are done on all cases, while survival analyses are
performed only on patients living in the Emilia-Romagna region, in order to avoid the bias
resulting from the ‘loss’ of non-resident patients.
Therefore, all survival analyses presented in this report are based on primary operations in
patients resident in Emilia-Romagna and on revisions of same prostheses, wherever
performed.
The number of implants for which survival is calculated is obviously lower than the amount
present in the database, but the analysis is more accurate.
5
As for last year, the validity of the data reported in the present report is based on the
complete adhesion to the register and degree of reliability of the information given.
The assessment of the completeness is made by comparison with the data from the
Hospital Discharge database; in the last year the Register has ‘captured’ 98% of hip and
knee operations.
As far as concerns the reliability of the data given, RIPO handles two types of data:
incontrovertible data, either that RIPO checks by comparison with other data banks
(labels of the components implanted, demographic data of the patients, dates of
admission, any date of death), and not verifiable data such as disease that led to
replacement or revision or the complications that arose during hospitalization. Reliability is
checked by sampling the data, by asking for confirmation of some information. The
percentage of responses obtained is increasing.
Explanatory guide for the survival analysis
The survival of the prosthesis is illustrated by tables and graphs.
The survival curves are calculated only on patients living in Region Emilia-Romagna; on
the x-axis is the time expressed in years, on the y-axis the percentage of survival of the
prosthesis. The curve starts, by definition, at 100% survival at the moment where the period
of follow-up begins. The prosthesis is considered to be ‘surviving’ up to when it was
necessary to replace even a single component.
The revision is, thus, the end-point. Each curve is flanked by a pair of curves symmetrical to
it that are the 95% Confidence Interval, which delimits the interval of values where at 95%
the possibility falls that a patient with prosthesis in place is found. The range of the interval
is closely dependent on the number of operations considered in the analysis. If the
number of operations is low, the uncertainty of the analysis is high, which is shown by a
wide confidence interval.
Each graph is preceded by a table showing the number of prostheses considered and
the number of failed prostheses.
The survival curves are preceded by the multivariate analysis performed according to the
Cox method.
This analysis enables us to check what, if any, independent variables among them may
influence the event, in our case the removal of at least one prosthetic component.
In the report both complete hip and knee prostheses and single components
(acetabulum and stems) were compared, if there was a sufficient number of implants (at
least 300 cases). The comparison tables show the number of implants and survival rate at
5 and 10 years.
Summary of the main results presented
Hip
During 2012 primary THA was performed in nearly 6500 patients to treat pathologies well
known, mainly primary arthrosis; arthrosis secondary to developmental dysplasia is
progressively slightly decreasing. Mean age at surgery is stable (70,4yrs for women and
67,0yrs for men).
In 2012, as in past years, 90 different types of cup and 109 of stem were used; 12 and 20 of
them are ‘new’, not implanted in previous years. 40% of the stems have a modular neck,
slightly decreasing compared to past years.
Uncemented prostheses were 62% in year 2000 and 95% in year 2012, whilst hybrid fixation
was 22% and it is now 3,4%. Cemented prostheses are now only 1%, and they were 15% in
year 2000.
Most common articular coupling is ceramic on ceramic, that in 2012 represents 61,5% of
primary surgery (it was 18% in 2000); second most common is ceramic on poly (27%).
Metal on poly, that was 45% in 2000, is now reduced to 10%. Nearly half of poly is cross-
linked in met-poly and nearly two thirds in cer-poly.
Resurfacing, that starting from 2006 were progressively decreasing, during 2011 showed
an important increasing, representing 4,3% of primary surgery.
6
The survival of the hip prostheses is confirmed at very high levels. 91,5% of the 55.186
prostheses implanted in Emilia-Romagna region on resident patients are still in place 13
years after the operation.
Part (76%) of the 2.076 revisions is major revisions, where at least one component
interfacing with bone, has been revised. The remaining 24% are minor revisions (liner,
head, and modular neck).
High incidence of prosthesis breakage was observed among causes of failure; this
phenomenon is partially related to the extensive use of ceramic components and of
exchangeable necks.
Survival of resurfacing, at 9 years, is slightly lower than THA (90,2%, statistically significant).
This datum is affected by the recall of a particular model of prostheses. The most
frequently implanted resurfacing, on the contrary, shows survival comparable to
conventional THA.
Partially confirming past years results, multivariate analysis demonstrated that survival is
lower for males and young patients.
At maximum 13 years of follow up failure seems not to be affected by fixation and
articular coupling, but these two variables cannot be introduced in the Cox multivariate
analysis, as they are not independent and they are linked to other variables, such as age
at surgery. Survival curves for fixation and coupling are traced without adjusting.
We found no prosthesis (cup and stem) with sufficient number of cases, having a survival
significantly lower than the mean of the region. In the analysis of single stems or cups, very
few have survival slightly lower than the regional mean, barely statistically significant.
Hemiarthroplasty has an optimal survival of the implant (96,3% at 13 years) even if it is
burdened by a high rate of patient’s deaths due to age and general conditions of the
patients.
Total revisions are not revised the second time in 85,1% of cases at 13 yrs.
Knee
High percentage of primary knee prostheses is implanted in private structures (66% in 2012,
vs 43% in 2000).
In 2012, 12% of implanted prostheses are unicompartmental, 73% are bicompartmental
with no patella resurfacing and the remaining 15% have patella resurfacing.
95% of implants are cemented. In half of them cement is antibiotic loaded.
Procedure involving cruciate sacrifice is slightly increasing. (62,8% during last year), while
mobile inserts are used in 41,2% of implants in year 2012, slightly decreasing compared to
previous year.
Types of implanted prostheses are less numerous and more stable during years compared
to hip. Survival of bicompartmental is 94,5% at 11 yrs, survival of tricompartmental is 95,3%
and survival of unicompartmental is significantly lower (85,8%). In these analyses patella
resurfacing after primary TKA is not considered as a failure.
As requested by the Board, bicompartmental TKA survival has been calculated also
considering patella resurfacing as a failure.
The incidence of revisions due to infection in the prosthesis remains high, in particular in
total implants, where it represents a quarter of the causes of failure. At present it is
irrelevant the use of antibiotic-loaded cement than conventional one.
Cox multivariate analysis shows that the survival of bi-tricompartmental knee prostheses is
negatively influenced by age of the patient (younger is the patient, lower is the
expectancy of prosthesis survival) and by type of insert (mobile liner is worse than fixed
liner). In unicompartmental implants, age of the patient influence negatively survival,
while type of tibial component seems to be irrelevant (monoblock vs metal-back).
Some models of have prosthetic survival slightly below the regional average, as already
observed in previous report. None of these models are still used in Emilia-Romagna region.
Shoulder
Data refers to a short follow-up (4 years and half). Interesting data are emerging
particularly for types of prosthesis and epidemiology of surgery.
Reverse prosthesis is the most frequently implanted one (51%). Women are more affected
than men, either for fracture and elective surgery.

7
Mean age at surgery for reverse prostheses is 74 for women and 71 for men. Patients are
younger in anatomic prostheses (respectively 67 and 64). In hemiarthroplasty women are
much older than men (74 vs 62).
Reverse prosthesis is impalnted mainly in arthrosis and in fracture (17%).
Anatomic prosthesis is implanted in concentric arthrosis (82%) while hemiartrhoplasties
treat both fractures (62%) and arthrosis.
Fixation of total is mainly cementless; fixation for hemi is equally distributed between
cemented and cementless.
Survival at 4 yrs is 99,2% for anatomical, 97,4% for reverse and 93,5% for hemi.
8
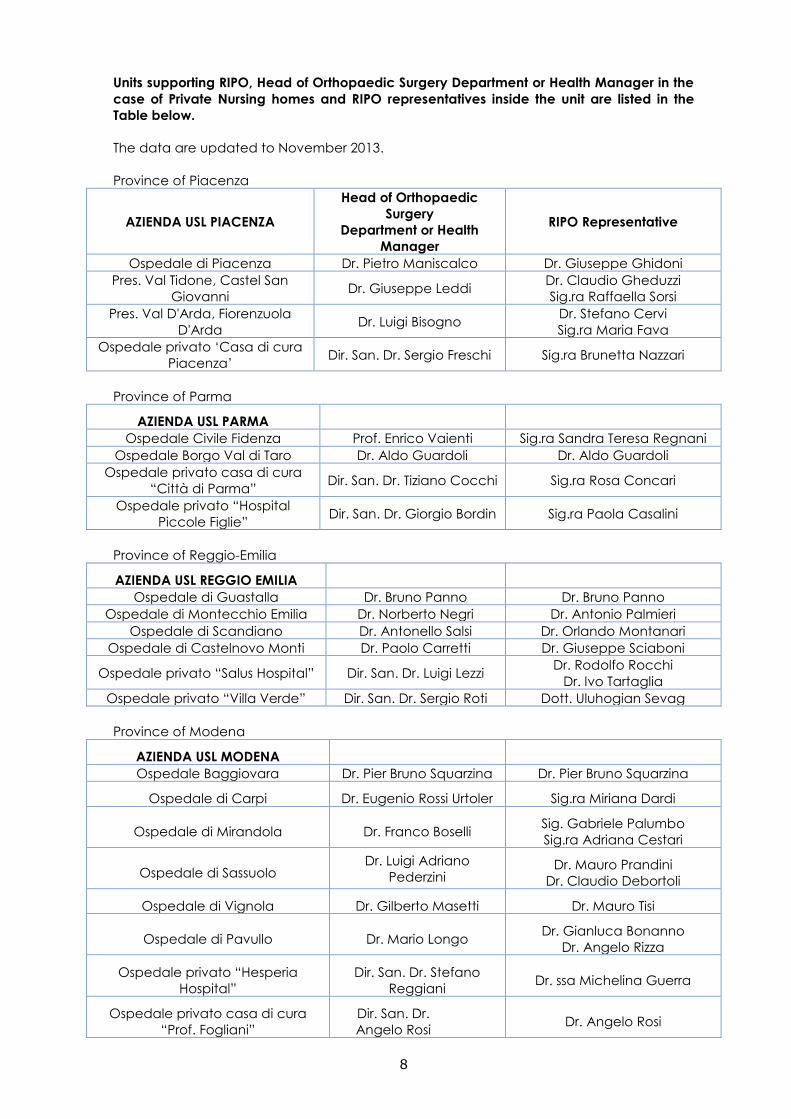
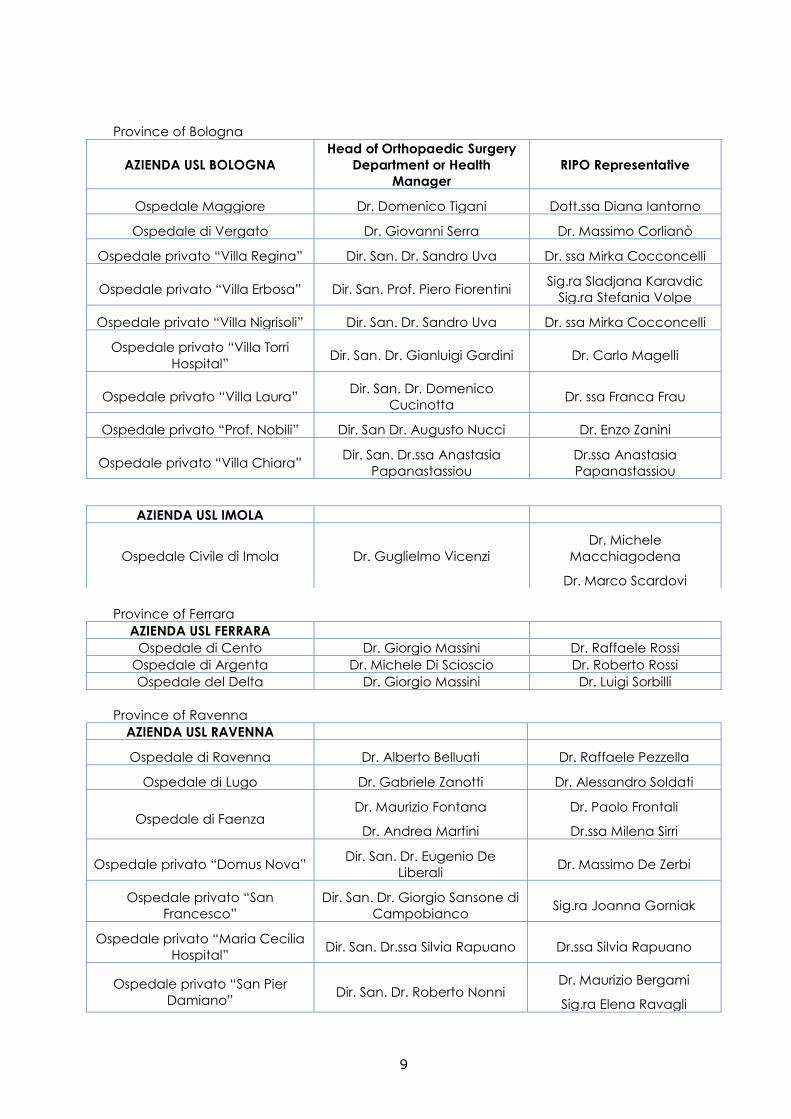
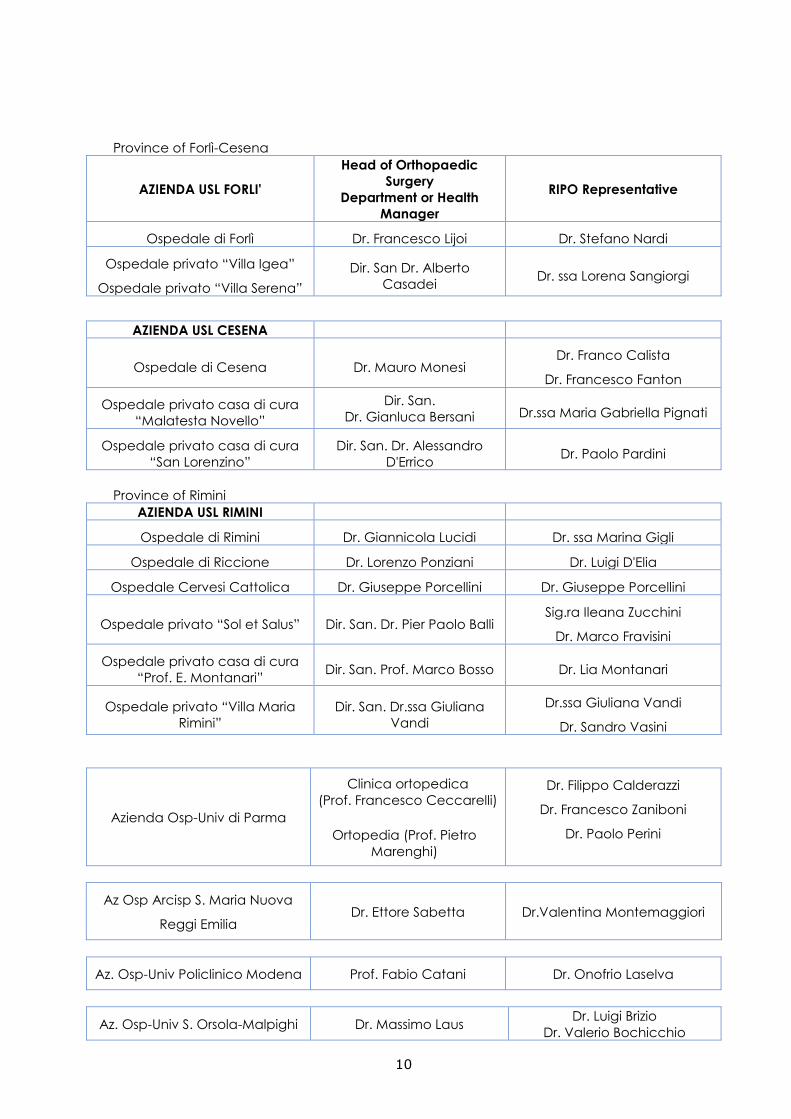
Units supporting RIPO, Head of Orthopaedic Surgery Department or Health Manager in the
case of Private Nursing homes and RIPO representatives inside the unit are listed in the
Table below.
The data are updated to November 2013.
Province of Piacenza
AZIENDA USL PIACENZA
Head of Orthopaedic
Surgery
Department or Health
Manager
RIPO Representative
Ospedale di Piacenza Dr. Pietro Maniscalco Dr. Giuseppe Ghidoni
Pres. Val Tidone, Castel San
Giovanni Dr. Giuseppe Leddi
Dr. Claudio Gheduzzi
Sig.ra Raffaella Sorsi
Pres. Val D'Arda, Fiorenzuola
D'Arda Dr. Luigi Bisogno
Dr. Stefano Cervi
Sig.ra Maria Fava
Ospedale privato ‘Casa di cura
Piacenza’ Dir. San. Dr. Sergio Freschi Sig.ra Brunetta Nazzari
Province of Parma
AZIENDA USL PARMA
Ospedale Civile Fidenza Prof. Enrico Vaienti Sig.ra Sandra Teresa Regnani
Ospedale Borgo Val di Taro Dr. Aldo Guardoli Dr. Aldo Guardoli
Ospedale privato casa di cura
“Città di Parma” Dir. San. Dr. Tiziano Cocchi Sig.ra Rosa Concari
Ospedale privato “Hospital
Piccole Figlie” Dir. San. Dr. Giorgio Bordin Sig.ra Paola Casalini
Province of Reggio-Emilia
AZIENDA USL REGGIO EMILIA
Ospedale di Guastalla Dr. Bruno Panno Dr. Bruno Panno
Ospedale di Montecchio Emilia Dr. Norberto Negri Dr. Antonio Palmieri
Ospedale di Scandiano Dr. Antonello Salsi Dr. Orlando Montanari
Ospedale di Castelnovo Monti Dr. Paolo Carretti Dr. Giuseppe Sciaboni
Ospedale privato “Salus Hospital” Dir. San. Dr. Luigi Lezzi Dr. Rodolfo Rocchi
Dr. Ivo Tartaglia
Ospedale privato “Villa Verde” Dir. San. Dr. Sergio Roti Dott. Uluhogian Sevag
Province of Modena
AZIENDA USL MODENA
Ospedale Baggiovara Dr. Pier Bruno Squarzina Dr. Pier Bruno Squarzina
Ospedale di Carpi Dr. Eugenio Rossi Urtoler Sig.ra Miriana Dardi
Ospedale di Mirandola Dr. Franco Boselli Sig. Gabriele Palumbo
Sig.ra Adriana Cestari
Ospedale di Sassuolo Dr. Luigi Adriano
Pederzini Dr. Mauro Prandini
Dr. Claudio Debortoli
Ospedale di Vignola Dr. Gilberto Masetti Dr. Mauro Tisi
Ospedale di Pavullo Dr. Mario Longo Dr. Gianluca Bonanno
Dr. Angelo Rizza
Ospedale privato “Hesperia
Hospital”
Dir. San. Dr. Stefano
Reggiani Dr. ssa Michelina Guerra
Ospedale privato casa di cura
“Prof. Fogliani”
Dir. San. Dr.
Angelo Rosi Dr. Angelo Rosi
9
Province of Bologna
Province of Ferrara
AZIENDA USL FERRARA
Ospedale di Cento Dr. Giorgio Massini Dr. Raffaele Rossi
Ospedale di Argenta Dr. Michele Di Scioscio Dr. Roberto Rossi
Ospedale del Delta Dr. Giorgio Massini Dr. Luigi Sorbilli
Province of Ravenna
AZIENDA USL RAVENNA
Ospedale di Ravenna Dr. Alberto Belluati Dr. Raffaele Pezzella
Ospedale di Lugo Dr. Gabriele Zanotti Dr. Alessandro Soldati
Ospedale di Faenza Dr. Maurizio Fontana
Dr. Andrea Martini
Dr. Paolo Frontali
Dr.ssa Milena Sirri
Ospedale privato “Domus Nova” Dir. San. Dr. Eugenio De
Liberali Dr. Massimo De Zerbi
Ospedale privato “San
Francesco”
Dir. San. Dr. Giorgio Sansone di
Campobianco Sig.ra Joanna Gorniak
Ospedale privato “Maria Cecilia
Hospital” Dir. San. Dr.ssa Silvia Rapuano Dr.ssa Silvia Rapuano
Ospedale privato “San Pier
Damiano” Dir. San. Dr. Roberto Nonni
Dr. Maurizio Bergami
Sig.ra Elena Ravagli
AZIENDA USL BOLOGNA
Head of Orthopaedic Surgery
Department or Health
Manager
RIPO Representative
Ospedale Maggiore Dr. Domenico Tigani Dott.ssa Diana Iantorno
Ospedale di Vergato Dr. Giovanni Serra Dr. Massimo Corlianò
Ospedale privato “Villa Regina” Dir. San. Dr. Sandro Uva Dr. ssa Mirka Cocconcelli
Ospedale privato “Villa Erbosa” Dir. San. Prof. Piero Fiorentini Sig.ra Sladjana Karavdic
Sig.ra Stefania Volpe
Ospedale privato “Villa Nigrisoli” Dir. San. Dr. Sandro Uva Dr. ssa Mirka Cocconcelli
Ospedale privato “Villa Torri
Hospital” Dir. San. Dr. Gianluigi Gardini Dr. Carlo Magelli
Ospedale privato “Villa Laura” Dir. San. Dr. Domenico
Cucinotta Dr. ssa Franca Frau
Ospedale privato “Prof. Nobili” Dir. San Dr. Augusto Nucci Dr. Enzo Zanini
Ospedale privato “Villa Chiara” Dir. San. Dr.ssa Anastasia
Papanastassiou
Dr.ssa Anastasia
Papanastassiou
AZIENDA USL IMOLA
Ospedale Civile di Imola Dr. Guglielmo Vicenzi
Dr. Michele
Macchiagodena
Dr. Marco Scardovi
10
Province of Forlì-Cesena
AZIENDA USL FORLI'
Head of Orthopaedic
Surgery
Department or Health
Manager
RIPO Representative
Ospedale di Forlì Dr. Francesco Lijoi Dr. Stefano Nardi
Ospedale privato “Villa Igea”
Ospedale privato “Villa Serena”
Dir. San Dr. Alberto
Casadei Dr. ssa Lorena Sangiorgi
AZIENDA USL CESENA
Ospedale di Cesena Dr. Mauro Monesi Dr. Franco Calista
Dr. Francesco Fanton
Ospedale privato casa di cura
“Malatesta Novello”
Dir. San.
Dr. Gianluca Bersani Dr.ssa Maria Gabriella Pignati
Ospedale privato casa di cura
“San Lorenzino”
Dir. San. Dr. Alessandro
D'Errico Dr. Paolo Pardini
Province of Rimini
AZIENDA USL RIMINI
Ospedale di Rimini Dr. Giannicola Lucidi Dr. ssa Marina Gigli
Ospedale di Riccione Dr. Lorenzo Ponziani Dr. Luigi D'Elia
Ospedale Cervesi Cattolica Dr. Giuseppe Porcellini Dr. Giuseppe Porcellini
Ospedale privato “Sol et Salus” Dir. San. Dr. Pier Paolo Balli Sig.ra Ileana Zucchini
Dr. Marco Fravisini
Ospedale privato casa di cura
“Prof. E. Montanari” Dir. San. Prof. Marco Bosso Dr. Lia Montanari
Ospedale privato “Villa Maria
Rimini”
Dir. San. Dr.ssa Giuliana
Vandi
Dr.ssa Giuliana Vandi
Dr. Sandro Vasini
Azienda Osp-Univ di Parma
Clinica ortopedica
(Prof. Francesco Ceccarelli)
Ortopedia (Prof. Pietro
Marenghi)
Dr. Filippo Calderazzi
Dr. Francesco Zaniboni
Dr. Paolo Perini
Az Osp Arcisp S. Maria Nuova
Reggi Emilia Dr. Ettore Sabetta Dr.Valentina Montemaggiori
Az. Osp-Univ Policlinico Modena Prof. Fabio Catani Dr. Onofrio Laselva
Az. Osp-Univ S. Orsola-Malpighi Dr. Massimo Laus Dr. Luigi Brizio
Dr. Valerio Bochicchio
11
Az Osp-Univ Sant Anna Ferrara Prof. Leo Massari
Dr. Gaetano Caruso
Dr.ssa Carlotta Pari
Istituto Ortopedico Rizzoli
Clinica Ortopedica e Traumatologica I (Prof. Sandro
Giannini)
Clinica Ortopedica e Traumatologica II (Prof. Maurilio
Marcacci)
Chirurgia di Revisione della protesi d’anca e sviluppo
nuovi impianti (Dr. Giovanni Pignatti)
Chirurgia ortopedica conservativa e tecniche innovative
(Dr. Dante Dallari)
Chirurgia della spalla e del gomito (Dr. Roberto Rotini)
Clinica Ortopedica e Traumatologica III a prevalente
indirizzo Oncologico (Prof. Davide Donati f.f.)
Ortopedia Bentivoglio (Dr. Mauro Girolami)
Ortopedia-Traumatologia e Chirurgia protesica e dei
reimpianti d'anca e di ginocchio (Dr. Aldo Toni)
Chirurgia ricostruttiva articolare dell'anca e del ginocchio
(Dr. Ermanno A. Martucci)
Dir.San.= Healthcare Medical Director
12
Board
· Dr. Stefano Liverani, Direttore Sanitario IRCCS Istituto Ortopedico Rizzoli, Bologna
(Presidente)
· Dr. Stefano Boriani, Direttore di Struttura Complessa - Chirurgia Vertebrale a indirizzo
Oncologico e Degenerativo, IRCCS Istituto Ortopedico Rizzoli, Bologna
· Dr. Stefano Busetti, Direttore Sanitario Presidio Ospedaliero di Rimini – Santarcangelo –
Novafeltria, AUSL Rimini
· Prof. Fabio Catani, Direttore U.O. Ortopedia e Traumatologia, Azienda Ospedaliero-
Universitaria di Modena
· Dr.ssa Rossana De Palma, Dirigente responsabile dell’Area Governo clinico dell’Agenzia
Sanitaria e Sociale Regionale dell’Emilia-Romagna
· Dr. Salvatore Ferro, Servizio Presidi Ospedalieri, Direzione generale Sanità e Politiche
Sociali Regione Emilia-Romagna
· Dr. Mauro Girolami, Direttore Responsabile della Nuova Struttura Complessa di
Traumatologia di II Livello collocata presso la sede distaccata dell’IRCCS Istituto
Ortopedico Rizzoli, sita nell’Ospedale di Bentivoglio
· Dr. Francesco Lijoi, Direttore U.O. Ortopedia-Traumatologia, Azienda USL di Forlì
· Dr. Pietro Maniscalco, Direttore U.O. Traumatologia, Azienda USL di Piacenza
· Dr. Mauro Marabini, Direttore Sanitario Azienda USL di Ferrara
· Prof. Pietro Marenghi, Direttore Struttura complessa Ortopedia, Dipartimento Chirurgico,
Azienda Ospedaliero-Universitaria di Parma
· Dr. Giorgio Martelli, Direttore Sanitario Azienda USL di Cesena
· Prof. Leo Massari, Direttore U.O. Ortopedia, Azienda Ospedaliero- Universitaria di Ferrara
· Dr. Guido Pedrazzini, Direttore Sanitario Azienda USL di Modena
· Dr.ssa Maria Gabriella Pignati, Direttore Unità funzionale di Ortopedia – Traumatologia,
Malatesta Novello, Cesena
· Dr. Gennaro Pipino, Direttore Reparto di Ortopedia, Ospedali Privati Riuniti - Villa
Regina, Bologna
· Dr. Lorenzo Ponziani, Direttore U.O. Ortopedia e Traumatologia, Ospedale Ceccarini di
Riccione, Azienda USL di Rimini
· Dr. Luigi Prosperi, Direttore U.O. Ortopedia e Traumatologia, Ospedale Maggiore,
Azienda USL di Bologna
· Dr. Ettore Sabetta, Direttore Dipartimento Neuro-Motorio e Direttore U.O. Ortopedia,
Azienda Ospedaliera di Reggio Emilia
· Dr. Aldo Toni, Direttore di Struttura Complessa Ortopedia-Traumatologia e Chirurgia
Protesica e dei reimpianti d'anca e di ginocchio e Direttore di Struttura Complessa
Laboratorio di Tecnologia Medica, IRCCS Istituto Ortopedico Rizzoli, Bologna
· Dr. Guglielmo Vicenzi, Direttore Dipartimento Chirurgico e Direttore U.O. Ortopedia,
Azienda USL di Imola
· Dr. Gabriele Zanotti, Direttore U. O. Ortopedia e Traumatologia, Ospedale di Lugo,
Azienda USL di Ravenna
Collaborators
· Simona Bartoli, Agenzia Sanitaria e Sociale Regionale dell’Emilia-Romagna
· Susanna Trombetti, Agenzia Sanitaria e Sociale Regionale dell’Emilia-Romagna
· Chiara Ventura, Agenzia Sanitaria e Sociale Regionale dell’Emilia-Romagna

13
The report has been prepared by Dr. Susanna Stea (data manager), Dr. Barbara Bordini
(responsable for statistics), Dr. Stefano Falcioni and Dr. Cristina Ancarani (statisticians), with
collaboration of Viridiana Casara, Anne Marie Chiesa, Alessandro La Loggia, Maria Sara
Pichierri, Davide Selvaggio and Luigi Lena (graphic designer).
Technological partner for computer management of the database is CINECA of Bologna.
Bologna, 1st december 2013

14
PART ONE: HIP PROSTHESES
January 2000 – December 2012
15
1. RIPO data collection
1.1 Percentage of R.I.P.O. data collection
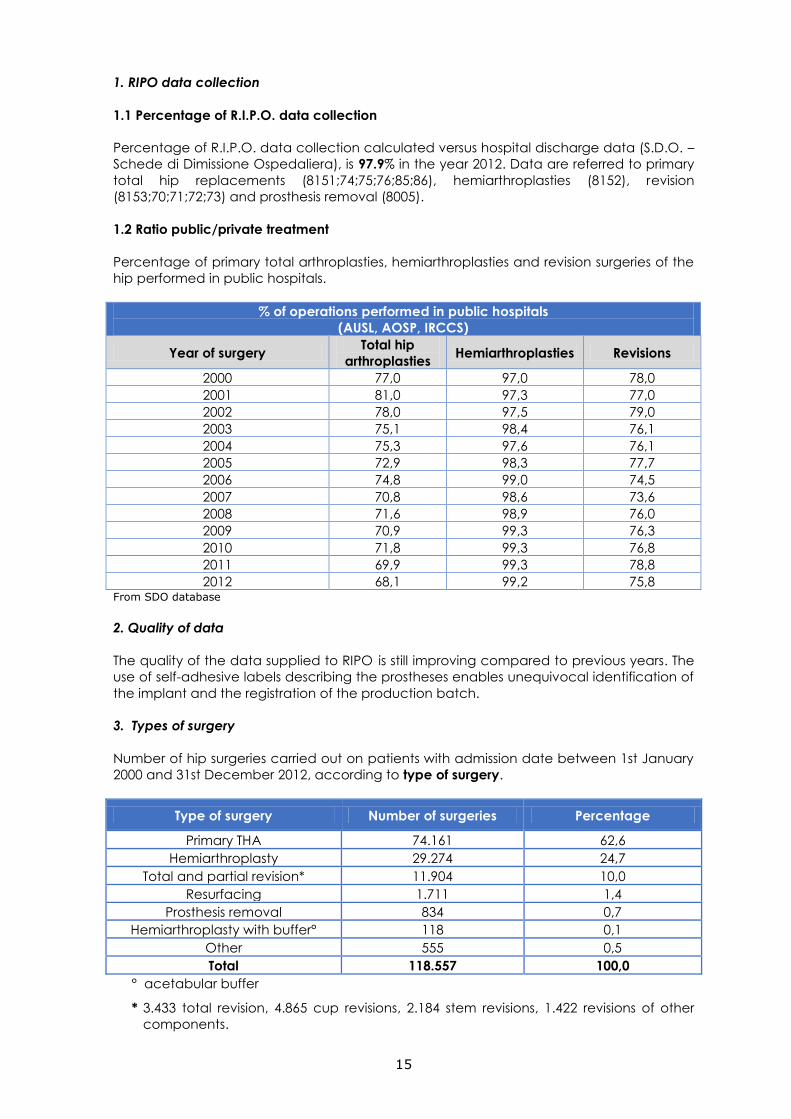
Percentage of R.I.P.O. data collection calculated versus hospital discharge data (S.D.O. –
Schede di Dimissione Ospedaliera), is 97.9% in the year 2012. Data are referred to primary
total hip replacements (8151;74;75;76;85;86), hemiarthroplasties (8152), revision
(8153;70;71;72;73) and prosthesis removal (8005).
1.2 Ratio public/private treatment
Percentage of primary total arthroplasties, hemiarthroplasties and revision surgeries of the
hip performed in public hospitals.
% of operations performed in public hospitals
(AUSL, AOSP, IRCCS)
Year of surgery Total hip
arthroplasties Hemiarthroplasties Revisions
2000 77,0 97,0 78,0
2001 81,0 97,3 77,0
2002 78,0 97,5 79,0
2003 75,1 98,4 76,1
2004 75,3 97,6 76,1
2005 72,9 98,3 77,7
2006 74,8 99,0 74,5
2007 70,8 98,6 73,6
2008 71,6 98,9 76,0
2009 70,9 99,3 76,3
2010 71,8 99,3 76,8
2011 69,9 99,3 78,8
2012 68,1 99,2 75,8 From SDO database
2. Quality of data
The quality of the data supplied to RIPO is still improving compared to previous years. The
use of self-adhesive labels describing the prostheses enables unequivocal identification of
the implant and the registration of the production batch.
3. Types of surgery
Number of hip surgeries carried out on patients with admission date between 1st January
2000 and 31st December 2012, according to type of surgery.
Type of surgery Number of surgeries Percentage
Primary THA 74.161 62,6
Hemiarthroplasty 29.274 24,7
Total and partial revision* 11.904 10,0
Resurfacing 1.711 1,4
Prosthesis removal 834 0,7
Hemiarthroplasty with buffer° 118 0,1
Other 555 0,5
Total 118.557 100,0
° acetabular buffer
* 3.433 total revision, 4.865 cup revisions, 2.184 stem revisions, 1.422 revisions of other
components.
16
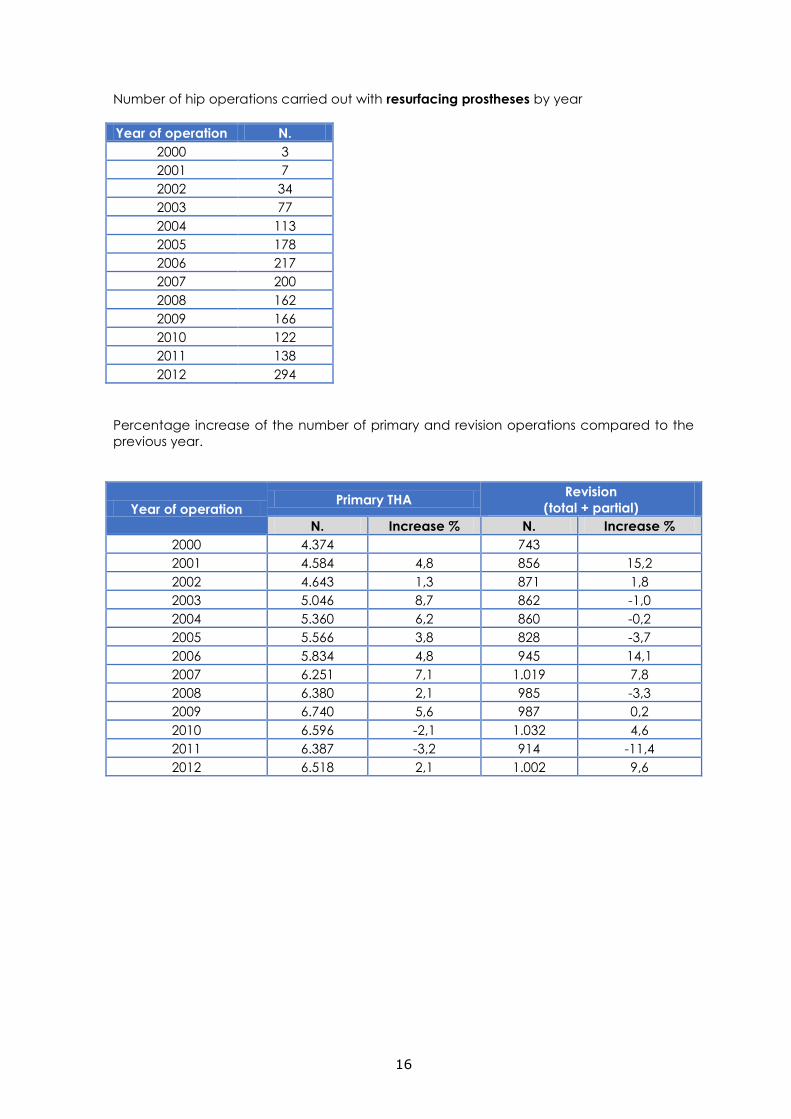
Number of hip operations carried out with resurfacing prostheses by year
Year of operation N.
2000 3
2001 7
2002 34
2003 77
2004 113
2005 178
2006 217
2007 200
2008 162
2009 166
2010 122
2011 138
2012 294
Percentage increase of the number of primary and revision operations compared to the
previous year.
Year of operation Primary THA
Revision
(total + partial)
N. Increase % N. Increase %
2000 4.374 743
2001 4.584 4,8 856 15,2
2002 4.643 1,3 871 1,8
2003 5.046 8,7 862 -1,0
2004 5.360 6,2 860 -0,2
2005 5.566 3,8 828 -3,7
2006 5.834 4,8 945 14,1
2007 6.251 7,1 1.019 7,8
2008 6.380 2,1 985 -3,3
2009 6.740 5,6 987 0,2
2010 6.596 -2,1 1.032 4,6
2011 6.387 -3,2 914 -11,4
2012 6.518 2,1 1.002 9,6
17
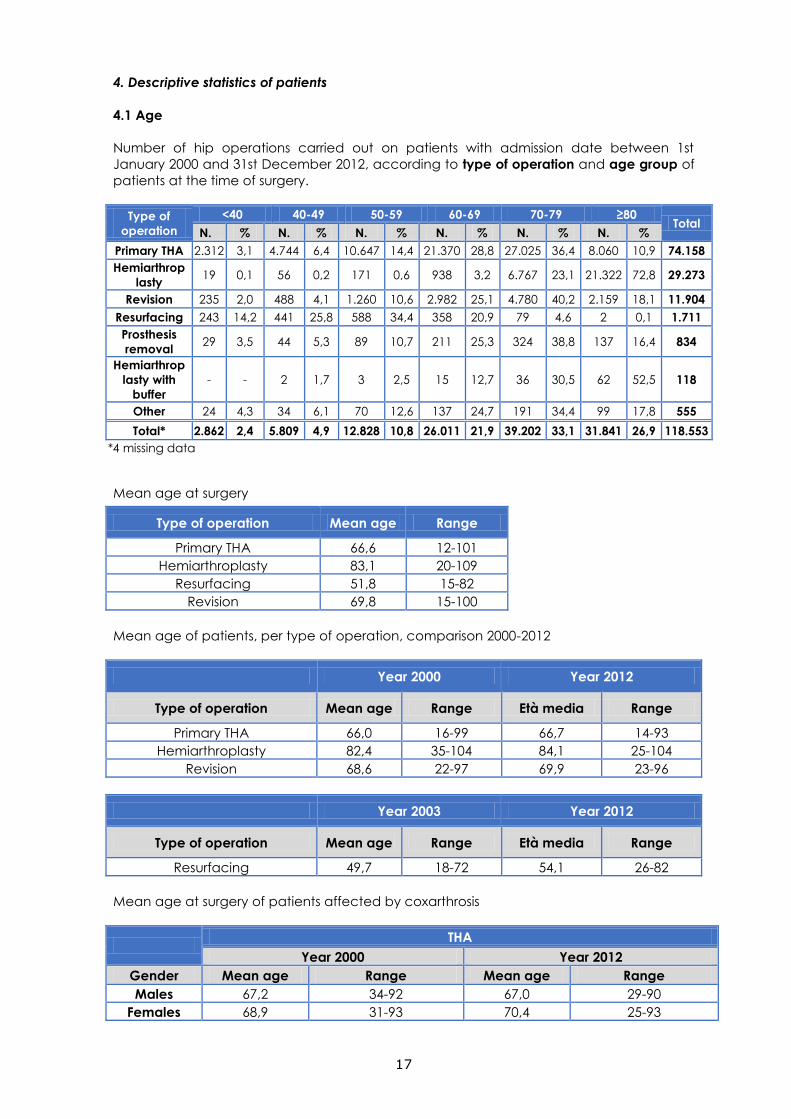
4. Descriptive statistics of patients
4.1 Age
Number of hip operations carried out on patients with admission date between 1st
January 2000 and 31st December 2012, according to type of operation and age group of
patients at the time of surgery.
Type of
operation
<40 40-49 50-59 60-69 70-79 ≥80 Total
N. % N. % N. % N. % N. % N. %
Primary THA 2.312 3,1 4.744 6,4 10.647 14,4 21.370 28,8 27.025 36,4 8.060 10,9 74.158
Hemiarthrop
lasty 19 0,1 56 0,2 171 0,6 938 3,2 6.767 23,1 21.322 72,8 29.273
Revision 235 2,0 488 4,1 1.260 10,6 2.982 25,1 4.780 40,2 2.159 18,1 11.904
Resurfacing 243 14,2 441 25,8 588 34,4 358 20,9 79 4,6 2 0,1 1.711
Prosthesis
removal 29 3,5 44 5,3 89 10,7 211 25,3 324 38,8 137 16,4 834
Hemiarthrop
lasty with
buffer
- - 2 1,7 3 2,5 15 12,7 36 30,5 62 52,5 118
Other 24 4,3 34 6,1 70 12,6 137 24,7 191 34,4 99 17,8 555
Total* 2.862 2,4 5.809 4,9 12.828 10,8 26.011 21,9 39.202 33,1 31.841 26,9 118.553
*4 missing data
Mean age at surgery
Type of operation Mean age Range
Primary THA 66,6 12-101
Hemiarthroplasty 83,1 20-109
Resurfacing 51,8 15-82
Revision 69,8 15-100
Mean age of patients, per type of operation, comparison 2000-2012
Year 2000 Year 2012
Type of operation Mean age Range Età media Range
Primary THA 66,0 16-99 66,7 14-93
Hemiarthroplasty 82,4 35-104 84,1 25-104
Revision 68,6 22-97 69,9 23-96
Year 2003 Year 2012
Type of operation Mean age Range Età media Range
Resurfacing 49,7 18-72 54,1 26-82
Mean age at surgery of patients affected by coxarthrosis
THA
Year 2000 Year 2012
Gender Mean age Range Mean age Range
Males 67,2 34-92 67,0 29-90
Females 68,9 31-93 70,4 25-93
18
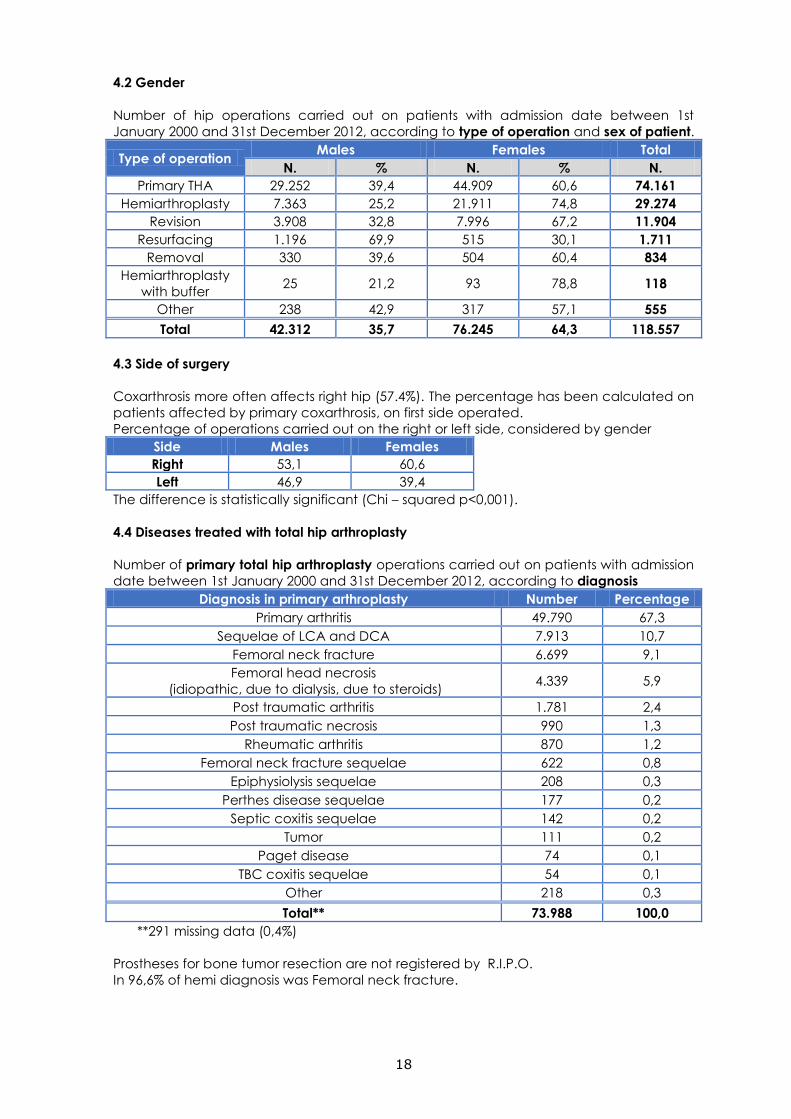
4.2 Gender
Number of hip operations carried out on patients with admission date between 1st
January 2000 and 31st December 2012, according to type of operation and sex of patient.
Type of operation Males Females Total
N. % N. % N.
Primary THA 29.252 39,4 44.909 60,6 74.161
Hemiarthroplasty 7.363 25,2 21.911 74,8 29.274
Revision 3.908 32,8 7.996 67,2 11.904
Resurfacing 1.196 69,9 515 30,1 1.711
Removal 330 39,6 504 60,4 834
Hemiarthroplasty
with buffer 25 21,2 93 78,8 118
Other 238 42,9 317 57,1 555
Total 42.312 35,7 76.245 64,3 118.557
4.3 Side of surgery
Coxarthrosis more often affects right hip (57.4%). The percentage has been calculated on
patients affected by primary coxarthrosis, on first side operated.
Percentage of operations carried out on the right or left side, considered by gender
Side Males Females
Right 53,1 60,6
Left 46,9 39,4
The difference is statistically significant (Chi – squared p<0,001).
4.4 Diseases treated with total hip arthroplasty
Number of primary total hip arthroplasty operations carried out on patients with admission
date between 1st January 2000 and 31st December 2012, according to diagnosis
Diagnosis in primary arthroplasty Number Percentage
Primary arthritis 49.790 67,3
Sequelae of LCA and DCA 7.913 10,7
Femoral neck fracture 6.699 9,1
Femoral head necrosis
(idiopathic, due to dialysis, due to steroids) 4.339 5,9
Post traumatic arthritis 1.781 2,4
Post traumatic necrosis 990 1,3
Rheumatic arthritis 870 1,2
Femoral neck fracture sequelae 622 0,8
Epiphysiolysis sequelae 208 0,3
Perthes disease sequelae 177 0,2
Septic coxitis sequelae 142 0,2
Tumor 111 0,2
Paget disease 74 0,1
TBC coxitis sequelae 54 0,1
Other 218 0,3
Total** 73.988 100,0
**291 missing data (0,4%)
Prostheses for bone tumor resection are not registered by R.I.P.O.
In 96,6% of hemi diagnosis was Femoral neck fracture.
19
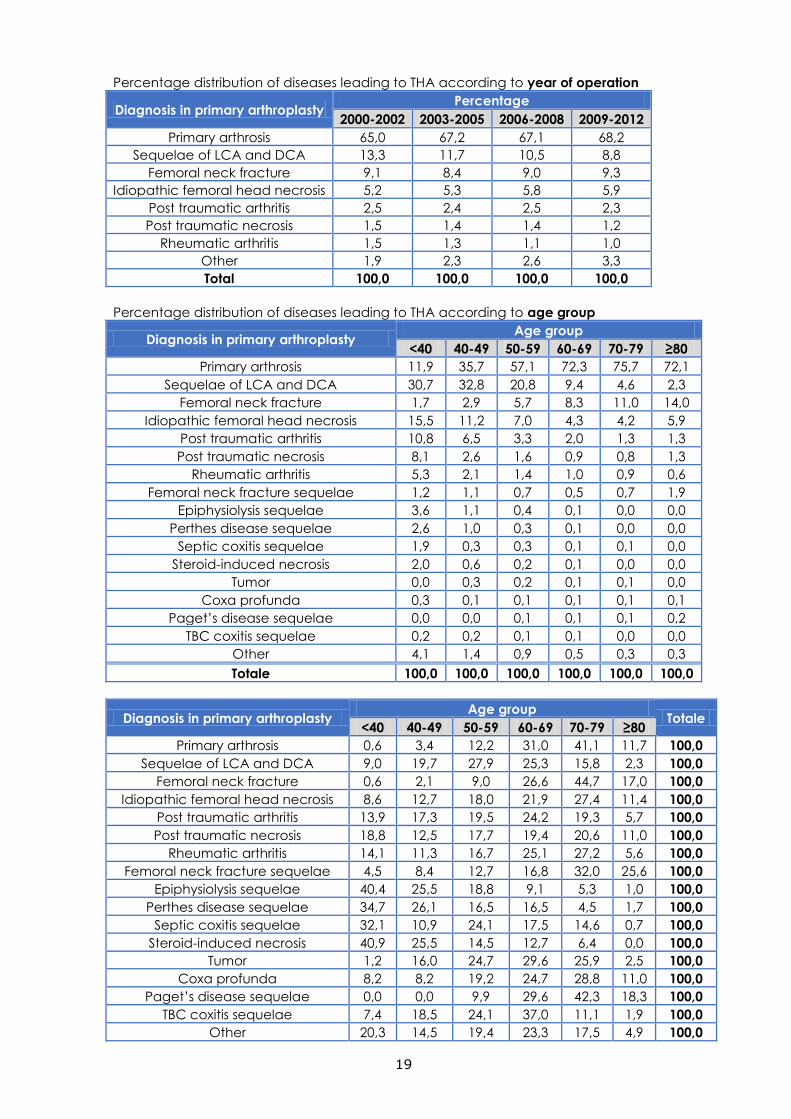
Percentage distribution of diseases leading to THA according to year of operation
Diagnosis in primary arthroplasty Percentage
2000-2002 2003-2005 2006-2008 2009-2012
Primary arthrosis 65,0 67,2 67,1 68,2
Sequelae of LCA and DCA 13,3 11,7 10,5 8,8
Femoral neck fracture 9,1 8,4 9,0 9,3
Idiopathic femoral head necrosis 5,2 5,3 5,8 5,9
Post traumatic arthritis 2,5 2,4 2,5 2,3
Post traumatic necrosis 1,5 1,4 1,4 1,2
Rheumatic arthritis 1,5 1,3 1,1 1,0
Other 1,9 2,3 2,6 3,3
Total 100,0 100,0 100,0 100,0
Percentage distribution of diseases leading to THA according to age group
Diagnosis in primary arthroplasty Age group
<40 40-49 50-59 60-69 70-79 ≥80
Primary arthrosis 11,9 35,7 57,1 72,3 75,7 72,1
Sequelae of LCA and DCA 30,7 32,8 20,8 9,4 4,6 2,3
Femoral neck fracture 1,7 2,9 5,7 8,3 11,0 14,0
Idiopathic femoral head necrosis 15,5 11,2 7,0 4,3 4,2 5,9
Post traumatic arthritis 10,8 6,5 3,3 2,0 1,3 1,3
Post traumatic necrosis 8,1 2,6 1,6 0,9 0,8 1,3
Rheumatic arthritis 5,3 2,1 1,4 1,0 0,9 0,6
Femoral neck fracture sequelae 1,2 1,1 0,7 0,5 0,7 1,9
Epiphysiolysis sequelae 3,6 1,1 0,4 0,1 0,0 0,0
Perthes disease sequelae 2,6 1,0 0,3 0,1 0,0 0,0
Septic coxitis sequelae 1,9 0,3 0,3 0,1 0,1 0,0
Steroid-induced necrosis 2,0 0,6 0,2 0,1 0,0 0,0
Tumor 0,0 0,3 0,2 0,1 0,1 0,0
Coxa profunda 0,3 0,1 0,1 0,1 0,1 0,1
Paget’s disease sequelae 0,0 0,0 0,1 0,1 0,1 0,2
TBC coxitis sequelae 0,2 0,2 0,1 0,1 0,0 0,0
Other 4,1 1,4 0,9 0,5 0,3 0,3
Totale 100,0 100,0 100,0 100,0 100,0 100,0
Diagnosis in primary arthroplasty Age group
Totale <40 40-49 50-59 60-69 70-79 ≥80
Primary arthrosis 0,6 3,4 12,2 31,0 41,1 11,7 100,0
Sequelae of LCA and DCA 9,0 19,7 27,9 25,3 15,8 2,3 100,0
Femoral neck fracture 0,6 2,1 9,0 26,6 44,7 17,0 100,0
Idiopathic femoral head necrosis 8,6 12,7 18,0 21,9 27,4 11,4 100,0
Post traumatic arthritis 13,9 17,3 19,5 24,2 19,3 5,7 100,0
Post traumatic necrosis 18,8 12,5 17,7 19,4 20,6 11,0 100,0
Rheumatic arthritis 14,1 11,3 16,7 25,1 27,2 5,6 100,0
Femoral neck fracture sequelae 4,5 8,4 12,7 16,8 32,0 25,6 100,0
Epiphysiolysis sequelae 40,4 25,5 18,8 9,1 5,3 1,0 100,0
Perthes disease sequelae 34,7 26,1 16,5 16,5 4,5 1,7 100,0
Septic coxitis sequelae 32,1 10,9 24,1 17,5 14,6 0,7 100,0
Steroid-induced necrosis 40,9 25,5 14,5 12,7 6,4 0,0 100,0
Tumor 1,2 16,0 24,7 29,6 25,9 2,5 100,0
Coxa profunda 8,2 8,2 19,2 24,7 28,8 11,0 100,0
Paget’s disease sequelae 0,0 0,0 9,9 29,6 42,3 18,3 100,0
TBC coxitis sequelae 7,4 18,5 24,1 37,0 11,1 1,9 100,0
Other 20,3 14,5 19,4 23,3 17,5 4,9 100,0
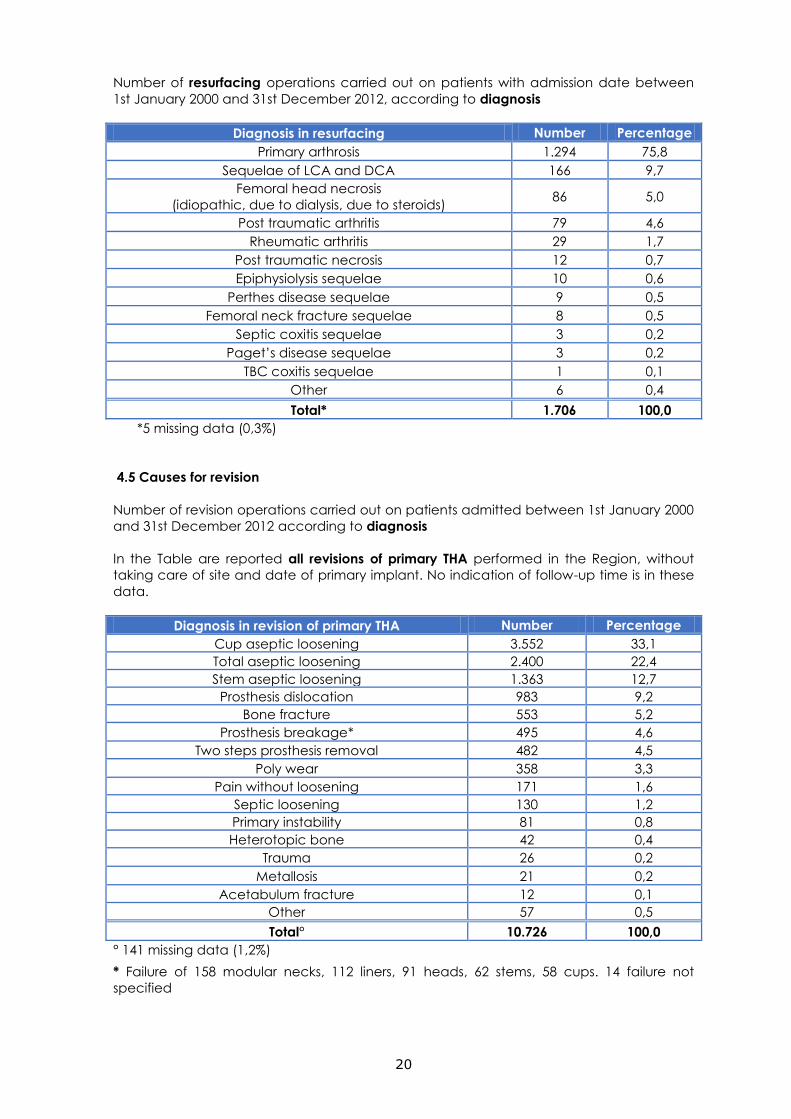
20
Number of resurfacing operations carried out on patients with admission date between
1st January 2000 and 31st December 2012, according to diagnosis
Diagnosis in resurfacing Number Percentage
Primary arthrosis 1.294 75,8
Sequelae of LCA and DCA 166 9,7
Femoral head necrosis
(idiopathic, due to dialysis, due to steroids) 86 5,0
Post traumatic arthritis 79 4,6
Rheumatic arthritis 29 1,7
Post traumatic necrosis 12 0,7
Epiphysiolysis sequelae 10 0,6
Perthes disease sequelae 9 0,5
Femoral neck fracture sequelae 8 0,5
Septic coxitis sequelae 3 0,2
Paget’s disease sequelae 3 0,2
TBC coxitis sequelae 1 0,1
Other 6 0,4
Total* 1.706 100,0
*5 missing data (0,3%)
4.5 Causes for revision
Number of revision operations carried out on patients admitted between 1st January 2000
and 31st December 2012 according to diagnosis
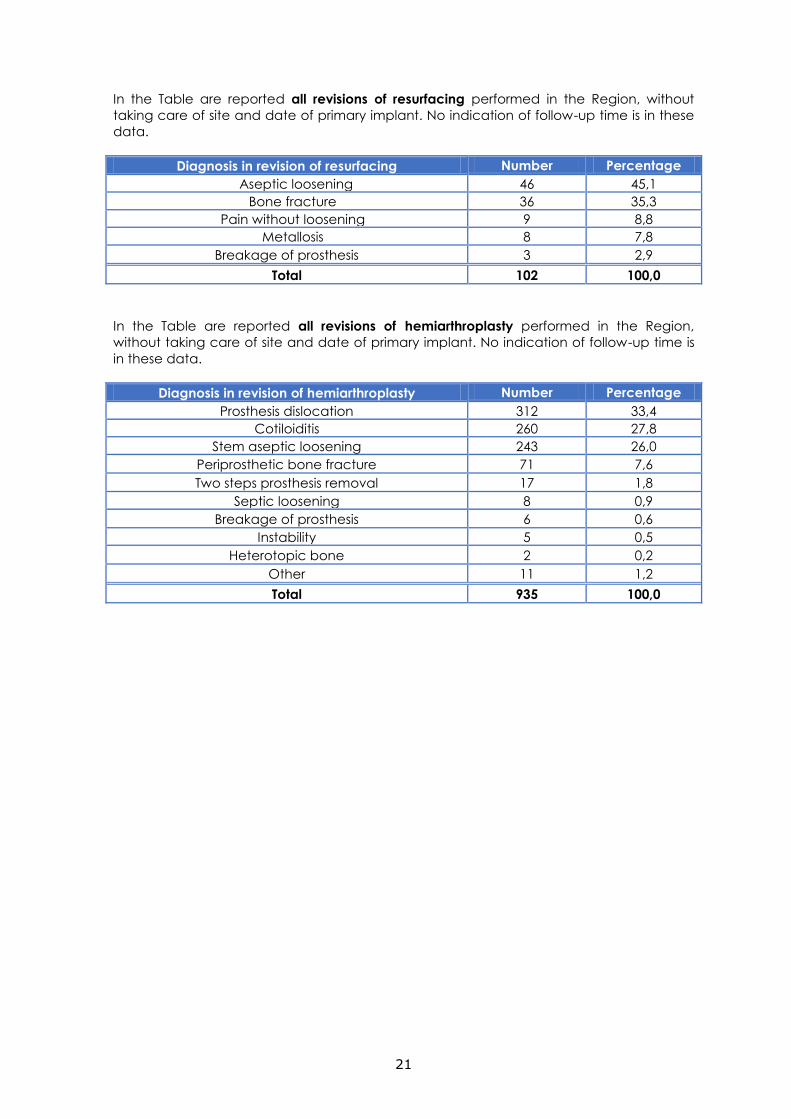
In the Table are reported all revisions of primary THA performed in the Region, without
taking care of site and date of primary implant. No indication of follow-up time is in these
data.
Diagnosis in revision of primary THA Number Percentage
Cup aseptic loosening 3.552 33,1
Total aseptic loosening 2.400 22,4
Stem aseptic loosening 1.363 12,7
Prosthesis dislocation 983 9,2
Bone fracture 553 5,2
Prosthesis breakage* 495 4,6
Two steps prosthesis removal 482 4,5
Poly wear 358 3,3
Pain without loosening 171 1,6
Septic loosening 130 1,2
Primary instability 81 0,8
Heterotopic bone 42 0,4
Trauma 26 0,2
Metallosis 21 0,2
Acetabulum fracture 12 0,1
Other 57 0,5
Total° 10.726 100,0
° 141 missing data (1,2%)
* Failure of 158 modular necks, 112 liners, 91 heads, 62 stems, 58 cups. 14 failure not
specified
21
In the Table are reported all revisions of resurfacing performed in the Region, without
taking care of site and date of primary implant. No indication of follow-up time is in these
data.
Diagnosis in revision of resurfacing Number Percentage
Aseptic loosening 46 45,1
Bone fracture 36 35,3
Pain without loosening 9 8,8
Metallosis 8 7,8
Breakage of prosthesis 3 2,9
Total 102 100,0
In the Table are reported all revisions of hemiarthroplasty performed in the Region,
without taking care of site and date of primary implant. No indication of follow-up time is
in these data.
Diagnosis in revision of hemiarthroplasty Number Percentage
Prosthesis dislocation 312 33,4
Cotiloiditis 260 27,8
Stem aseptic loosening 243 26,0
Periprosthetic bone fracture 71 7,6
Two steps prosthesis removal 17 1,8
Septic loosening 8 0,9
Breakage of prosthesis 6 0,6
Instability 5 0,5
Heterotopic bone 2 0,2
Other 11 1,2
Total 935 100,0
22
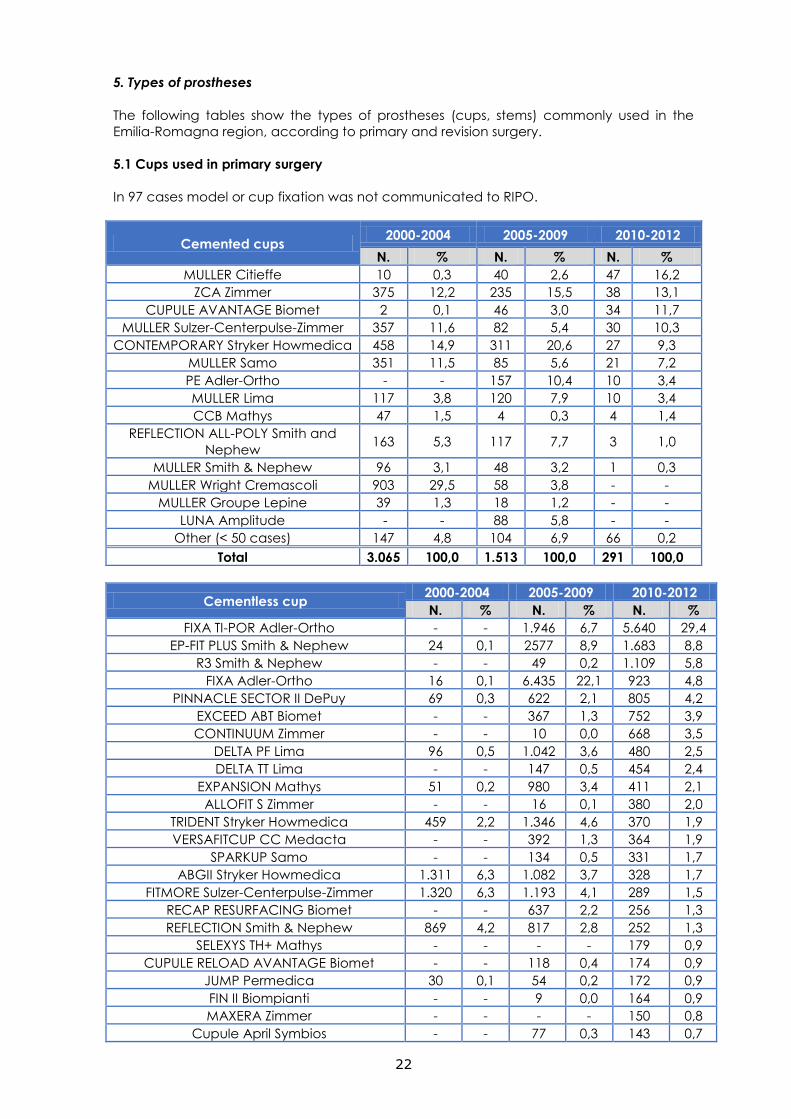
5. Types of prostheses
The following tables show the types of prostheses (cups, stems) commonly used in the
Emilia-Romagna region, according to primary and revision surgery.
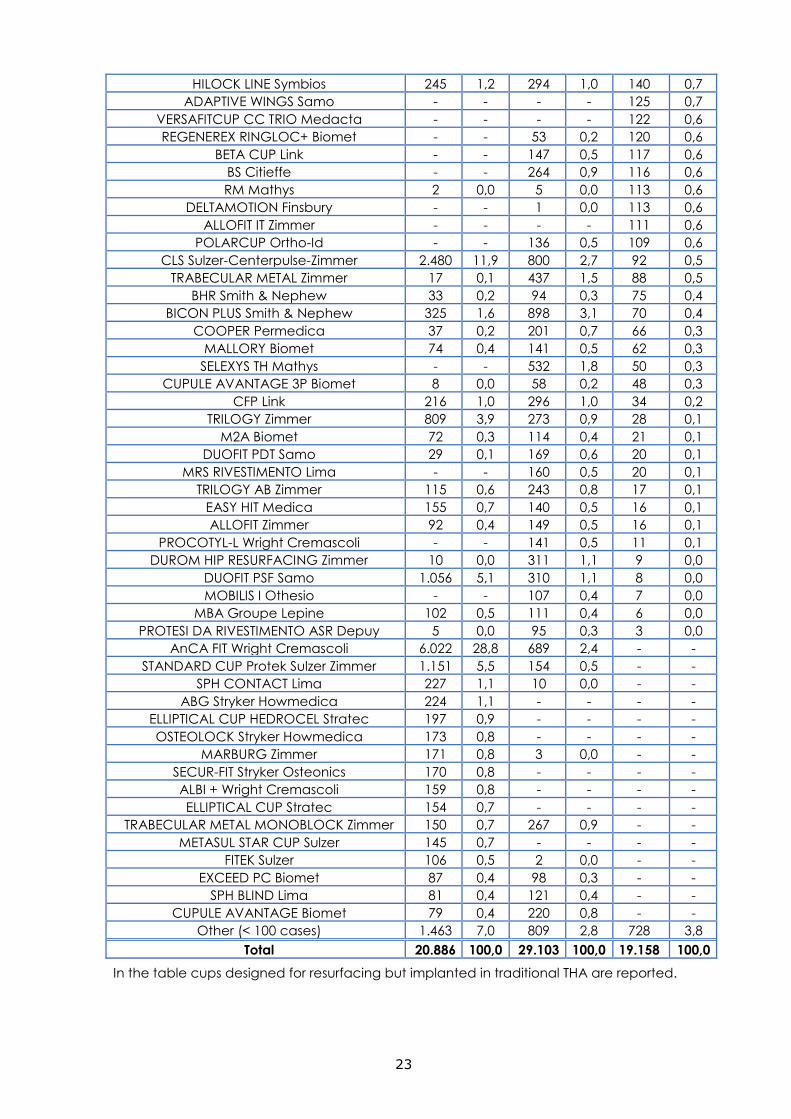
5.1 Cups used in primary surgery
In 97 cases model or cup fixation was not communicated to RIPO.
Cemented cups 2000-2004 2005-2009 2010-2012
N. % N. % N. %
MULLER Citieffe 10 0,3 40 2,6 47 16,2
ZCA Zimmer 375 12,2 235 15,5 38 13,1
CUPULE AVANTAGE Biomet 2 0,1 46 3,0 34 11,7
MULLER Sulzer-Centerpulse-Zimmer 357 11,6 82 5,4 30 10,3
CONTEMPORARY Stryker Howmedica 458 14,9 311 20,6 27 9,3
MULLER Samo 351 11,5 85 5,6 21 7,2
PE Adler-Ortho - - 157 10,4 10 3,4
MULLER Lima 117 3,8 120 7,9 10 3,4
CCB Mathys 47 1,5 4 0,3 4 1,4
REFLECTION ALL-POLY Smith and
Nephew 163 5,3 117 7,7 3 1,0
MULLER Smith & Nephew 96 3,1 48 3,2 1 0,3
MULLER Wright Cremascoli 903 29,5 58 3,8 - -
MULLER Groupe Lepine 39 1,3 18 1,2 - -
LUNA Amplitude - - 88 5,8 - -
Other (< 50 cases) 147 4,8 104 6,9 66 0,2
Total 3.065 100,0 1.513 100,0 291 100,0
Cementless cup 2000-2004 2005-2009 2010-2012
N. % N. % N. %
FIXA TI-POR Adler-Ortho - - 1.946 6,7 5.640 29,4
EP-FIT PLUS Smith & Nephew 24 0,1 2577 8,9 1.683 8,8
R3 Smith & Nephew - - 49 0,2 1.109 5,8
FIXA Adler-Ortho 16 0,1 6.435 22,1 923 4,8
PINNACLE SECTOR II DePuy 69 0,3 622 2,1 805 4,2
EXCEED ABT Biomet - - 367 1,3 752 3,9
CONTINUUM Zimmer - - 10 0,0 668 3,5
DELTA PF Lima 96 0,5 1.042 3,6 480 2,5
DELTA TT Lima - - 147 0,5 454 2,4
EXPANSION Mathys 51 0,2 980 3,4 411 2,1
ALLOFIT S Zimmer - - 16 0,1 380 2,0
TRIDENT Stryker Howmedica 459 2,2 1.346 4,6 370 1,9
VERSAFITCUP CC Medacta - - 392 1,3 364 1,9
SPARKUP Samo - - 134 0,5 331 1,7
ABGII Stryker Howmedica 1.311 6,3 1.082 3,7 328 1,7
FITMORE Sulzer-Centerpulse-Zimmer 1.320 6,3 1.193 4,1 289 1,5
RECAP RESURFACING Biomet - - 637 2,2 256 1,3
REFLECTION Smith & Nephew 869 4,2 817 2,8 252 1,3
SELEXYS TH+ Mathys - - - - 179 0,9
CUPULE RELOAD AVANTAGE Biomet - - 118 0,4 174 0,9
JUMP Permedica 30 0,1 54 0,2 172 0,9
FIN II Biompianti - - 9 0,0 164 0,9
MAXERA Zimmer - - - - 150 0,8
Cupule April Symbios - - 77 0,3 143 0,7
23
HILOCK LINE Symbios 245 1,2 294 1,0 140 0,7
ADAPTIVE WINGS Samo - - - - 125 0,7
VERSAFITCUP CC TRIO Medacta - - - - 122 0,6
REGENEREX RINGLOC+ Biomet - - 53 0,2 120 0,6
BETA CUP Link - - 147 0,5 117 0,6
BS Citieffe - - 264 0,9 116 0,6
RM Mathys 2 0,0 5 0,0 113 0,6
DELTAMOTION Finsbury - - 1 0,0 113 0,6
ALLOFIT IT Zimmer - - - - 111 0,6
POLARCUP Ortho-Id - - 136 0,5 109 0,6
CLS Sulzer-Centerpulse-Zimmer 2.480 11,9 800 2,7 92 0,5
TRABECULAR METAL Zimmer 17 0,1 437 1,5 88 0,5
BHR Smith & Nephew 33 0,2 94 0,3 75 0,4
BICON PLUS Smith & Nephew 325 1,6 898 3,1 70 0,4
COOPER Permedica 37 0,2 201 0,7 66 0,3
MALLORY Biomet 74 0,4 141 0,5 62 0,3
SELEXYS TH Mathys - - 532 1,8 50 0,3
CUPULE AVANTAGE 3P Biomet 8 0,0 58 0,2 48 0,3
CFP Link 216 1,0 296 1,0 34 0,2
TRILOGY Zimmer 809 3,9 273 0,9 28 0,1
M2A Biomet 72 0,3 114 0,4 21 0,1
DUOFIT PDT Samo 29 0,1 169 0,6 20 0,1
MRS RIVESTIMENTO Lima - - 160 0,5 20 0,1
TRILOGY AB Zimmer 115 0,6 243 0,8 17 0,1
EASY HIT Medica 155 0,7 140 0,5 16 0,1
ALLOFIT Zimmer 92 0,4 149 0,5 16 0,1
PROCOTYL-L Wright Cremascoli - - 141 0,5 11 0,1
DUROM HIP RESURFACING Zimmer 10 0,0 311 1,1 9 0,0
DUOFIT PSF Samo 1.056 5,1 310 1,1 8 0,0
MOBILIS I Othesio - - 107 0,4 7 0,0
MBA Groupe Lepine 102 0,5 111 0,4 6 0,0
PROTESI DA RIVESTIMENTO ASR Depuy 5 0,0 95 0,3 3 0,0
AnCA FIT Wright Cremascoli 6.022 28,8 689 2,4 - -
STANDARD CUP Protek Sulzer Zimmer 1.151 5,5 154 0,5 - -
SPH CONTACT Lima 227 1,1 10 0,0 - -
ABG Stryker Howmedica 224 1,1 - - - -
ELLIPTICAL CUP HEDROCEL Stratec 197 0,9 - - - -
OSTEOLOCK Stryker Howmedica 173 0,8 - - - -
MARBURG Zimmer 171 0,8 3 0,0 - -
SECUR-FIT Stryker Osteonics 170 0,8 - - - -
ALBI + Wright Cremascoli 159 0,8 - - - -
ELLIPTICAL CUP Stratec 154 0,7 - - - -
TRABECULAR METAL MONOBLOCK Zimmer 150 0,7 267 0,9 - -
METASUL STAR CUP Sulzer 145 0,7 - - - -
FITEK Sulzer 106 0,5 2 0,0 - -
EXCEED PC Biomet 87 0,4 98 0,3 - -
SPH BLIND Lima 81 0,4 121 0,4 - -
CUPULE AVANTAGE Biomet 79 0,4 220 0,8 - -
Other (< 100 cases) 1.463 7,0 809 2,8 728 3,8
Total 20.886 100,0 29.103 100,0 19.158 100,0
In the table cups designed for resurfacing but implanted in traditional THA are reported.
24
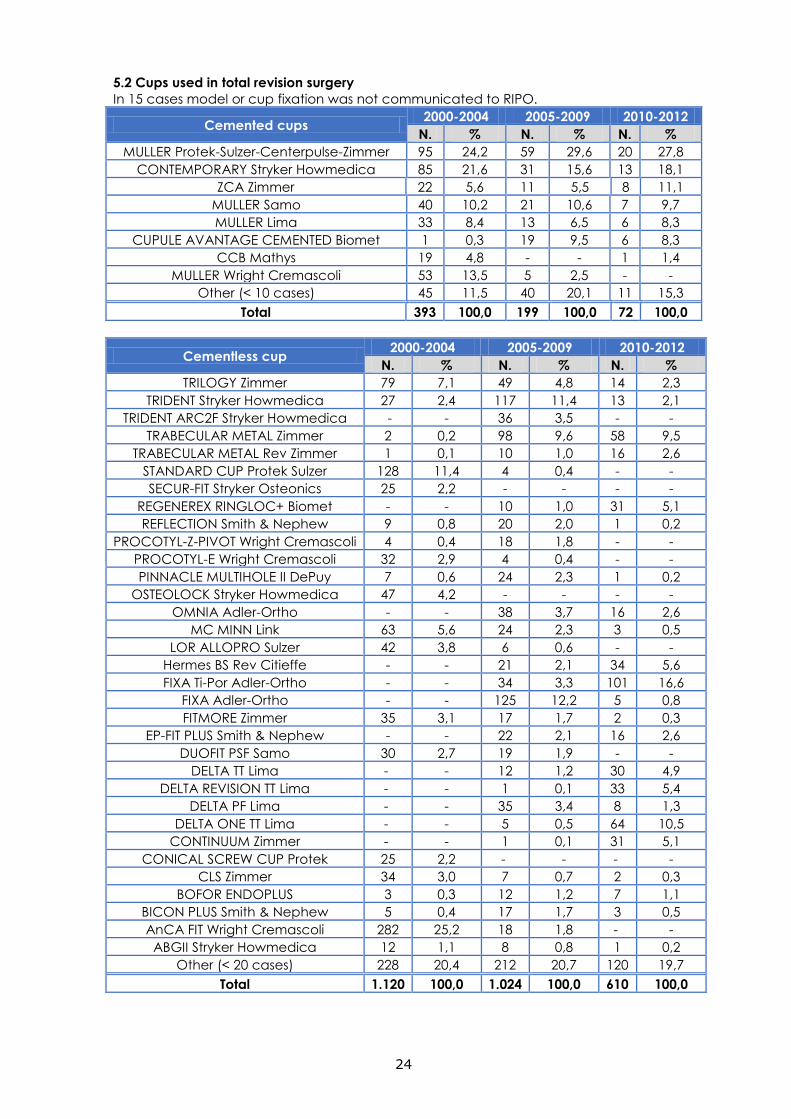
5.2 Cups used in total revision surgery
In 15 cases model or cup fixation was not communicated to RIPO.
Cemented cups 2000-2004 2005-2009 2010-2012
N. % N. % N. %
MULLER Protek-Sulzer-Centerpulse-Zimmer 95 24,2 59 29,6 20 27,8
CONTEMPORARY Stryker Howmedica 85 21,6 31 15,6 13 18,1
ZCA Zimmer 22 5,6 11 5,5 8 11,1
MULLER Samo 40 10,2 21 10,6 7 9,7
MULLER Lima 33 8,4 13 6,5 6 8,3
CUPULE AVANTAGE CEMENTED Biomet 1 0,3 19 9,5 6 8,3
CCB Mathys 19 4,8 - - 1 1,4
MULLER Wright Cremascoli 53 13,5 5 2,5 - -
Other (< 10 cases) 45 11,5 40 20,1 11 15,3
Total 393 100,0 199 100,0 72 100,0
Cementless cup 2000-2004 2005-2009 2010-2012
N. % N. % N. %
TRILOGY Zimmer 79 7,1 49 4,8 14 2,3
TRIDENT Stryker Howmedica 27 2,4 117 11,4 13 2,1
TRIDENT ARC2F Stryker Howmedica - - 36 3,5 - -
TRABECULAR METAL Zimmer 2 0,2 98 9,6 58 9,5
TRABECULAR METAL Rev Zimmer 1 0,1 10 1,0 16 2,6
STANDARD CUP Protek Sulzer 128 11,4 4 0,4 - -
SECUR-FIT Stryker Osteonics 25 2,2 - - - -
REGENEREX RINGLOC+ Biomet - - 10 1,0 31 5,1
REFLECTION Smith & Nephew 9 0,8 20 2,0 1 0,2
PROCOTYL-Z-PIVOT Wright Cremascoli 4 0,4 18 1,8 - -
PROCOTYL-E Wright Cremascoli 32 2,9 4 0,4 - -
PINNACLE MULTIHOLE II DePuy 7 0,6 24 2,3 1 0,2
OSTEOLOCK Stryker Howmedica 47 4,2 - - - -
OMNIA Adler-Ortho - - 38 3,7 16 2,6
MC MINN Link 63 5,6 24 2,3 3 0,5
LOR ALLOPRO Sulzer 42 3,8 6 0,6 - -
Hermes BS Rev Citieffe - - 21 2,1 34 5,6
FIXA Ti-Por Adler-Ortho - - 34 3,3 101 16,6
FIXA Adler-Ortho - - 125 12,2 5 0,8
FITMORE Zimmer 35 3,1 17 1,7 2 0,3
EP-FIT PLUS Smith & Nephew - - 22 2,1 16 2,6
DUOFIT PSF Samo 30 2,7 19 1,9 - -
DELTA TT Lima - - 12 1,2 30 4,9
DELTA REVISION TT Lima - - 1 0,1 33 5,4
DELTA PF Lima - - 35 3,4 8 1,3
DELTA ONE TT Lima - - 5 0,5 64 10,5
CONTINUUM Zimmer - - 1 0,1 31 5,1
CONICAL SCREW CUP Protek 25 2,2 - - - -
CLS Zimmer 34 3,0 7 0,7 2 0,3
BOFOR ENDOPLUS 3 0,3 12 1,2 7 1,1
BICON PLUS Smith & Nephew 5 0,4 17 1,7 3 0,5
AnCA FIT Wright Cremascoli 282 25,2 18 1,8 - -
ABGII Stryker Howmedica 12 1,1 8 0,8 1 0,2
Other (< 20 cases) 228 20,4 212 20,7 120 19,7
Total 1.120 100,0 1.024 100,0 610 100,0
25
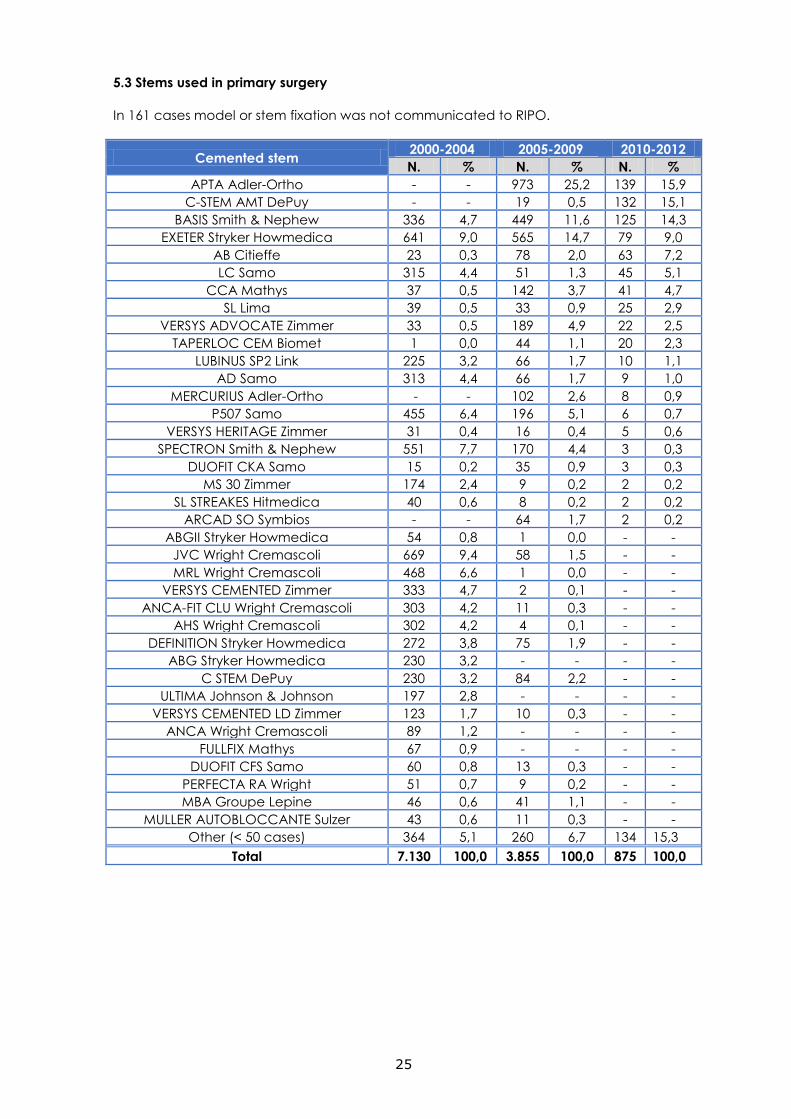
5.3 Stems used in primary surgery
In 161 cases model or stem fixation was not communicated to RIPO.
Cemented stem 2000-2004 2005-2009 2010-2012
N. % N. % N. %
APTA Adler-Ortho - - 973 25,2 139 15,9
C-STEM AMT DePuy - - 19 0,5 132 15,1
BASIS Smith & Nephew 336 4,7 449 11,6 125 14,3
EXETER Stryker Howmedica 641 9,0 565 14,7 79 9,0
AB Citieffe 23 0,3 78 2,0 63 7,2
LC Samo 315 4,4 51 1,3 45 5,1
CCA Mathys 37 0,5 142 3,7 41 4,7
SL Lima 39 0,5 33 0,9 25 2,9
VERSYS ADVOCATE Zimmer 33 0,5 189 4,9 22 2,5
TAPERLOC CEM Biomet 1 0,0 44 1,1 20 2,3
LUBINUS SP2 Link 225 3,2 66 1,7 10 1,1
AD Samo 313 4,4 66 1,7 9 1,0
MERCURIUS Adler-Ortho - - 102 2,6 8 0,9
P507 Samo 455 6,4 196 5,1 6 0,7
VERSYS HERITAGE Zimmer 31 0,4 16 0,4 5 0,6
SPECTRON Smith & Nephew 551 7,7 170 4,4 3 0,3
DUOFIT CKA Samo 15 0,2 35 0,9 3 0,3
MS 30 Zimmer 174 2,4 9 0,2 2 0,2
SL STREAKES Hitmedica 40 0,6 8 0,2 2 0,2
ARCAD SO Symbios - - 64 1,7 2 0,2
ABGII Stryker Howmedica 54 0,8 1 0,0 - -
JVC Wright Cremascoli 669 9,4 58 1,5 - -
MRL Wright Cremascoli 468 6,6 1 0,0 - -
VERSYS CEMENTED Zimmer 333 4,7 2 0,1 - -
ANCA-FIT CLU Wright Cremascoli 303 4,2 11 0,3 - -
AHS Wright Cremascoli 302 4,2 4 0,1 - -
DEFINITION Stryker Howmedica 272 3,8 75 1,9 - -
ABG Stryker Howmedica 230 3,2 - - - -
C STEM DePuy 230 3,2 84 2,2 - -
ULTIMA Johnson & Johnson 197 2,8 - - - -
VERSYS CEMENTED LD Zimmer 123 1,7 10 0,3 - -
ANCA Wright Cremascoli 89 1,2 - - - -
FULLFIX Mathys 67 0,9 - - - -
DUOFIT CFS Samo 60 0,8 13 0,3 - -
PERFECTA RA Wright 51 0,7 9 0,2 - -
MBA Groupe Lepine 46 0,6 41 1,1 - -
MULLER AUTOBLOCCANTE Sulzer 43 0,6 11 0,3 - -
Other (< 50 cases) 364 5,1 260 6,7 134 15,3
Total 7.130 100,0 3.855 100,0 875 100,0
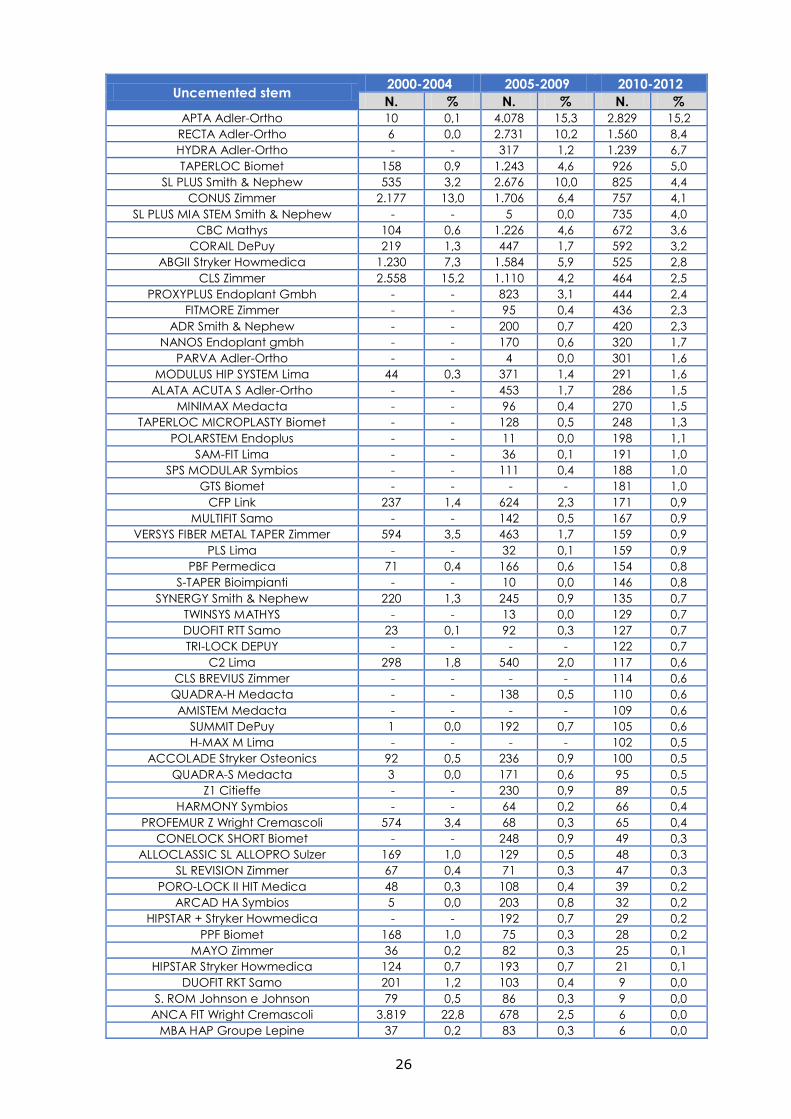
26
Uncemented stem 2000-2004 2005-2009 2010-2012
N. % N. % N. %
APTA Adler-Ortho 10 0,1 4.078 15,3 2.829 15,2
RECTA Adler-Ortho 6 0,0 2.731 10,2 1.560 8,4
HYDRA Adler-Ortho - - 317 1,2 1.239 6,7
TAPERLOC Biomet 158 0,9 1.243 4,6 926 5,0
SL PLUS Smith & Nephew 535 3,2 2.676 10,0 825 4,4
CONUS Zimmer 2.177 13,0 1.706 6,4 757 4,1
SL PLUS MIA STEM Smith & Nephew - - 5 0,0 735 4,0
CBC Mathys 104 0,6 1.226 4,6 672 3,6
CORAIL DePuy 219 1,3 447 1,7 592 3,2
ABGII Stryker Howmedica 1.230 7,3 1.584 5,9 525 2,8
CLS Zimmer 2.558 15,2 1.110 4,2 464 2,5
PROXYPLUS Endoplant Gmbh - - 823 3,1 444 2,4
FITMORE Zimmer - - 95 0,4 436 2,3
ADR Smith & Nephew - - 200 0,7 420 2,3
NANOS Endoplant gmbh - - 170 0,6 320 1,7
PARVA Adler-Ortho - - 4 0,0 301 1,6
MODULUS HIP SYSTEM Lima 44 0,3 371 1,4 291 1,6
ALATA ACUTA S Adler-Ortho - - 453 1,7 286 1,5
MINIMAX Medacta - - 96 0,4 270 1,5
TAPERLOC MICROPLASTY Biomet - - 128 0,5 248 1,3
POLARSTEM Endoplus - - 11 0,0 198 1,1
SAM-FIT Lima - - 36 0,1 191 1,0
SPS MODULAR Symbios - - 111 0,4 188 1,0
GTS Biomet - - - - 181 1,0
CFP Link 237 1,4 624 2,3 171 0,9
MULTIFIT Samo - - 142 0,5 167 0,9
VERSYS FIBER METAL TAPER Zimmer 594 3,5 463 1,7 159 0,9
PLS Lima - - 32 0,1 159 0,9
PBF Permedica 71 0,4 166 0,6 154 0,8
S-TAPER Bioimpianti - - 10 0,0 146 0,8
SYNERGY Smith & Nephew 220 1,3 245 0,9 135 0,7
TWINSYS MATHYS - - 13 0,0 129 0,7
DUOFIT RTT Samo 23 0,1 92 0,3 127 0,7
TRI-LOCK DEPUY - - - - 122 0,7
C2 Lima 298 1,8 540 2,0 117 0,6
CLS BREVIUS Zimmer - - - - 114 0,6
QUADRA-H Medacta - - 138 0,5 110 0,6
AMISTEM Medacta - - - - 109 0,6
SUMMIT DePuy 1 0,0 192 0,7 105 0,6
H-MAX M Lima - - - - 102 0,5
ACCOLADE Stryker Osteonics 92 0,5 236 0,9 100 0,5
QUADRA-S Medacta 3 0,0 171 0,6 95 0,5
Z1 Citieffe - - 230 0,9 89 0,5
HARMONY Symbios - - 64 0,2 66 0,4
PROFEMUR Z Wright Cremascoli 574 3,4 68 0,3 65 0,4
CONELOCK SHORT Biomet - - 248 0,9 49 0,3
ALLOCLASSIC SL ALLOPRO Sulzer 169 1,0 129 0,5 48 0,3
SL REVISION Zimmer 67 0,4 71 0,3 47 0,3
PORO-LOCK II HIT Medica 48 0,3 108 0,4 39 0,2
ARCAD HA Symbios 5 0,0 203 0,8 32 0,2
HIPSTAR + Stryker Howmedica - - 192 0,7 29 0,2
PPF Biomet 168 1,0 75 0,3 28 0,2
MAYO Zimmer 36 0,2 82 0,3 25 0,1
HIPSTAR Stryker Howmedica 124 0,7 193 0,7 21 0,1
DUOFIT RKT Samo 201 1,2 103 0,4 9 0,0
S. ROM Johnson e Johnson 79 0,5 86 0,3 9 0,0
ANCA FIT Wright Cremascoli 3.819 22,8 678 2,5 6 0,0
MBA HAP Groupe Lepine 37 0,2 83 0,3 6 0,0
27
SPS Symbios 156 0,9 65 0,2 4 0,0
ABG Stryker Howmedica 330 2,0 - - - -
PROXILOCK FT Stratec 287 1,7 17 0,1 - -
BHS Smith & Nephew 272 1,6 160 0,6 - -
EHS Wright Cremascoli 252 1,5 60 0,2 - -
STEM Wright Cremascoli 208 1,2 1 0,0 - -
G3 Citieffe 179 1,1 - - - -
EASY Hitmedica 150 0,9 77 0,3 - -
CITATION Stryker Howmedica 112 0,7 - - - -
FIT STEM Lima 69 0,4 227 0,8 - -
Other (< 100 cases) 858 5,1 833 3,1 779 4,2
Total 16.780 100,0 26.738 100,0 18.570 100,0
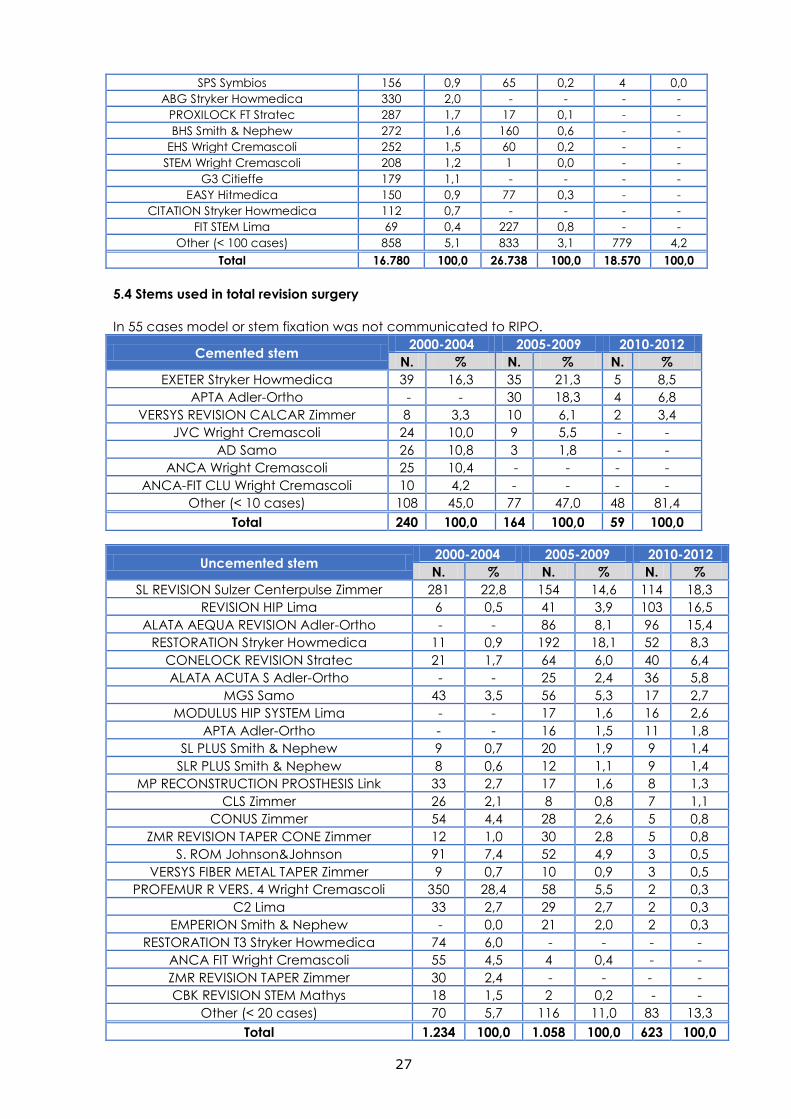
5.4 Stems used in total revision surgery
In 55 cases model or stem fixation was not communicated to RIPO.
Cemented stem 2000-2004 2005-2009 2010-2012
N. % N. % N. %
EXETER Stryker Howmedica 39 16,3 35 21,3 5 8,5
APTA Adler-Ortho - - 30 18,3 4 6,8
VERSYS REVISION CALCAR Zimmer 8 3,3 10 6,1 2 3,4
JVC Wright Cremascoli 24 10,0 9 5,5 - -
AD Samo 26 10,8 3 1,8 - -
ANCA Wright Cremascoli 25 10,4 - - - -
ANCA-FIT CLU Wright Cremascoli 10 4,2 - - - -
Other (< 10 cases) 108 45,0 77 47,0 48 81,4
Total 240 100,0 164 100,0 59 100,0
Uncemented stem 2000-2004 2005-2009 2010-2012
N. % N. % N. %
SL REVISION Sulzer Centerpulse Zimmer 281 22,8 154 14,6 114 18,3
REVISION HIP Lima 6 0,5 41 3,9 103 16,5
ALATA AEQUA REVISION Adler-Ortho - - 86 8,1 96 15,4
RESTORATION Stryker Howmedica 11 0,9 192 18,1 52 8,3
CONELOCK REVISION Stratec 21 1,7 64 6,0 40 6,4
ALATA ACUTA S Adler-Ortho - - 25 2,4 36 5,8
MGS Samo 43 3,5 56 5,3 17 2,7
MODULUS HIP SYSTEM Lima - - 17 1,6 16 2,6
APTA Adler-Ortho - - 16 1,5 11 1,8
SL PLUS Smith & Nephew 9 0,7 20 1,9 9 1,4
SLR PLUS Smith & Nephew 8 0,6 12 1,1 9 1,4
MP RECONSTRUCTION PROSTHESIS Link 33 2,7 17 1,6 8 1,3
CLS Zimmer 26 2,1 8 0,8 7 1,1
CONUS Zimmer 54 4,4 28 2,6 5 0,8
ZMR REVISION TAPER CONE Zimmer 12 1,0 30 2,8 5 0,8
S. ROM Johnson&Johnson 91 7,4 52 4,9 3 0,5
VERSYS FIBER METAL TAPER Zimmer 9 0,7 10 0,9 3 0,5
PROFEMUR R VERS. 4 Wright Cremascoli 350 28,4 58 5,5 2 0,3
C2 Lima 33 2,7 29 2,7 2 0,3
EMPERION Smith & Nephew - 0,0 21 2,0 2 0,3
RESTORATION T3 Stryker Howmedica 74 6,0 - - - -
ANCA FIT Wright Cremascoli 55 4,5 4 0,4 - -
ZMR REVISION TAPER Zimmer 30 2,4 - - - -
CBK REVISION STEM Mathys 18 1,5 2 0,2 - -
Other (< 20 cases) 70 5,7 116 11,0 83 13,3
Total 1.234 100,0 1.058 100,0 623 100,0
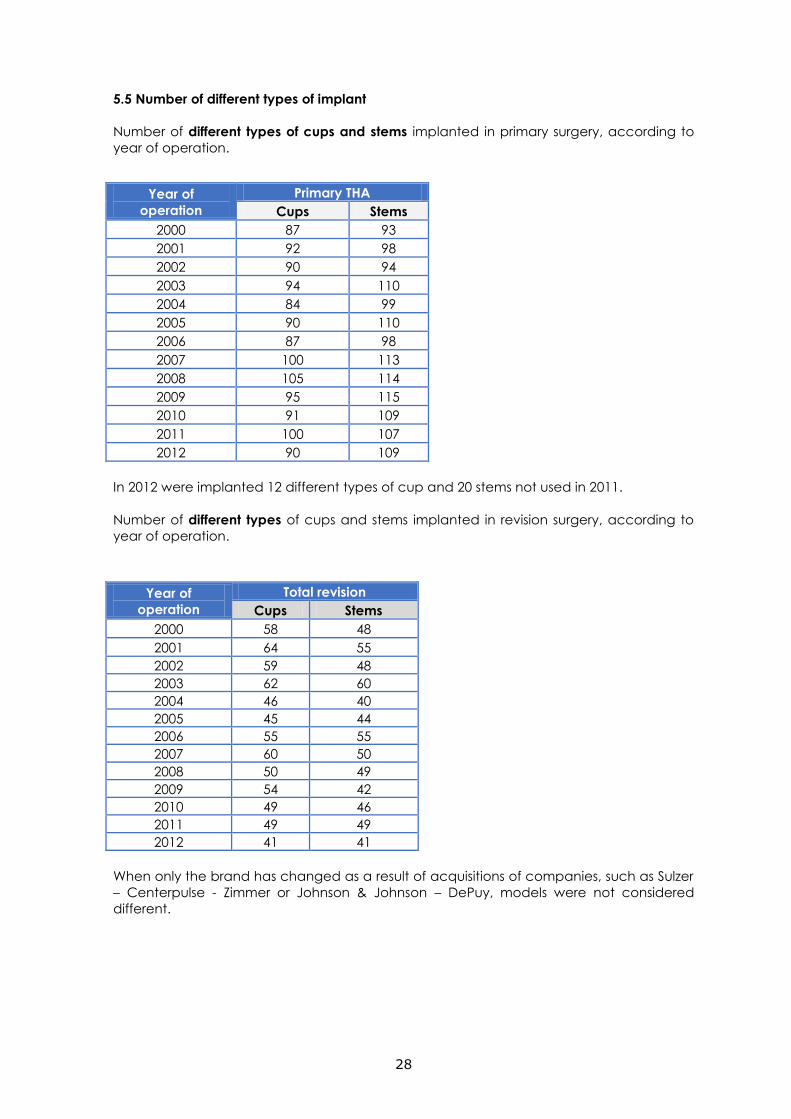
28
5.5 Number of different types of implant
Number of different types of cups and stems implanted in primary surgery, according to
year of operation.
Year of
operation
Primary THA
Cups Stems
2000 87 93
2001 92 98
2002 90 94
2003 94 110
2004 84 99
2005 90 110
2006 87 98
2007 100 113
2008 105 114
2009 95 115
2010 91 109
2011 100 107
2012 90 109
In 2012 were implanted 12 different types of cup and 20 stems not used in 2011.
Number of different types of cups and stems implanted in revision surgery, according to
year of operation.
Year of
operation
Total revision
Cups Stems
2000 58 48
2001 64 55
2002 59 48
2003 62 60
2004 46 40
2005 45 44
2006 55 55
2007 60 50
2008 50 49
2009 54 42
2010 49 46
2011 49 49
2012 41 41
When only the brand has changed as a result of acquisitions of companies, such as Sulzer
– Centerpulse - Zimmer or Johnson & Johnson – DePuy, models were not considered
different.
29
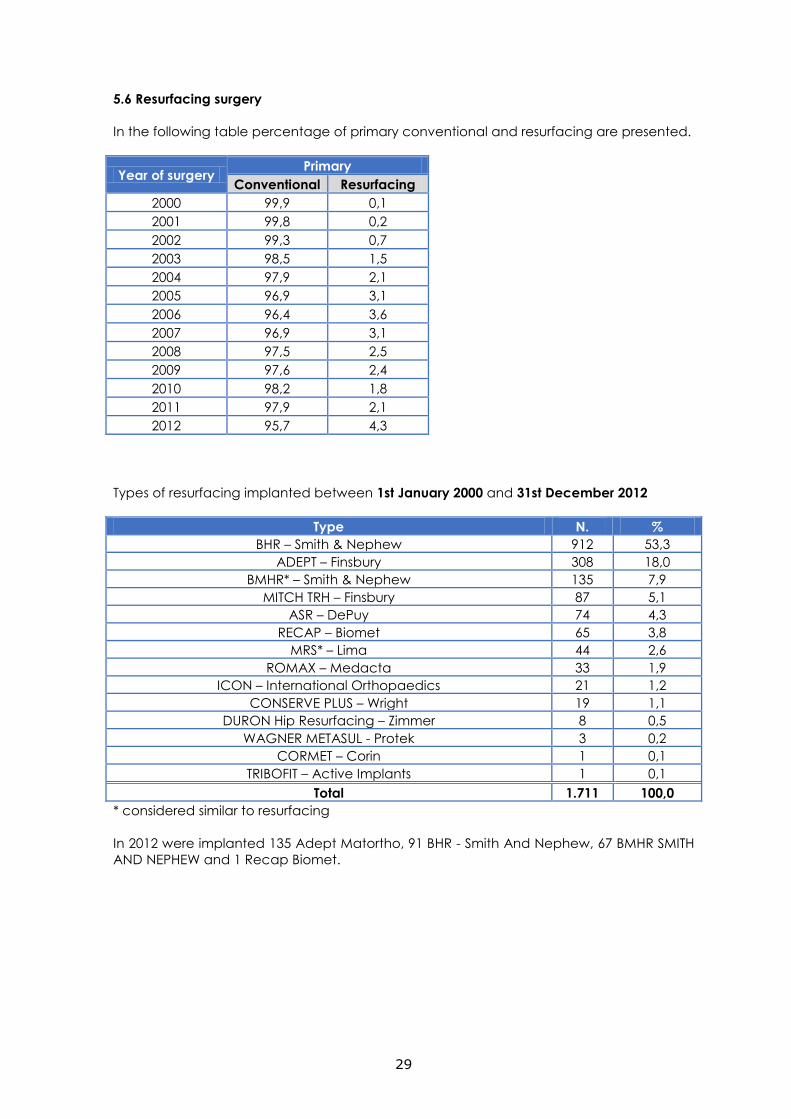
5.6 Resurfacing surgery
In the following table percentage of primary conventional and resurfacing are presented.
Year of surgery Primary
Conventional Resurfacing
2000 99,9 0,1
2001 99,8 0,2
2002 99,3 0,7
2003 98,5 1,5
2004 97,9 2,1
2005 96,9 3,1
2006 96,4 3,6
2007 96,9 3,1
2008 97,5 2,5
2009 97,6 2,4
2010 98,2 1,8
2011 97,9 2,1
2012 95,7 4,3
Types of resurfacing implanted between 1st January 2000 and 31st December 2012
Type N. %
BHR – Smith & Nephew 912 53,3
ADEPT – Finsbury 308 18,0
BMHR* – Smith & Nephew 135 7,9
MITCH TRH – Finsbury 87 5,1
ASR – DePuy 74 4,3
RECAP – Biomet 65 3,8
MRS* – Lima 44 2,6
ROMAX – Medacta 33 1,9
ICON – International Orthopaedics 21 1,2
CONSERVE PLUS – Wright 19 1,1
DURON Hip Resurfacing – Zimmer 8 0,5
WAGNER METASUL - Protek 3 0,2
CORMET – Corin 1 0,1
TRIBOFIT – Active Implants 1 0,1
Total 1.711 100,0
* considered similar to resurfacing
In 2012 were implanted 135 Adept Matortho, 91 BHR - Smith And Nephew, 67 BMHR SMITH
AND NEPHEW and 1 Recap Biomet.
30
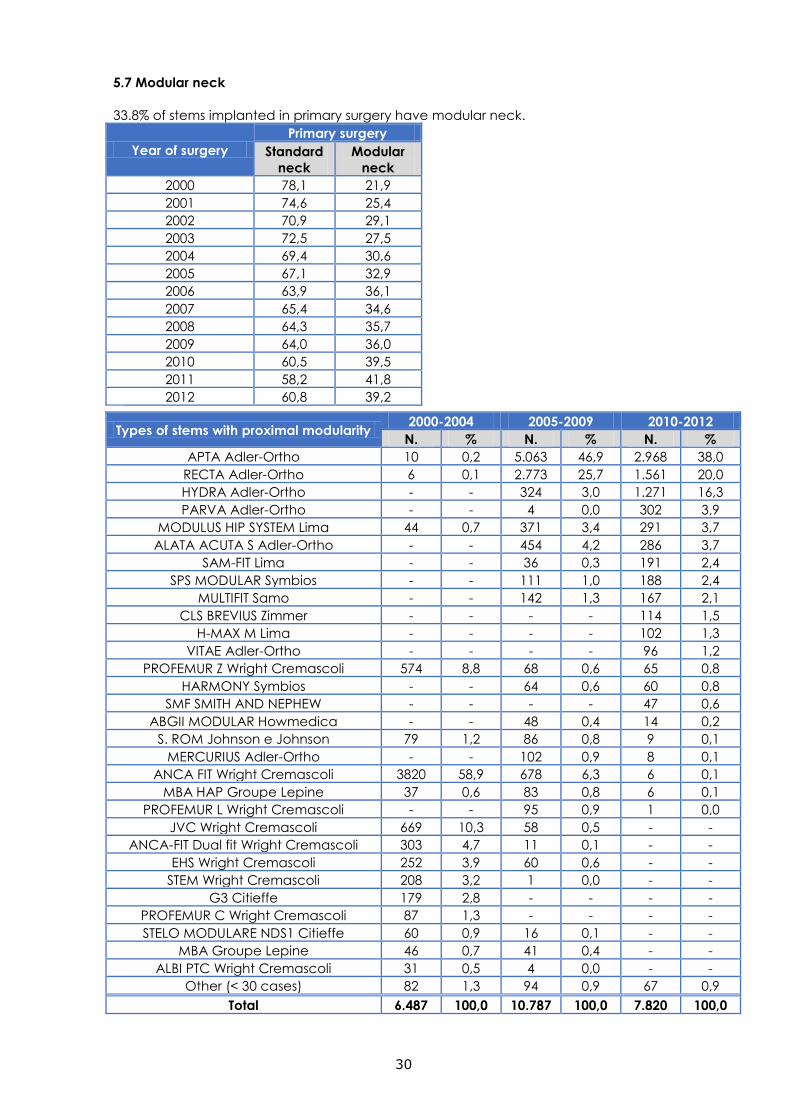
5.7 Modular neck
33.8% of stems implanted in primary surgery have modular neck.
Year of surgery
Primary surgery
Standard
neck
Modular
neck
2000 78,1 21,9
2001 74,6 25,4
2002 70,9 29,1
2003 72,5 27,5
2004 69,4 30,6
2005 67,1 32,9
2006 63,9 36,1
2007 65,4 34,6
2008 64,3 35,7
2009 64,0 36,0
2010 60,5 39,5
2011 58,2 41,8
2012 60,8 39,2
Types of stems with proximal modularity 2000-2004 2005-2009 2010-2012
N. % N. % N. %
APTA Adler-Ortho 10 0,2 5.063 46,9 2.968 38,0
RECTA Adler-Ortho 6 0,1 2.773 25,7 1.561 20,0
HYDRA Adler-Ortho - - 324 3,0 1.271 16,3
PARVA Adler-Ortho - - 4 0,0 302 3,9
MODULUS HIP SYSTEM Lima 44 0,7 371 3,4 291 3,7
ALATA ACUTA S Adler-Ortho - - 454 4,2 286 3,7
SAM-FIT Lima - - 36 0,3 191 2,4
SPS MODULAR Symbios - - 111 1,0 188 2,4
MULTIFIT Samo - - 142 1,3 167 2,1
CLS BREVIUS Zimmer - - - - 114 1,5
H-MAX M Lima - - - - 102 1,3
VITAE Adler-Ortho - - - - 96 1,2
PROFEMUR Z Wright Cremascoli 574 8,8 68 0,6 65 0,8
HARMONY Symbios - - 64 0,6 60 0,8
SMF SMITH AND NEPHEW - - - - 47 0,6
ABGII MODULAR Howmedica - - 48 0,4 14 0,2
S. ROM Johnson e Johnson 79 1,2 86 0,8 9 0,1
MERCURIUS Adler-Ortho - - 102 0,9 8 0,1
ANCA FIT Wright Cremascoli 3820 58,9 678 6,3 6 0,1
MBA HAP Groupe Lepine 37 0,6 83 0,8 6 0,1
PROFEMUR L Wright Cremascoli - - 95 0,9 1 0,0
JVC Wright Cremascoli 669 10,3 58 0,5 - -
ANCA-FIT Dual fit Wright Cremascoli 303 4,7 11 0,1 - -
EHS Wright Cremascoli 252 3,9 60 0,6 - -
STEM Wright Cremascoli 208 3,2 1 0,0 - -
G3 Citieffe 179 2,8 - - - -
PROFEMUR C Wright Cremascoli 87 1,3 - - - -
STELO MODULARE NDS1 Citieffe 60 0,9 16 0,1 - -
MBA Groupe Lepine 46 0,7 41 0,4 - -
ALBI PTC Wright Cremascoli 31 0,5 4 0,0 - -
Other (< 30 cases) 82 1,3 94 0,9 67 0,9
Total 6.487 100,0 10.787 100,0 7.820 100,0
31
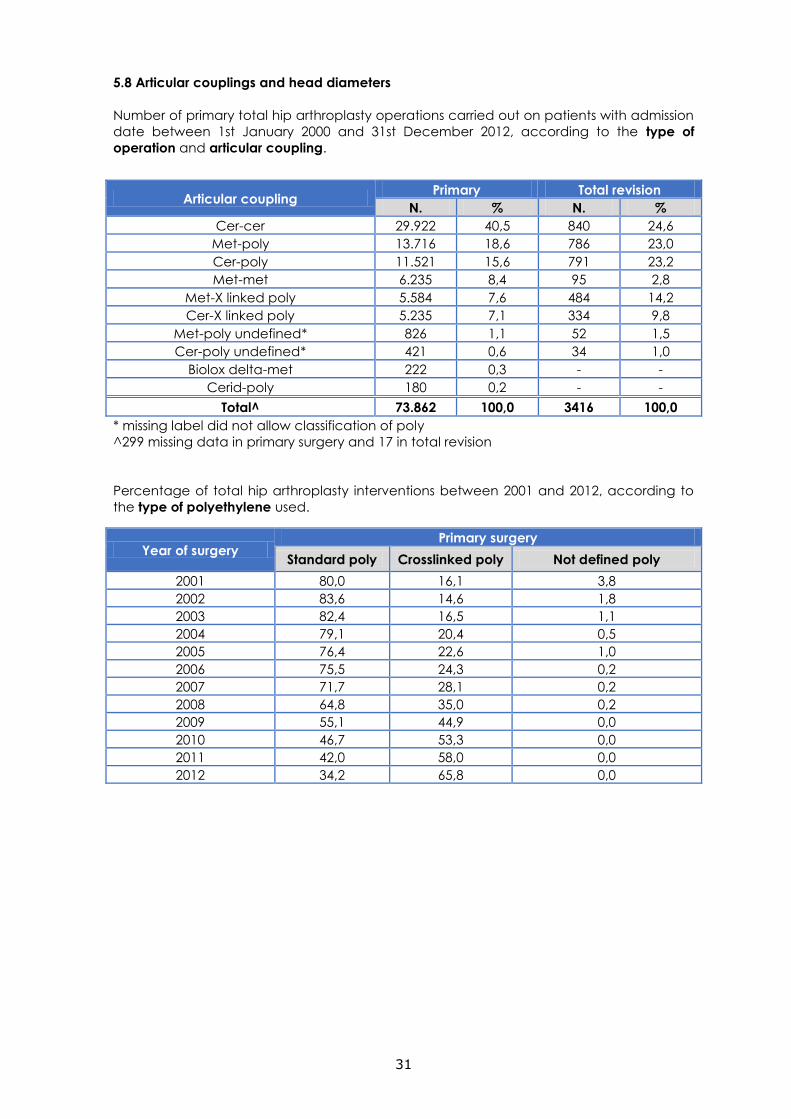
5.8 Articular couplings and head diameters
Number of primary total hip arthroplasty operations carried out on patients with admission
date between 1st January 2000 and 31st December 2012, according to the type of
operation and articular coupling.
Articular coupling Primary Total revision
N. % N. %
Cer-cer 29.922 40,5 840 24,6
Met-poly 13.716 18,6 786 23,0
Cer-poly 11.521 15,6 791 23,2
Met-met 6.235 8,4 95 2,8
Met-X linked poly 5.584 7,6 484 14,2
Cer-X linked poly 5.235 7,1 334 9,8
Met-poly undefined* 826 1,1 52 1,5
Cer-poly undefined* 421 0,6 34 1,0
Biolox delta-met 222 0,3 - -
Cerid-poly 180 0,2 - -
Total^ 73.862 100,0 3416 100,0
* missing label did not allow classification of poly
^299 missing data in primary surgery and 17 in total revision
Percentage of total hip arthroplasty interventions between 2001 and 2012, according to
the type of polyethylene used.
Year of surgery Primary surgery
Standard poly Crosslinked poly Not defined poly
2001 80,0 16,1 3,8
2002 83,6 14,6 1,8
2003 82,4 16,5 1,1
2004 79,1 20,4 0,5
2005 76,4 22,6 1,0
2006 75,5 24,3 0,2
2007 71,7 28,1 0,2
2008 64,8 35,0 0,2
2009 55,1 44,9 0,0
2010 46,7 53,3 0,0
2011 42,0 58,0 0,0
2012 34,2 65,8 0,0
32
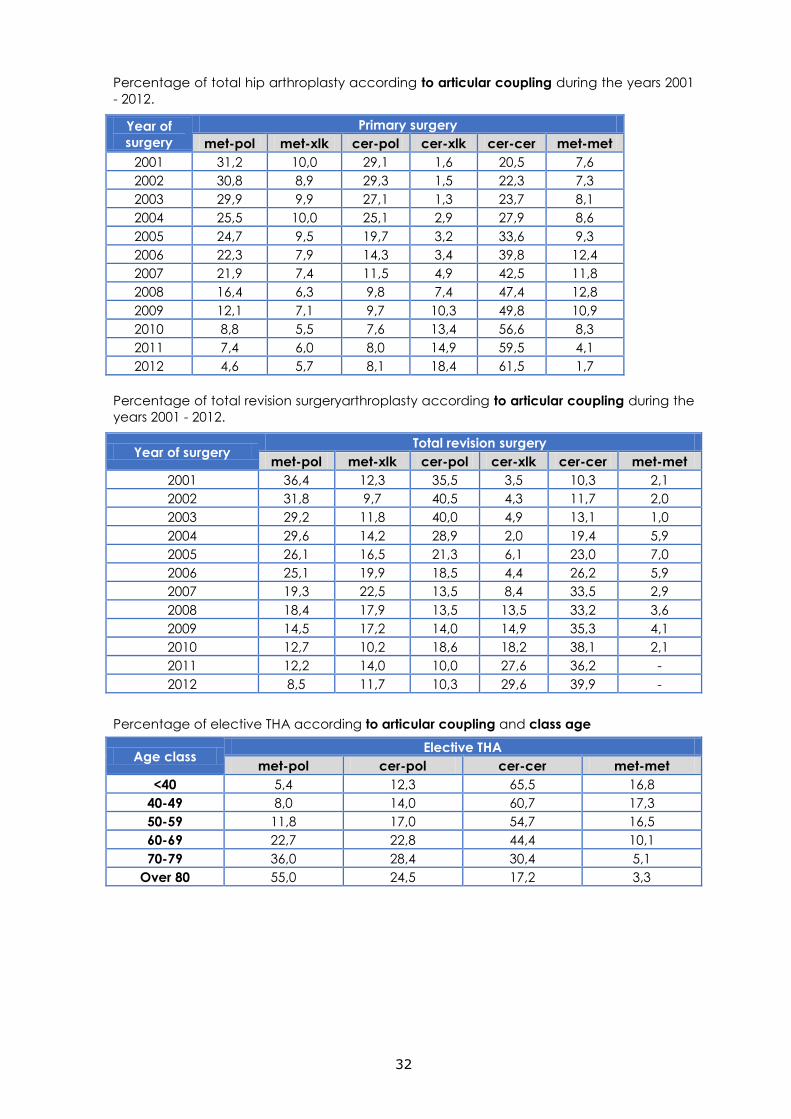
Percentage of total hip arthroplasty according to articular coupling during the years 2001
- 2012.
Year of
surgery
Primary surgery
met-pol met-xlk cer-pol cer-xlk cer-cer met-met
2001 31,2 10,0 29,1 1,6 20,5 7,6
2002 30,8 8,9 29,3 1,5 22,3 7,3
2003 29,9 9,9 27,1 1,3 23,7 8,1
2004 25,5 10,0 25,1 2,9 27,9 8,6
2005 24,7 9,5 19,7 3,2 33,6 9,3
2006 22,3 7,9 14,3 3,4 39,8 12,4
2007 21,9 7,4 11,5 4,9 42,5 11,8
2008 16,4 6,3 9,8 7,4 47,4 12,8
2009 12,1 7,1 9,7 10,3 49,8 10,9
2010 8,8 5,5 7,6 13,4 56,6 8,3
2011 7,4 6,0 8,0 14,9 59,5 4,1
2012 4,6 5,7 8,1 18,4 61,5 1,7
Percentage of total revision surgeryarthroplasty according to articular coupling during the
years 2001 - 2012.
Year of surgery Total revision surgery
met-pol met-xlk cer-pol cer-xlk cer-cer met-met
2001 36,4 12,3 35,5 3,5 10,3 2,1
2002 31,8 9,7 40,5 4,3 11,7 2,0
2003 29,2 11,8 40,0 4,9 13,1 1,0
2004 29,6 14,2 28,9 2,0 19,4 5,9
2005 26,1 16,5 21,3 6,1 23,0 7,0
2006 25,1 19,9 18,5 4,4 26,2 5,9
2007 19,3 22,5 13,5 8,4 33,5 2,9
2008 18,4 17,9 13,5 13,5 33,2 3,6
2009 14,5 17,2 14,0 14,9 35,3 4,1
2010 12,7 10,2 18,6 18,2 38,1 2,1
2011 12,2 14,0 10,0 27,6 36,2 -
2012 8,5 11,7 10,3 29,6 39,9 -
Percentage of elective THA according to articular coupling and class age
Age class Elective THA
met-pol cer-pol cer-cer met-met
<40 5,4 12,3 65,5 16,8
40-49 8,0 14,0 60,7 17,3
50-59 11,8 17,0 54,7 16,5
60-69 22,7 22,8 44,4 10,1
70-79 36,0 28,4 30,4 5,1
Over 80 55,0 24,5 17,2 3,3
33
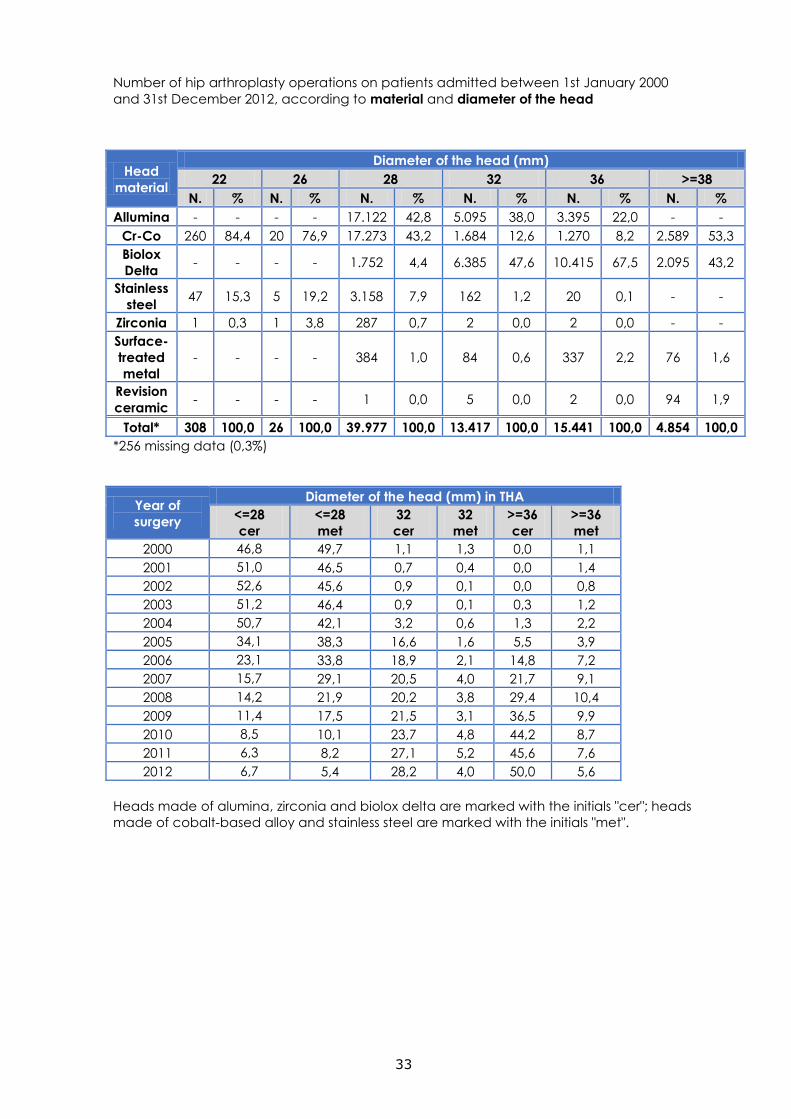
Number of hip arthroplasty operations on patients admitted between 1st January 2000
and 31st December 2012, according to material and diameter of the head
Head
material
Diameter of the head (mm)
22 26 28 32 36 >=38
N. % N. % N. % N. % N. % N. %
Allumina - - - - 17.122 42,8 5.095 38,0 3.395 22,0 - -
Cr-Co 260 84,4 20 76,9 17.273 43,2 1.684 12,6 1.270 8,2 2.589 53,3
Biolox
Delta - - - - 1.752 4,4 6.385 47,6 10.415 67,5 2.095 43,2
Stainless
steel 47 15,3 5 19,2 3.158 7,9 162 1,2 20 0,1 - -
Zirconia 1 0,3 1 3,8 287 0,7 2 0,0 2 0,0 - -
Surface-
treated
metal
- - - - 384 1,0 84 0,6 337 2,2 76 1,6
Revision
ceramic - - - - 1 0,0 5 0,0 2 0,0 94 1,9
Total* 308 100,0 26 100,0 39.977 100,0 13.417 100,0 15.441 100,0 4.854 100,0
*256 missing data (0,3%)
Year of
surgery
Diameter of the head (mm) in THA
<=28
cer
<=28
met
32
cer
32
met
>=36
cer
>=36
met
2000 46,8 49,7 1,1 1,3 0,0 1,1
2001 51,0 46,5 0,7 0,4 0,0 1,4
2002 52,6 45,6 0,9 0,1 0,0 0,8
2003 51,2 46,4 0,9 0,1 0,3 1,2
2004 50,7 42,1 3,2 0,6 1,3 2,2
2005 34,1 38,3 16,6 1,6 5,5 3,9
2006 23,1 33,8 18,9 2,1 14,8 7,2
2007 15,7 29,1 20,5 4,0 21,7 9,1
2008 14,2 21,9 20,2 3,8 29,4 10,4
2009 11,4 17,5 21,5 3,1 36,5 9,9
2010 8,5 10,1 23,7 4,8 44,2 8,7
2011 6,3 8,2 27,1 5,2 45,6 7,6
2012 6,7 5,4 28,2 4,0 50,0 5,6
Heads made of alumina, zirconia and biolox delta are marked with the initials "cer"; heads
made of cobalt-based alloy and stainless steel are marked with the initials "met".
34
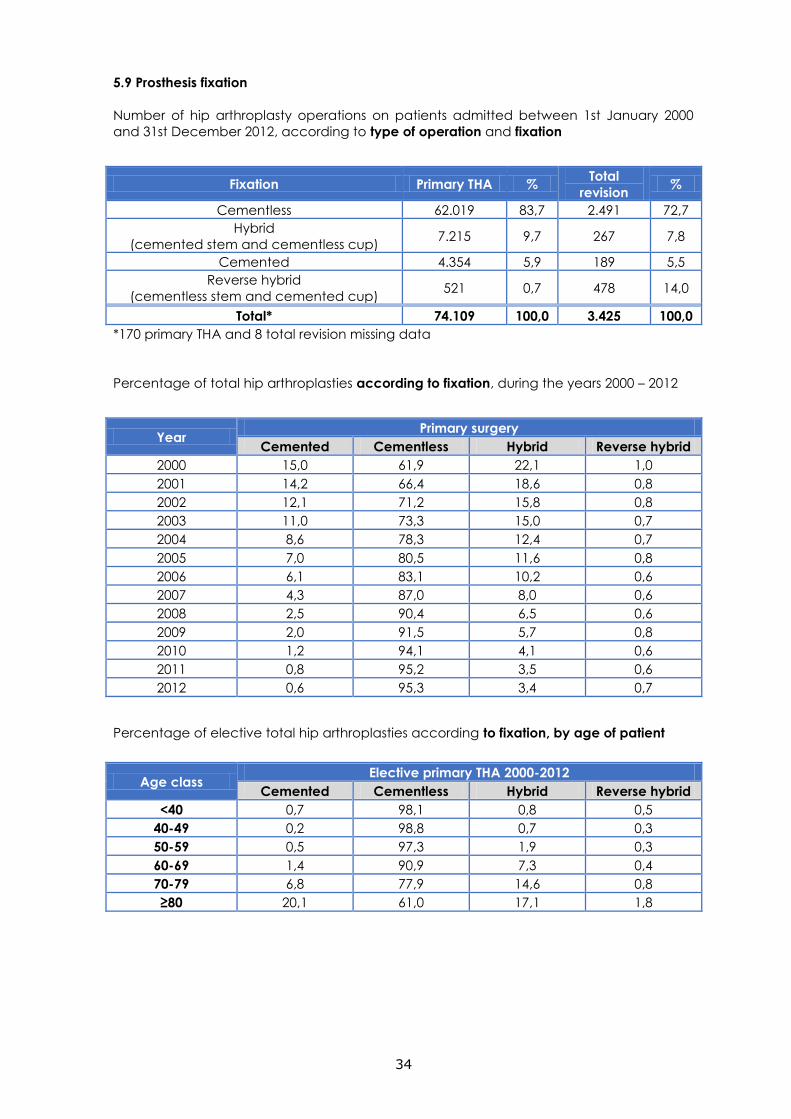
5.9 Prosthesis fixation
Number of hip arthroplasty operations on patients admitted between 1st January 2000
and 31st December 2012, according to type of operation and fixation
Fixation Primary THA % Total
revision %
Cementless 62.019 83,7 2.491 72,7
Hybrid
(cemented stem and cementless cup) 7.215 9,7 267 7,8
Cemented 4.354 5,9 189 5,5
Reverse hybrid
(cementless stem and cemented cup) 521 0,7 478 14,0
Total* 74.109 100,0 3.425 100,0
*170 primary THA and 8 total revision missing data
Percentage of total hip arthroplasties according to fixation, during the years 2000 – 2012
Year Primary surgery
Cemented Cementless Hybrid Reverse hybrid
2000 15,0 61,9 22,1 1,0
2001 14,2 66,4 18,6 0,8
2002 12,1 71,2 15,8 0,8
2003 11,0 73,3 15,0 0,7
2004 8,6 78,3 12,4 0,7
2005 7,0 80,5 11,6 0,8
2006 6,1 83,1 10,2 0,6
2007 4,3 87,0 8,0 0,6
2008 2,5 90,4 6,5 0,6
2009 2,0 91,5 5,7 0,8
2010 1,2 94,1 4,1 0,6
2011 0,8 95,2 3,5 0,6
2012 0,6 95,3 3,4 0,7
Percentage of elective total hip arthroplasties according to fixation, by age of patient
Age class Elective primary THA 2000-2012
Cemented Cementless Hybrid Reverse hybrid
<40 0,7 98,1 0,8 0,5
40-49 0,2 98,8 0,7 0,3
50-59 0,5 97,3 1,9 0,3
60-69 1,4 90,9 7,3 0,4
70-79 6,8 77,9 14,6 0,8
≥80 20,1 61,0 17,1 1,8
35
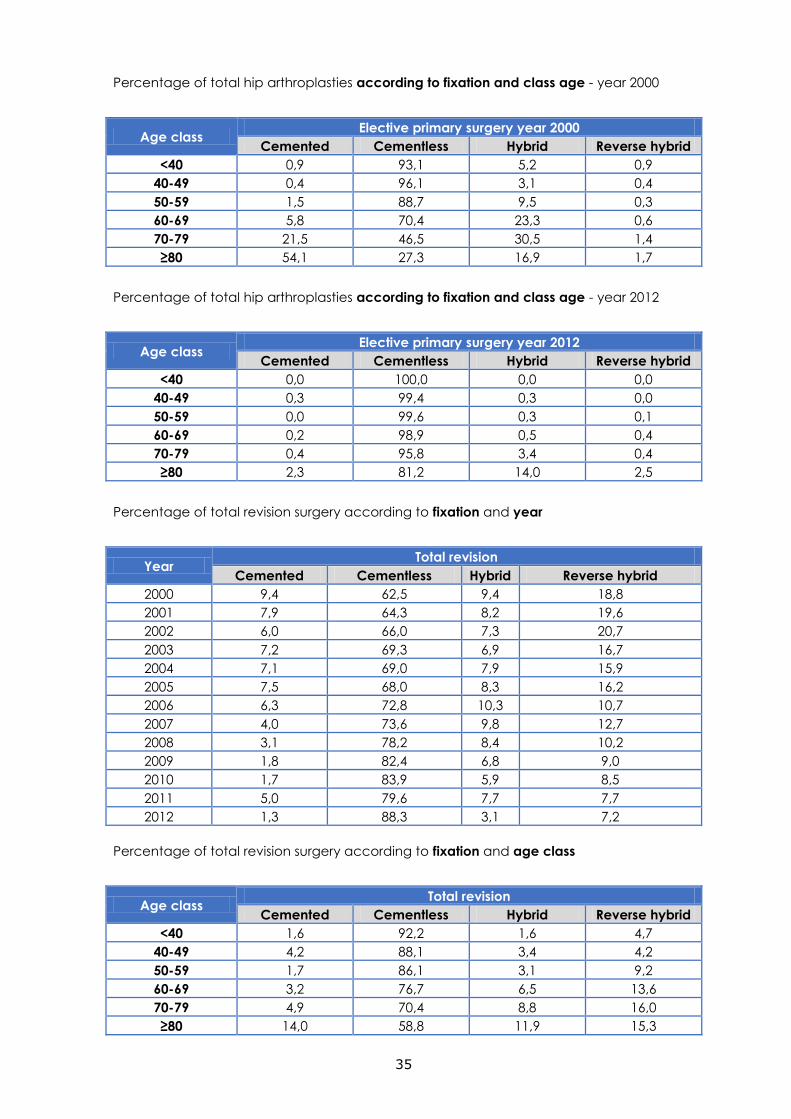
Percentage of total hip arthroplasties according to fixation and class age - year 2000
Age class Elective primary surgery year 2000
Cemented Cementless Hybrid Reverse hybrid
<40 0,9 93,1 5,2 0,9
40-49 0,4 96,1 3,1 0,4
50-59 1,5 88,7 9,5 0,3
60-69 5,8 70,4 23,3 0,6
70-79 21,5 46,5 30,5 1,4
≥80 54,1 27,3 16,9 1,7
Percentage of total hip arthroplasties according to fixation and class age - year 2012
Age class Elective primary surgery year 2012
Cemented Cementless Hybrid Reverse hybrid
<40 0,0 100,0 0,0 0,0
40-49 0,3 99,4 0,3 0,0
50-59 0,0 99,6 0,3 0,1
60-69 0,2 98,9 0,5 0,4
70-79 0,4 95,8 3,4 0,4
≥80 2,3 81,2 14,0 2,5
Percentage of total revision surgery according to fixation and year
Year Total revision
Cemented Cementless Hybrid Reverse hybrid
2000 9,4 62,5 9,4 18,8
2001 7,9 64,3 8,2 19,6
2002 6,0 66,0 7,3 20,7
2003 7,2 69,3 6,9 16,7
2004 7,1 69,0 7,9 15,9
2005 7,5 68,0 8,3 16,2
2006 6,3 72,8 10,3 10,7
2007 4,0 73,6 9,8 12,7
2008 3,1 78,2 8,4 10,2
2009 1,8 82,4 6,8 9,0
2010 1,7 83,9 5,9 8,5
2011 5,0 79,6 7,7 7,7
2012 1,3 88,3 3,1 7,2
Percentage of total revision surgery according to fixation and age class
Age class Total revision
Cemented Cementless Hybrid Reverse hybrid
<40 1,6 92,2 1,6 4,7
40-49 4,2 88,1 3,4 4,2
50-59 1,7 86,1 3,1 9,2
60-69 3,2 76,7 6,5 13,6
70-79 4,9 70,4 8,8 16,0
≥80 14,0 58,8 11,9 15,3
36
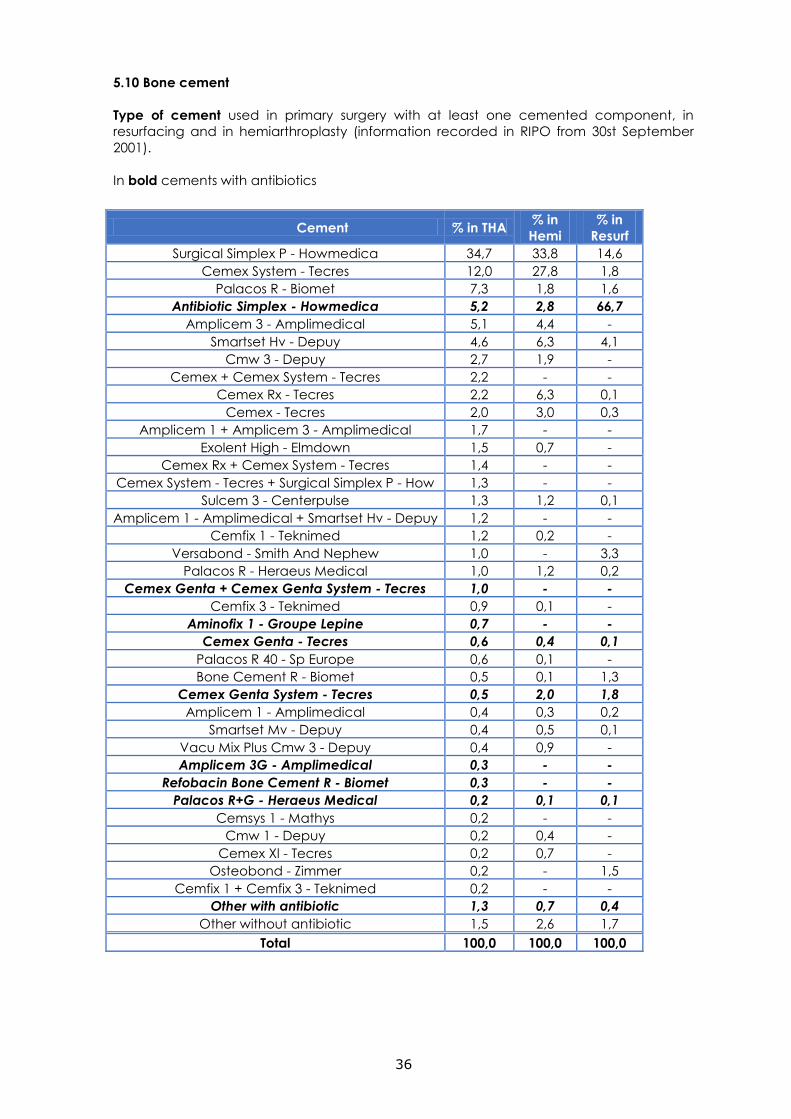
5.10 Bone cement
Type of cement used in primary surgery with at least one cemented component, in
resurfacing and in hemiarthroplasty (information recorded in RIPO from 30st September
2001).
In bold cements with antibiotics
Cement % in THA % in
Hemi
% in
Resurf
Surgical Simplex P - Howmedica 34,7 33,8 14,6
Cemex System - Tecres 12,0 27,8 1,8
Palacos R - Biomet 7,3 1,8 1,6
Antibiotic Simplex - Howmedica 5,2 2,8 66,7
Amplicem 3 - Amplimedical 5,1 4,4 -
Smartset Hv - Depuy 4,6 6,3 4,1
Cmw 3 - Depuy 2,7 1,9 -
Cemex + Cemex System - Tecres 2,2 - -
Cemex Rx - Tecres 2,2 6,3 0,1
Cemex - Tecres 2,0 3,0 0,3
Amplicem 1 + Amplicem 3 - Amplimedical 1,7 - -
Exolent High - Elmdown 1,5 0,7 -
Cemex Rx + Cemex System - Tecres 1,4 - -
Cemex System - Tecres + Surgical Simplex P - How 1,3 - -
Sulcem 3 - Centerpulse 1,3 1,2 0,1
Amplicem 1 - Amplimedical + Smartset Hv - Depuy 1,2 - -
Cemfix 1 - Teknimed 1,2 0,2 -
Versabond - Smith And Nephew 1,0 - 3,3
Palacos R - Heraeus Medical 1,0 1,2 0,2
Cemex Genta + Cemex Genta System - Tecres 1,0 - -
Cemfix 3 - Teknimed 0,9 0,1 -
Aminofix 1 - Groupe Lepine 0,7 - -
Cemex Genta - Tecres 0,6 0,4 0,1
Palacos R 40 - Sp Europe 0,6 0,1 -
Bone Cement R - Biomet 0,5 0,1 1,3
Cemex Genta System - Tecres 0,5 2,0 1,8
Amplicem 1 - Amplimedical 0,4 0,3 0,2
Smartset Mv - Depuy 0,4 0,5 0,1
Vacu Mix Plus Cmw 3 - Depuy 0,4 0,9 -
Amplicem 3G - Amplimedical 0,3 - -
Refobacin Bone Cement R - Biomet 0,3 - -
Palacos R+G - Heraeus Medical 0,2 0,1 0,1
Cemsys 1 - Mathys 0,2 - -
Cmw 1 - Depuy 0,2 0,4 -
Cemex Xl - Tecres 0,2 0,7 -
Osteobond - Zimmer 0,2 - 1,5
Cemfix 1 + Cemfix 3 - Teknimed 0,2 - -
Other with antibiotic 1,3 0,7 0,4
Other without antibiotic 1,5 2,6 1,7
Total 100,0 100,0 100,0
37
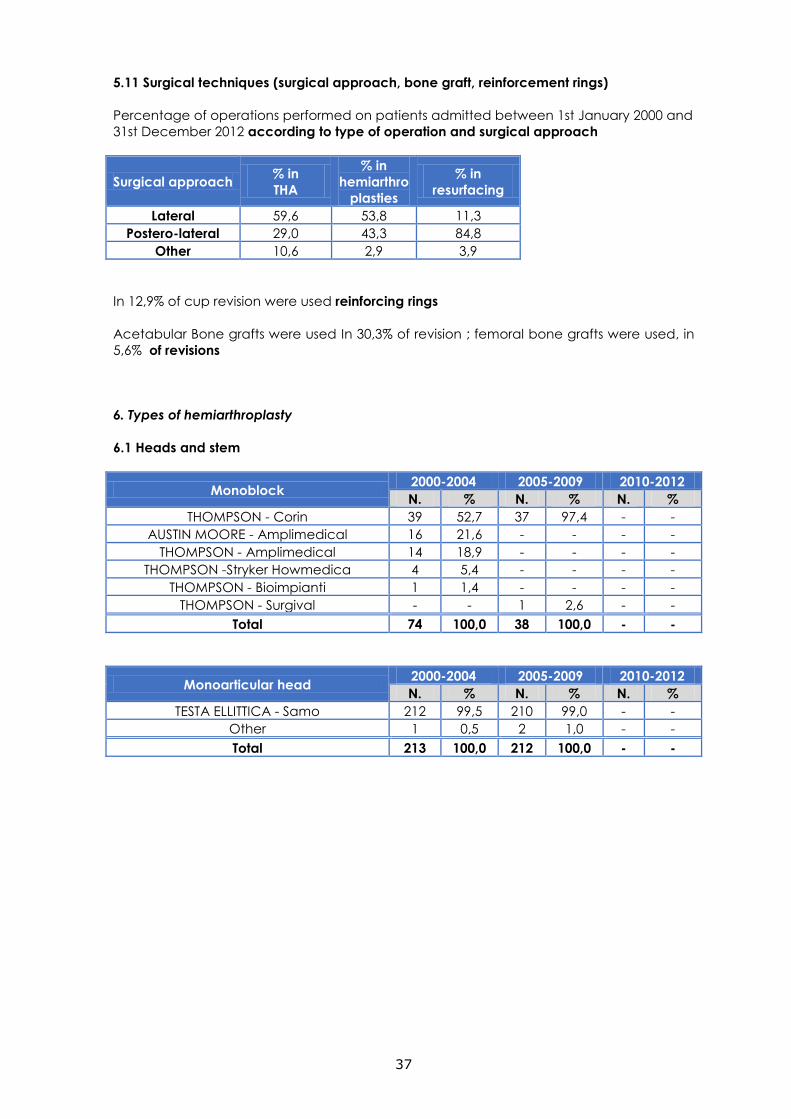
5.11 Surgical techniques (surgical approach, bone graft, reinforcement rings)
Percentage of operations performed on patients admitted between 1st January 2000 and
31st December 2012 according to type of operation and surgical approach
Surgical approach % in
THA
% in
hemiarthro
plasties
% in
resurfacing
Lateral 59,6 53,8 11,3
Postero-lateral 29,0 43,3 84,8
Other 10,6 2,9 3,9
In 12,9% of cup revision were used reinforcing rings
Acetabular Bone grafts were used In 30,3% of revision ; femoral bone grafts were used, in
5,6% of revisions
6. Types of hemiarthroplasty
6.1 Heads and stem
Monoblock 2000-2004 2005-2009 2010-2012
N. % N. % N. %
THOMPSON - Corin 39 52,7 37 97,4 - -
AUSTIN MOORE - Amplimedical 16 21,6 - - - -
THOMPSON - Amplimedical 14 18,9 - - - -
THOMPSON -Stryker Howmedica 4 5,4 - - - -
THOMPSON - Bioimpianti 1 1,4 - - - -
THOMPSON - Surgival - - 1 2,6 - -
Total 74 100,0 38 100,0 - -
Monoarticular head 2000-2004 2005-2009 2010-2012
N. % N. % N. %
TESTA ELLITTICA - Samo 212 99,5 210 99,0 - -
Other 1 0,5 2 1,0 - -
Total 213 100,0 212 100,0 - -
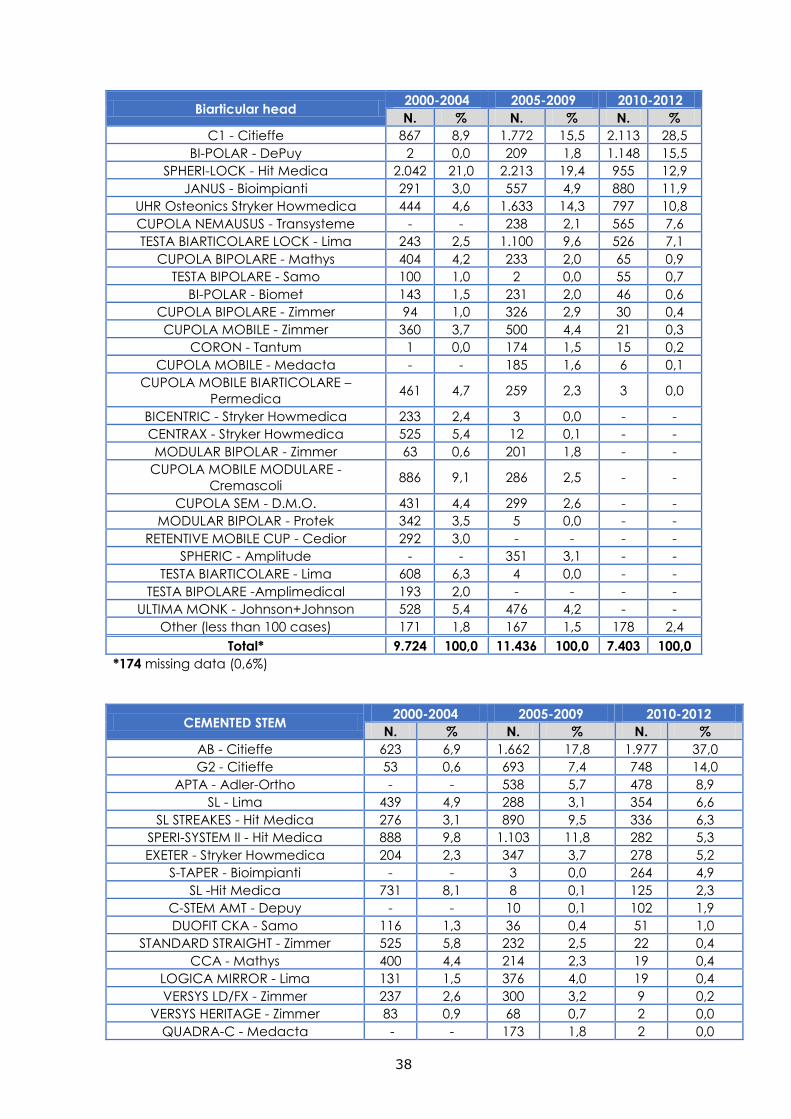
38
Biarticular head 2000-2004 2005-2009 2010-2012
N. % N. % N. %
C1 - Citieffe 867 8,9 1.772 15,5 2.113 28,5
BI-POLAR - DePuy 2 0,0 209 1,8 1.148 15,5
SPHERI-LOCK - Hit Medica 2.042 21,0 2.213 19,4 955 12,9
JANUS - Bioimpianti 291 3,0 557 4,9 880 11,9
UHR Osteonics Stryker Howmedica 444 4,6 1.633 14,3 797 10,8
CUPOLA NEMAUSUS - Transysteme - - 238 2,1 565 7,6
TESTA BIARTICOLARE LOCK - Lima 243 2,5 1.100 9,6 526 7,1
CUPOLA BIPOLARE - Mathys 404 4,2 233 2,0 65 0,9
TESTA BIPOLARE - Samo 100 1,0 2 0,0 55 0,7
BI-POLAR - Biomet 143 1,5 231 2,0 46 0,6
CUPOLA BIPOLARE - Zimmer 94 1,0 326 2,9 30 0,4
CUPOLA MOBILE - Zimmer 360 3,7 500 4,4 21 0,3
CORON - Tantum 1 0,0 174 1,5 15 0,2
CUPOLA MOBILE - Medacta - - 185 1,6 6 0,1
CUPOLA MOBILE BIARTICOLARE –
Permedica 461 4,7 259 2,3 3 0,0
BICENTRIC - Stryker Howmedica 233 2,4 3 0,0 - -
CENTRAX - Stryker Howmedica 525 5,4 12 0,1 - -
MODULAR BIPOLAR - Zimmer 63 0,6 201 1,8 - -
CUPOLA MOBILE MODULARE -
Cremascoli 886 9,1 286 2,5 - -
CUPOLA SEM - D.M.O. 431 4,4 299 2,6 - -
MODULAR BIPOLAR - Protek 342 3,5 5 0,0 - -
RETENTIVE MOBILE CUP - Cedior 292 3,0 - - - -
SPHERIC - Amplitude - - 351 3,1 - -
TESTA BIARTICOLARE - Lima 608 6,3 4 0,0 - -
TESTA BIPOLARE -Amplimedical 193 2,0 - - - -
ULTIMA MONK - Johnson+Johnson 528 5,4 476 4,2 - -
Other (less than 100 cases) 171 1,8 167 1,5 178 2,4
Total* 9.724 100,0 11.436 100,0 7.403 100,0
*174 missing data (0,6%)
CEMENTED STEM 2000-2004 2005-2009 2010-2012
N. % N. % N. %
AB - Citieffe 623 6,9 1.662 17,8 1.977 37,0
G2 - Citieffe 53 0,6 693 7,4 748 14,0
APTA - Adler-Ortho - - 538 5,7 478 8,9
SL - Lima 439 4,9 288 3,1 354 6,6
SL STREAKES - Hit Medica 276 3,1 890 9,5 336 6,3
SPERI-SYSTEM II - Hit Medica 888 9,8 1.103 11,8 282 5,3
EXETER - Stryker Howmedica 204 2,3 347 3,7 278 5,2
S-TAPER - Bioimpianti - - 3 0,0 264 4,9
SL -Hit Medica 731 8,1 8 0,1 125 2,3
C-STEM AMT - Depuy - - 10 0,1 102 1,9
DUOFIT CKA - Samo 116 1,3 36 0,4 51 1,0
STANDARD STRAIGHT - Zimmer 525 5,8 232 2,5 22 0,4
CCA - Mathys 400 4,4 214 2,3 19 0,4
LOGICA MIRROR - Lima 131 1,5 376 4,0 19 0,4
VERSYS LD/FX - Zimmer 237 2,6 300 3,2 9 0,2
VERSYS HERITAGE - Zimmer 83 0,9 68 0,7 2 0,0
QUADRA-C - Medacta - - 173 1,8 2 0,0
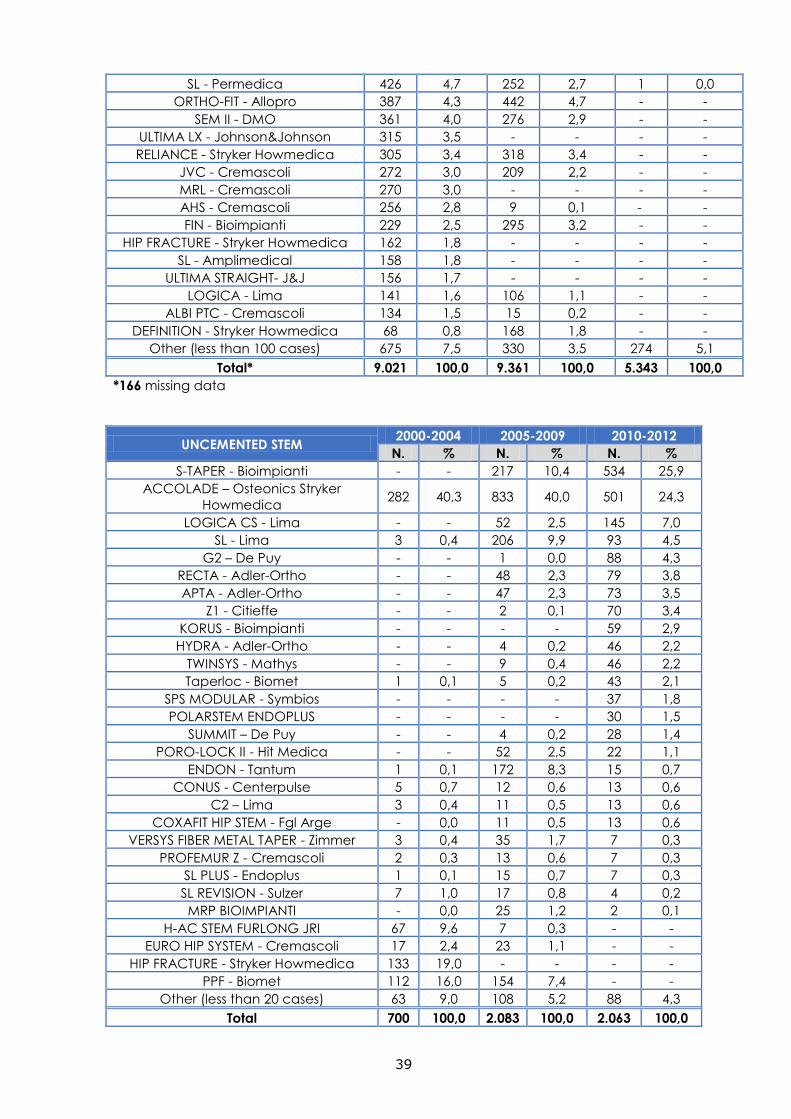
39
SL - Permedica 426 4,7 252 2,7 1 0,0
ORTHO-FIT - Allopro 387 4,3 442 4,7 - -
SEM II - DMO 361 4,0 276 2,9 - -
ULTIMA LX - Johnson&Johnson 315 3,5 - - - -
RELIANCE - Stryker Howmedica 305 3,4 318 3,4 - -
JVC - Cremascoli 272 3,0 209 2,2 - -
MRL - Cremascoli 270 3,0 - - - -
AHS - Cremascoli 256 2,8 9 0,1 - -
FIN - Bioimpianti 229 2,5 295 3,2 - -
HIP FRACTURE - Stryker Howmedica 162 1,8 - - - -
SL - Amplimedical 158 1,8 - - - -
ULTIMA STRAIGHT- J&J 156 1,7 - - - -
LOGICA - Lima 141 1,6 106 1,1 - -
ALBI PTC - Cremascoli 134 1,5 15 0,2 - -
DEFINITION - Stryker Howmedica 68 0,8 168 1,8 - -
Other (less than 100 cases) 675 7,5 330 3,5 274 5,1
Total* 9.021 100,0 9.361 100,0 5.343 100,0
*166 missing data
UNCEMENTED STEM 2000-2004 2005-2009 2010-2012
N. % N. % N. %
S-TAPER - Bioimpianti - - 217 10,4 534 25,9
ACCOLADE – Osteonics Stryker
Howmedica 282 40,3 833 40,0 501 24,3
LOGICA CS - Lima - - 52 2,5 145 7,0
SL - Lima 3 0,4 206 9,9 93 4,5
G2 – De Puy - - 1 0,0 88 4,3
RECTA - Adler-Ortho - - 48 2,3 79 3,8
APTA - Adler-Ortho - - 47 2,3 73 3,5
Z1 - Citieffe - - 2 0,1 70 3,4
KORUS - Bioimpianti - - - - 59 2,9
HYDRA - Adler-Ortho - - 4 0,2 46 2,2
TWINSYS - Mathys - - 9 0,4 46 2,2
Taperloc - Biomet 1 0,1 5 0,2 43 2,1
SPS MODULAR - Symbios - - - - 37 1,8
POLARSTEM ENDOPLUS - - - - 30 1,5
SUMMIT – De Puy - - 4 0,2 28 1,4
PORO-LOCK II - Hit Medica - - 52 2,5 22 1,1
ENDON - Tantum 1 0,1 172 8,3 15 0,7
CONUS - Centerpulse 5 0,7 12 0,6 13 0,6
C2 – Lima 3 0,4 11 0,5 13 0,6
COXAFIT HIP STEM - Fgl Arge - 0,0 11 0,5 13 0,6
VERSYS FIBER METAL TAPER - Zimmer 3 0,4 35 1,7 7 0,3
PROFEMUR Z - Cremascoli 2 0,3 13 0,6 7 0,3
SL PLUS - Endoplus 1 0,1 15 0,7 7 0,3
SL REVISION - Sulzer 7 1,0 17 0,8 4 0,2
MRP BIOIMPIANTI - 0,0 25 1,2 2 0,1
H-AC STEM FURLONG JRI 67 9,6 7 0,3 - -
EURO HIP SYSTEM - Cremascoli 17 2,4 23 1,1 - -
HIP FRACTURE - Stryker Howmedica 133 19,0 - - - -
PPF - Biomet 112 16,0 154 7,4 - -
Other (less than 20 cases) 63 9,0 108 5,2 88 4,3
Total 700 100,0 2.083 100,0 2.063 100,0
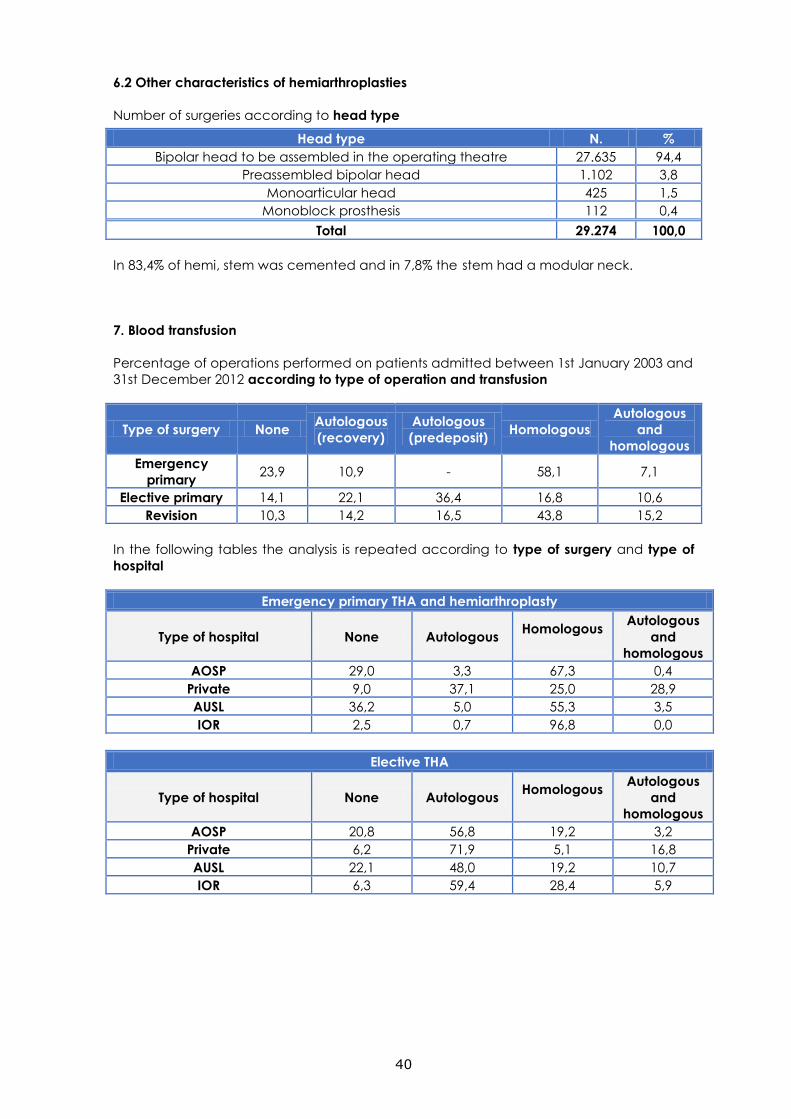
40
6.2 Other characteristics of hemiarthroplasties
Number of surgeries according to head type
Head type N. %
Bipolar head to be assembled in the operating theatre 27.635 94,4
Preassembled bipolar head 1.102 3,8
Monoarticular head 425 1,5
Monoblock prosthesis 112 0,4
Total 29.274 100,0
In 83,4% of hemi, stem was cemented and in 7,8% the stem had a modular neck.
7. Blood transfusion
Percentage of operations performed on patients admitted between 1st January 2003 and
31st December 2012 according to type of operation and transfusion
Type of surgery None Autologous
(recovery)
Autologous
(predeposit) Homologous
Autologous
and
homologous
Emergency
primary 23,9 10,9 - 58,1 7,1
Elective primary 14,1 22,1 36,4 16,8 10,6
Revision 10,3 14,2 16,5 43,8 15,2
In the following tables the analysis is repeated according to type of surgery and type of
hospital
Emergency primary THA and hemiarthroplasty
Type of hospital None Autologous Homologous
Autologous
and
homologous
AOSP 29,0 3,3 67,3 0,4
Private 9,0 37,1 25,0 28,9
AUSL 36,2 5,0 55,3 3,5
IOR 2,5 0,7 96,8 0,0
Elective THA
Type of hospital None Autologous Homologous
Autologous
and
homologous
AOSP 20,8 56,8 19,2 3,2
Private 6,2 71,9 5,1 16,8
AUSL 22,1 48,0 19,2 10,7
IOR 6,3 59,4 28,4 5,9
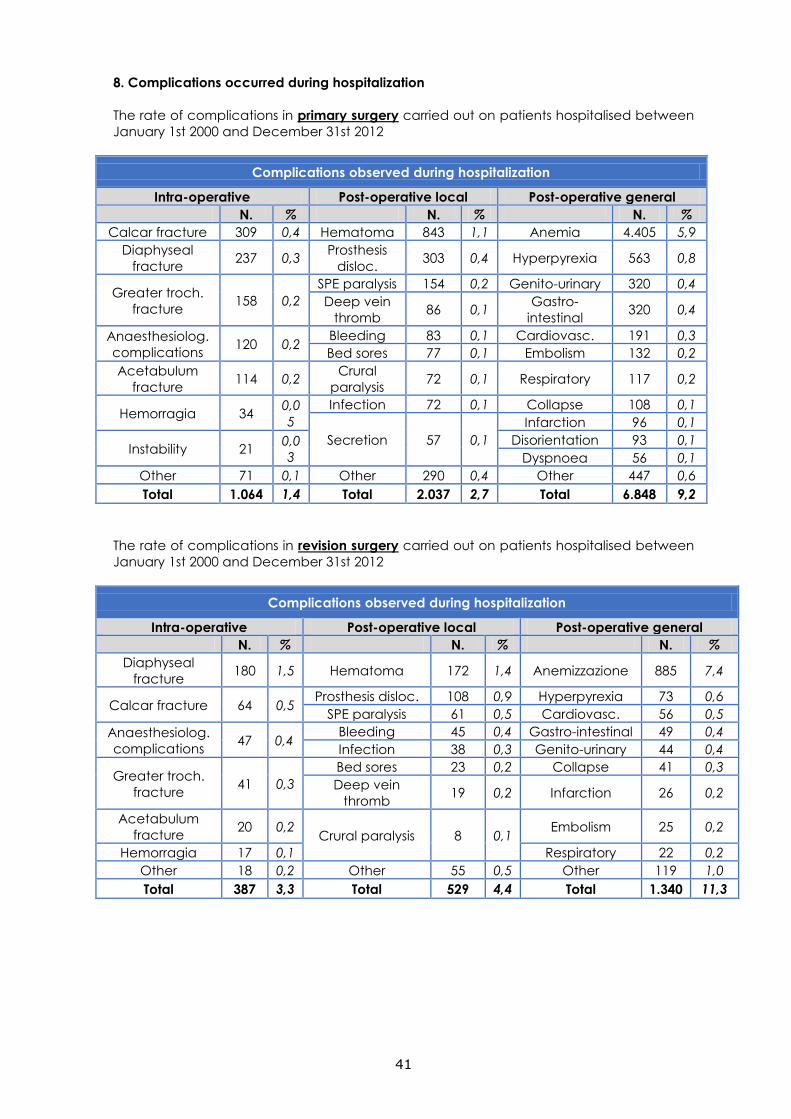
41
8. Complications occurred during hospitalization
The rate of complications in primary surgery carried out on patients hospitalised between
January 1st 2000 and December 31st 2012
Complications observed during hospitalization
Intra-operative Post-operative local Post-operative general
N. % N. % N. %
Calcar fracture 309 0,4 Hematoma 843 1,1 Anemia 4.405 5,9
Diaphyseal
fracture 237 0,3
Prosthesis
disloc. 303 0,4 Hyperpyrexia 563 0,8
Greater troch.
fracture 158 0,2
SPE paralysis 154 0,2 Genito-urinary 320 0,4
Deep vein
thromb 86 0,1
Gastro-
intestinal 320 0,4
Anaesthesiolog.
complications 120 0,2
Bleeding 83 0,1 Cardiovasc. 191 0,3
Bed sores 77 0,1 Embolism 132 0,2
Acetabulum
fracture 114 0,2
Crural
paralysis 72 0,1 Respiratory 117 0,2
Hemorragia 34 0,0
5
Infection 72 0,1 Collapse 108 0,1
Secretion 57 0,1
Infarction 96 0,1
Instability 21 0,0
3
Disorientation 93 0,1
Dyspnoea 56 0,1
Other 71 0,1 Other 290 0,4 Other 447 0,6
Total 1.064 1,4 Total 2.037 2,7 Total 6.848 9,2
The rate of complications in revision surgery carried out on patients hospitalised between
January 1st 2000 and December 31st 2012
Complications observed during hospitalization
Intra-operative Post-operative local Post-operative general
N. % N. % N. %
Diaphyseal
fracture 180 1,5 Hematoma 172 1,4 Anemizzazione 885 7,4
Calcar fracture 64 0,5 Prosthesis disloc. 108 0,9 Hyperpyrexia 73 0,6
SPE paralysis 61 0,5 Cardiovasc. 56 0,5
Anaesthesiolog.
complications 47 0,4
Bleeding 45 0,4 Gastro-intestinal 49 0,4
Infection 38 0,3 Genito-urinary 44 0,4
Greater troch.
fracture 41 0,3
Bed sores 23 0,2 Collapse 41 0,3
Deep vein
thromb 19 0,2 Infarction 26 0,2
Acetabulum
fracture 20 0,2
Crural paralysis 8 0,1 Embolism 25 0,2
Hemorragia 17 0,1 Respiratory 22 0,2
Other 18 0,2 Other 55 0,5 Other 119 1,0
Total 387 3,3 Total 529 4,4 Total 1.340 11,3
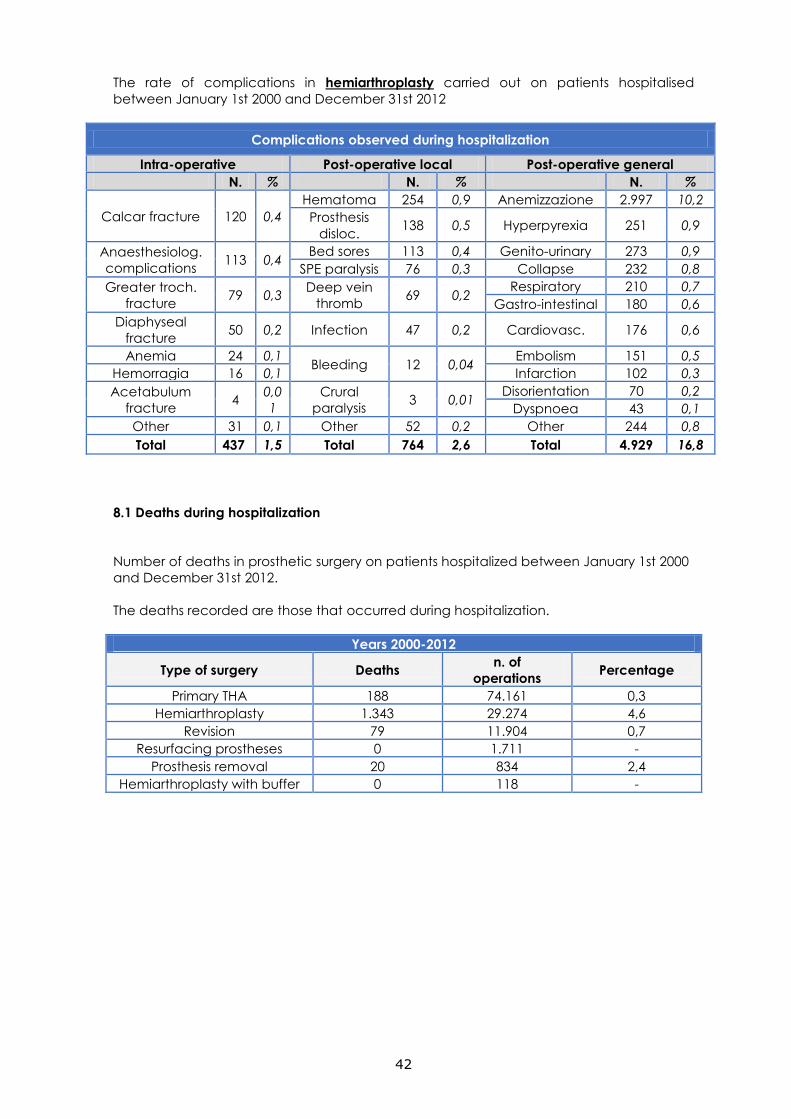
42
The rate of complications in hemiarthroplasty carried out on patients hospitalised
between January 1st 2000 and December 31st 2012
Complications observed during hospitalization
Intra-operative Post-operative local Post-operative general
N. % N. % N. %
Calcar fracture 120 0,4
Hematoma 254 0,9 Anemizzazione 2.997 10,2
Prosthesis
disloc. 138 0,5 Hyperpyrexia 251 0,9
Anaesthesiolog.
complications 113 0,4
Bed sores 113 0,4 Genito-urinary 273 0,9
SPE paralysis 76 0,3 Collapse 232 0,8
Greater troch.
fracture 79 0,3
Deep vein
thromb 69 0,2
Respiratory 210 0,7
Gastro-intestinal 180 0,6
Diaphyseal
fracture 50 0,2 Infection 47 0,2 Cardiovasc. 176 0,6
Anemia 24 0,1 Bleeding 12 0,04
Embolism 151 0,5
Hemorragia 16 0,1 Infarction 102 0,3
Acetabulum
fracture 4
0,0
1
Crural
paralysis 3 0,01
Disorientation 70 0,2
Dyspnoea 43 0,1
Other 31 0,1 Other 52 0,2 Other 244 0,8
Total 437 1,5 Total 764 2,6 Total 4.929 16,8
8.1 Deaths during hospitalization
Number of deaths in prosthetic surgery on patients hospitalized between January 1st 2000
and December 31st 2012.
The deaths recorded are those that occurred during hospitalization.
Years 2000-2012
Type of surgery Deaths n. of
operations Percentage
Primary THA 188 74.161 0,3
Hemiarthroplasty 1.343 29.274 4,6
Revision 79 11.904 0,7
Resurfacing prostheses 0 1.711 -
Prosthesis removal 20 834 2,4
Hemiarthroplasty with buffer 0 118 -
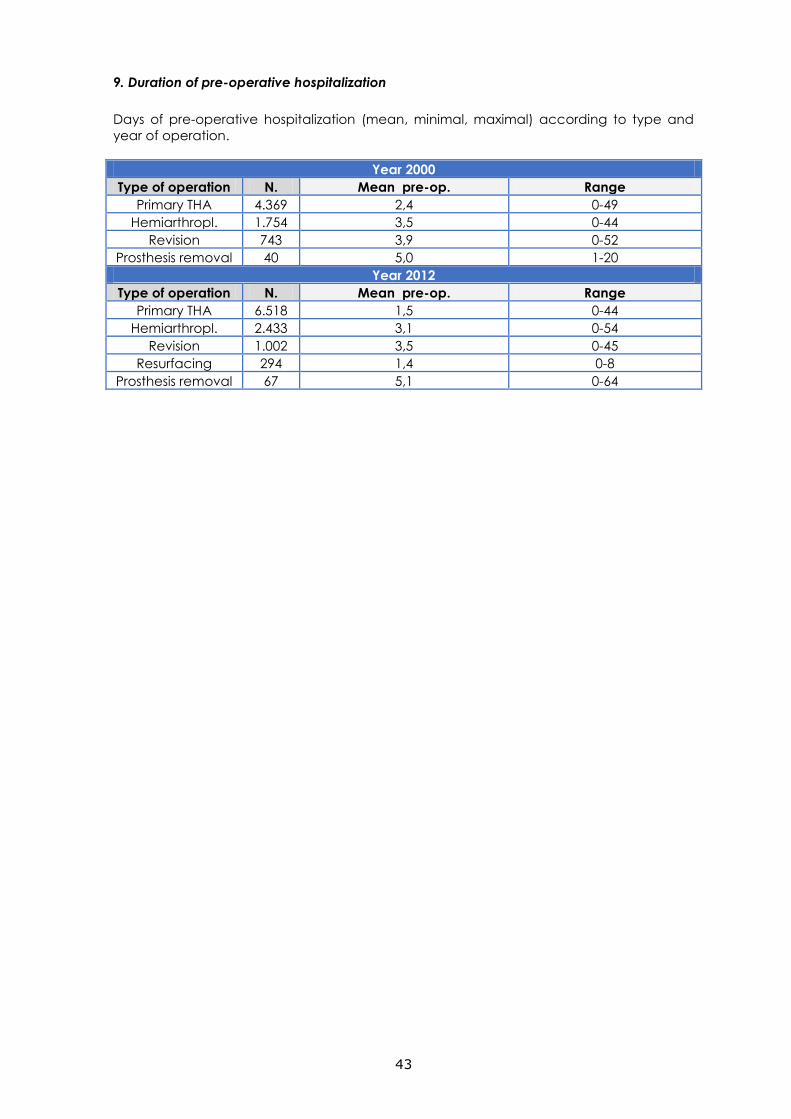
43
9. Duration of pre-operative hospitalization
Days of pre-operative hospitalization (mean, minimal, maximal) according to type and
year of operation.
Year 2000
Type of operation N. Mean pre-op. Range
Primary THA 4.369 2,4 0-49
Hemiarthropl. 1.754 3,5 0-44
Revision 743 3,9 0-52
Prosthesis removal 40 5,0 1-20
Year 2012
Type of operation N. Mean pre-op. Range
Primary THA 6.518 1,5 0-44
Hemiarthropl. 2.433 3,1 0-54
Revision 1.002 3,5 0-45
Resurfacing 294 1,4 0-8
Prosthesis removal 67 5,1 0-64
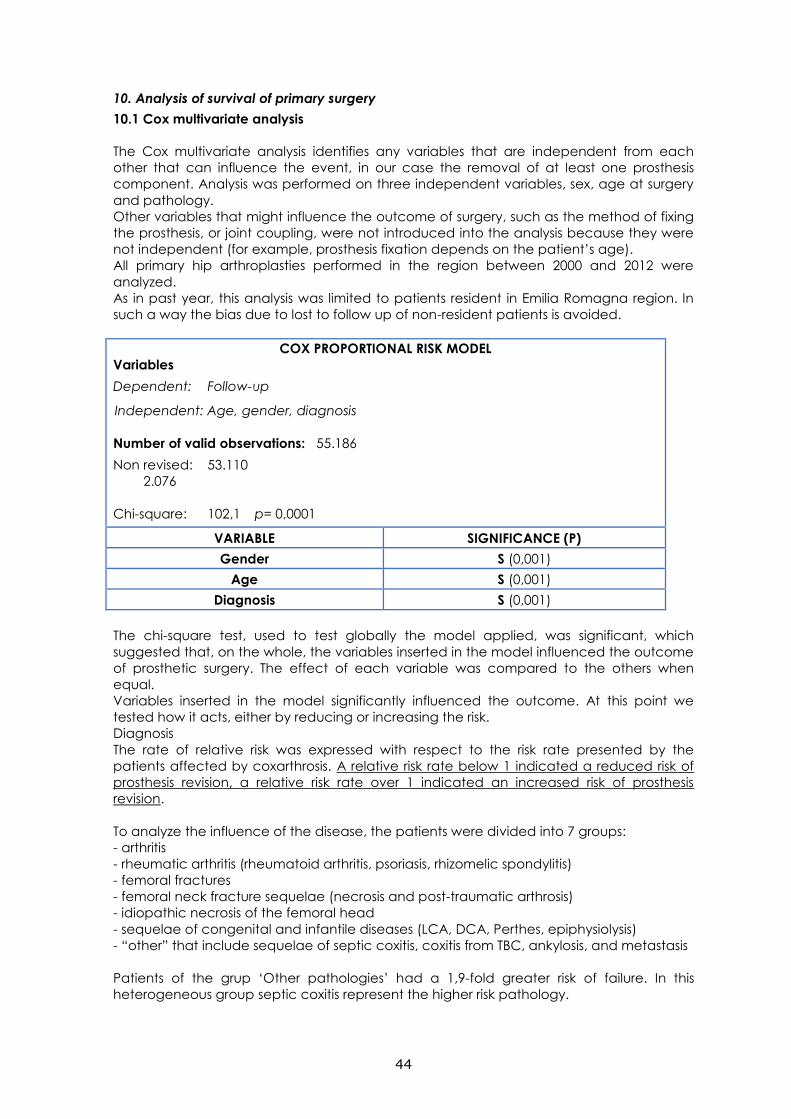
44
10. Analysis of survival of primary surgery
10.1 Cox multivariate analysis
The Cox multivariate analysis identifies any variables that are independent from each
other that can influence the event, in our case the removal of at least one prosthesis
component. Analysis was performed on three independent variables, sex, age at surgery
and pathology.
Other variables that might influence the outcome of surgery, such as the method of fixing
the prosthesis, or joint coupling, were not introduced into the analysis because they were
not independent (for example, prosthesis fixation depends on the patient’s age).
All primary hip arthroplasties performed in the region between 2000 and 2012 were
analyzed.
As in past year, this analysis was limited to patients resident in Emilia Romagna region. In
such a way the bias due to lost to follow up of non-resident patients is avoided.
COX PROPORTIONAL RISK MODEL
Variables
Dependent: Follow-up
Independent: Age, gender, diagnosis
Number of valid observations: 55.186
Non revised: 53.110
2.076
Chi-square: 102,1 p= 0,0001
VARIABLE SIGNIFICANCE (P)
Gender S (0,001)
Age S (0,001)
Diagnosis S (0,001)
The chi-square test, used to test globally the model applied, was significant, which
suggested that, on the whole, the variables inserted in the model influenced the outcome
of prosthetic surgery. The effect of each variable was compared to the others when
equal.
Variables inserted in the model significantly influenced the outcome. At this point we
tested how it acts, either by reducing or increasing the risk.
Diagnosis
The rate of relative risk was expressed with respect to the risk rate presented by the
patients affected by coxarthrosis. A relative risk rate below 1 indicated a reduced risk of
prosthesis revision, a relative risk rate over 1 indicated an increased risk of prosthesis
revision.
To analyze the influence of the disease, the patients were divided into 7 groups:
- arthritis
- rheumatic arthritis (rheumatoid arthritis, psoriasis, rhizomelic spondylitis)
- femoral fractures
- femoral neck fracture sequelae (necrosis and post-traumatic arthrosis)
- idiopathic necrosis of the femoral head
- sequelae of congenital and infantile diseases (LCA, DCA, Perthes, epiphysiolysis)
- “other” that include sequelae of septic coxitis, coxitis from TBC, ankylosis, and metastasis
Patients of the grup ‘Other pathologies’ had a 1,9-fold greater risk of failure. In this
heterogeneous group septic coxitis represent the higher risk pathology.
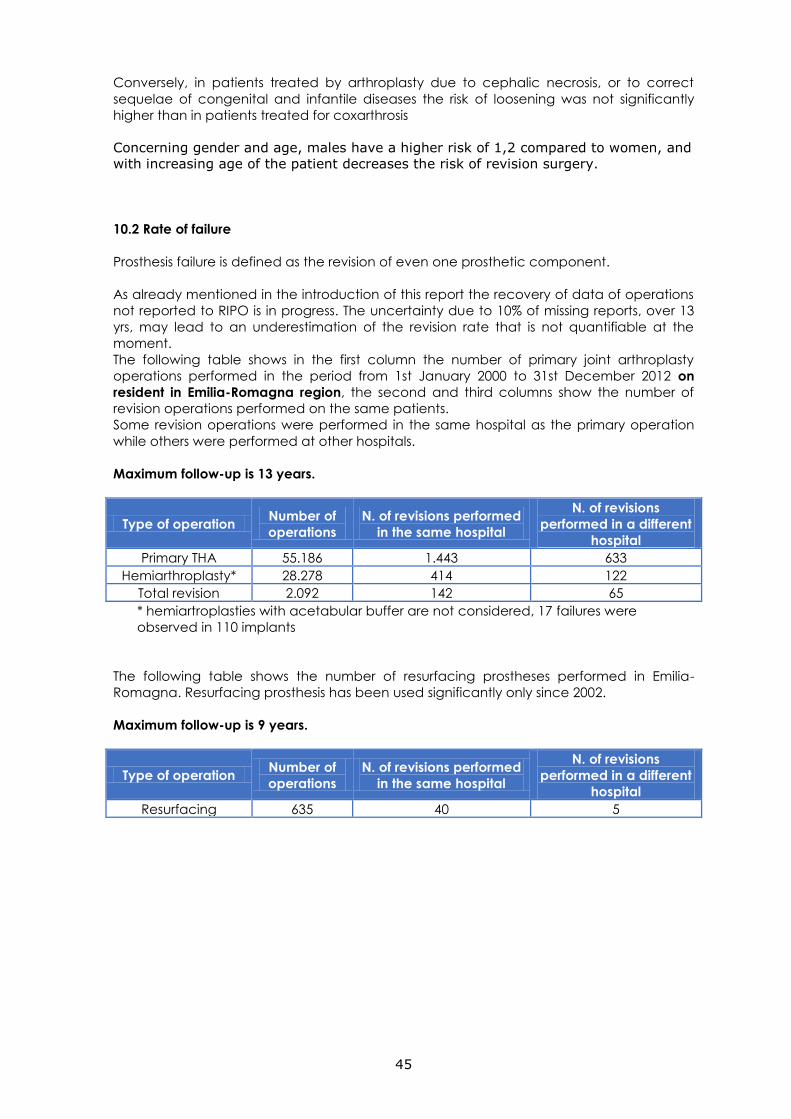
45
Conversely, in patients treated by arthroplasty due to cephalic necrosis, or to correct
sequelae of congenital and infantile diseases the risk of loosening was not significantly
higher than in patients treated for coxarthrosis
Concerning gender and age, males have a higher risk of 1,2 compared to women, and
with increasing age of the patient decreases the risk of revision surgery.
10.2 Rate of failure
Prosthesis failure is defined as the revision of even one prosthetic component.
As already mentioned in the introduction of this report the recovery of data of operations
not reported to RIPO is in progress. The uncertainty due to 10% of missing reports, over 13
yrs, may lead to an underestimation of the revision rate that is not quantifiable at the
moment.
The following table shows in the first column the number of primary joint arthroplasty
operations performed in the period from 1st January 2000 to 31st December 2012 on
resident in Emilia-Romagna region, the second and third columns show the number of
revision operations performed on the same patients.
Some revision operations were performed in the same hospital as the primary operation
while others were performed at other hospitals.
Maximum follow-up is 13 years.
Type of operation Number of
operations
N. of revisions performed
in the same hospital
N. of revisions
performed in a different
hospital
Primary THA 55.186 1.443 633
Hemiarthroplasty* 28.278 414 122
Total revision 2.092 142 65
* hemiartroplasties with acetabular buffer are not considered, 17 failures were
observed in 110 implants
The following table shows the number of resurfacing prostheses performed in Emilia-
Romagna. Resurfacing prosthesis has been used significantly only since 2002.
Maximum follow-up is 9 years.
Type of operation Number of
operations
N. of revisions performed
in the same hospital
N. of revisions
performed in a different
hospital
Resurfacing 635 40 5
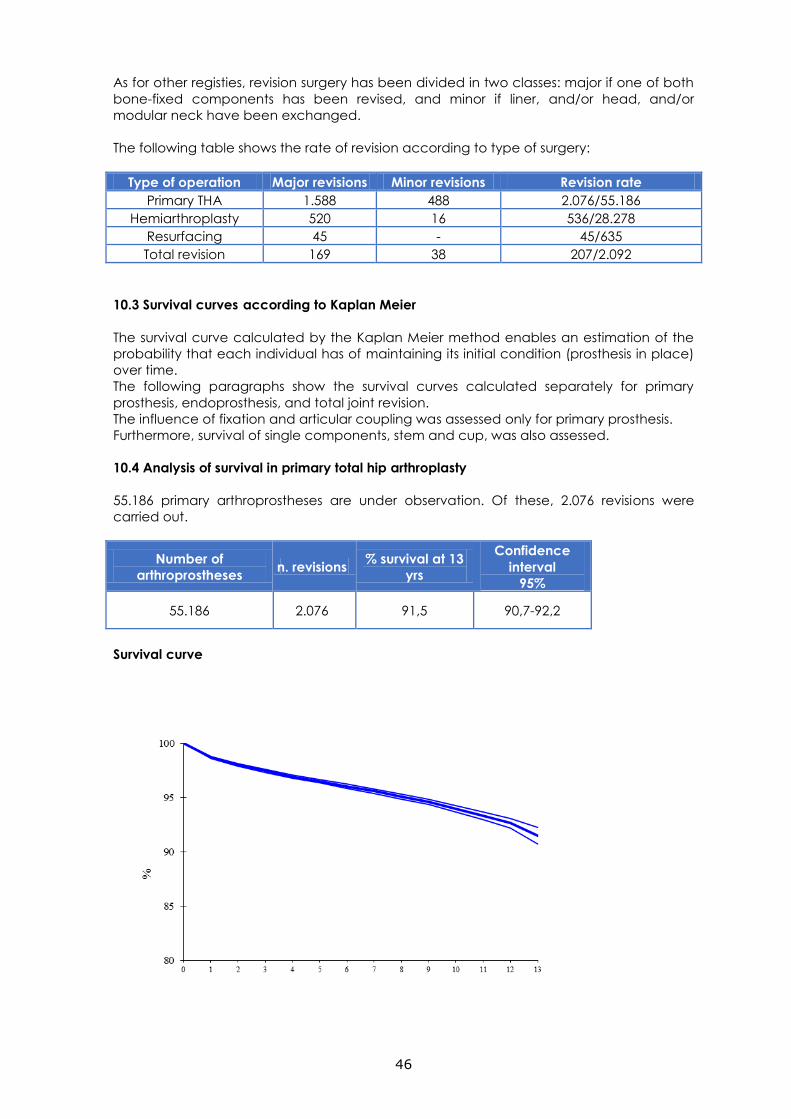
46
As for other registies, revision surgery has been divided in two classes: major if one of both
bone-fixed components has been revised, and minor if liner, and/or head, and/or
modular neck have been exchanged.
The following table shows the rate of revision according to type of surgery:
Type of operation Major revisions Minor revisions Revision rate
Primary THA 1.588 488 2.076/55.186
Hemiarthroplasty 520 16 536/28.278
Resurfacing 45 - 45/635
Total revision 169 38 207/2.092
10.3 Survival curves according to Kaplan Meier
The survival curve calculated by the Kaplan Meier method enables an estimation of the
probability that each individual has of maintaining its initial condition (prosthesis in place)
over time.
The following paragraphs show the survival curves calculated separately for primary
prosthesis, endoprosthesis, and total joint revision.
The influence of fixation and articular coupling was assessed only for primary prosthesis.
Furthermore, survival of single components, stem and cup, was also assessed.
10.4 Analysis of survival in primary total hip arthroplasty
55.186 primary arthroprostheses are under observation. Of these, 2.076 revisions were
carried out.
Number of
arthroprostheses n. revisions
% survival at 13
yrs
Confidence
interval
95%
55.186 2.076 91,5 90,7-92,2
Survival curve
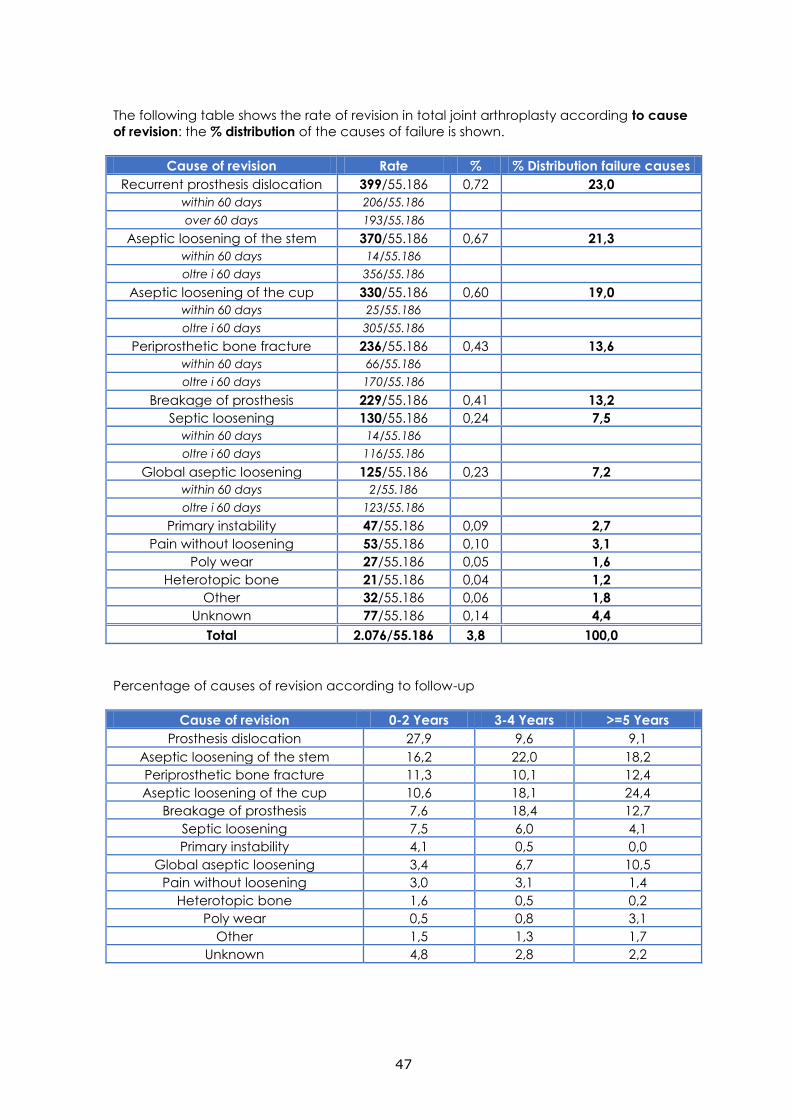
47
The following table shows the rate of revision in total joint arthroplasty according to cause
of revision: the % distribution of the causes of failure is shown.
Cause of revision Rate % % Distribution failure causes
Recurrent prosthesis dislocation 399/55.186 0,72 23,0
within 60 days 206/55.186
over 60 days 193/55.186
Aseptic loosening of the stem 370/55.186 0,67 21,3
within 60 days 14/55.186
oltre i 60 days 356/55.186
Aseptic loosening of the cup 330/55.186 0,60 19,0
within 60 days 25/55.186
oltre i 60 days 305/55.186
Periprosthetic bone fracture 236/55.186 0,43 13,6
within 60 days 66/55.186
oltre i 60 days 170/55.186
Breakage of prosthesis 229/55.186 0,41 13,2
Septic loosening 130/55.186 0,24 7,5
within 60 days 14/55.186
oltre i 60 days 116/55.186
Global aseptic loosening 125/55.186 0,23 7,2
within 60 days 2/55.186
oltre i 60 days 123/55.186
Primary instability 47/55.186 0,09 2,7
Pain without loosening 53/55.186 0,10 3,1
Poly wear 27/55.186 0,05 1,6
Heterotopic bone 21/55.186 0,04 1,2
Other 32/55.186 0,06 1,8
Unknown 77/55.186 0,14 4,4
Total 2.076/55.186 3,8 100,0
Percentage of causes of revision according to follow-up
Cause of revision 0-2 Years 3-4 Years >=5 Years
Prosthesis dislocation 27,9 9,6 9,1
Aseptic loosening of the stem 16,2 22,0 18,2
Periprosthetic bone fracture 11,3 10,1 12,4
Aseptic loosening of the cup 10,6 18,1 24,4
Breakage of prosthesis 7,6 18,4 12,7
Septic loosening 7,5 6,0 4,1
Primary instability 4,1 0,5 0,0
Global aseptic loosening 3,4 6,7 10,5
Pain without loosening 3,0 3,1 1,4
Heterotopic bone 1,6 0,5 0,2
Poly wear 0,5 0,8 3,1
Other 1,5 1,3 1,7
Unknown 4,8 2,8 2,2
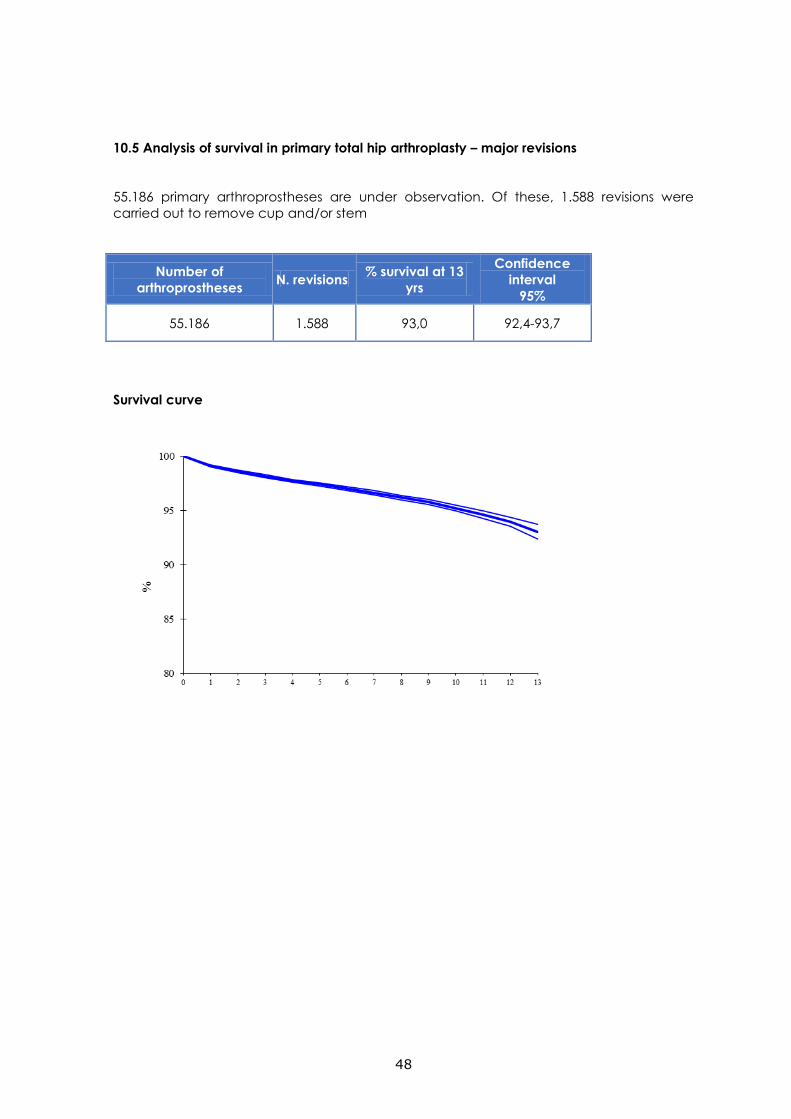
48
10.5 Analysis of survival in primary total hip arthroplasty – major revisions
55.186 primary arthroprostheses are under observation. Of these, 1.588 revisions were
carried out to remove cup and/or stem
Number of
arthroprostheses N. revisions
% survival at 13
yrs
Confidence
interval
95%
55.186 1.588 93,0 92,4-93,7
Survival curve
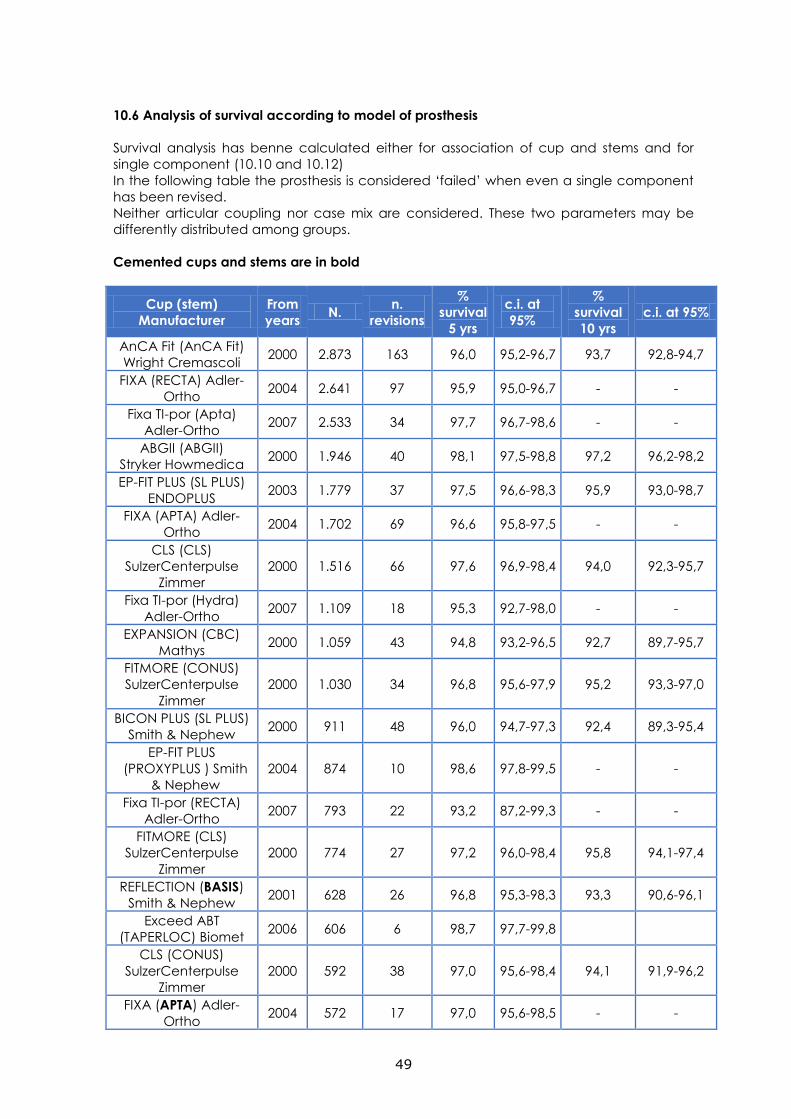
49
10.6 Analysis of survival according to model of prosthesis
Survival analysis has benne calculated either for association of cup and stems and for
single component (10.10 and 10.12)
In the following table the prosthesis is considered ‘failed’ when even a single component
has been revised.
Neither articular coupling nor case mix are considered. These two parameters may be
differently distributed among groups.
Cemented cups and stems are in bold
Cup (stem)
Manufacturer
From
years N.
n.
revisions
%
survival
5 yrs
c.i. at
95%
%
survival
10 yrs
c.i. at 95%
AnCA Fit (AnCA Fit)
Wright Cremascoli 2000 2.873 163 96,0 95,2-96,7 93,7 92,8-94,7
FIXA (RECTA) Adler-
Ortho 2004 2.641 97 95,9 95,0-96,7 - -
Fixa TI-por (Apta)
Adler-Ortho 2007 2.533 34 97,7 96,7-98,6 - -
ABGII (ABGII)
Stryker Howmedica 2000 1.946 40 98,1 97,5-98,8 97,2 96,2-98,2
EP-FIT PLUS (SL PLUS)
ENDOPLUS 2003 1.779 37 97,5 96,6-98,3 95,9 93,0-98,7
FIXA (APTA) Adler-
Ortho 2004 1.702 69 96,6 95,8-97,5 - -
CLS (CLS)
SulzerCenterpulse
Zimmer
2000 1.516 66 97,6 96,9-98,4 94,0 92,3-95,7
Fixa TI-por (Hydra)
Adler-Ortho 2007 1.109 18 95,3 92,7-98,0 - -
EXPANSION (CBC)
Mathys 2000 1.059 43 94,8 93,2-96,5 92,7 89,7-95,7
FITMORE (CONUS)
SulzerCenterpulse
Zimmer
2000 1.030 34 96,8 95,6-97,9 95,2 93,3-97,0
BICON PLUS (SL PLUS)
Smith & Nephew 2000 911 48 96,0 94,7-97,3 92,4 89,3-95,4
EP-FIT PLUS
(PROXYPLUS ) Smith
& Nephew
2004 874 10 98,6 97,8-99,5 - -
Fixa TI-por (RECTA)
Adler-Ortho 2007 793 22 93,2 87,2-99,3 - -
FITMORE (CLS)
SulzerCenterpulse
Zimmer
2000 774 27 97,2 96,0-98,4 95,8 94,1-97,4
REFLECTION (BASIS)
Smith & Nephew 2001 628 26 96,8 95,3-98,3 93,3 90,6-96,1
Exceed ABT
(TAPERLOC) Biomet 2006 606 6 98,7 97,7-99,8
CLS (CONUS)
SulzerCenterpulse
Zimmer
2000 592 38 97,0 95,6-98,4 94,1 91,9-96,2
FIXA (APTA) Adler-
Ortho 2004 572 17 97,0 95,6-98,5 - -
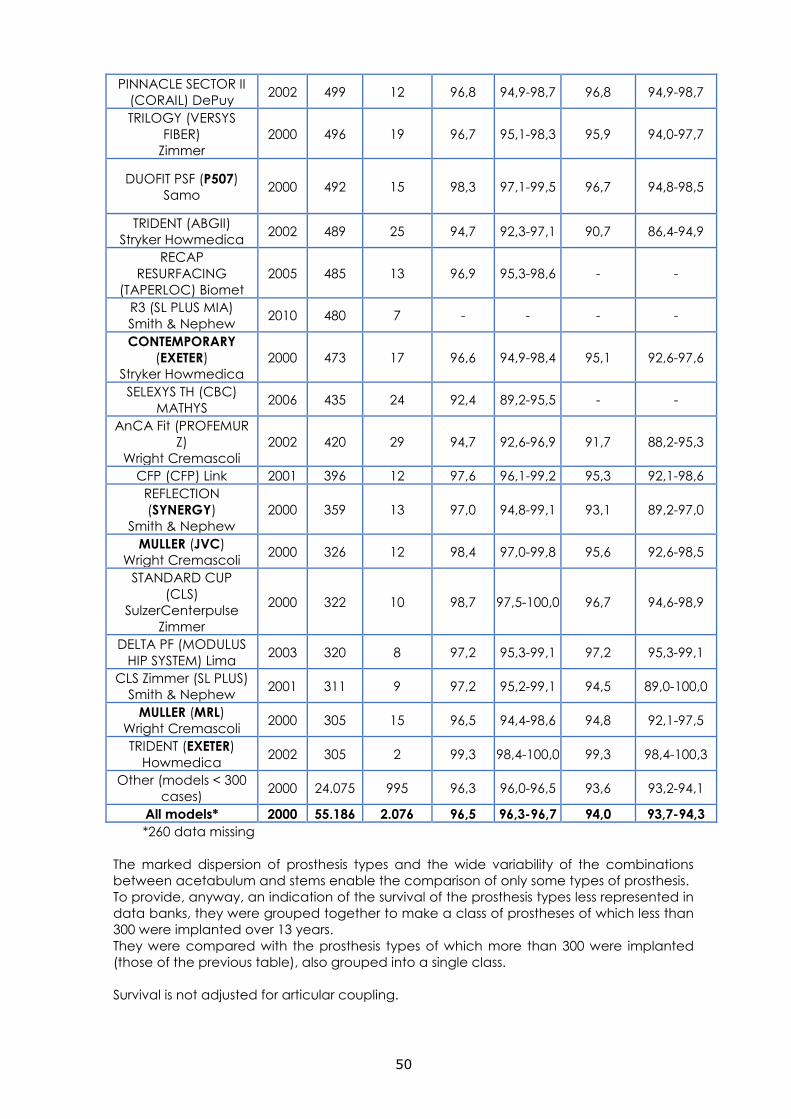
50
PINNACLE SECTOR II
(CORAIL) DePuy 2002 499 12 96,8 94,9-98,7 96,8 94,9-98,7
TRILOGY (VERSYS
FIBER)
Zimmer
2000 496 19 96,7 95,1-98,3 95,9 94,0-97,7
DUOFIT PSF (P507)
Samo 2000 492 15 98,3 97,1-99,5 96,7 94,8-98,5
TRIDENT (ABGII)
Stryker Howmedica 2002 489 25 94,7 92,3-97,1 90,7 86,4-94,9
RECAP
RESURFACING
(TAPERLOC) Biomet
2005 485 13 96,9 95,3-98,6 - -
R3 (SL PLUS MIA)
Smith & Nephew 2010 480 7 - - - -
CONTEMPORARY
(EXETER)
Stryker Howmedica
2000 473 17 96,6 94,9-98,4 95,1 92,6-97,6
SELEXYS TH (CBC)
MATHYS 2006 435 24 92,4 89,2-95,5 - -
AnCA Fit (PROFEMUR
Z)
Wright Cremascoli
2002 420 29 94,7 92,6-96,9 91,7 88,2-95,3
CFP (CFP) Link 2001 396 12 97,6 96,1-99,2 95,3 92,1-98,6
REFLECTION
(SYNERGY)
Smith & Nephew
2000 359 13 97,0 94,8-99,1 93,1 89,2-97,0
MULLER (JVC)
Wright Cremascoli 2000 326 12 98,4 97,0-99,8 95,6 92,6-98,5
STANDARD CUP
(CLS)
SulzerCenterpulse
Zimmer
2000 322 10 98,7 97,5-100,0 96,7 94,6-98,9
DELTA PF (MODULUS
HIP SYSTEM) Lima 2003 320 8 97,2 95,3-99,1 97,2 95,3-99,1
CLS Zimmer (SL PLUS)
Smith & Nephew 2001 311 9 97,2 95,2-99,1 94,5 89,0-100,0
MULLER (MRL)
Wright Cremascoli 2000 305 15 96,5 94,4-98,6 94,8 92,1-97,5
TRIDENT (EXETER)
Howmedica 2002 305 2 99,3 98,4-100,0 99,3 98,4-100,3
Other (models < 300
cases) 2000 24.075 995 96,3 96,0-96,5 93,6 93,2-94,1
All models* 2000 55.186 2.076 96,5 96,3-96,7 94,0 93,7-94,3
*260 data missing
The marked dispersion of prosthesis types and the wide variability of the combinations
between acetabulum and stems enable the comparison of only some types of prosthesis.
To provide, anyway, an indication of the survival of the prosthesis types less represented in
data banks, they were grouped together to make a class of prostheses of which less than
300 were implanted over 13 years.
They were compared with the prosthesis types of which more than 300 were implanted
(those of the previous table), also grouped into a single class.
Survival is not adjusted for articular coupling.
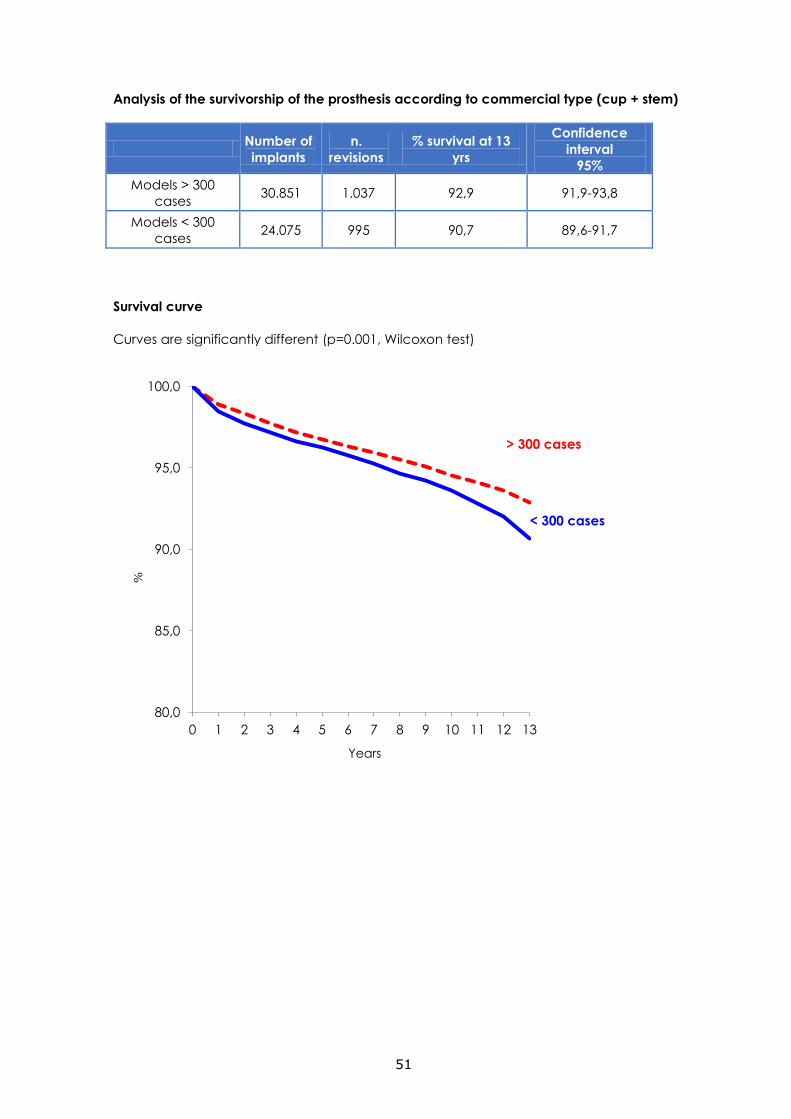
51
Analysis of the survivorship of the prosthesis according to commercial type (cup + stem)
Number of
implants
n.
revisions
% survival at 13
yrs
Confidence
interval
95%
Models > 300
cases 30.851 1.037 92,9 91,9-93,8
Models < 300
cases 24.075 995 90,7 89,6-91,7
Survival curve
Curves are significantly different (p=0.001, Wilcoxon test)
80,0
85,0
90,0
95,0
100,0
0 1 2 3 4 5 6 7 8 9 10 11 12 13
%
Years
> 300 cases
< 300 cases
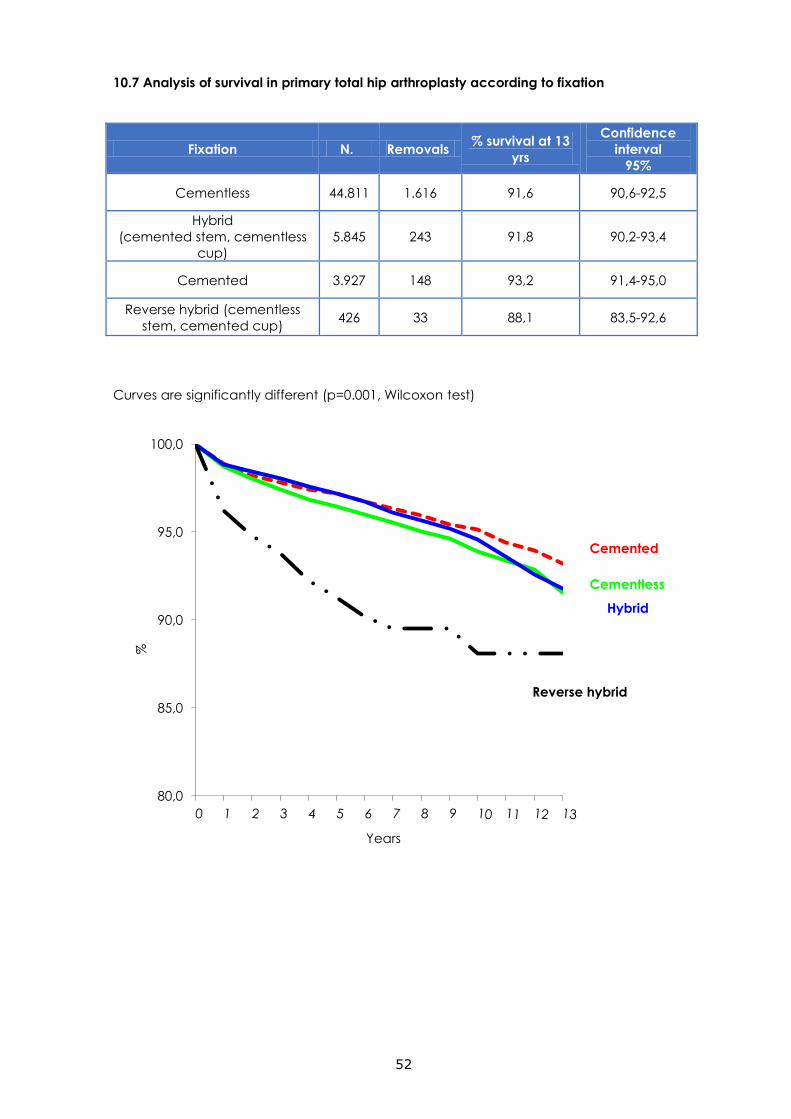
52
10.7 Analysis of survival in primary total hip arthroplasty according to fixation
Fixation N. Removals % survival at 13
yrs
Confidence
interval
95%
Cementless 44.811 1.616 91,6 90,6-92,5
Hybrid
(cemented stem, cementless
cup)
5.845 243 91,8 90,2-93,4
Cemented 3.927 148 93,2 91,4-95,0
Reverse hybrid (cementless
stem, cemented cup) 426 33 88,1 83,5-92,6
Curves are significantly different (p=0.001, Wilcoxon test)
80,0
85,0
90,0
95,0
100,0
%
Years
Cemented
Cementless
Reverse hybrid
Hybrid
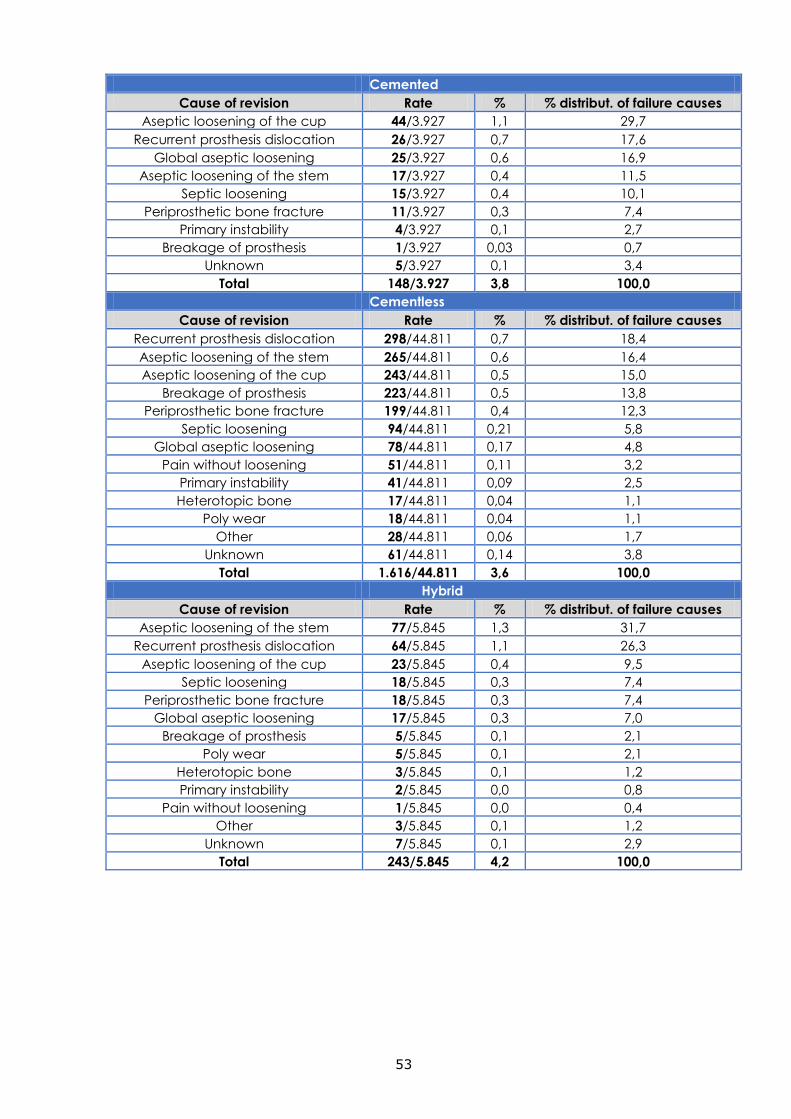
53
Cemented
Cause of revision Rate % % distribut. of failure causes
Aseptic loosening of the cup 44/3.927 1,1 29,7
Recurrent prosthesis dislocation 26/3.927 0,7 17,6
Global aseptic loosening 25/3.927 0,6 16,9
Aseptic loosening of the stem 17/3.927 0,4 11,5
Septic loosening 15/3.927 0,4 10,1
Periprosthetic bone fracture 11/3.927 0,3 7,4
Primary instability 4/3.927 0,1 2,7
Breakage of prosthesis 1/3.927 0,03 0,7
Unknown 5/3.927 0,1 3,4
Total 148/3.927 3,8 100,0
Cementless
Cause of revision Rate % % distribut. of failure causes
Recurrent prosthesis dislocation 298/44.811 0,7 18,4
Aseptic loosening of the stem 265/44.811 0,6 16,4
Aseptic loosening of the cup 243/44.811 0,5 15,0
Breakage of prosthesis 223/44.811 0,5 13,8
Periprosthetic bone fracture 199/44.811 0,4 12,3
Septic loosening 94/44.811 0,21 5,8
Global aseptic loosening 78/44.811 0,17 4,8
Pain without loosening 51/44.811 0,11 3,2
Primary instability 41/44.811 0,09 2,5
Heterotopic bone 17/44.811 0,04 1,1
Poly wear 18/44.811 0,04 1,1
Other 28/44.811 0,06 1,7
Unknown 61/44.811 0,14 3,8
Total 1.616/44.811 3,6 100,0
Hybrid
Cause of revision Rate % % distribut. of failure causes
Aseptic loosening of the stem 77/5.845 1,3 31,7
Recurrent prosthesis dislocation 64/5.845 1,1 26,3
Aseptic loosening of the cup 23/5.845 0,4 9,5
Septic loosening 18/5.845 0,3 7,4
Periprosthetic bone fracture 18/5.845 0,3 7,4
Global aseptic loosening 17/5.845 0,3 7,0
Breakage of prosthesis 5/5.845 0,1 2,1
Poly wear 5/5.845 0,1 2,1
Heterotopic bone 3/5.845 0,1 1,2
Primary instability 2/5.845 0,0 0,8
Pain without loosening 1/5.845 0,0 0,4
Other 3/5.845 0,1 1,2
Unknown 7/5.845 0,1 2,9
Total 243/5.845 4,2 100,0
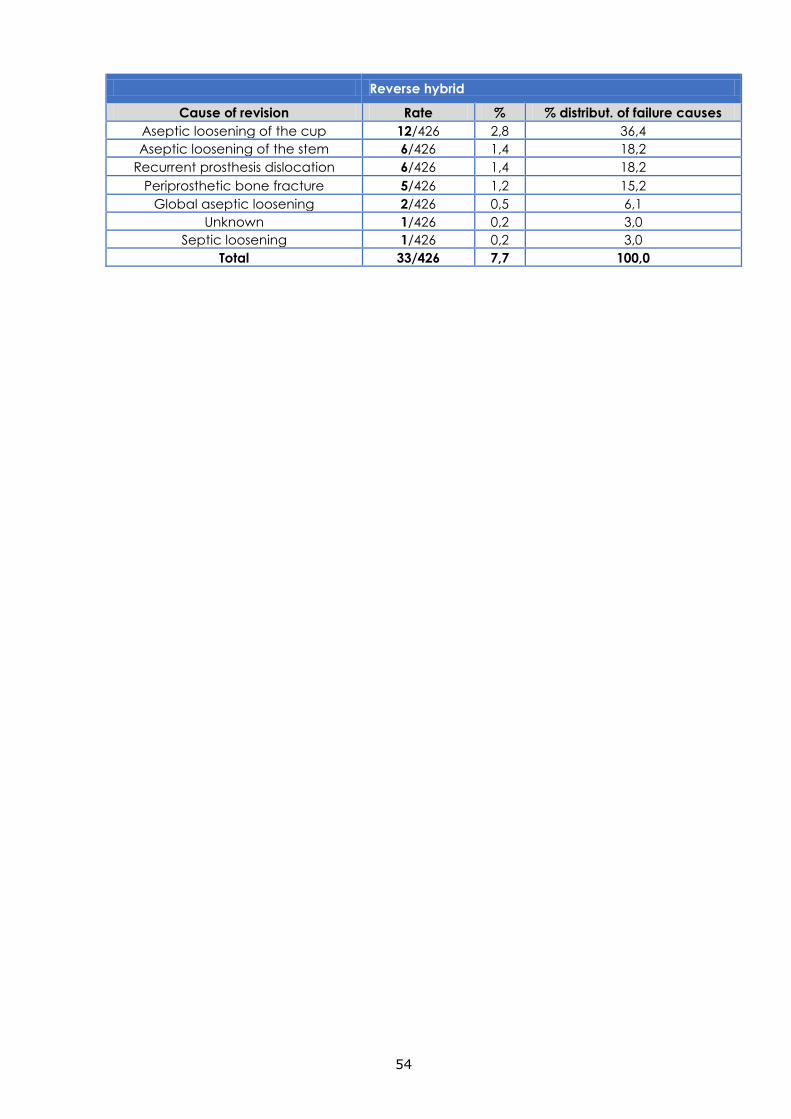
54
Reverse hybrid
Cause of revision Rate % % distribut. of failure causes
Aseptic loosening of the cup 12/426 2,8 36,4
Aseptic loosening of the stem 6/426 1,4 18,2
Recurrent prosthesis dislocation 6/426 1,4 18,2
Periprosthetic bone fracture 5/426 1,2 15,2
Global aseptic loosening 2/426 0,5 6,1
Unknown 1/426 0,2 3,0
Septic loosening 1/426 0,2 3,0
Total 33/426 7,7 100,0
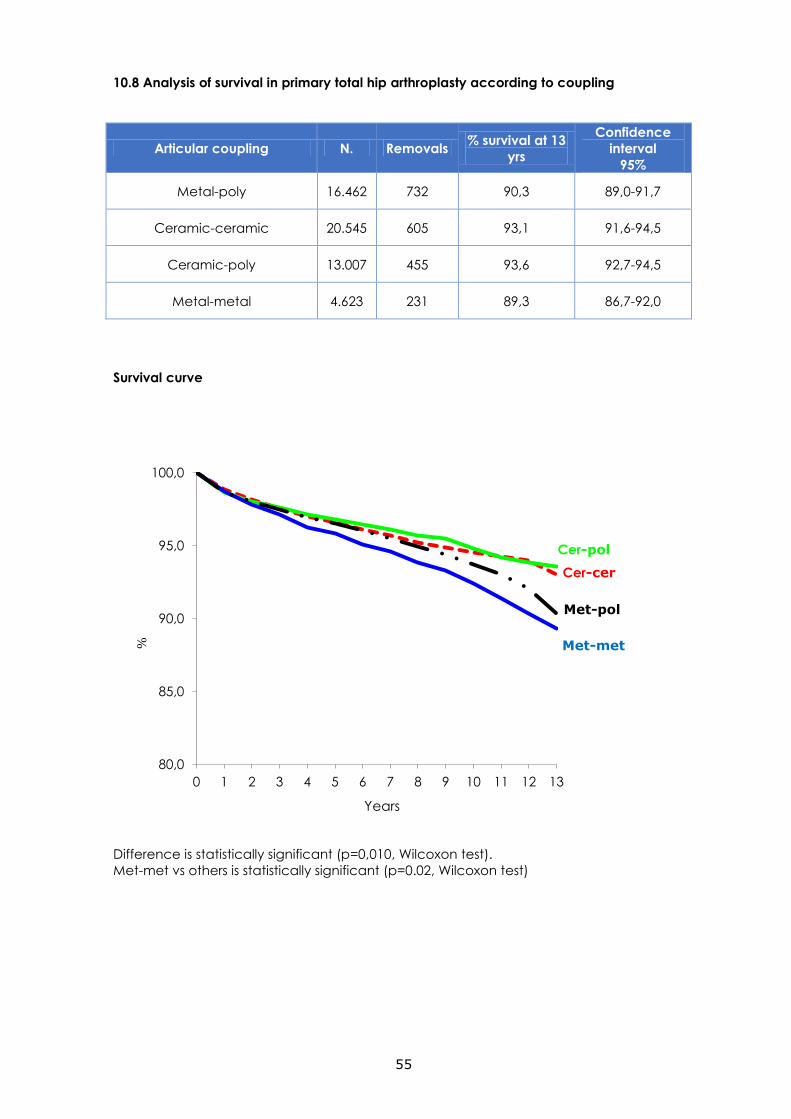
55
10.8 Analysis of survival in primary total hip arthroplasty according to coupling
Articular coupling N. Removals % survival at 13
yrs
Confidence
interval
95%
Metal-poly 16.462 732 90,3 89,0-91,7
Ceramic-ceramic 20.545 605 93,1 91,6-94,5
Ceramic-poly 13.007 455 93,6 92,7-94,5
Metal-metal 4.623 231 89,3 86,7-92,0
Survival curve
Difference is statistically significant (p=0,010, Wilcoxon test).
Met-met vs others is statistically significant (p=0.02, Wilcoxon test)
80,0
85,0
90,0
95,0
100,0
0 1 2 3 4 5 6 7 8 9 10 11 12 13
%
Years
Cer-cer
Cer-pol
Met-met
Met-pol
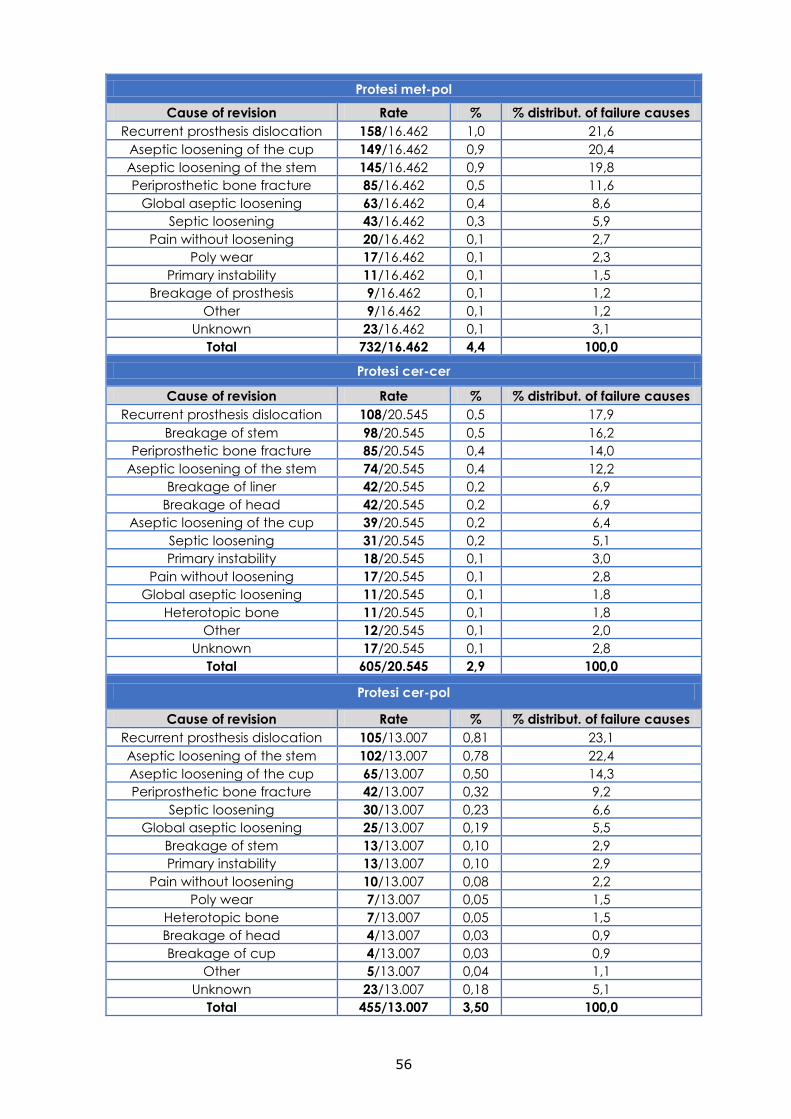
56
Protesi met-pol
Cause of revision Rate % % distribut. of failure causes
Recurrent prosthesis dislocation 158/16.462 1,0 21,6
Aseptic loosening of the cup 149/16.462 0,9 20,4
Aseptic loosening of the stem 145/16.462 0,9 19,8
Periprosthetic bone fracture 85/16.462 0,5 11,6
Global aseptic loosening 63/16.462 0,4 8,6
Septic loosening 43/16.462 0,3 5,9
Pain without loosening 20/16.462 0,1 2,7
Poly wear 17/16.462 0,1 2,3
Primary instability 11/16.462 0,1 1,5
Breakage of prosthesis 9/16.462 0,1 1,2
Other 9/16.462 0,1 1,2
Unknown 23/16.462 0,1 3,1
Total 732/16.462 4,4 100,0
Protesi cer-cer
Cause of revision Rate % % distribut. of failure causes
Recurrent prosthesis dislocation 108/20.545 0,5 17,9
Breakage of stem 98/20.545 0,5 16,2
Periprosthetic bone fracture 85/20.545 0,4 14,0
Aseptic loosening of the stem 74/20.545 0,4 12,2
Breakage of liner 42/20.545 0,2 6,9
Breakage of head 42/20.545 0,2 6,9
Aseptic loosening of the cup 39/20.545 0,2 6,4
Septic loosening 31/20.545 0,2 5,1
Primary instability 18/20.545 0,1 3,0
Pain without loosening 17/20.545 0,1 2,8
Global aseptic loosening 11/20.545 0,1 1,8
Heterotopic bone 11/20.545 0,1 1,8
Other 12/20.545 0,1 2,0
Unknown 17/20.545 0,1 2,8
Total 605/20.545 2,9 100,0
Protesi cer-pol
Cause of revision Rate % % distribut. of failure causes
Recurrent prosthesis dislocation 105/13.007 0,81 23,1
Aseptic loosening of the stem 102/13.007 0,78 22,4
Aseptic loosening of the cup 65/13.007 0,50 14,3
Periprosthetic bone fracture 42/13.007 0,32 9,2
Septic loosening 30/13.007 0,23 6,6
Global aseptic loosening 25/13.007 0,19 5,5
Breakage of stem 13/13.007 0,10 2,9
Primary instability 13/13.007 0,10 2,9
Pain without loosening 10/13.007 0,08 2,2
Poly wear 7/13.007 0,05 1,5
Heterotopic bone 7/13.007 0,05 1,5
Breakage of head 4/13.007 0,03 0,9
Breakage of cup 4/13.007 0,03 0,9
Other 5/13.007 0,04 1,1
Unknown 23/13.007 0,18 5,1
Total 455/13.007 3,50 100,0
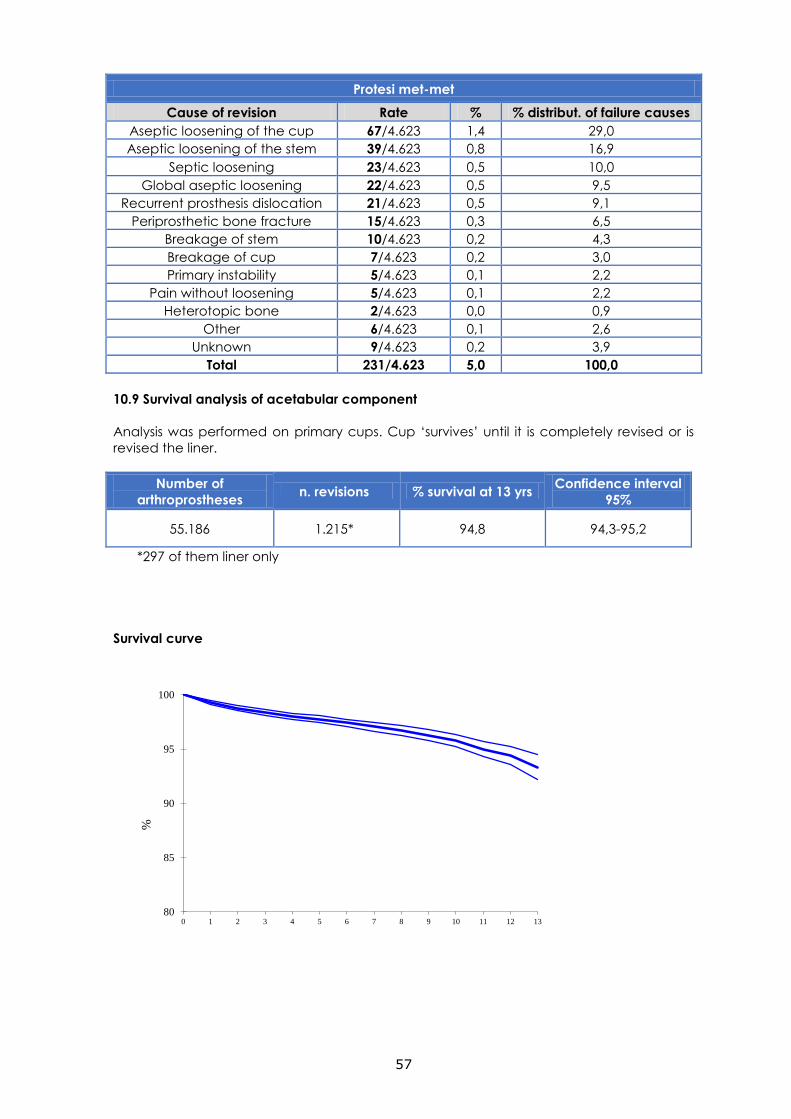
57
Protesi met-met
Cause of revision Rate % % distribut. of failure causes
Aseptic loosening of the cup 67/4.623 1,4 29,0
Aseptic loosening of the stem 39/4.623 0,8 16,9
Septic loosening 23/4.623 0,5 10,0
Global aseptic loosening 22/4.623 0,5 9,5
Recurrent prosthesis dislocation 21/4.623 0,5 9,1
Periprosthetic bone fracture 15/4.623 0,3 6,5
Breakage of stem 10/4.623 0,2 4,3
Breakage of cup 7/4.623 0,2 3,0
Primary instability 5/4.623 0,1 2,2
Pain without loosening 5/4.623 0,1 2,2
Heterotopic bone 2/4.623 0,0 0,9
Other 6/4.623 0,1 2,6
Unknown 9/4.623 0,2 3,9
Total 231/4.623 5,0 100,0
10.9 Survival analysis of acetabular component
Analysis was performed on primary cups. Cup ‘survives’ until it is completely revised or is
revised the liner.
Number of
arthroprostheses n. revisions % survival at 13 yrs
Confidence interval
95%
55.186 1.215* 94,8 94,3-95,2
*297 of them liner only
Survival curve
80
85
90
95
100
0 1 2 3 4 5 6 7 8 9 10 11 12 13
%
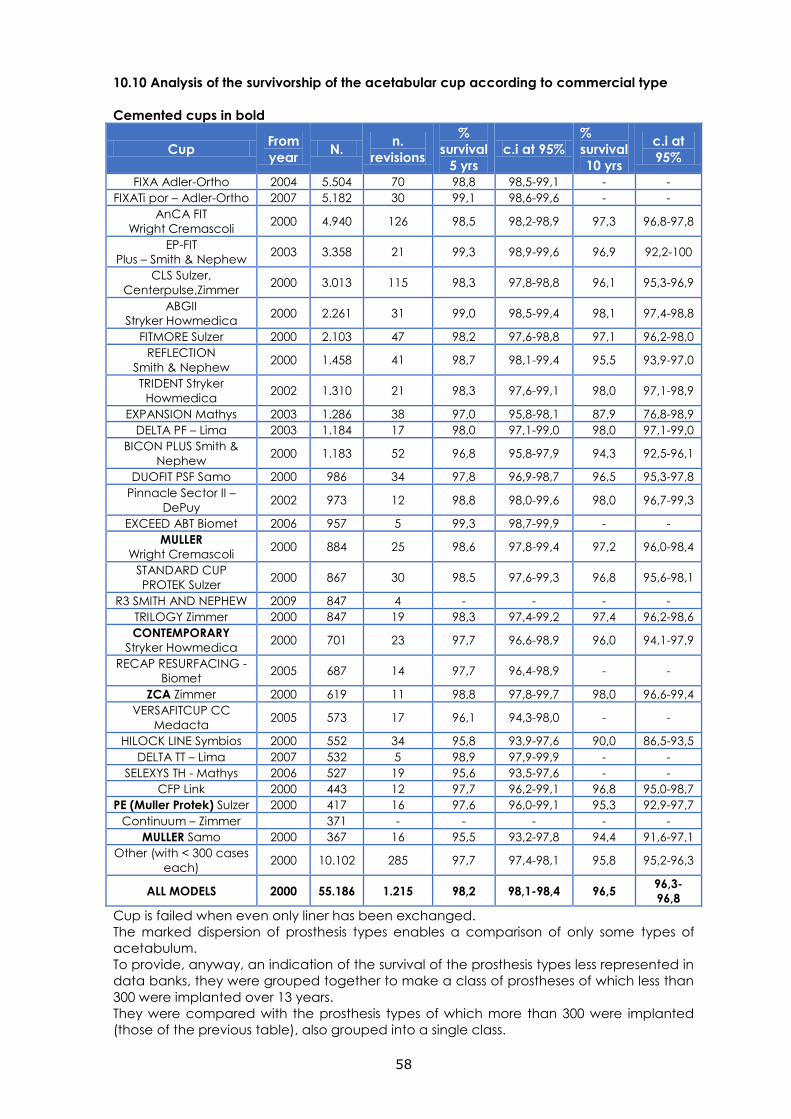
58
10.10 Analysis of the survivorship of the acetabular cup according to commercial type
Cemented cups in bold
Cup From
year N.
n.
revisions
%
survival
5 yrs
c.i at 95%
%
survival
10 yrs
c.i at
95%
FIXA Adler-Ortho 2004 5.504 70 98,8 98,5-99,1 - -
FIXATi por – Adler-Ortho 2007 5.182 30 99,1 98,6-99,6 - -
AnCA FIT
Wright Cremascoli 2000 4.940 126 98,5 98,2-98,9 97,3 96,8-97,8
EP-FIT
Plus – Smith & Nephew 2003 3.358 21 99,3 98,9-99,6 96,9 92,2-100
CLS Sulzer,
Centerpulse,Zimmer 2000 3.013 115 98,3 97,8-98,8 96,1 95,3-96,9
ABGII
Stryker Howmedica 2000 2.261 31 99,0 98,5-99,4 98,1 97,4-98,8
FITMORE Sulzer 2000 2.103 47 98,2 97,6-98,8 97,1 96,2-98,0
REFLECTION
Smith & Nephew 2000 1.458 41 98,7 98,1-99,4 95,5 93,9-97,0
TRIDENT Stryker
Howmedica 2002 1.310 21 98,3 97,6-99,1 98,0 97,1-98,9
EXPANSION Mathys 2003 1.286 38 97,0 95,8-98,1 87,9 76,8-98,9
DELTA PF – Lima 2003 1.184 17 98,0 97,1-99,0 98,0 97,1-99,0
BICON PLUS Smith &
Nephew 2000 1.183 52 96,8 95,8-97,9 94,3 92,5-96,1
DUOFIT PSF Samo 2000 986 34 97,8 96,9-98,7 96,5 95,3-97,8
Pinnacle Sector II –
DePuy 2002 973 12 98,8 98,0-99,6 98,0 96,7-99,3
EXCEED ABT Biomet 2006 957 5 99,3 98,7-99,9 - -
MULLER
Wright Cremascoli 2000 884 25 98,6 97,8-99,4 97,2 96,0-98,4
STANDARD CUP
PROTEK Sulzer 2000 867 30 98,5 97,6-99,3 96,8 95,6-98,1
R3 SMITH AND NEPHEW 2009 847 4 - - - -
TRILOGY Zimmer 2000 847 19 98,3 97,4-99,2 97,4 96,2-98,6
CONTEMPORARY
Stryker Howmedica 2000 701 23 97,7 96,6-98,9 96,0 94,1-97,9
RECAP RESURFACING -
Biomet 2005 687 14 97,7 96,4-98,9 - -
ZCA Zimmer 2000 619 11 98,8 97,8-99,7 98,0 96,6-99,4
VERSAFITCUP CC
Medacta 2005 573 17 96,1 94,3-98,0 - -
HILOCK LINE Symbios 2000 552 34 95,8 93,9-97,6 90,0 86,5-93,5
DELTA TT – Lima 2007 532 5 98,9 97,9-99,9 - -
SELEXYS TH - Mathys 2006 527 19 95,6 93,5-97,6 - -
CFP Link 2000 443 12 97,7 96,2-99,1 96,8 95,0-98,7
PE (Muller Protek) Sulzer 2000 417 16 97,6 96,0-99,1 95,3 92,9-97,7
Continuum – Zimmer 371 - - - - -
MULLER Samo 2000 367 16 95,5 93,2-97,8 94,4 91,6-97,1
Other (with < 300 cases
each) 2000 10.102 285 97,7 97,4-98,1 95,8 95,2-96,3
ALL MODELS 2000 55.186 1.215 98,2 98,1-98,4 96,5 96,3-
96,8
Cup is failed when even only liner has been exchanged.
The marked dispersion of prosthesis types enables a comparison of only some types of
acetabulum.
To provide, anyway, an indication of the survival of the prosthesis types less represented in
data banks, they were grouped together to make a class of prostheses of which less than
300 were implanted over 13 years.
They were compared with the prosthesis types of which more than 300 were implanted
(those of the previous table), also grouped into a single class.
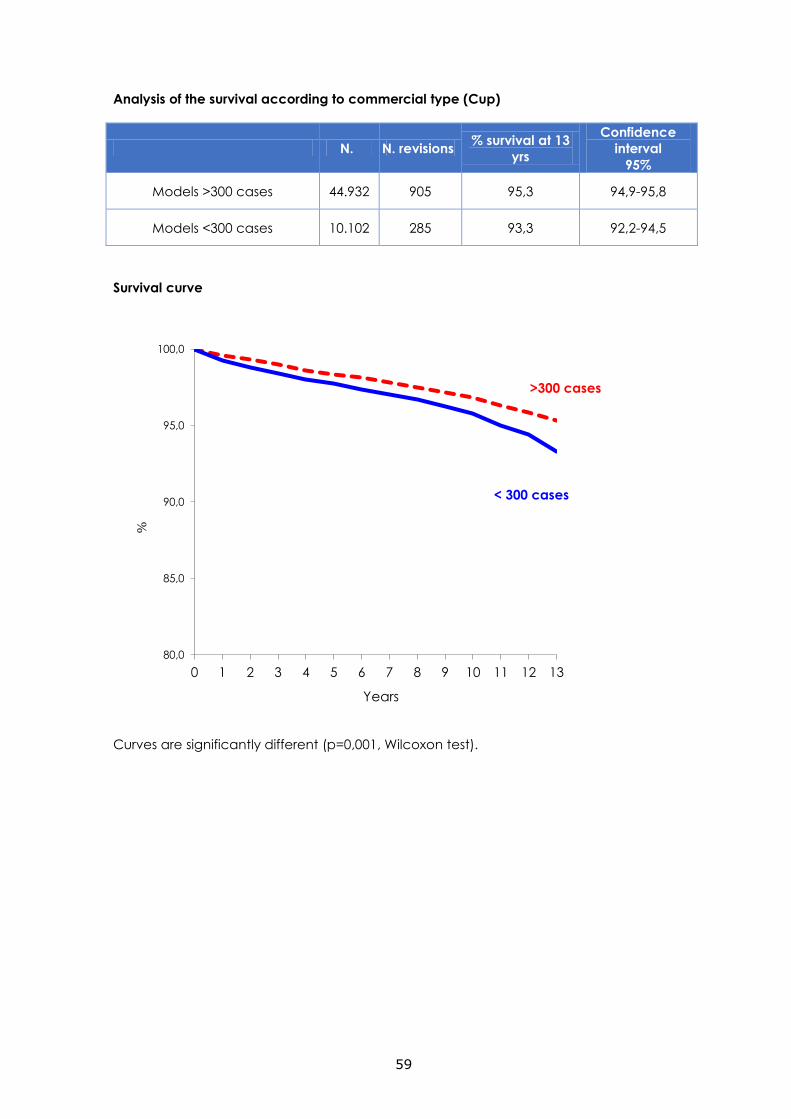
59
Analysis of the survival according to commercial type (Cup)
N. N. revisions % survival at 13
yrs
Confidence
interval
95%
Models >300 cases 44.932 905 95,3 94,9-95,8
Models <300 cases 10.102 285 93,3 92,2-94,5
Survival curve
Curves are significantly different (p=0,001, Wilcoxon test).
80,0
85,0
90,0
95,0
100,0
0 1 2 3 4 5 6 7 8 9 10 11 12 13
%
Years
>300 cases
< 300 cases
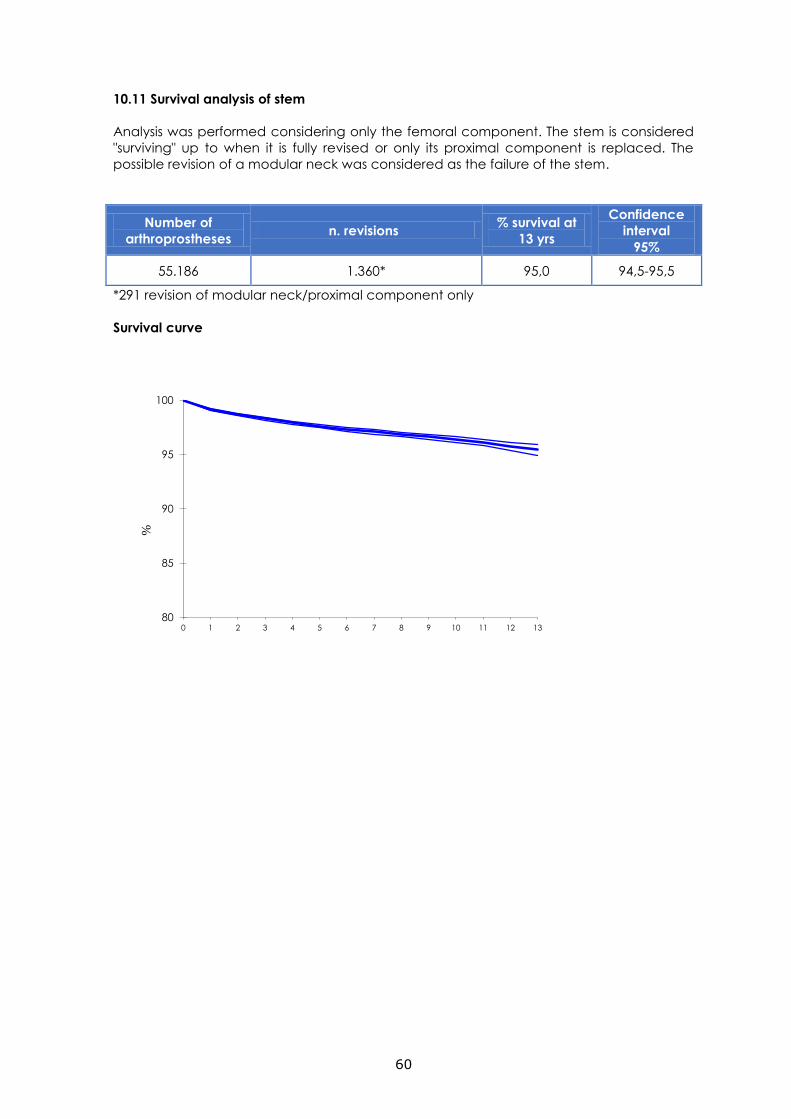
60
10.11 Survival analysis of stem
Analysis was performed considering only the femoral component. The stem is considered
"surviving" up to when it is fully revised or only its proximal component is replaced. The
possible revision of a modular neck was considered as the failure of the stem.
Number of
arthroprostheses n. revisions
% survival at
13 yrs
Confidence
interval
95%
55.186 1.360* 95,0 94,5-95,5
*291 revision of modular neck/proximal component only
Survival curve
80
85
90
95
100
0 1 2 3 4 5 6 7 8 9 10 11 12 13
%
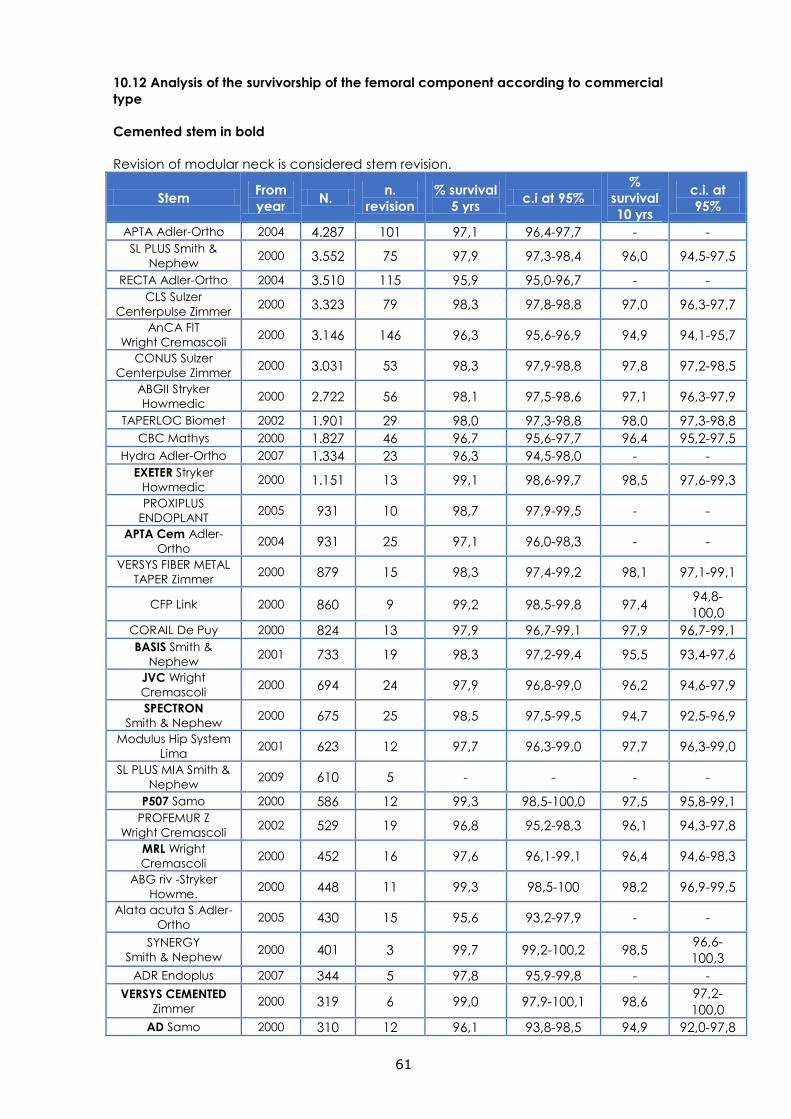
61
10.12 Analysis of the survivorship of the femoral component according to commercial
type
Cemented stem in bold
Revision of modular neck is considered stem revision.
Stem From
year N.
n.
revision
% survival
5 yrs c.i at 95%
%
survival
10 yrs
c.i. at
95%
APTA Adler-Ortho 2004 4.287 101 97,1 96,4-97,7 - -
SL PLUS Smith &
Nephew 2000 3.552 75 97,9 97,3-98,4 96,0 94,5-97,5
RECTA Adler-Ortho 2004 3.510 115 95,9 95,0-96,7 - -
CLS Sulzer
Centerpulse Zimmer 2000 3.323 79 98,3 97,8-98,8 97,0 96,3-97,7
AnCA FIT
Wright Cremascoli 2000 3.146 146 96,3 95,6-96,9 94,9 94,1-95,7
CONUS Sulzer
Centerpulse Zimmer 2000 3.031 53 98,3 97,9-98,8 97,8 97,2-98,5
ABGII Stryker
Howmedic 2000 2.722 56 98,1 97,5-98,6 97,1 96,3-97,9
TAPERLOC Biomet 2002 1.901 29 98,0 97,3-98,8 98,0 97,3-98,8
CBC Mathys 2000 1.827 46 96,7 95,6-97,7 96,4 95,2-97,5
Hydra Adler-Ortho 2007 1.334 23 96,3 94,5-98,0 - -
EXETER Stryker
Howmedic 2000 1.151 13 99,1 98,6-99,7 98,5 97,6-99,3
PROXIPLUS
ENDOPLANT 2005 931 10 98,7 97,9-99,5 - -
APTA Cem Adler-
Ortho 2004 931 25 97,1 96,0-98,3 - -
VERSYS FIBER METAL
TAPER Zimmer 2000 879 15 98,3 97,4-99,2 98,1 97,1-99,1
CFP Link 2000 860 9 99,2 98,5-99,8 97,4 94,8-
100,0
CORAIL De Puy 2000 824 13 97,9 96,7-99,1 97,9 96,7-99,1
BASIS Smith &
Nephew 2001 733 19 98,3 97,2-99,4 95,5 93,4-97,6
JVC Wright
Cremascoli 2000 694 24 97,9 96,8-99,0 96,2 94,6-97,9
SPECTRON
Smith & Nephew 2000 675 25 98,5 97,5-99,5 94,7 92,5-96,9
Modulus Hip System
Lima 2001 623 12 97,7 96,3-99,0 97,7 96,3-99,0
SL PLUS MIA Smith &
Nephew 2009 610 5 - - - -
P507 Samo 2000 586 12 99,3 98,5-100,0 97,5 95,8-99,1
PROFEMUR Z
Wright Cremascoli 2002 529 19 96,8 95,2-98,3 96,1 94,3-97,8
MRL Wright
Cremascoli 2000 452 16 97,6 96,1-99,1 96,4 94,6-98,3
ABG riv -Stryker
Howme. 2000 448 11 99,3 98,5-100 98,2 96,9-99,5
Alata acuta S Adler-
Ortho 2005 430 15 95,6 93,2-97,9 - -
SYNERGY
Smith & Nephew 2000 401 3 99,7 99,2-100,2 98,5
96,6-
100,3
ADR Endoplus 2007 344 5 97,8 95,9-99,8 - -
VERSYS CEMENTED
Zimmer 2000 319 6 99,0 97,9-100,1 98,6
97,2-
100,0
AD Samo 2000 310 12 96,1 93,8-98,5 94,9 92,0-97,8
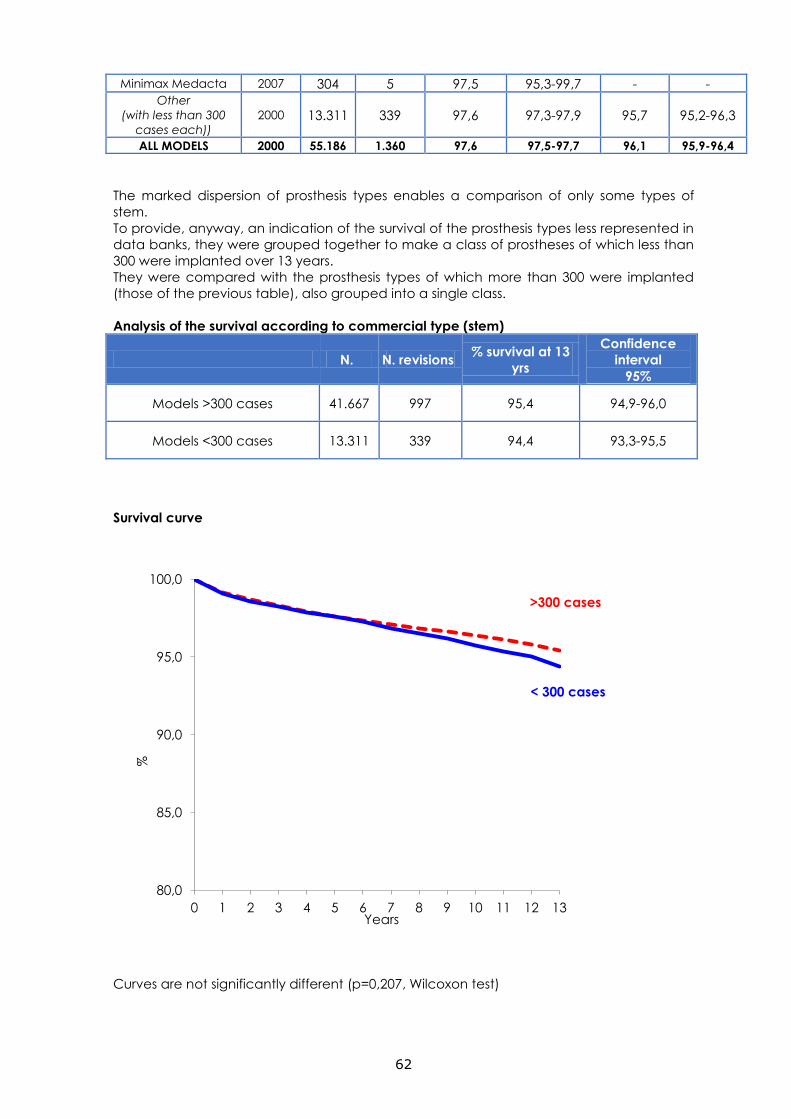
62
Minimax Medacta 2007 304 5 97,5 95,3-99,7 - -
Other
(with less than 300
cases each))
2000 13.311 339 97,6 97,3-97,9 95,7 95,2-96,3
ALL MODELS 2000 55.186 1.360 97,6 97,5-97,7 96,1 95,9-96,4
The marked dispersion of prosthesis types enables a comparison of only some types of
stem.
To provide, anyway, an indication of the survival of the prosthesis types less represented in
data banks, they were grouped together to make a class of prostheses of which less than
300 were implanted over 13 years.
They were compared with the prosthesis types of which more than 300 were implanted
(those of the previous table), also grouped into a single class.
Analysis of the survival according to commercial type (stem)
N. N. revisions % survival at 13
yrs
Confidence
interval
95%
Models >300 cases 41.667 997 95,4 94,9-96,0
Models <300 cases 13.311 339 94,4 93,3-95,5
Survival curve
Curves are not significantly different (p=0,207, Wilcoxon test)
80,0
85,0
90,0
95,0
100,0
0 1 2 3 4 5 6 7 8 9 10 11 12 13
%
Years
>300 cases
< 300 cases
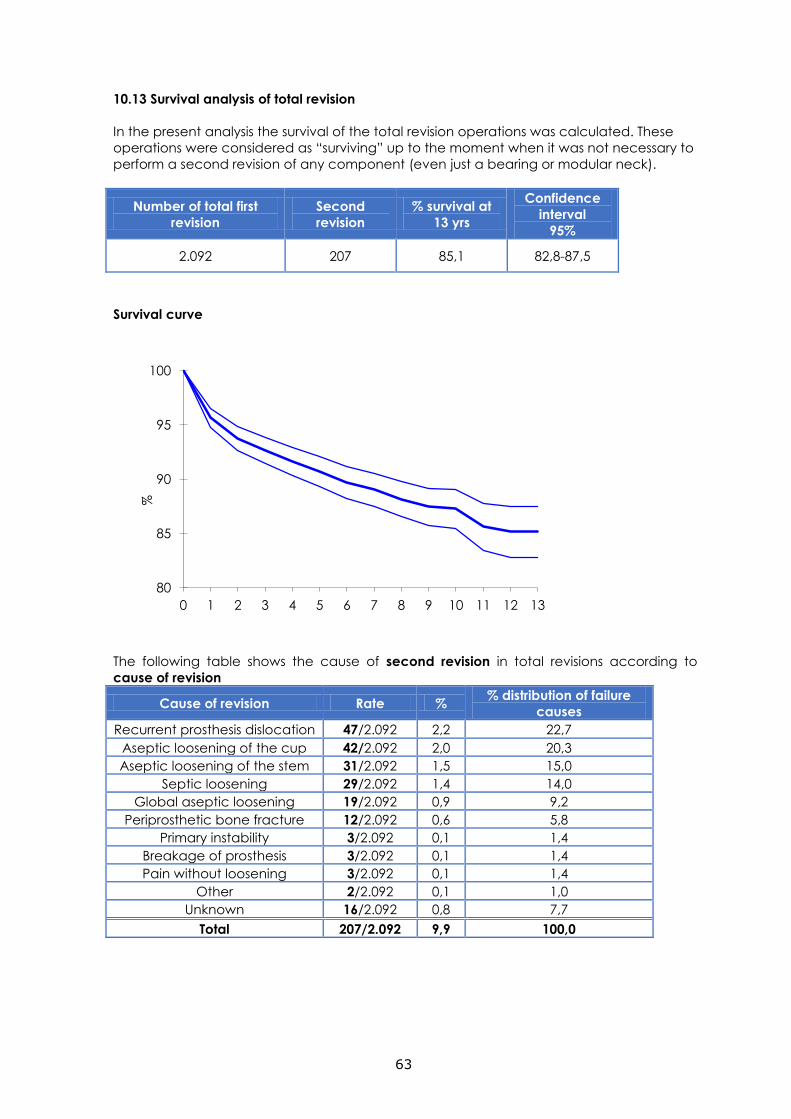
63
10.13 Survival analysis of total revision
In the present analysis the survival of the total revision operations was calculated. These
operations were considered as “surviving” up to the moment when it was not necessary to
perform a second revision of any component (even just a bearing or modular neck).
Number of total first
revision
Second
revision
% survival at
13 yrs
Confidence
interval
95%
2.092 207 85,1 82,8-87,5
Survival curve
The following table shows the cause of second revision in total revisions according to
cause of revision
Cause of revision Rate % % distribution of failure
causes
Recurrent prosthesis dislocation 47/2.092 2,2 22,7
Aseptic loosening of the cup 42/2.092 2,0 20,3
Aseptic loosening of the stem 31/2.092 1,5 15,0
Septic loosening 29/2.092 1,4 14,0
Global aseptic loosening 19/2.092 0,9 9,2
Periprosthetic bone fracture 12/2.092 0,6 5,8
Primary instability 3/2.092 0,1 1,4
Breakage of prosthesis 3/2.092 0,1 1,4
Pain without loosening 3/2.092 0,1 1,4
Other 2/2.092 0,1 1,0
Unknown 16/2.092 0,8 7,7
Total 207/2.092 9,9 100,0
80
85
90
95
100
0 1 2 3 4 5 6 7 8 9 10 11 12 13
%
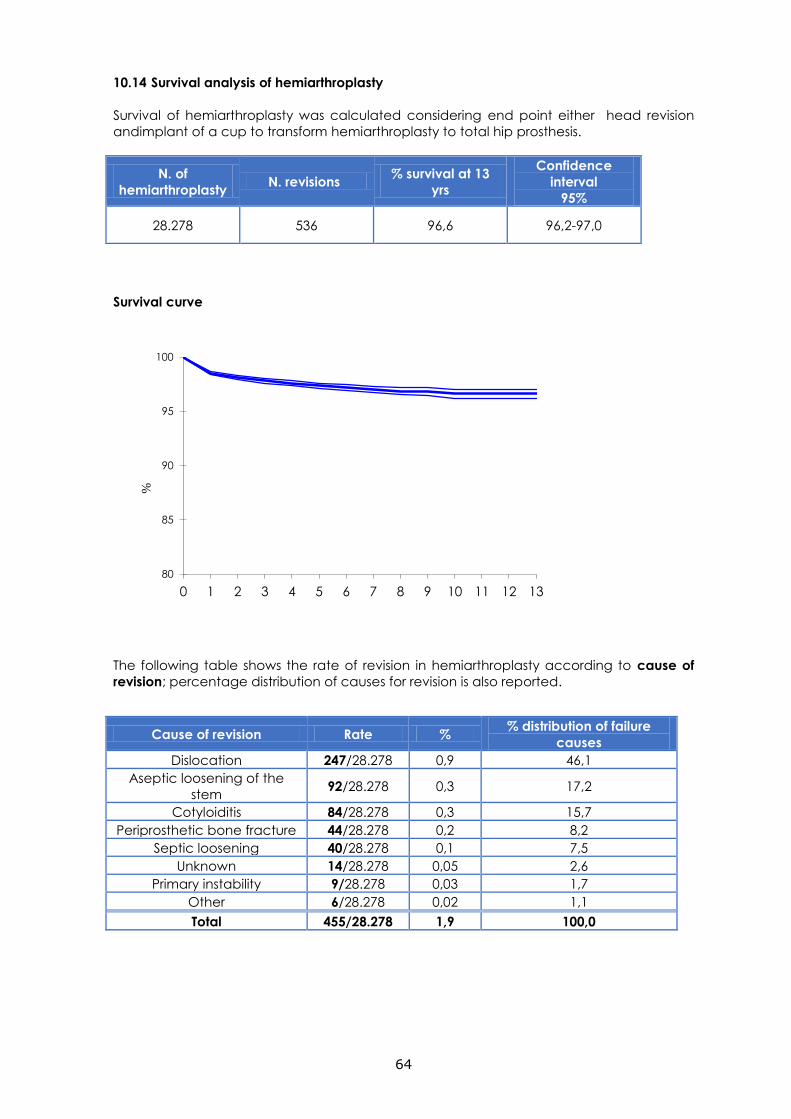
64
10.14 Survival analysis of hemiarthroplasty
Survival of hemiarthroplasty was calculated considering end point either head revision
andimplant of a cup to transform hemiarthroplasty to total hip prosthesis.
N. of
hemiarthroplasty N. revisions
% survival at 13
yrs
Confidence
interval
95%
28.278 536 96,6 96,2-97,0
Survival curve
The following table shows the rate of revision in hemiarthroplasty according to cause of
revision; percentage distribution of causes for revision is also reported.
Cause of revision Rate % % distribution of failure
causes
Dislocation 247/28.278 0,9 46,1
Aseptic loosening of the
stem 92/28.278 0,3 17,2
Cotyloiditis 84/28.278 0,3 15,7
Periprosthetic bone fracture 44/28.278 0,2 8,2
Septic loosening 40/28.278 0,1 7,5
Unknown 14/28.278 0,05 2,6
Primary instability 9/28.278 0,03 1,7
Other 6/28.278 0,02 1,1
Total 455/28.278 1,9 100,0
80
85
90
95
100
0 1 2 3 4 5 6 7 8 9 10 11 12 13
%
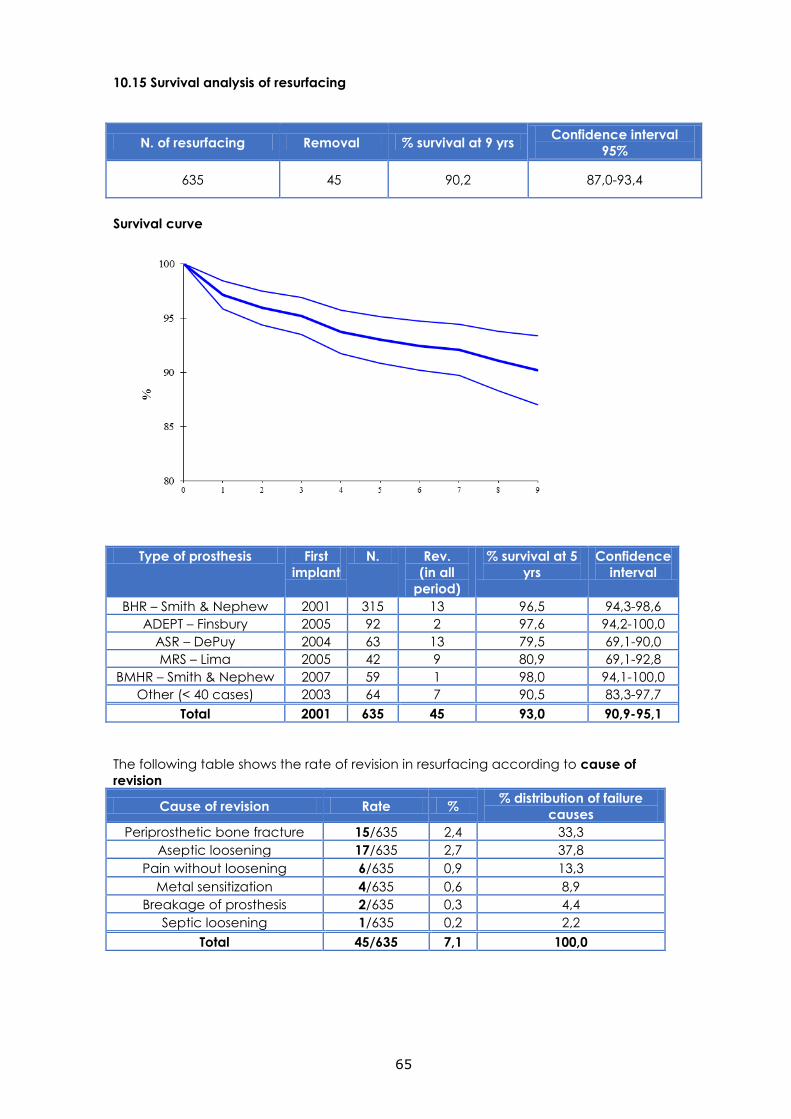
65
10.15 Survival analysis of resurfacing
N. of resurfacing Removal % survival at 9 yrs Confidence interval
95%
635 45 90,2 87,0-93,4
Survival curve
Type of prosthesis First
implant
N. Rev.
(in all
period)
% survival at 5
yrs
Confidence
interval
BHR – Smith & Nephew 2001 315 13 96,5 94,3-98,6
ADEPT – Finsbury 2005 92 2 97,6 94,2-100,0
ASR – DePuy 2004 63 13 79,5 69,1-90,0
MRS – Lima 2005 42 9 80,9 69,1-92,8
BMHR – Smith & Nephew 2007 59 1 98,0 94,1-100,0
Other (< 40 cases) 2003 64 7 90,5 83,3-97,7
Total 2001 635 45 93,0 90,9-95,1
The following table shows the rate of revision in resurfacing according to cause of
revision
Cause of revision Rate % % distribution of failure
causes
Periprosthetic bone fracture 15/635 2,4 33,3
Aseptic loosening 17/635 2,7 37,8
Pain without loosening 6/635 0,9 13,3
Metal sensitization 4/635 0,6 8,9
Breakage of prosthesis 2/635 0,3 4,4
Septic loosening 1/635 0,2 2,2
Total 45/635 7,1 100,0

66
PART TWO: KNEE PROSTHESIS
July 2000 – December 2012
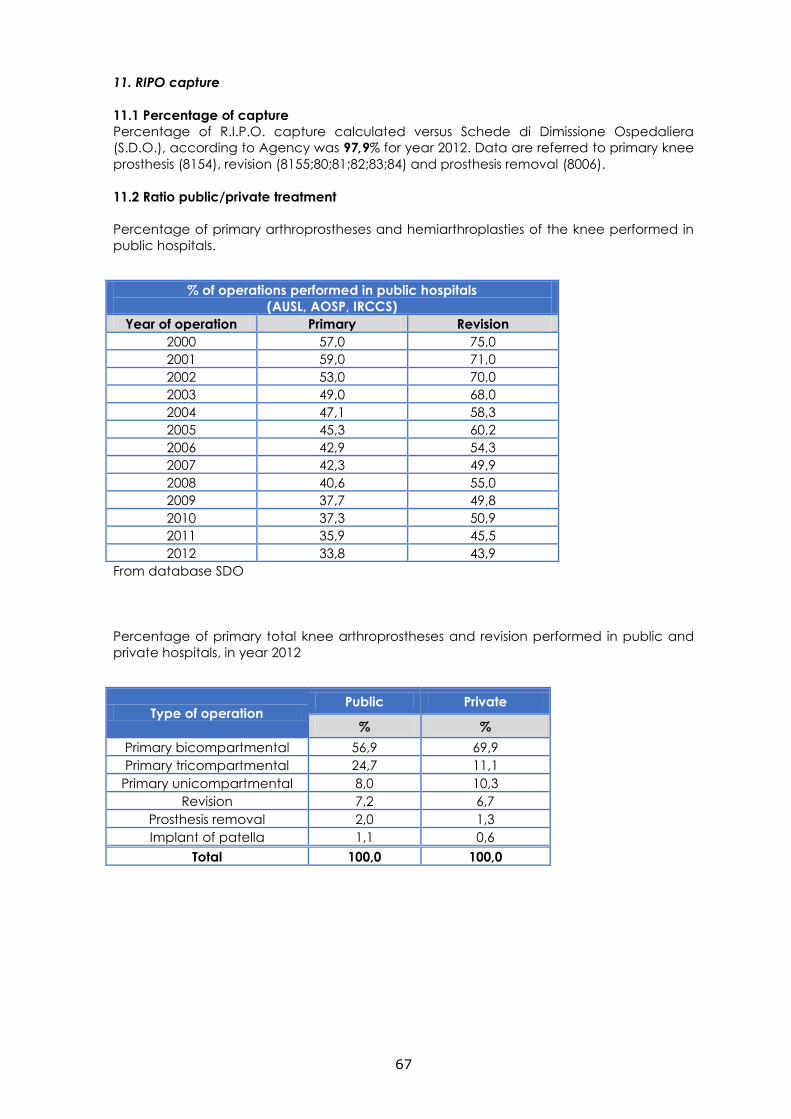
67
11. RIPO capture
11.1 Percentage of capture
Percentage of R.I.P.O. capture calculated versus Schede di Dimissione Ospedaliera
(S.D.O.), according to Agency was 97,9% for year 2012. Data are referred to primary knee
prosthesis (8154), revision (8155;80;81;82;83;84) and prosthesis removal (8006).
11.2 Ratio public/private treatment
Percentage of primary arthroprostheses and hemiarthroplasties of the knee performed in
public hospitals.
% of operations performed in public hospitals
(AUSL, AOSP, IRCCS)
Year of operation Primary Revision
2000 57,0 75,0
2001 59,0 71,0
2002 53,0 70,0
2003 49,0 68,0
2004 47,1 58,3
2005 45,3 60,2
2006 42,9 54,3
2007 42,3 49,9
2008 40,6 55,0
2009 37,7 49,8
2010 37,3 50,9
2011 35,9 45,5
2012 33,8 43,9
From database SDO
Percentage of primary total knee arthroprostheses and revision performed in public and
private hospitals, in year 2012
Type of operation Public Private
% %
Primary bicompartmental 56,9 69,9
Primary tricompartmental 24,7 11,1
Primary unicompartmental 8,0 10,3
Revision 7,2 6,7
Prosthesis removal 2,0 1,3
Implant of patella 1,1 0,6
Total 100,0 100,0
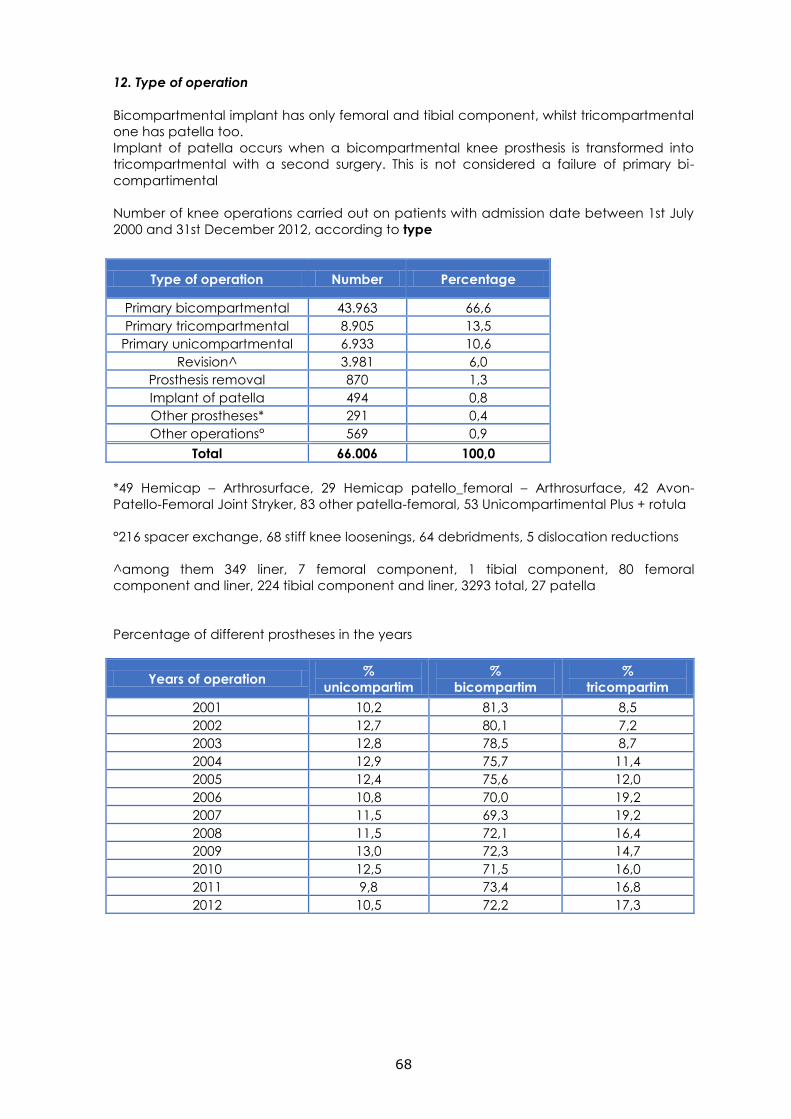
68
12. Type of operation
Bicompartmental implant has only femoral and tibial component, whilst tricompartmental
one has patella too.
Implant of patella occurs when a bicompartmental knee prosthesis is transformed into
tricompartmental with a second surgery. This is not considered a failure of primary bi-
compartimental
Number of knee operations carried out on patients with admission date between 1st July
2000 and 31st December 2012, according to type
Type of operation Number Percentage
Primary bicompartmental 43.963 66,6
Primary tricompartmental 8.905 13,5
Primary unicompartmental 6.933 10,6
Revision^ 3.981 6,0
Prosthesis removal 870 1,3
Implant of patella 494 0,8
Other prostheses* 291 0,4
Other operations° 569 0,9
Total 66.006 100,0
*49 Hemicap – Arthrosurface, 29 Hemicap patello_femoral – Arthrosurface, 42 Avon-
Patello-Femoral Joint Stryker, 83 other patella-femoral, 53 Unicompartimental Plus + rotula
°216 spacer exchange, 68 stiff knee loosenings, 64 debridments, 5 dislocation reductions
^among them 349 liner, 7 femoral component, 1 tibial component, 80 femoral
component and liner, 224 tibial component and liner, 3293 total, 27 patella
Percentage of different prostheses in the years
Years of operation %
unicompartim
%
bicompartim
%
tricompartim
2001 10,2 81,3 8,5
2002 12,7 80,1 7,2
2003 12,8 78,5 8,7
2004 12,9 75,7 11,4
2005 12,4 75,6 12,0
2006 10,8 70,0 19,2
2007 11,5 69,3 19,2
2008 11,5 72,1 16,4
2009 13,0 72,3 14,7
2010 12,5 71,5 16,0
2011 9,8 73,4 16,8
2012 10,5 72,2 17,3
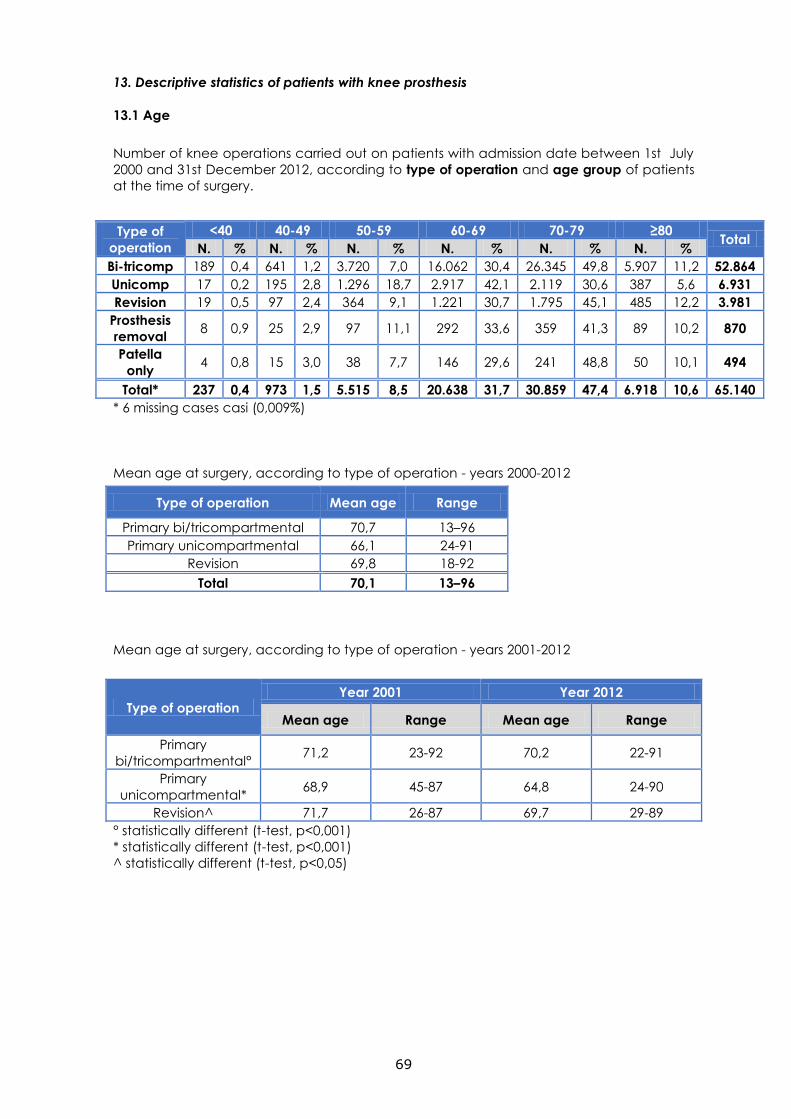
69
13. Descriptive statistics of patients with knee prosthesis
13.1 Age
Number of knee operations carried out on patients with admission date between 1st July
2000 and 31st December 2012, according to type of operation and age group of patients
at the time of surgery.
Type of
operation
<40 40-49 50-59 60-69 70-79 ≥80 Total
N. % N. % N. % N. % N. % N. %
Bi-tricomp 189 0,4 641 1,2 3.720 7,0 16.062 30,4 26.345 49,8 5.907 11,2 52.864
Unicomp 17 0,2 195 2,8 1.296 18,7 2.917 42,1 2.119 30,6 387 5,6 6.931
Revision 19 0,5 97 2,4 364 9,1 1.221 30,7 1.795 45,1 485 12,2 3.981
Prosthesis
removal 8 0,9 25 2,9 97 11,1 292 33,6 359 41,3 89 10,2 870
Patella
only 4 0,8 15 3,0 38 7,7 146 29,6 241 48,8 50 10,1 494
Total* 237 0,4 973 1,5 5.515 8,5 20.638 31,7 30.859 47,4 6.918 10,6 65.140
* 6 missing cases casi (0,009%)
Mean age at surgery, according to type of operation - years 2000-2012
Type of operation Mean age Range
Primary bi/tricompartmental 70,7 13–96
Primary unicompartmental 66,1 24-91
Revision 69,8 18-92
Total 70,1 13–96
Mean age at surgery, according to type of operation - years 2001-2012
Type of operation Year 2001 Year 2012
Mean age Range Mean age Range
Primary
bi/tricompartmental° 71,2 23-92 70,2 22-91
Primary
unicompartmental* 68,9 45-87 64,8 24-90
Revision^ 71,7 26-87 69,7 29-89
° statistically different (t-test, p<0,001)
* statistically different (t-test, p<0,001)
^ statistically different (t-test, p<0,05)
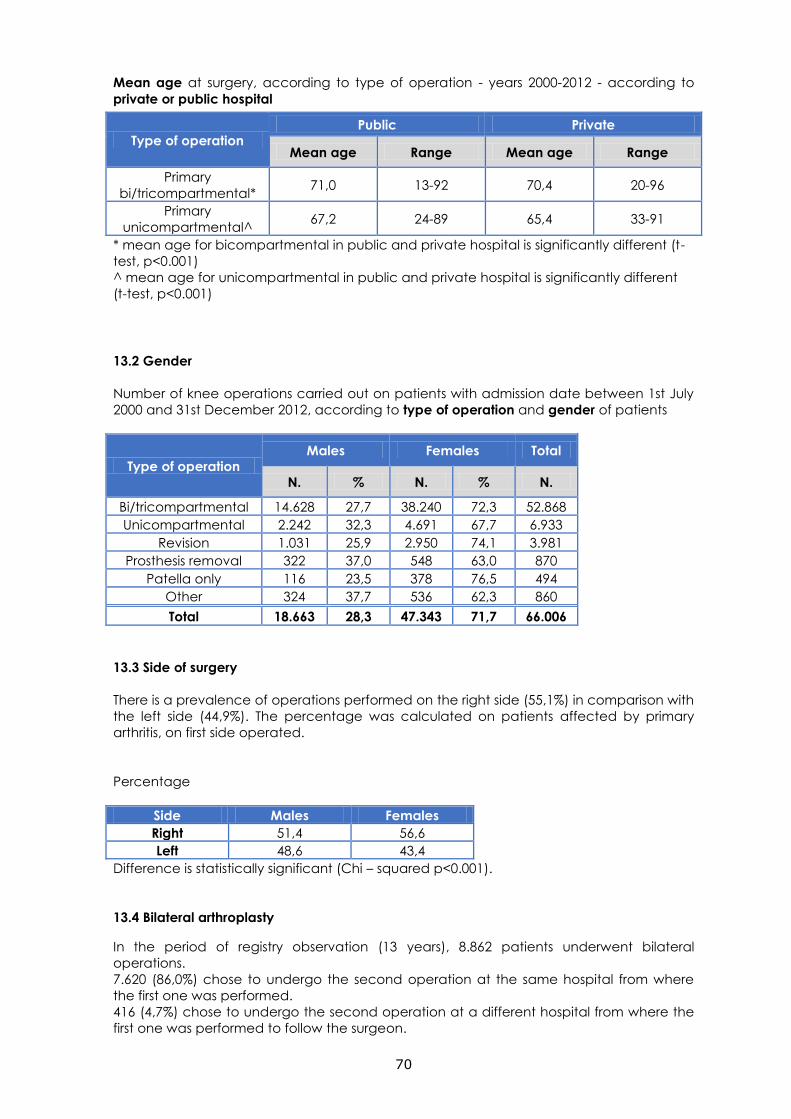
70
Mean age at surgery, according to type of operation - years 2000-2012 - according to
private or public hospital
Type of operation Public Private
Mean age Range Mean age Range
Primary
bi/tricompartmental* 71,0 13-92 70,4 20-96
Primary
unicompartmental^ 67,2 24-89 65,4 33-91
* mean age for bicompartmental in public and private hospital is significantly different (t-
test, p<0.001)
^ mean age for unicompartmental in public and private hospital is significantly different
(t-test, p<0.001)
13.2 Gender
Number of knee operations carried out on patients with admission date between 1st July
2000 and 31st December 2012, according to type of operation and gender of patients
Type of operation Males Females Total
N. % N. % N.
Bi/tricompartmental 14.628 27,7 38.240 72,3 52.868
Unicompartmental 2.242 32,3 4.691 67,7 6.933
Revision 1.031 25,9 2.950 74,1 3.981
Prosthesis removal 322 37,0 548 63,0 870
Patella only 116 23,5 378 76,5 494
Other 324 37,7 536 62,3 860
Total 18.663 28,3 47.343 71,7 66.006
13.3 Side of surgery
There is a prevalence of operations performed on the right side (55,1%) in comparison with
the left side (44,9%). The percentage was calculated on patients affected by primary
arthritis, on first side operated.
Percentage
Side Males Females
Right 51,4 56,6
Left 48,6 43,4
Difference is statistically significant (Chi – squared p<0.001).
13.4 Bilateral arthroplasty
In the period of registry observation (13 years), 8.862 patients underwent bilateral
operations.
7.620 (86,0%) chose to undergo the second operation at the same hospital from where
the first one was performed.
416 (4,7%) chose to undergo the second operation at a different hospital from where the
first one was performed to follow the surgeon.
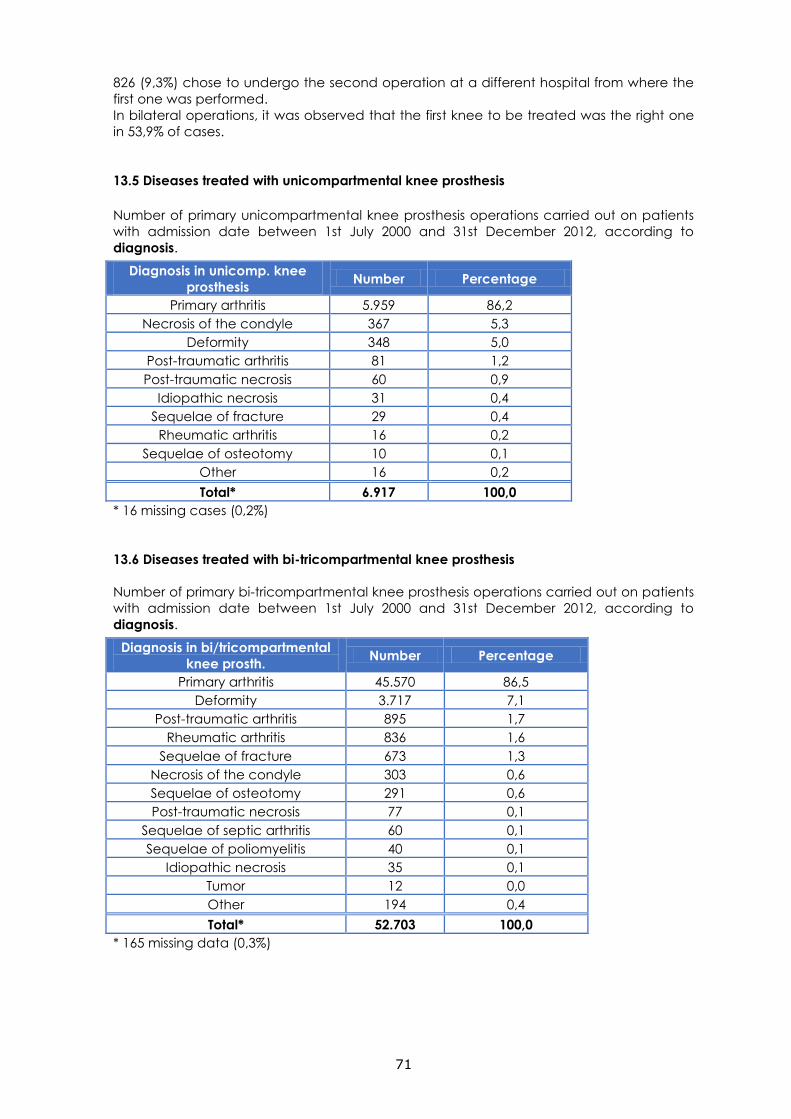
71
826 (9,3%) chose to undergo the second operation at a different hospital from where the
first one was performed.
In bilateral operations, it was observed that the first knee to be treated was the right one
in 53,9% of cases.
13.5 Diseases treated with unicompartmental knee prosthesis
Number of primary unicompartmental knee prosthesis operations carried out on patients
with admission date between 1st July 2000 and 31st December 2012, according to
diagnosis.
Diagnosis in unicomp. knee
prosthesis Number Percentage
Primary arthritis 5.959 86,2
Necrosis of the condyle 367 5,3
Deformity 348 5,0
Post-traumatic arthritis 81 1,2
Post-traumatic necrosis 60 0,9
Idiopathic necrosis 31 0,4
Sequelae of fracture 29 0,4
Rheumatic arthritis 16 0,2
Sequelae of osteotomy 10 0,1
Other 16 0,2
Total* 6.917 100,0
* 16 missing cases (0,2%)
13.6 Diseases treated with bi-tricompartmental knee prosthesis
Number of primary bi-tricompartmental knee prosthesis operations carried out on patients
with admission date between 1st July 2000 and 31st December 2012, according to
diagnosis.
Diagnosis in bi/tricompartmental
knee prosth. Number Percentage
Primary arthritis 45.570 86,5
Deformity 3.717 7,1
Post-traumatic arthritis 895 1,7
Rheumatic arthritis 836 1,6
Sequelae of fracture 673 1,3
Necrosis of the condyle 303 0,6
Sequelae of osteotomy 291 0,6
Post-traumatic necrosis 77 0,1
Sequelae of septic arthritis 60 0,1
Sequelae of poliomyelitis 40 0,1
Idiopathic necrosis 35 0,1
Tumor 12 0,0
Other 194 0,4
Total* 52.703 100,0
* 165 missing data (0,3%)
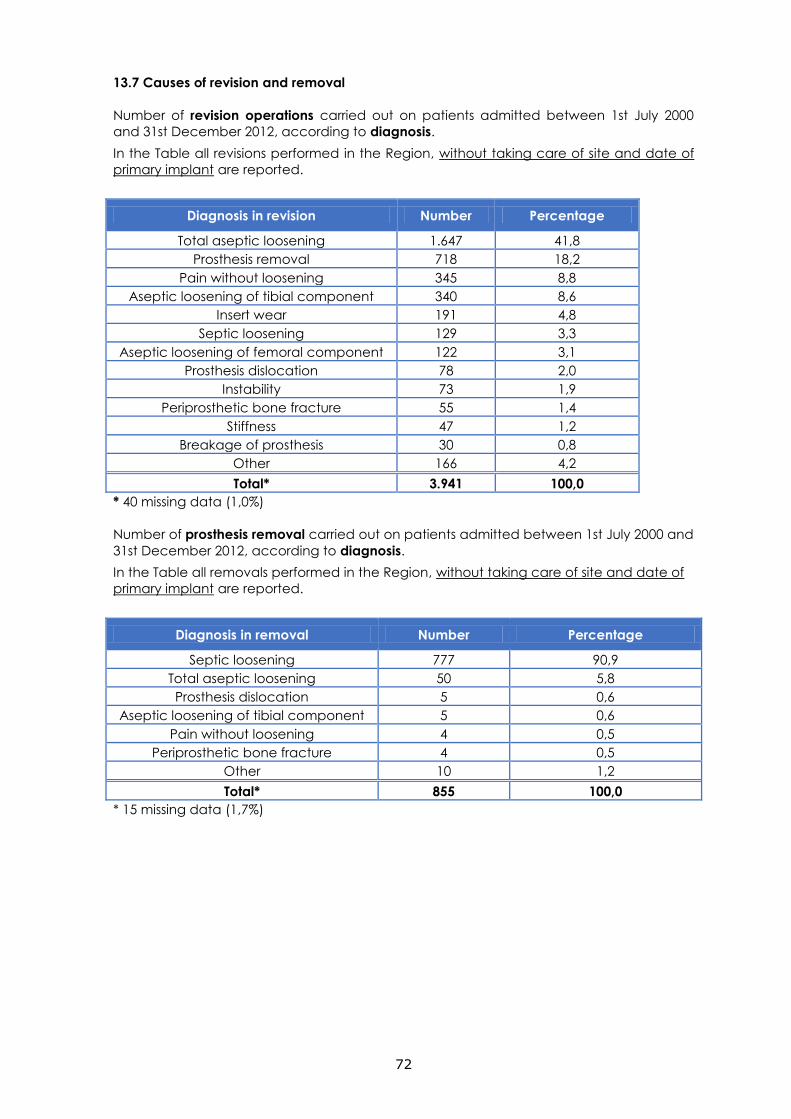
72
13.7 Causes of revision and removal
Number of revision operations carried out on patients admitted between 1st July 2000
and 31st December 2012, according to diagnosis.
In the Table all revisions performed in the Region, without taking care of site and date of
primary implant are reported.
Diagnosis in revision Number Percentage
Total aseptic loosening 1.647 41,8
Prosthesis removal 718 18,2
Pain without loosening 345 8,8
Aseptic loosening of tibial component 340 8,6
Insert wear 191 4,8
Septic loosening 129 3,3
Aseptic loosening of femoral component 122 3,1
Prosthesis dislocation 78 2,0
Instability 73 1,9
Periprosthetic bone fracture 55 1,4
Stiffness 47 1,2
Breakage of prosthesis 30 0,8
Other 166 4,2
Total* 3.941 100,0
* 40 missing data (1,0%)
Number of prosthesis removal carried out on patients admitted between 1st July 2000 and
31st December 2012, according to diagnosis.
In the Table all removals performed in the Region, without taking care of site and date of
primary implant are reported.
Diagnosis in removal Number Percentage
Septic loosening 777 90,9
Total aseptic loosening 50 5,8
Prosthesis dislocation 5 0,6
Aseptic loosening of tibial component 5 0,6
Pain without loosening 4 0,5
Periprosthetic bone fracture 4 0,5
Other 10 1,2
Total* 855 100,0
* 15 missing data (1,7%)
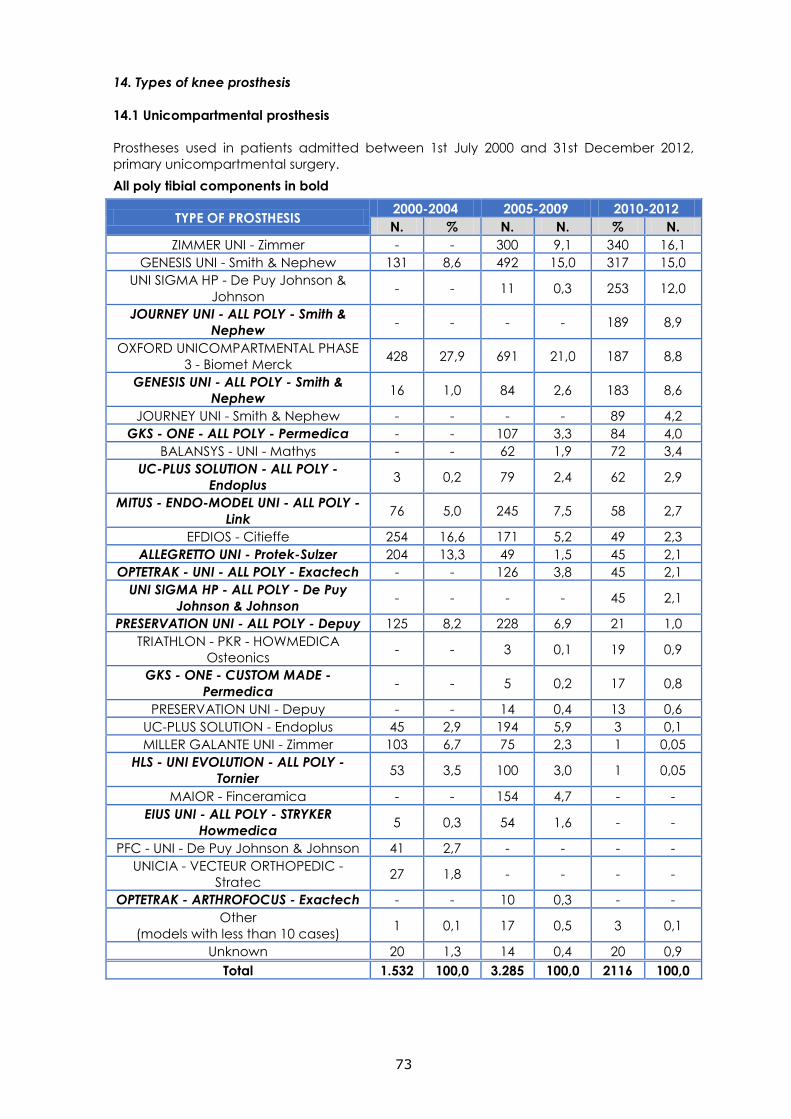
73
14. Types of knee prosthesis
14.1 Unicompartmental prosthesis
Prostheses used in patients admitted between 1st July 2000 and 31st December 2012,
primary unicompartmental surgery.
All poly tibial components in bold
TYPE OF PROSTHESIS 2000-2004 2005-2009 2010-2012
N. % N. N. % N.
ZIMMER UNI - Zimmer - - 300 9,1 340 16,1
GENESIS UNI - Smith & Nephew 131 8,6 492 15,0 317 15,0
UNI SIGMA HP - De Puy Johnson &
Johnson - - 11 0,3 253 12,0
JOURNEY UNI - ALL POLY - Smith &
Nephew - - - - 189 8,9
OXFORD UNICOMPARTMENTAL PHASE
3 - Biomet Merck 428 27,9 691 21,0 187 8,8
GENESIS UNI - ALL POLY - Smith &
Nephew 16 1,0 84 2,6 183 8,6
JOURNEY UNI - Smith & Nephew - - - - 89 4,2
GKS - ONE - ALL POLY - Permedica - - 107 3,3 84 4,0
BALANSYS - UNI - Mathys - - 62 1,9 72 3,4
UC-PLUS SOLUTION - ALL POLY -
Endoplus 3 0,2 79 2,4 62 2,9
MITUS - ENDO-MODEL UNI - ALL POLY -
Link 76 5,0 245 7,5 58 2,7
EFDIOS - Citieffe 254 16,6 171 5,2 49 2,3
ALLEGRETTO UNI - Protek-Sulzer 204 13,3 49 1,5 45 2,1
OPTETRAK - UNI - ALL POLY - Exactech - - 126 3,8 45 2,1
UNI SIGMA HP - ALL POLY - De Puy
Johnson & Johnson - - - - 45 2,1
PRESERVATION UNI - ALL POLY - Depuy 125 8,2 228 6,9 21 1,0
TRIATHLON - PKR - HOWMEDICA
Osteonics - - 3 0,1 19 0,9
GKS - ONE - CUSTOM MADE -
Permedica - - 5 0,2 17 0,8
PRESERVATION UNI - Depuy - - 14 0,4 13 0,6
UC-PLUS SOLUTION - Endoplus 45 2,9 194 5,9 3 0,1
MILLER GALANTE UNI - Zimmer 103 6,7 75 2,3 1 0,05
HLS - UNI EVOLUTION - ALL POLY -
Tornier 53 3,5 100 3,0 1 0,05
MAIOR - Finceramica - - 154 4,7 - -
EIUS UNI - ALL POLY - STRYKER
Howmedica 5 0,3 54 1,6 - -
PFC - UNI - De Puy Johnson & Johnson 41 2,7 - - - -
UNICIA - VECTEUR ORTHOPEDIC -
Stratec 27 1,8 - - - -
OPTETRAK - ARTHROFOCUS - Exactech - - 10 0,3 - -
Other
(models with less than 10 cases) 1 0,1 17 0,5 3 0,1
Unknown 20 1,3 14 0,4 20 0,9
Total 1.532 100,0 3.285 100,0 2116 100,0
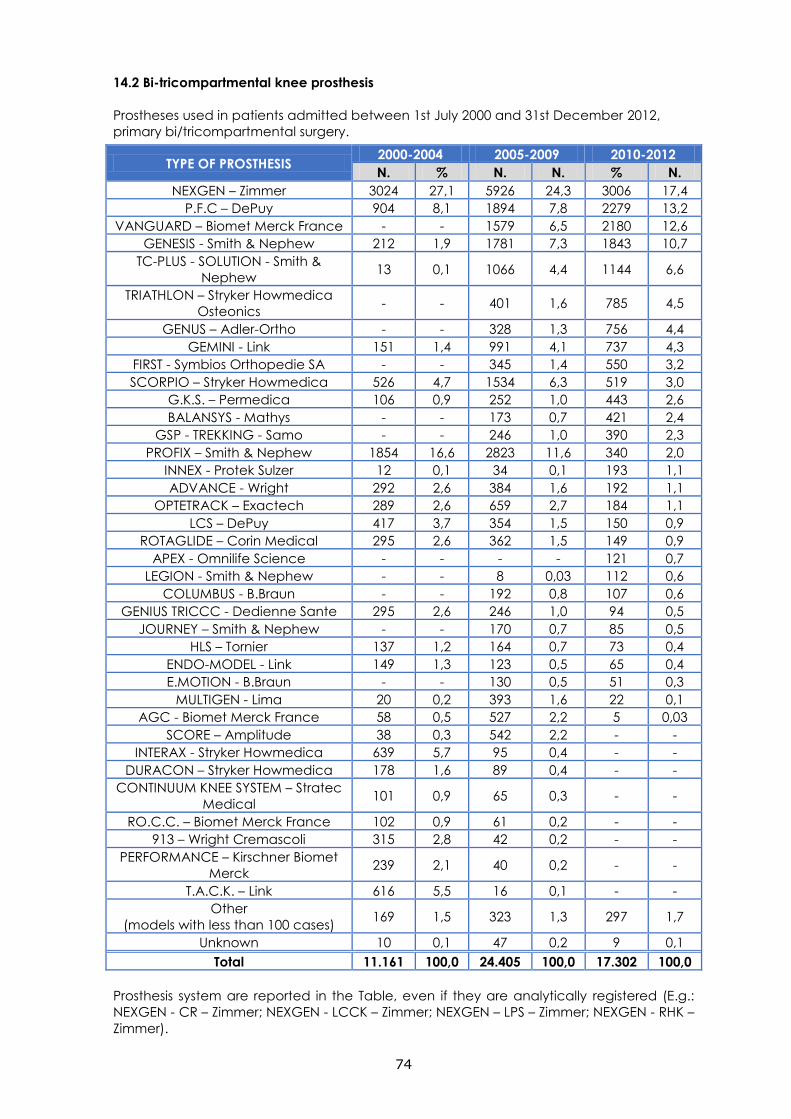
74
14.2 Bi-tricompartmental knee prosthesis
Prostheses used in patients admitted between 1st July 2000 and 31st December 2012,
primary bi/tricompartmental surgery.
TYPE OF PROSTHESIS 2000-2004 2005-2009 2010-2012
N. % N. N. % N.
NEXGEN – Zimmer 3024 27,1 5926 24,3 3006 17,4
P.F.C – DePuy 904 8,1 1894 7,8 2279 13,2
VANGUARD – Biomet Merck France - - 1579 6,5 2180 12,6
GENESIS - Smith & Nephew 212 1,9 1781 7,3 1843 10,7
TC-PLUS - SOLUTION - Smith &
Nephew 13 0,1 1066 4,4 1144 6,6
TRIATHLON – Stryker Howmedica
Osteonics - - 401 1,6 785 4,5
GENUS – Adler-Ortho - - 328 1,3 756 4,4
GEMINI - Link 151 1,4 991 4,1 737 4,3
FIRST - Symbios Orthopedie SA - - 345 1,4 550 3,2
SCORPIO – Stryker Howmedica 526 4,7 1534 6,3 519 3,0
G.K.S. – Permedica 106 0,9 252 1,0 443 2,6
BALANSYS - Mathys - - 173 0,7 421 2,4
GSP - TREKKING - Samo - - 246 1,0 390 2,3
PROFIX – Smith & Nephew 1854 16,6 2823 11,6 340 2,0
INNEX - Protek Sulzer 12 0,1 34 0,1 193 1,1
ADVANCE - Wright 292 2,6 384 1,6 192 1,1
OPTETRACK – Exactech 289 2,6 659 2,7 184 1,1
LCS – DePuy 417 3,7 354 1,5 150 0,9
ROTAGLIDE – Corin Medical 295 2,6 362 1,5 149 0,9
APEX - Omnilife Science - - - - 121 0,7
LEGION - Smith & Nephew - - 8 0,03 112 0,6
COLUMBUS - B.Braun - - 192 0,8 107 0,6
GENIUS TRICCC - Dedienne Sante 295 2,6 246 1,0 94 0,5
JOURNEY – Smith & Nephew - - 170 0,7 85 0,5
HLS – Tornier 137 1,2 164 0,7 73 0,4
ENDO-MODEL - Link 149 1,3 123 0,5 65 0,4
E.MOTION - B.Braun - - 130 0,5 51 0,3
MULTIGEN - Lima 20 0,2 393 1,6 22 0,1
AGC - Biomet Merck France 58 0,5 527 2,2 5 0,03
SCORE – Amplitude 38 0,3 542 2,2 - -
INTERAX - Stryker Howmedica 639 5,7 95 0,4 - -
DURACON – Stryker Howmedica 178 1,6 89 0,4 - -
CONTINUUM KNEE SYSTEM – Stratec
Medical 101 0,9 65 0,3 - -
RO.C.C. – Biomet Merck France 102 0,9 61 0,2 - -
913 – Wright Cremascoli 315 2,8 42 0,2 - -
PERFORMANCE – Kirschner Biomet
Merck 239 2,1 40 0,2 - -
T.A.C.K. – Link 616 5,5 16 0,1 - -
Other
(models with less than 100 cases) 169 1,5 323 1,3 297 1,7
Unknown 10 0,1 47 0,2 9 0,1
Total 11.161 100,0 24.405 100,0 17.302 100,0
Prosthesis system are reported in the Table, even if they are analytically registered (E.g.:
NEXGEN - CR – Zimmer; NEXGEN - LCCK – Zimmer; NEXGEN – LPS – Zimmer; NEXGEN - RHK –
Zimmer).
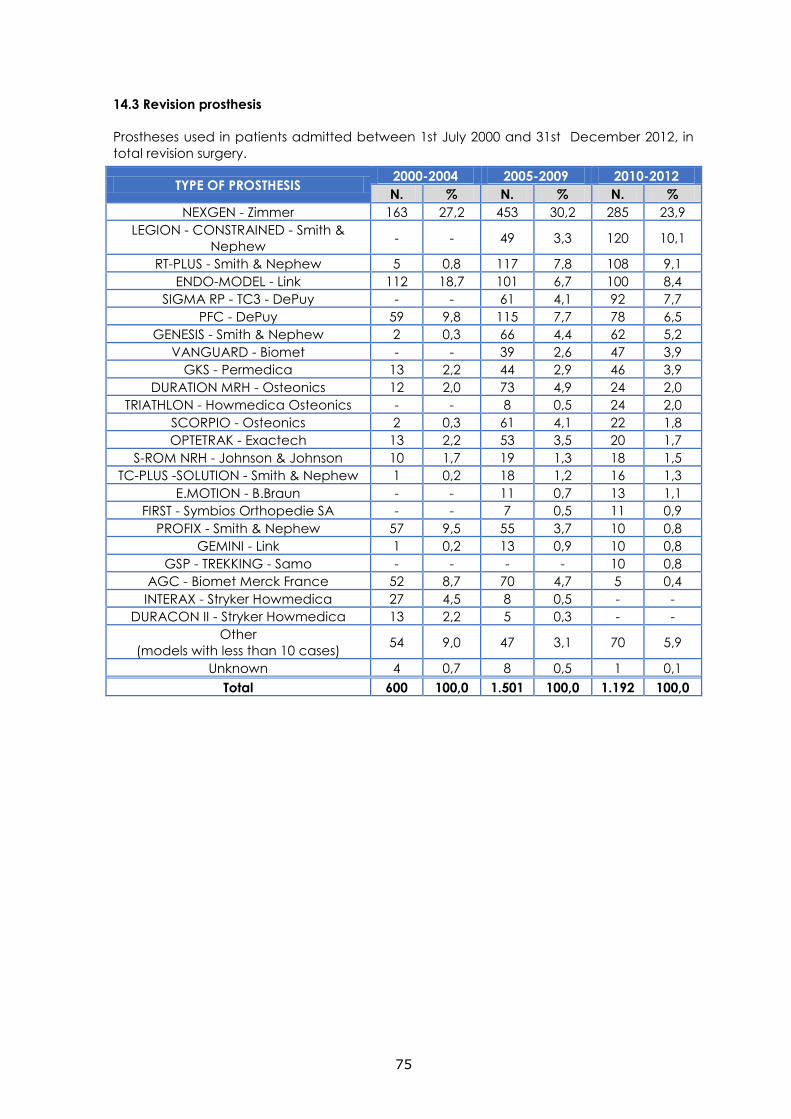
75
14.3 Revision prosthesis
Prostheses used in patients admitted between 1st July 2000 and 31st December 2012, in
total revision surgery.
TYPE OF PROSTHESIS 2000-2004 2005-2009 2010-2012
N. % N. % N. %
NEXGEN - Zimmer 163 27,2 453 30,2 285 23,9
LEGION - CONSTRAINED - Smith &
Nephew - - 49 3,3 120 10,1
RT-PLUS - Smith & Nephew 5 0,8 117 7,8 108 9,1
ENDO-MODEL - Link 112 18,7 101 6,7 100 8,4
SIGMA RP - TC3 - DePuy - - 61 4,1 92 7,7
PFC - DePuy 59 9,8 115 7,7 78 6,5
GENESIS - Smith & Nephew 2 0,3 66 4,4 62 5,2
VANGUARD - Biomet - - 39 2,6 47 3,9
GKS - Permedica 13 2,2 44 2,9 46 3,9
DURATION MRH - Osteonics 12 2,0 73 4,9 24 2,0
TRIATHLON - Howmedica Osteonics - - 8 0,5 24 2,0
SCORPIO - Osteonics 2 0,3 61 4,1 22 1,8
OPTETRAK - Exactech 13 2,2 53 3,5 20 1,7
S-ROM NRH - Johnson & Johnson 10 1,7 19 1,3 18 1,5
TC-PLUS -SOLUTION - Smith & Nephew 1 0,2 18 1,2 16 1,3
E.MOTION - B.Braun - - 11 0,7 13 1,1
FIRST - Symbios Orthopedie SA - - 7 0,5 11 0,9
PROFIX - Smith & Nephew 57 9,5 55 3,7 10 0,8
GEMINI - Link 1 0,2 13 0,9 10 0,8
GSP - TREKKING - Samo - - - - 10 0,8
AGC - Biomet Merck France 52 8,7 70 4,7 5 0,4
INTERAX - Stryker Howmedica 27 4,5 8 0,5 - -
DURACON II - Stryker Howmedica 13 2,2 5 0,3 - -
Other
(models with less than 10 cases) 54 9,0 47 3,1 70 5,9
Unknown 4 0,7 8 0,5 1 0,1
Total 600 100,0 1.501 100,0 1.192 100,0
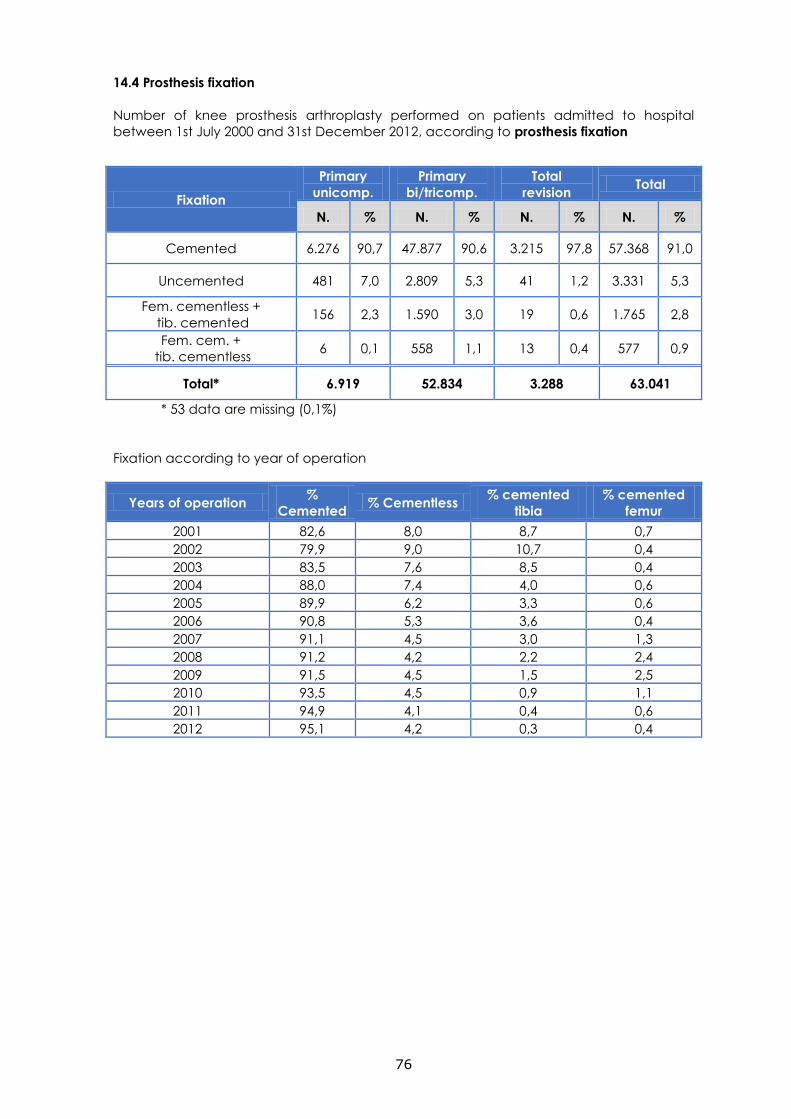
76
14.4 Prosthesis fixation
Number of knee prosthesis arthroplasty performed on patients admitted to hospital
between 1st July 2000 and 31st December 2012, according to prosthesis fixation
Fixation
Primary
unicomp.
Primary
bi/tricomp.
Total
revision Total
N. % N. % N. % N. %
Cemented 6.276 90,7 47.877 90,6 3.215 97,8 57.368 91,0
Uncemented 481 7,0 2.809 5,3 41 1,2 3.331 5,3
Fem. cementless +
tib. cemented 156 2,3 1.590 3,0 19 0,6 1.765 2,8
Fem. cem. +
tib. cementless 6 0,1 558 1,1 13 0,4 577 0,9
Total* 6.919 52.834 3.288 63.041
* 53 data are missing (0,1%)
Fixation according to year of operation
Years of operation %
Cemented % Cementless
% cemented
tibia
% cemented
femur
2001 82,6 8,0 8,7 0,7
2002 79,9 9,0 10,7 0,4
2003 83,5 7,6 8,5 0,4
2004 88,0 7,4 4,0 0,6
2005 89,9 6,2 3,3 0,6
2006 90,8 5,3 3,6 0,4
2007 91,1 4,5 3,0 1,3
2008 91,2 4,2 2,2 2,4
2009 91,5 4,5 1,5 2,5
2010 93,5 4,5 0,9 1,1
2011 94,9 4,1 0,4 0,6
2012 95,1 4,2 0,3 0,4
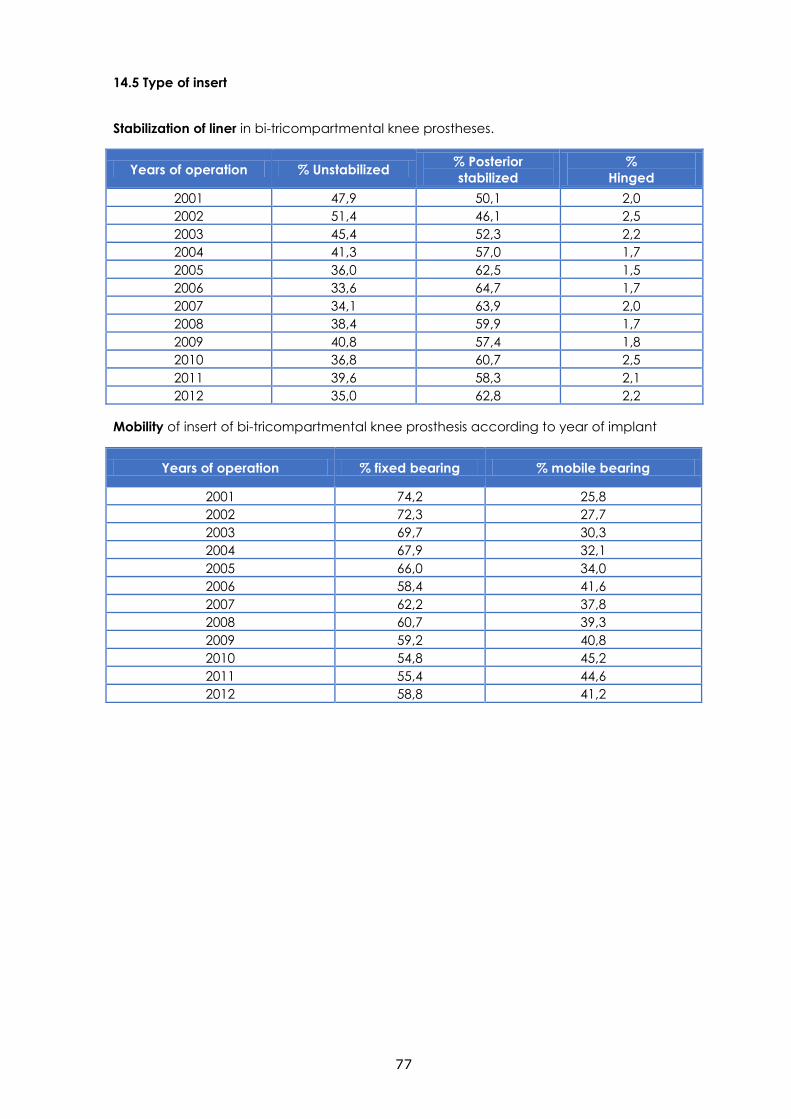
77
14.5 Type of insert
Stabilization of liner in bi-tricompartmental knee prostheses.
Years of operation % Unstabilized % Posterior
stabilized
%
Hinged
2001 47,9 50,1 2,0
2002 51,4 46,1 2,5
2003 45,4 52,3 2,2
2004 41,3 57,0 1,7
2005 36,0 62,5 1,5
2006 33,6 64,7 1,7
2007 34,1 63,9 2,0
2008 38,4 59,9 1,7
2009 40,8 57,4 1,8
2010 36,8 60,7 2,5
2011 39,6 58,3 2,1
2012 35,0 62,8 2,2
Mobility of insert of bi-tricompartmental knee prosthesis according to year of implant
Years of operation % fixed bearing % mobile bearing
2001 74,2 25,8
2002 72,3 27,7
2003 69,7 30,3
2004 67,9 32,1
2005 66,0 34,0
2006 58,4 41,6
2007 62,2 37,8
2008 60,7 39,3
2009 59,2 40,8
2010 54,8 45,2
2011 55,4 44,6
2012 58,8 41,2
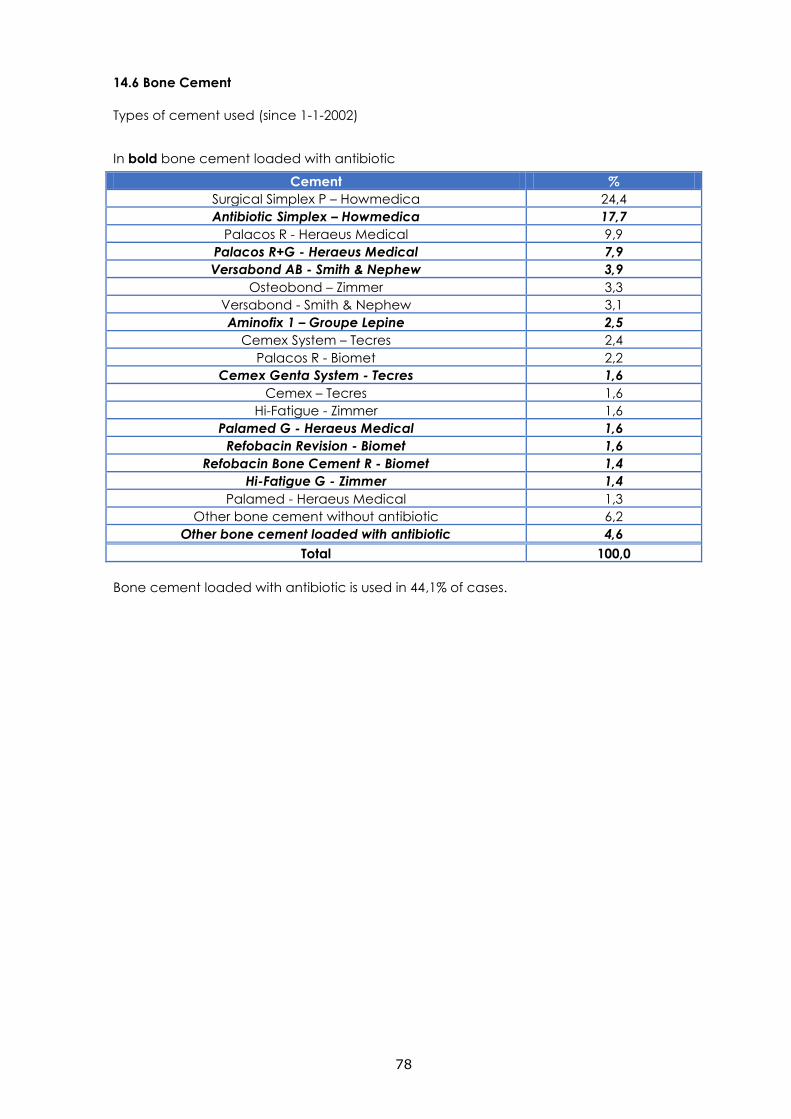
78
14.6 Bone Cement
Types of cement used (since 1-1-2002)
In bold bone cement loaded with antibiotic
Cement %
Surgical Simplex P – Howmedica 24,4
Antibiotic Simplex – Howmedica 17,7
Palacos R - Heraeus Medical 9,9
Palacos R+G - Heraeus Medical 7,9
Versabond AB - Smith & Nephew 3,9
Osteobond – Zimmer 3,3
Versabond - Smith & Nephew 3,1
Aminofix 1 – Groupe Lepine 2,5
Cemex System – Tecres 2,4
Palacos R - Biomet 2,2
Cemex Genta System - Tecres 1,6
Cemex – Tecres 1,6
Hi-Fatigue - Zimmer 1,6
Palamed G - Heraeus Medical 1,6
Refobacin Revision - Biomet 1,6
Refobacin Bone Cement R - Biomet 1,4
Hi-Fatigue G - Zimmer 1,4
Palamed - Heraeus Medical 1,3
Other bone cement without antibiotic 6,2
Other bone cement loaded with antibiotic 4,6
Total 100,0
Bone cement loaded with antibiotic is used in 44,1% of cases.
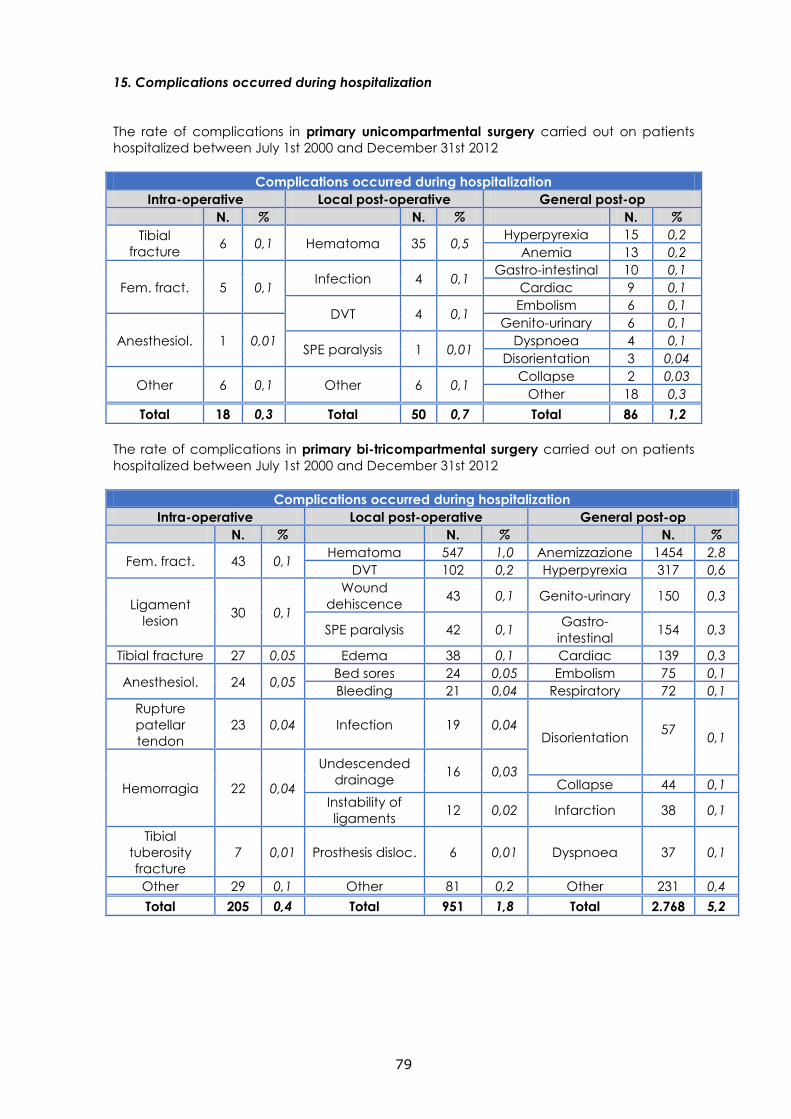
79
15. Complications occurred during hospitalization
The rate of complications in primary unicompartmental surgery carried out on patients
hospitalized between July 1st 2000 and December 31st 2012
Complications occurred during hospitalization
Intra-operative Local post-operative General post-op
N. % N. % N. %
Tibial
fracture 6 0,1 Hematoma 35 0,5
Hyperpyrexia 15 0,2
Anemia 13 0,2
Fem. fract. 5 0,1 Infection 4 0,1
Gastro-intestinal 10 0,1
Cardiac 9 0,1
DVT 4 0,1 Embolism 6 0,1
Anesthesiol. 1 0,01
Genito-urinary 6 0,1
SPE paralysis 1 0,01 Dyspnoea 4 0,1
Disorientation 3 0,04
Other 6 0,1 Other 6 0,1 Collapse 2 0,03
Other 18 0,3
Total 18 0,3 Total 50 0,7 Total 86 1,2
The rate of complications in primary bi-tricompartmental surgery carried out on patients
hospitalized between July 1st 2000 and December 31st 2012
Complications occurred during hospitalization
Intra-operative Local post-operative General post-op
N. % N. % N. %
Fem. fract. 43 0,1 Hematoma 547 1,0 Anemizzazione 1454 2,8
DVT 102 0,2 Hyperpyrexia 317 0,6
Ligament
lesion 30 0,1
Wound
dehiscence 43 0,1 Genito-urinary 150 0,3
SPE paralysis 42 0,1 Gastro-
intestinal 154 0,3
Tibial fracture 27 0,05 Edema 38 0,1 Cardiac 139 0,3
Anesthesiol. 24 0,05 Bed sores 24 0,05 Embolism 75 0,1
Bleeding 21 0,04 Respiratory 72 0,1
Rupture
patellar
tendon
23 0,04 Infection 19 0,04 Disorientation
57
0,1
Hemorragia 22 0,04
Undescended
drainage 16 0,03
Collapse 44 0,1
Instability of
ligaments 12 0,02 Infarction 38 0,1
Tibial
tuberosity
fracture
7 0,01 Prosthesis disloc. 6 0,01 Dyspnoea 37 0,1
Other 29 0,1 Other 81 0,2 Other 231 0,4
Total 205 0,4 Total 951 1,8 Total 2.768 5,2
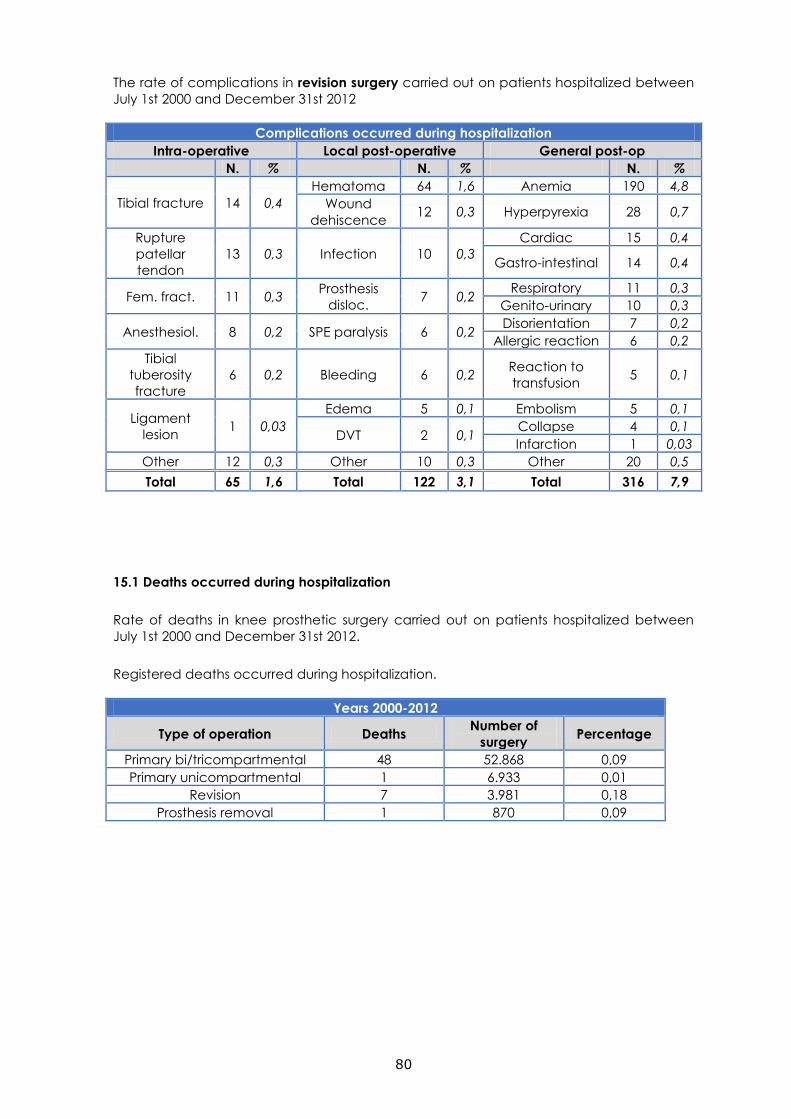
80
The rate of complications in revision surgery carried out on patients hospitalized between
July 1st 2000 and December 31st 2012
Complications occurred during hospitalization
Intra-operative Local post-operative General post-op
N. % N. % N. %
Tibial fracture 14 0,4
Hematoma 64 1,6 Anemia 190 4,8
Wound
dehiscence 12 0,3 Hyperpyrexia 28 0,7
Rupture
patellar
tendon
13 0,3 Infection 10 0,3
Cardiac 15 0,4
Gastro-intestinal 14 0,4
Fem. fract. 11 0,3 Prosthesis
disloc. 7 0,2
Respiratory 11 0,3
Genito-urinary 10 0,3
Anesthesiol. 8 0,2 SPE paralysis 6 0,2 Disorientation 7 0,2
Allergic reaction 6 0,2
Tibial
tuberosity
fracture
6 0,2 Bleeding 6 0,2 Reaction to
transfusion 5 0,1
Ligament
lesion 1 0,03
Edema 5 0,1 Embolism 5 0,1
DVT 2 0,1 Collapse 4 0,1
Infarction 1 0,03
Other 12 0,3 Other 10 0,3 Other 20 0,5
Total 65 1,6 Total 122 3,1 Total 316 7,9
15.1 Deaths occurred during hospitalization
Rate of deaths in knee prosthetic surgery carried out on patients hospitalized between
July 1st 2000 and December 31st 2012.
Registered deaths occurred during hospitalization.
Years 2000-2012
Type of operation Deaths Number of
surgery Percentage
Primary bi/tricompartmental 48 52.868 0,09
Primary unicompartmental 1 6.933 0,01
Revision 7 3.981 0,18
Prosthesis removal 1 870 0,09
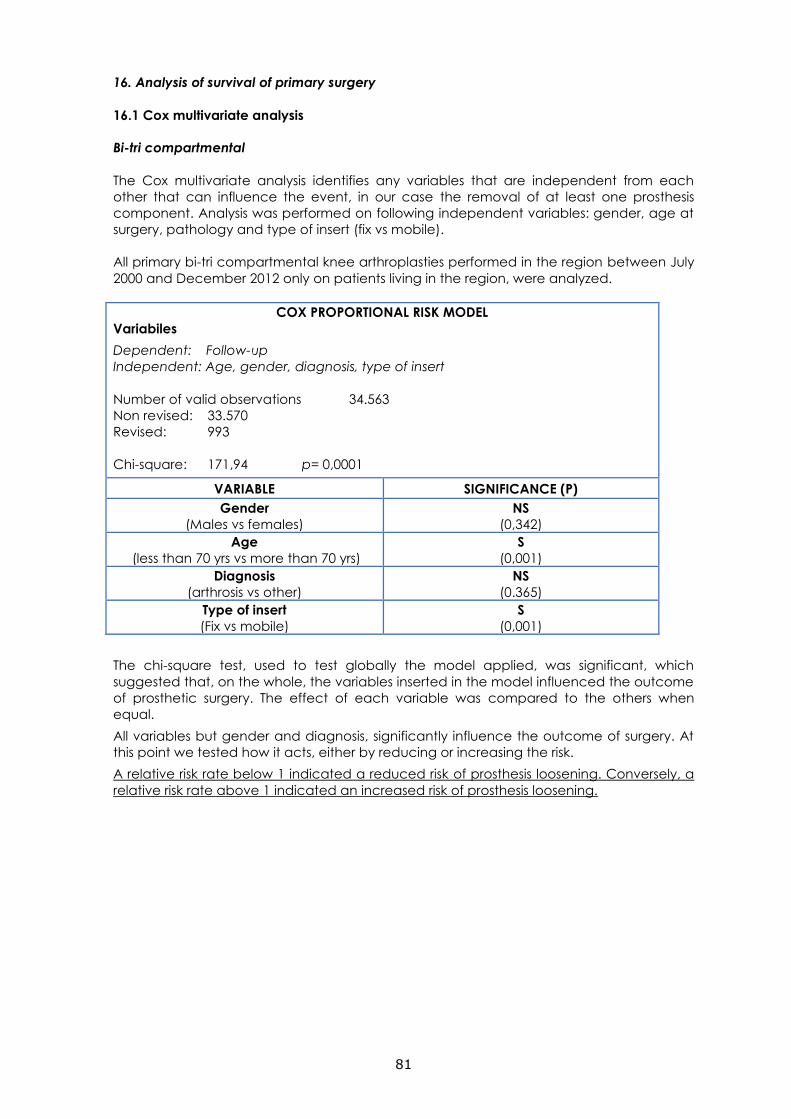
81
16. Analysis of survival of primary surgery
16.1 Cox multivariate analysis
Bi-tri compartmental
The Cox multivariate analysis identifies any variables that are independent from each
other that can influence the event, in our case the removal of at least one prosthesis
component. Analysis was performed on following independent variables: gender, age at
surgery, pathology and type of insert (fix vs mobile).
All primary bi-tri compartmental knee arthroplasties performed in the region between July
2000 and December 2012 only on patients living in the region, were analyzed.
COX PROPORTIONAL RISK MODEL
Variabiles
Dependent: Follow-up
Independent: Age, gender, diagnosis, type of insert
Number of valid observations 34.563
Non revised: 33.570
Revised: 993
Chi-square: 171,94 p= 0,0001
VARIABLE SIGNIFICANCE (P)
Gender
(Males vs females)
NS
(0,342)
Age
(less than 70 yrs vs more than 70 yrs)
S
(0,001)
Diagnosis
(arthrosis vs other)
NS
(0.365)
Type of insert
(Fix vs mobile)
S
(0,001)
The chi-square test, used to test globally the model applied, was significant, which
suggested that, on the whole, the variables inserted in the model influenced the outcome
of prosthetic surgery. The effect of each variable was compared to the others when
equal.
All variables but gender and diagnosis, significantly influence the outcome of surgery. At
this point we tested how it acts, either by reducing or increasing the risk.
A relative risk rate below 1 indicated a reduced risk of prosthesis loosening. Conversely, a
relative risk rate above 1 indicated an increased risk of prosthesis loosening.
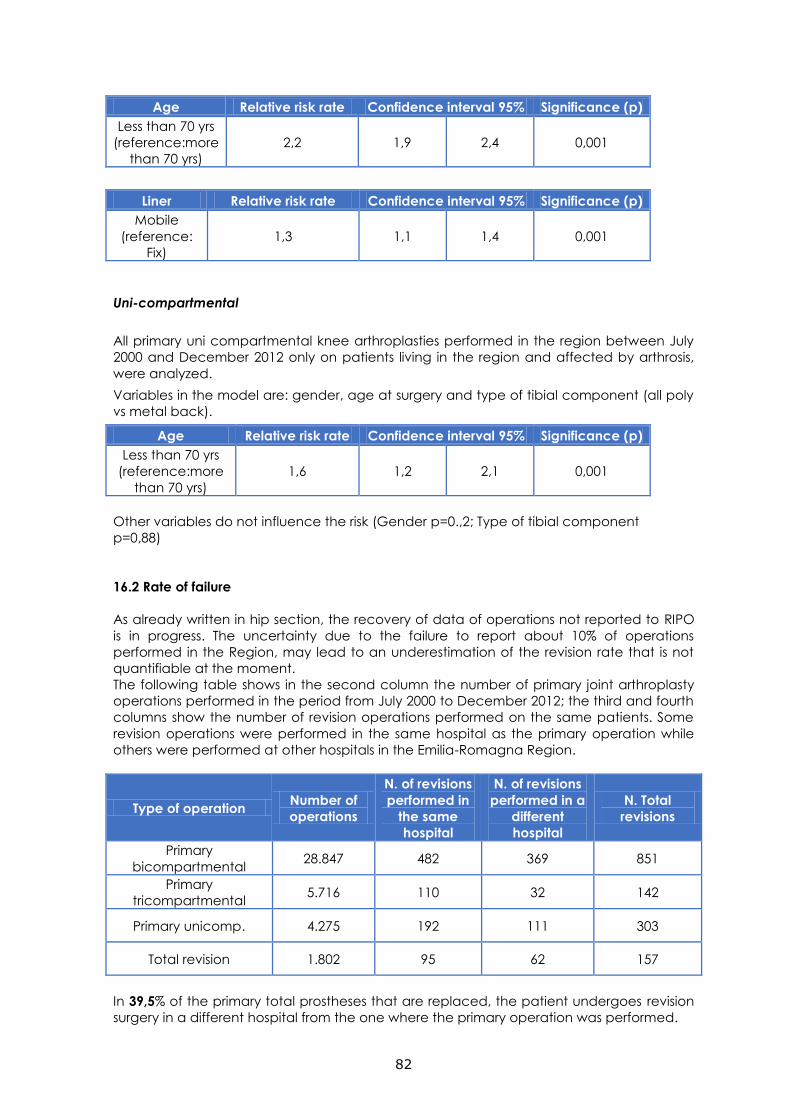
82
Age Relative risk rate Confidence interval 95% Significance (p)
Less than 70 yrs
(reference:more
than 70 yrs)
2,2 1,9 2,4 0,001
Liner Relative risk rate Confidence interval 95% Significance (p)
Mobile
(reference:
Fix)
1,3 1,1 1,4 0,001
Uni-compartmental
All primary uni compartmental knee arthroplasties performed in the region between July
2000 and December 2012 only on patients living in the region and affected by arthrosis,
were analyzed.
Variables in the model are: gender, age at surgery and type of tibial component (all poly
vs metal back).
Age Relative risk rate Confidence interval 95% Significance (p)
Less than 70 yrs
(reference:more
than 70 yrs)
1,6 1,2 2,1 0,001
Other variables do not influence the risk (Gender p=0.,2; Type of tibial component
p=0,88)
16.2 Rate of failure
As already written in hip section, the recovery of data of operations not reported to RIPO
is in progress. The uncertainty due to the failure to report about 10% of operations
performed in the Region, may lead to an underestimation of the revision rate that is not
quantifiable at the moment.
The following table shows in the second column the number of primary joint arthroplasty
operations performed in the period from July 2000 to December 2012; the third and fourth
columns show the number of revision operations performed on the same patients. Some
revision operations were performed in the same hospital as the primary operation while
others were performed at other hospitals in the Emilia-Romagna Region.
Type of operation Number of
operations
N. of revisions
performed in
the same
hospital
N. of revisions
performed in a
different
hospital
N. Total
revisions
Primary
bicompartmental 28.847 482 369 851
Primary
tricompartmental 5.716 110 32 142
Primary unicomp. 4.275 192 111 303
Total revision 1.802 95 62 157
In 39,5% of the primary total prostheses that are replaced, the patient undergoes revision
surgery in a different hospital from the one where the primary operation was performed.
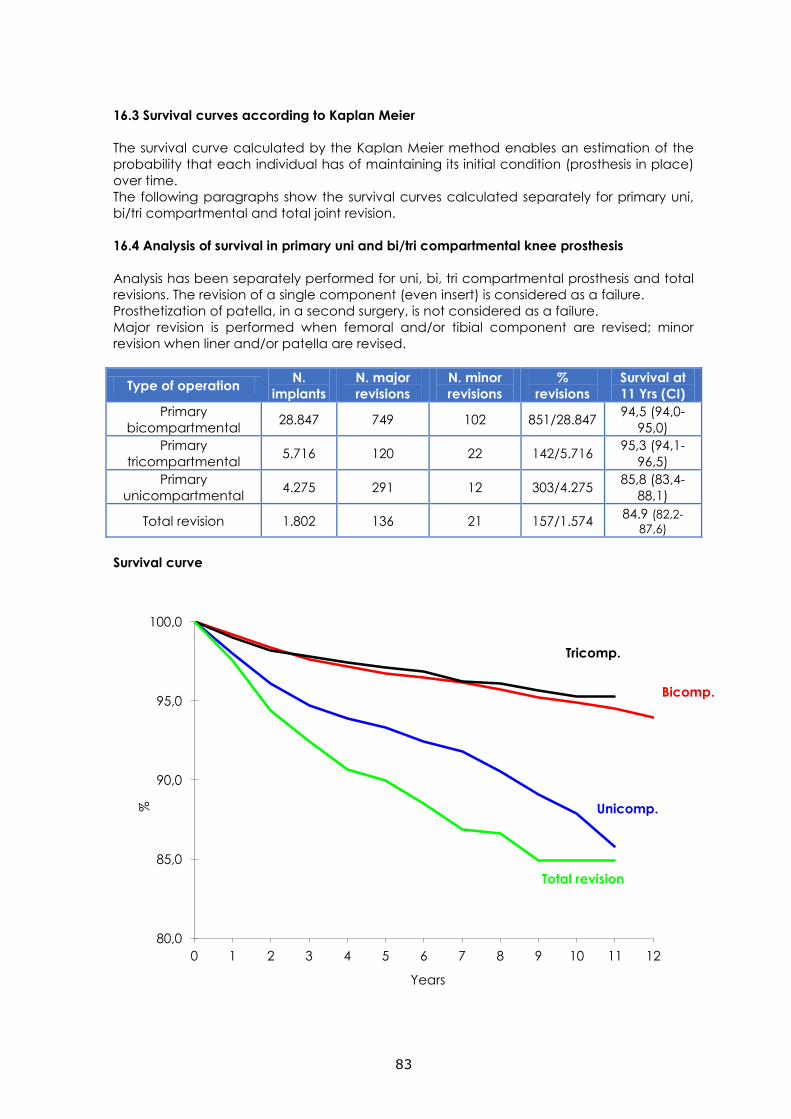
83
16.3 Survival curves according to Kaplan Meier
The survival curve calculated by the Kaplan Meier method enables an estimation of the
probability that each individual has of maintaining its initial condition (prosthesis in place)
over time.
The following paragraphs show the survival curves calculated separately for primary uni,
bi/tri compartmental and total joint revision.
16.4 Analysis of survival in primary uni and bi/tri compartmental knee prosthesis
Analysis has been separately performed for uni, bi, tri compartmental prosthesis and total
revisions. The revision of a single component (even insert) is considered as a failure.
Prosthetization of patella, in a second surgery, is not considered as a failure.
Major revision is performed when femoral and/or tibial component are revised; minor
revision when liner and/or patella are revised.
Type of operation N.
implants
N. major
revisions
N. minor
revisions
%
revisions
Survival at
11 Yrs (CI)
Primary
bicompartmental 28.847 749 102 851/28.847
94,5 (94,0-
95,0)
Primary
tricompartmental 5.716 120 22 142/5.716
95,3 (94,1-
96,5)
Primary
unicompartmental 4.275 291 12 303/4.275
85,8 (83,4-
88,1)
Total revision 1.802 136 21 157/1.574 84.9 (82,2-
87,6)
Survival curve
80,0
85,0
90,0
95,0
100,0
0 1 2 3 4 5 6 7 8 9 10 11 12
%
Years
Total revision
Unicomp.
Bicomp.
Tricomp.
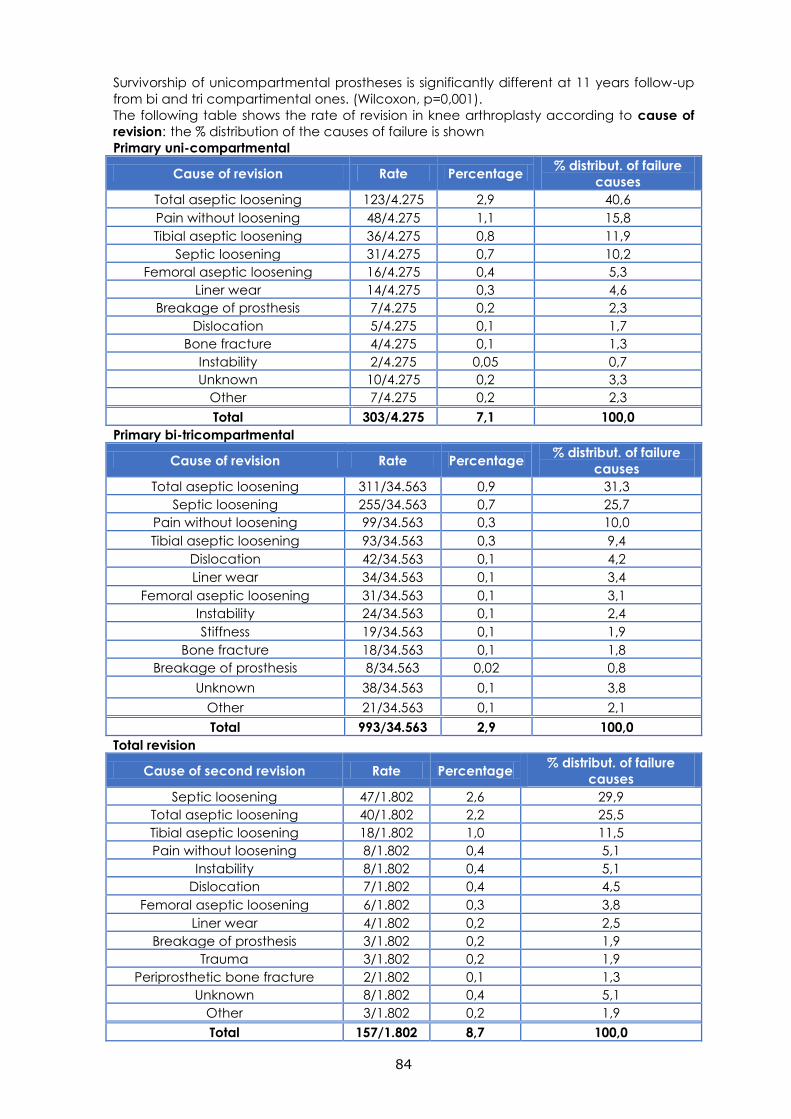
84
Survivorship of unicompartmental prostheses is significantly different at 11 years follow-up
from bi and tri compartimental ones. (Wilcoxon, p=0,001).
The following table shows the rate of revision in knee arthroplasty according to cause of
revision: the % distribution of the causes of failure is shown
Primary uni-compartmental
Cause of revision Rate Percentage % distribut. of failure
causes
Total aseptic loosening 123/4.275 2,9 40,6
Pain without loosening 48/4.275 1,1 15,8
Tibial aseptic loosening 36/4.275 0,8 11,9
Septic loosening 31/4.275 0,7 10,2
Femoral aseptic loosening 16/4.275 0,4 5,3
Liner wear 14/4.275 0,3 4,6
Breakage of prosthesis 7/4.275 0,2 2,3
Dislocation 5/4.275 0,1 1,7
Bone fracture 4/4.275 0,1 1,3
Instability 2/4.275 0,05 0,7
Unknown 10/4.275 0,2 3,3
Other 7/4.275 0,2 2,3
Total 303/4.275 7,1 100,0
Primary bi-tricompartmental
Cause of revision Rate Percentage % distribut. of failure
causes
Total aseptic loosening 311/34.563 0,9 31,3
Septic loosening 255/34.563 0,7 25,7
Pain without loosening 99/34.563 0,3 10,0
Tibial aseptic loosening 93/34.563 0,3 9,4
Dislocation 42/34.563 0,1 4,2
Liner wear 34/34.563 0,1 3,4
Femoral aseptic loosening 31/34.563 0,1 3,1
Instability 24/34.563 0,1 2,4
Stiffness 19/34.563 0,1 1,9
Bone fracture 18/34.563 0,1 1,8
Breakage of prosthesis 8/34.563 0,02 0,8
Unknown 38/34.563 0,1 3,8
Other 21/34.563 0,1 2,1
Total 993/34.563 2,9 100,0
Total revision
Cause of second revision Rate Percentage % distribut. of failure
causes
Septic loosening 47/1.802 2,6 29,9
Total aseptic loosening 40/1.802 2,2 25,5
Tibial aseptic loosening 18/1.802 1,0 11,5
Pain without loosening 8/1.802 0,4 5,1
Instability 8/1.802 0,4 5,1
Dislocation 7/1.802 0,4 4,5
Femoral aseptic loosening 6/1.802 0,3 3,8
Liner wear 4/1.802 0,2 2,5
Breakage of prosthesis 3/1.802 0,2 1,9
Trauma 3/1.802 0,2 1,9
Periprosthetic bone fracture 2/1.802 0,1 1,3
Unknown 8/1.802 0,4 5,1
Other 3/1.802 0,2 1,9
Total 157/1.802 8,7 100,0
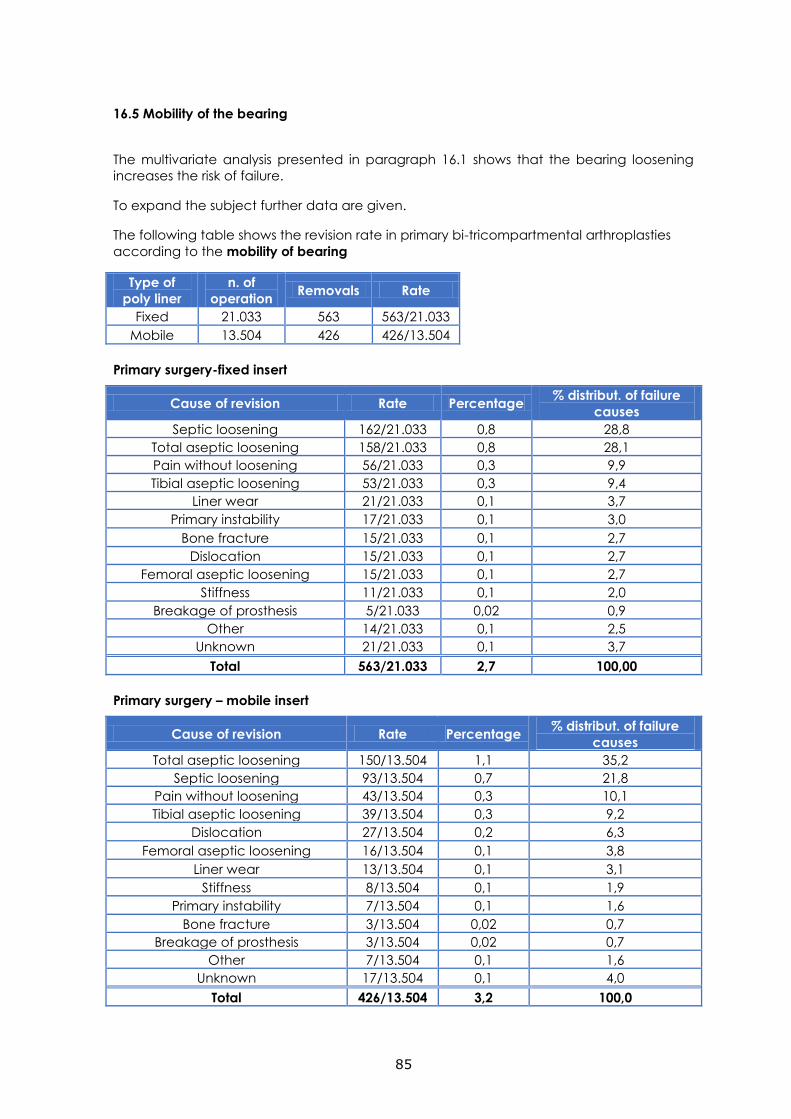
85
16.5 Mobility of the bearing
The multivariate analysis presented in paragraph 16.1 shows that the bearing loosening
increases the risk of failure.
To expand the subject further data are given.
The following table shows the revision rate in primary bi-tricompartmental arthroplasties
according to the mobility of bearing
Type of
poly liner
n. of
operation Removals Rate
Fixed 21.033 563 563/21.033
Mobile 13.504 426 426/13.504
Primary surgery-fixed insert
Cause of revision Rate Percentage % distribut. of failure
causes
Septic loosening 162/21.033 0,8 28,8
Total aseptic loosening 158/21.033 0,8 28,1
Pain without loosening 56/21.033 0,3 9,9
Tibial aseptic loosening 53/21.033 0,3 9,4
Liner wear 21/21.033 0,1 3,7
Primary instability 17/21.033 0,1 3,0
Bone fracture 15/21.033 0,1 2,7
Dislocation 15/21.033 0,1 2,7
Femoral aseptic loosening 15/21.033 0,1 2,7
Stiffness 11/21.033 0,1 2,0
Breakage of prosthesis 5/21.033 0,02 0,9
Other 14/21.033 0,1 2,5
Unknown 21/21.033 0,1 3,7
Total 563/21.033 2,7 100,00
Primary surgery – mobile insert
Cause of revision Rate Percentage % distribut. of failure
causes
Total aseptic loosening 150/13.504 1,1 35,2
Septic loosening 93/13.504 0,7 21,8
Pain without loosening 43/13.504 0,3 10,1
Tibial aseptic loosening 39/13.504 0,3 9,2
Dislocation 27/13.504 0,2 6,3
Femoral aseptic loosening 16/13.504 0,1 3,8
Liner wear 13/13.504 0,1 3,1
Stiffness 8/13.504 0,1 1,9
Primary instability 7/13.504 0,1 1,6
Bone fracture 3/13.504 0,02 0,7
Breakage of prosthesis 3/13.504 0,02 0,7
Other 7/13.504 0,1 1,6
Unknown 17/13.504 0,1 4,0
Total 426/13.504 3,2 100,0
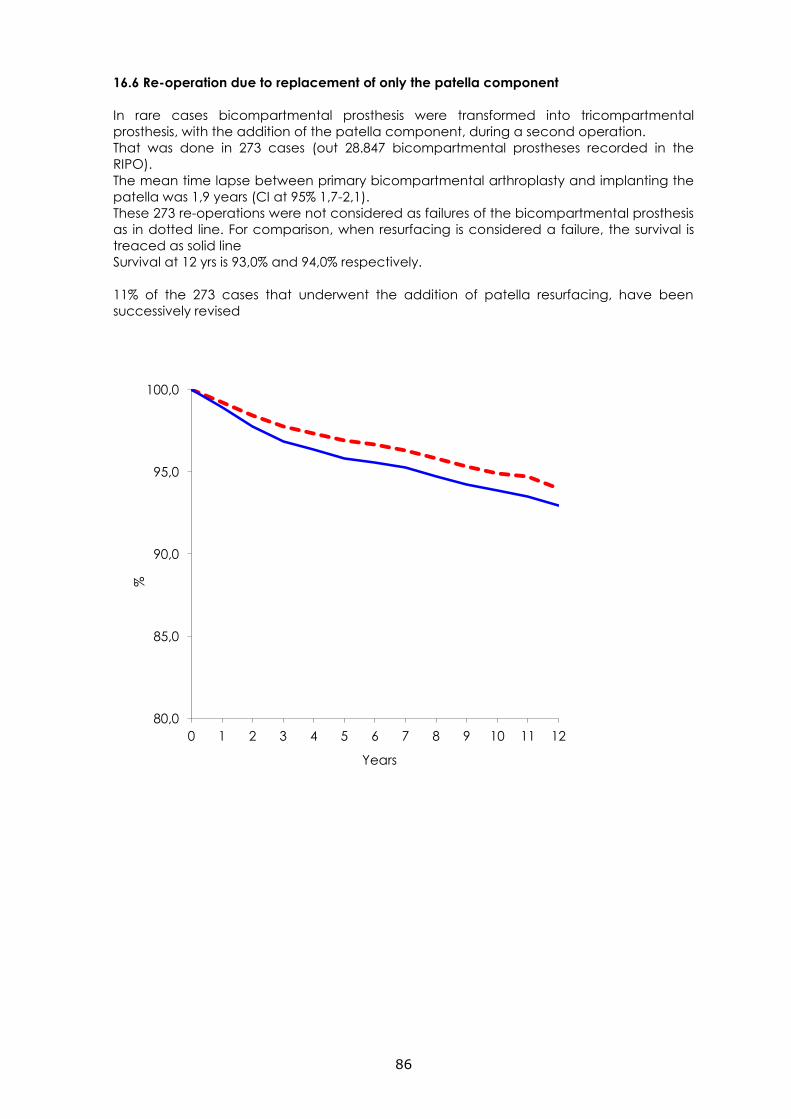
86
16.6 Re-operation due to replacement of only the patella component
In rare cases bicompartmental prosthesis were transformed into tricompartmental
prosthesis, with the addition of the patella component, during a second operation.
That was done in 273 cases (out 28.847 bicompartmental prostheses recorded in the
RIPO).
The mean time lapse between primary bicompartmental arthroplasty and implanting the
patella was 1,9 years (CI at 95% 1,7-2,1).
These 273 re-operations were not considered as failures of the bicompartmental prosthesis
as in dotted line. For comparison, when resurfacing is considered a failure, the survival is
treaced as solid line
Survival at 12 yrs is 93,0% and 94,0% respectively.
11% of the 273 cases that underwent the addition of patella resurfacing, have been
successively revised
80,0
85,0
90,0
95,0
100,0
0 1 2 3 4 5 6 7 8 9 10 11 12
%
Years
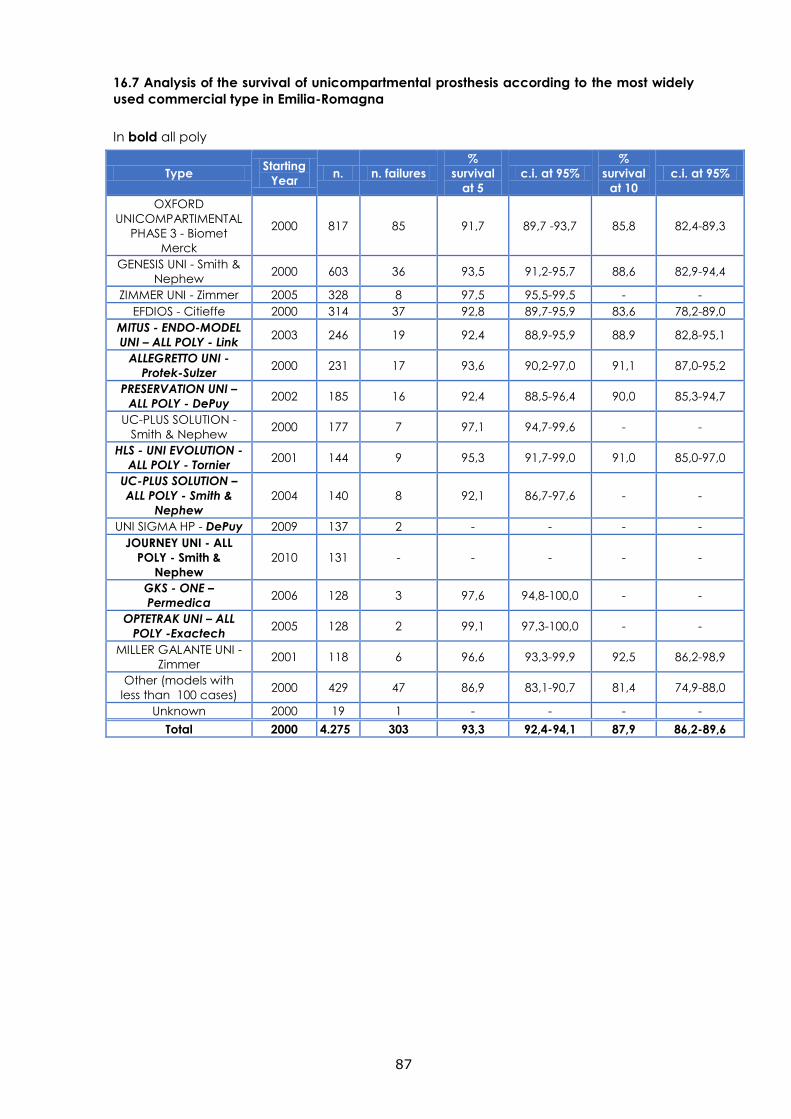
87
16.7 Analysis of the survival of unicompartmental prosthesis according to the most widely
used commercial type in Emilia-Romagna
In bold all poly
Type Starting
Year n. n. failures
%
survival
at 5
c.i. at 95%
%
survival
at 10
c.i. at 95%
OXFORD
UNICOMPARTIMENTAL
PHASE 3 - Biomet
Merck
2000 817 85 91,7 89,7 -93,7 85,8 82,4-89,3
GENESIS UNI - Smith &
Nephew 2000 603 36 93,5 91,2-95,7 88,6 82,9-94,4
ZIMMER UNI - Zimmer 2005 328 8 97,5 95,5-99,5 - -
EFDIOS - Citieffe 2000 314 37 92,8 89,7-95,9 83,6 78,2-89,0
MITUS - ENDO-MODEL
UNI – ALL POLY - Link 2003 246 19 92,4 88,9-95,9 88,9 82,8-95,1
ALLEGRETTO UNI -
Protek-Sulzer 2000 231 17 93,6 90,2-97,0 91,1 87,0-95,2
PRESERVATION UNI –
ALL POLY - DePuy 2002 185 16 92,4 88,5-96,4 90,0 85,3-94,7
UC-PLUS SOLUTION -
Smith & Nephew 2000 177 7 97,1 94,7-99,6 - -
HLS - UNI EVOLUTION -
ALL POLY - Tornier 2001 144 9 95,3 91,7-99,0 91,0 85,0-97,0
UC-PLUS SOLUTION –
ALL POLY - Smith &
Nephew
2004 140 8 92,1 86,7-97,6 - -
UNI SIGMA HP - DePuy 2009 137 2 - - - -
JOURNEY UNI - ALL
POLY - Smith &
Nephew
2010 131 - - - - -
GKS - ONE –
Permedica 2006 128 3 97,6 94,8-100,0 - -
OPTETRAK UNI – ALL
POLY -Exactech 2005 128 2 99,1 97,3-100,0 - -
MILLER GALANTE UNI -
Zimmer 2001 118 6 96,6 93,3-99,9 92,5 86,2-98,9
Other (models with
less than 100 cases) 2000 429 47 86,9 83,1-90,7 81,4 74,9-88,0
Unknown 2000 19 1 - - - -
Total 2000 4.275 303 93,3 92,4-94,1 87,9 86,2-89,6
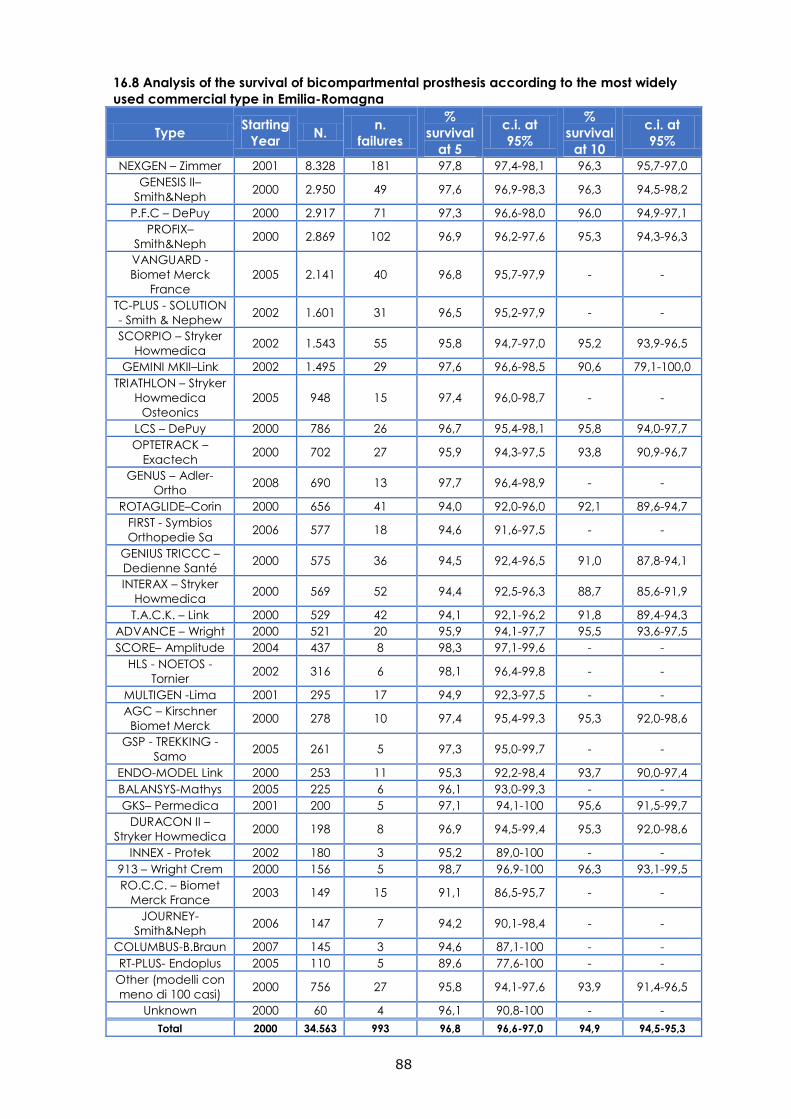
88
16.8 Analysis of the survival of bicompartmental prosthesis according to the most widely
used commercial type in Emilia-Romagna
Type Starting
Year N.
n.
failures
%
survival
at 5
c.i. at
95%
%
survival
at 10
c.i. at
95%
NEXGEN – Zimmer 2001 8.328 181 97,8 97,4-98,1 96,3 95,7-97,0
GENESIS II–
Smith&Neph 2000 2.950 49 97,6 96,9-98,3 96,3 94,5-98,2
P.F.C – DePuy 2000 2.917 71 97,3 96,6-98,0 96,0 94,9-97,1
PROFIX–
Smith&Neph 2000 2.869 102 96,9 96,2-97,6 95,3 94,3-96,3
VANGUARD -
Biomet Merck
France
2005 2.141 40 96,8 95,7-97,9 - -
TC-PLUS - SOLUTION
- Smith & Nephew 2002 1.601 31 96,5 95,2-97,9 - -
SCORPIO – Stryker
Howmedica 2002 1.543 55 95,8 94,7-97,0 95,2 93,9-96,5
GEMINI MKII–Link 2002 1.495 29 97,6 96,6-98,5 90,6 79,1-100,0
TRIATHLON – Stryker
Howmedica
Osteonics
2005 948 15 97,4 96,0-98,7 - -
LCS – DePuy 2000 786 26 96,7 95,4-98,1 95,8 94,0-97,7
OPTETRACK –
Exactech 2000 702 27 95,9 94,3-97,5 93,8 90,9-96,7
GENUS – Adler-
Ortho 2008 690 13 97,7 96,4-98,9 - -
ROTAGLIDE–Corin 2000 656 41 94,0 92,0-96,0 92,1 89,6-94,7
FIRST - Symbios
Orthopedie Sa 2006 577 18 94,6 91,6-97,5 - -
GENIUS TRICCC –
Dedienne Santé 2000 575 36 94,5 92,4-96,5 91,0 87,8-94,1
INTERAX – Stryker
Howmedica 2000 569 52 94,4 92,5-96,3 88,7 85,6-91,9
T.A.C.K. – Link 2000 529 42 94,1 92,1-96,2 91,8 89,4-94,3
ADVANCE – Wright 2000 521 20 95,9 94,1-97,7 95,5 93,6-97,5
SCORE– Amplitude 2004 437 8 98,3 97,1-99,6 - -
HLS - NOETOS -
Tornier 2002 316 6 98,1 96,4-99,8 - -
MULTIGEN -Lima 2001 295 17 94,9 92,3-97,5 - -
AGC – Kirschner
Biomet Merck 2000 278 10 97,4 95,4-99,3 95,3 92,0-98,6
GSP - TREKKING -
Samo 2005 261 5 97,3 95,0-99,7 - -
ENDO-MODEL Link 2000 253 11 95,3 92,2-98,4 93,7 90,0-97,4
BALANSYS-Mathys 2005 225 6 96,1 93,0-99,3 - -
GKS– Permedica 2001 200 5 97,1 94,1-100 95,6 91,5-99,7
DURACON II –
Stryker Howmedica 2000 198 8 96,9 94,5-99,4 95,3 92,0-98,6
INNEX - Protek 2002 180 3 95,2 89,0-100 - -
913 – Wright Crem 2000 156 5 98,7 96,9-100 96,3 93,1-99,5
RO.C.C. – Biomet
Merck France 2003 149 15 91,1 86,5-95,7 - -
JOURNEY-
Smith&Neph 2006 147 7 94,2 90,1-98,4 - -
COLUMBUS-B.Braun 2007 145 3 94,6 87,1-100 - -
RT-PLUS- Endoplus 2005 110 5 89,6 77,6-100 - -
Other (modelli con
meno di 100 casi) 2000 756 27 95,8 94,1-97,6 93,9 91,4-96,5
Unknown 2000 60 4 96,1 90,8-100 - -
Total 2000 34.563 993 96,8 96,6-97,0 94,9 94,5-95,3

89

90
PART THREE: SHOULDER PROSTHESIS
July 2008 – December 2012
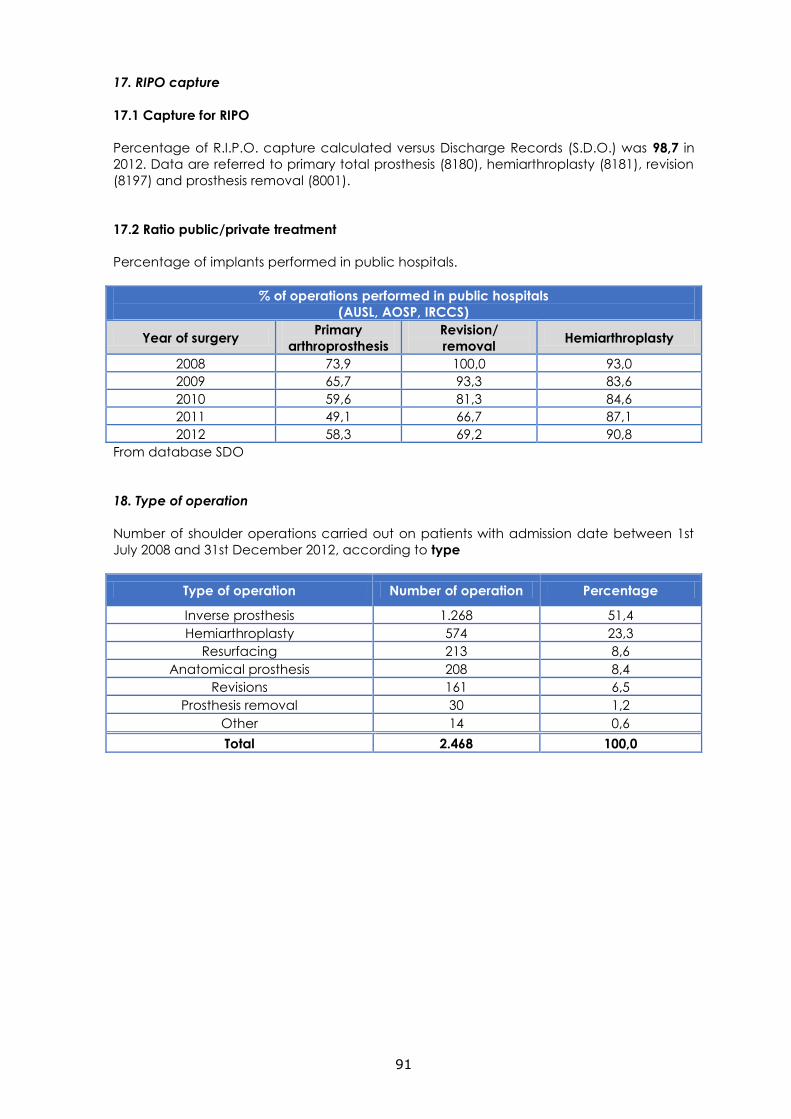
91
17. RIPO capture
17.1 Capture for RIPO
Percentage of R.I.P.O. capture calculated versus Discharge Records (S.D.O.) was 98,7 in
2012. Data are referred to primary total prosthesis (8180), hemiarthroplasty (8181), revision
(8197) and prosthesis removal (8001).
17.2 Ratio public/private treatment
Percentage of implants performed in public hospitals.
% of operations performed in public hospitals
(AUSL, AOSP, IRCCS)
Year of surgery Primary
arthroprosthesis
Revision/
removal Hemiarthroplasty
2008 73,9 100,0 93,0
2009 65,7 93,3 83,6
2010 59,6 81,3 84,6
2011 49,1 66,7 87,1
2012 58,3 69,2 90,8
From database SDO
18. Type of operation
Number of shoulder operations carried out on patients with admission date between 1st
July 2008 and 31st December 2012, according to type
Type of operation Number of operation Percentage
Inverse prosthesis 1.268 51,4
Hemiarthroplasty 574 23,3
Resurfacing 213 8,6
Anatomical prosthesis 208 8,4
Revisions 161 6,5
Prosthesis removal 30 1,2
Other 14 0,6
Total 2.468 100,0
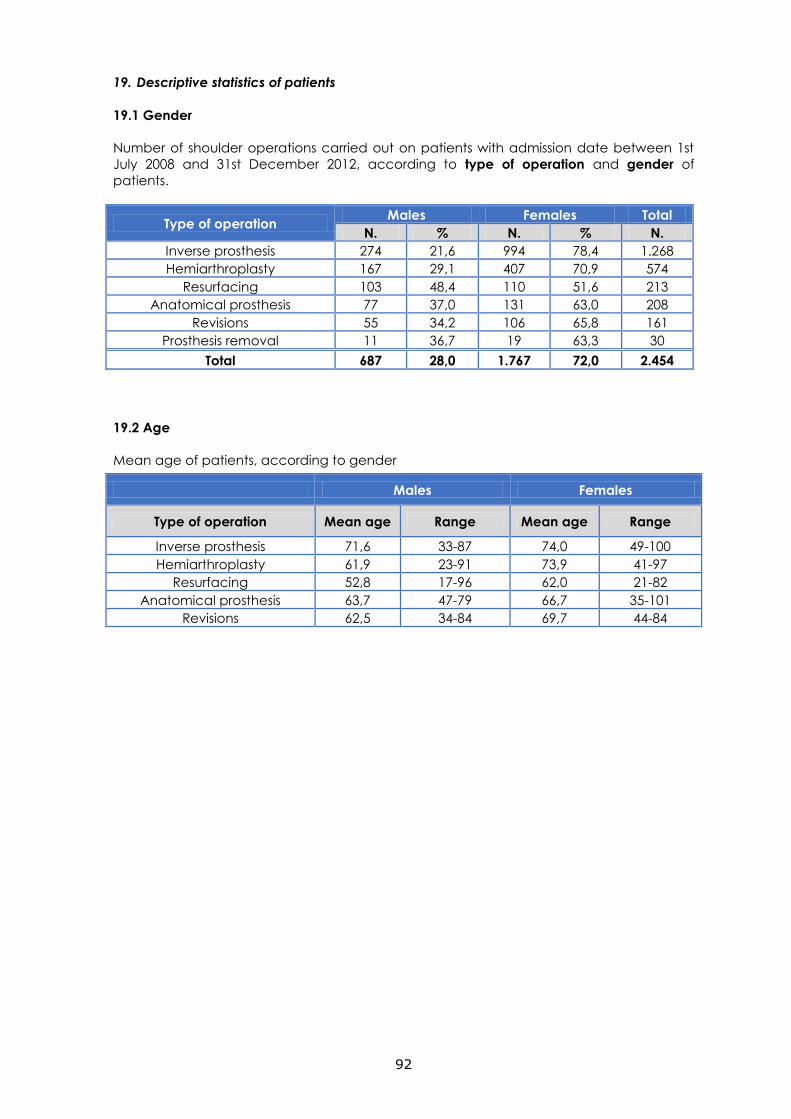
92
19. Descriptive statistics of patients
19.1 Gender
Number of shoulder operations carried out on patients with admission date between 1st
July 2008 and 31st December 2012, according to type of operation and gender of
patients.
Type of operation Males Females Total
N. % N. % N.
Inverse prosthesis 274 21,6 994 78,4 1.268
Hemiarthroplasty 167 29,1 407 70,9 574
Resurfacing 103 48,4 110 51,6 213
Anatomical prosthesis 77 37,0 131 63,0 208
Revisions 55 34,2 106 65,8 161
Prosthesis removal 11 36,7 19 63,3 30
Total 687 28,0 1.767 72,0 2.454
19.2 Age
Mean age of patients, according to gender
Males Females
Type of operation Mean age Range Mean age Range
Inverse prosthesis 71,6 33-87 74,0 49-100
Hemiarthroplasty 61,9 23-91 73,9 41-97
Resurfacing 52,8 17-96 62,0 21-82
Anatomical prosthesis 63,7 47-79 66,7 35-101
Revisions 62,5 34-84 69,7 44-84
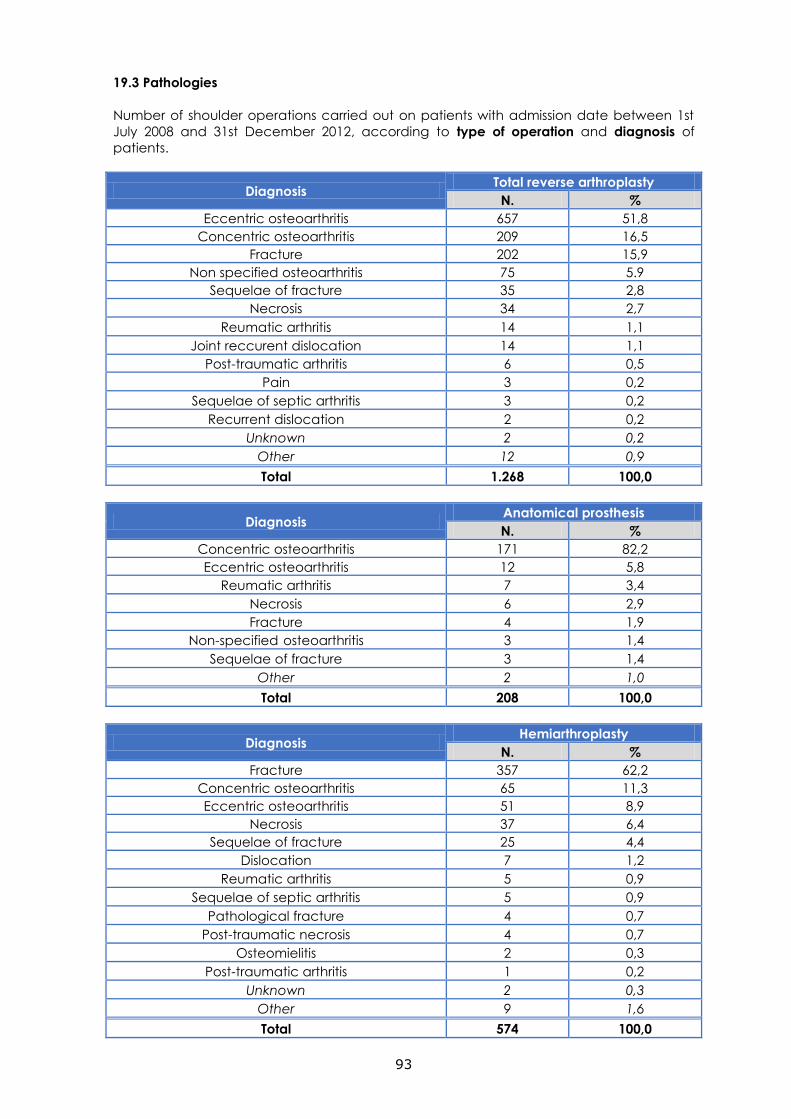
93
19.3 Pathologies
Number of shoulder operations carried out on patients with admission date between 1st
July 2008 and 31st December 2012, according to type of operation and diagnosis of
patients.
Diagnosis Total reverse arthroplasty
N. %
Eccentric osteoarthritis 657 51,8
Concentric osteoarthritis 209 16,5
Fracture 202 15,9
Non specified osteoarthritis 75 5.9
Sequelae of fracture 35 2,8
Necrosis 34 2,7
Reumatic arthritis 14 1,1
Joint reccurent dislocation 14 1,1
Post-traumatic arthritis 6 0,5
Pain 3 0,2
Sequelae of septic arthritis 3 0,2
Recurrent dislocation 2 0,2
Unknown 2 0,2
Other 12 0,9
Total 1.268 100,0
Diagnosis Anatomical prosthesis
N. %
Concentric osteoarthritis 171 82,2
Eccentric osteoarthritis 12 5,8
Reumatic arthritis 7 3,4
Necrosis 6 2,9
Fracture 4 1,9
Non-specified osteoarthritis 3 1,4
Sequelae of fracture 3 1,4
Other 2 1,0
Total 208 100,0
Diagnosis Hemiarthroplasty
N. %
Fracture 357 62,2
Concentric osteoarthritis 65 11,3
Eccentric osteoarthritis 51 8,9
Necrosis 37 6,4
Sequelae of fracture 25 4,4
Dislocation 7 1,2
Reumatic arthritis 5 0,9
Sequelae of septic arthritis 5 0,9
Pathological fracture 4 0,7
Post-traumatic necrosis 4 0,7
Osteomielitis 2 0,3
Post-traumatic arthritis 1 0,2
Unknown 2 0,3
Other 9 1,6
Total 574 100,0
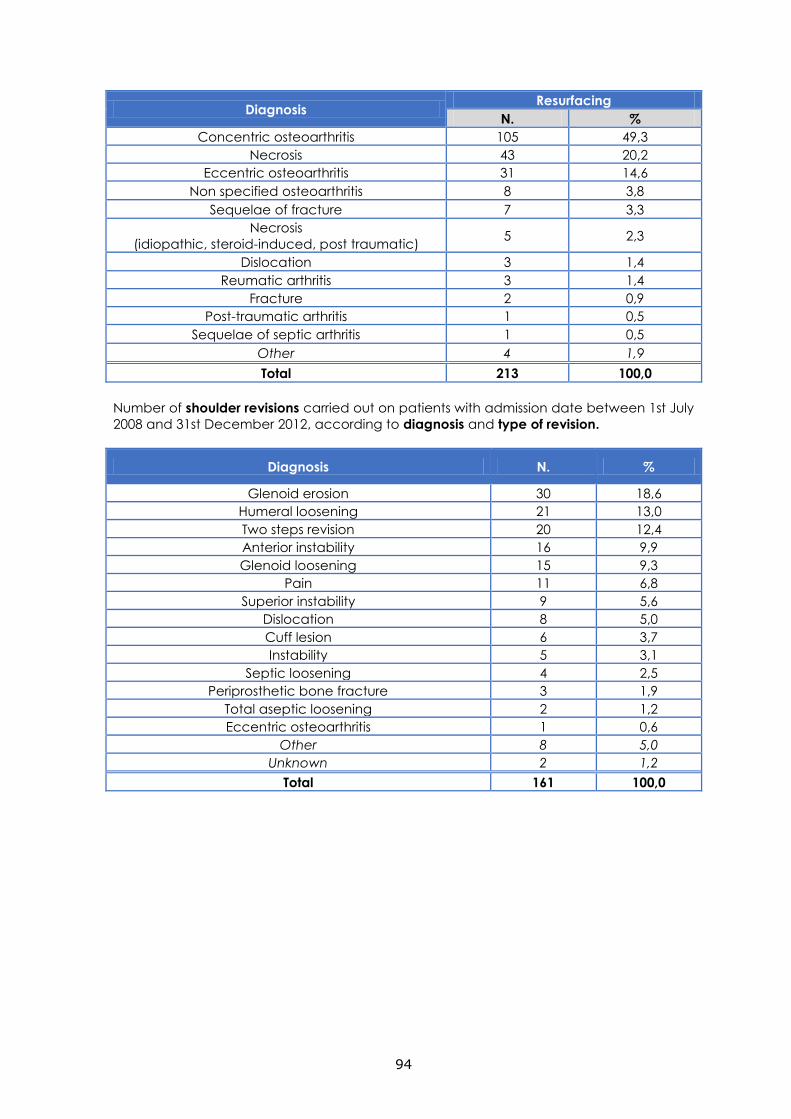
94
Diagnosis Resurfacing
N. %
Concentric osteoarthritis 105 49,3
Necrosis 43 20,2
Eccentric osteoarthritis 31 14,6
Non specified osteoarthritis 8 3,8
Sequelae of fracture 7 3,3
Necrosis
(idiopathic, steroid-induced, post traumatic) 5 2,3
Dislocation 3 1,4
Reumatic arthritis 3 1,4
Fracture 2 0,9
Post-traumatic arthritis 1 0,5
Sequelae of septic arthritis 1 0,5
Other 4 1,9
Total 213 100,0
Number of shoulder revisions carried out on patients with admission date between 1st July
2008 and 31st December 2012, according to diagnosis and type of revision.
Diagnosis N. %
Glenoid erosion 30 18,6
Humeral loosening 21 13,0
Two steps revision 20 12,4
Anterior instability 16 9,9
Glenoid loosening 15 9,3
Pain 11 6,8
Superior instability 9 5,6
Dislocation 8 5,0
Cuff lesion 6 3,7
Instability 5 3,1
Septic loosening 4 2,5
Periprosthetic bone fracture 3 1,9
Total aseptic loosening 2 1,2
Eccentric osteoarthritis 1 0,6
Other 8 5,0
Unknown 2 1,2
Total 161 100,0
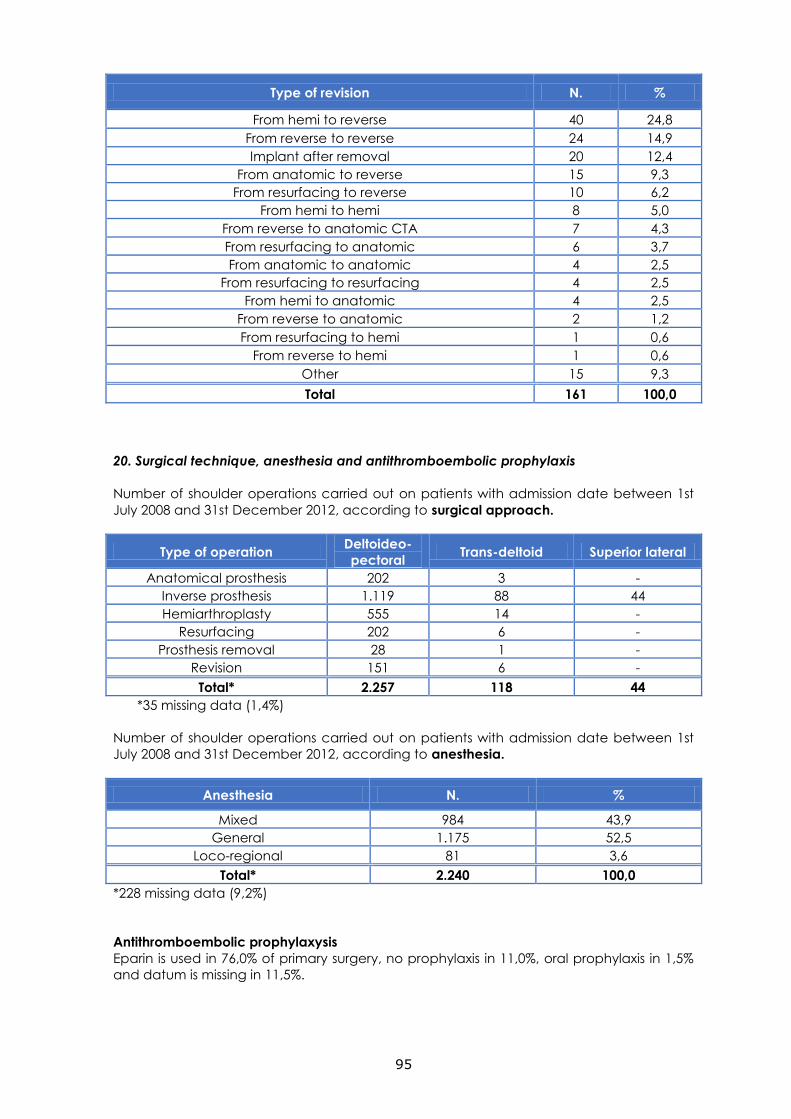
95
Type of revision N. %
From hemi to reverse 40 24,8
From reverse to reverse 24 14,9
Implant after removal 20 12,4
From anatomic to reverse 15 9,3
From resurfacing to reverse 10 6,2
From hemi to hemi 8 5,0
From reverse to anatomic CTA 7 4,3
From resurfacing to anatomic 6 3,7
From anatomic to anatomic 4 2,5
From resurfacing to resurfacing 4 2,5
From hemi to anatomic 4 2,5
From reverse to anatomic 2 1,2
From resurfacing to hemi 1 0,6
From reverse to hemi 1 0,6
Other 15 9,3
Total 161 100,0
20. Surgical technique, anesthesia and antithromboembolic prophylaxis
Number of shoulder operations carried out on patients with admission date between 1st
July 2008 and 31st December 2012, according to surgical approach.
Type of operation Deltoideo-
pectoral Trans-deltoid Superior lateral
Anatomical prosthesis 202 3 -
Inverse prosthesis 1.119 88 44
Hemiarthroplasty 555 14 -
Resurfacing 202 6 -
Prosthesis removal 28 1 -
Revision 151 6 -
Total* 2.257 118 44
*35 missing data (1,4%)
Number of shoulder operations carried out on patients with admission date between 1st
July 2008 and 31st December 2012, according to anesthesia.
Anesthesia N. %
Mixed 984 43,9
General 1.175 52,5
Loco-regional 81 3,6
Total* 2.240 100,0
*228 missing data (9,2%)
Antithromboembolic prophylaxysis
Eparin is used in 76,0% of primary surgery, no prophylaxis in 11,0%, oral prophylaxis in 1,5%
and datum is missing in 11,5%.
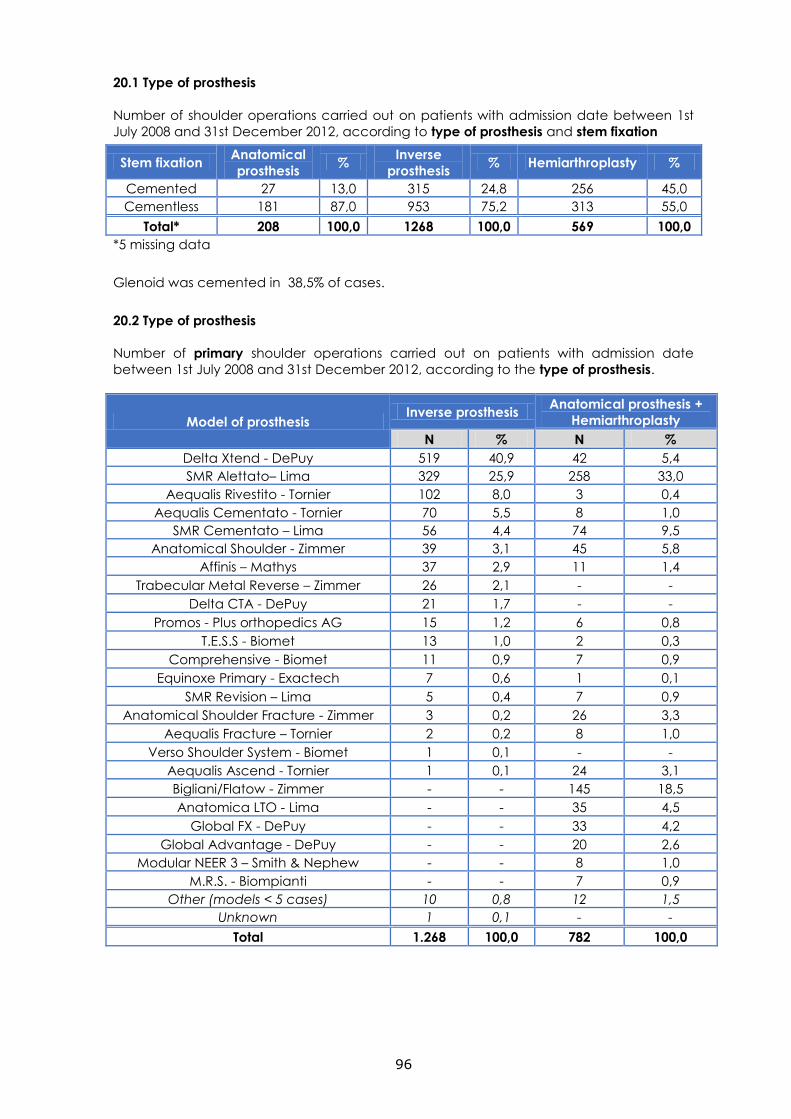
96
20.1 Type of prosthesis
Number of shoulder operations carried out on patients with admission date between 1st
July 2008 and 31st December 2012, according to type of prosthesis and stem fixation
Stem fixation Anatomical
prosthesis %
Inverse
prosthesis % Hemiarthroplasty %
Cemented 27 13,0 315 24,8 256 45,0
Cementless 181 87,0 953 75,2 313 55,0
Total* 208 100,0 1268 100,0 569 100,0
*5 missing data
Glenoid was cemented in 38,5% of cases.
20.2 Type of prosthesis
Number of primary shoulder operations carried out on patients with admission date
between 1st July 2008 and 31st December 2012, according to the type of prosthesis.
Model of prosthesis Inverse prosthesis
Anatomical prosthesis +
Hemiarthroplasty
N % N %
Delta Xtend - DePuy 519 40,9 42 5,4
SMR Alettato– Lima 329 25,9 258 33,0
Aequalis Rivestito - Tornier 102 8,0 3 0,4
Aequalis Cementato - Tornier 70 5,5 8 1,0
SMR Cementato – Lima 56 4,4 74 9,5
Anatomical Shoulder - Zimmer 39 3,1 45 5,8
Affinis – Mathys 37 2,9 11 1,4
Trabecular Metal Reverse – Zimmer 26 2,1 - -
Delta CTA - DePuy 21 1,7 - -
Promos - Plus orthopedics AG 15 1,2 6 0,8
T.E.S.S - Biomet 13 1,0 2 0,3
Comprehensive - Biomet 11 0,9 7 0,9
Equinoxe Primary - Exactech 7 0,6 1 0,1
SMR Revision – Lima 5 0,4 7 0,9
Anatomical Shoulder Fracture - Zimmer 3 0,2 26 3,3
Aequalis Fracture – Tornier 2 0,2 8 1,0
Verso Shoulder System - Biomet 1 0,1 - -
Aequalis Ascend - Tornier 1 0,1 24 3,1
Bigliani/Flatow - Zimmer - - 145 18,5
Anatomica LTO - Lima - - 35 4,5
Global FX - DePuy - - 33 4,2
Global Advantage - DePuy - - 20 2,6
Modular NEER 3 – Smith & Nephew - - 8 1,0
M.R.S. - Biompianti - - 7 0,9
Other (models < 5 cases) 10 0,8 12 1,5
Unknown 1 0,1 - -
Total 1.268 100,0 782 100,0
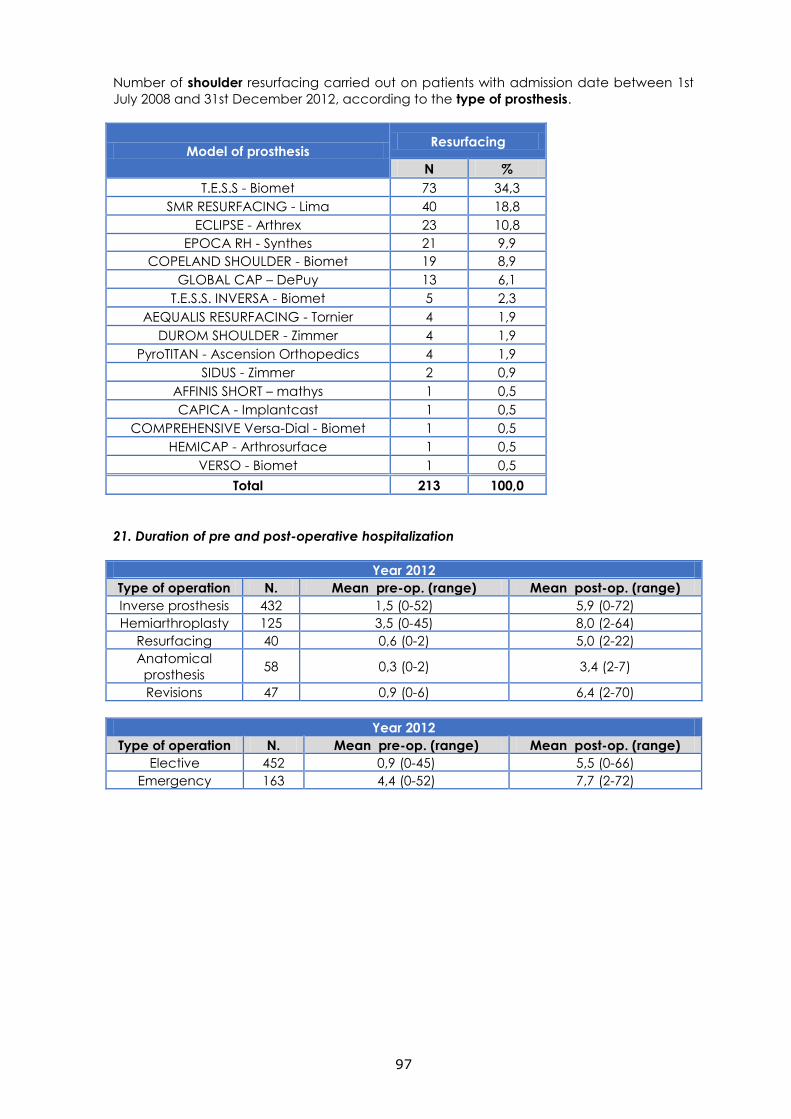
97
Number of shoulder resurfacing carried out on patients with admission date between 1st
July 2008 and 31st December 2012, according to the type of prosthesis.
Model of prosthesis Resurfacing
N %
T.E.S.S - Biomet 73 34,3
SMR RESURFACING - Lima 40 18,8
ECLIPSE - Arthrex 23 10,8
EPOCA RH - Synthes 21 9,9
COPELAND SHOULDER - Biomet 19 8,9
GLOBAL CAP – DePuy 13 6,1
T.E.S.S. INVERSA - Biomet 5 2,3
AEQUALIS RESURFACING - Tornier 4 1,9
DUROM SHOULDER - Zimmer 4 1,9
PyroTITAN - Ascension Orthopedics 4 1,9
SIDUS - Zimmer 2 0,9
AFFINIS SHORT – mathys 1 0,5
CAPICA - Implantcast 1 0,5
COMPREHENSIVE Versa-Dial - Biomet 1 0,5
HEMICAP - Arthrosurface 1 0,5
VERSO - Biomet 1 0,5
Total 213 100,0
21. Duration of pre and post-operative hospitalization
Year 2012
Type of operation N. Mean pre-op. (range) Mean post-op. (range)
Inverse prosthesis 432 1,5 (0-52) 5,9 (0-72)
Hemiarthroplasty 125 3,5 (0-45) 8,0 (2-64)
Resurfacing 40 0,6 (0-2) 5,0 (2-22)
Anatomical
prosthesis 58 0,3 (0-2) 3,4 (2-7)
Revisions 47 0,9 (0-6) 6,4 (2-70)
Year 2012
Type of operation N. Mean pre-op. (range) Mean post-op. (range)
Elective 452 0,9 (0-45) 5,5 (0-66)
Emergency 163 4,4 (0-52) 7,7 (2-72)
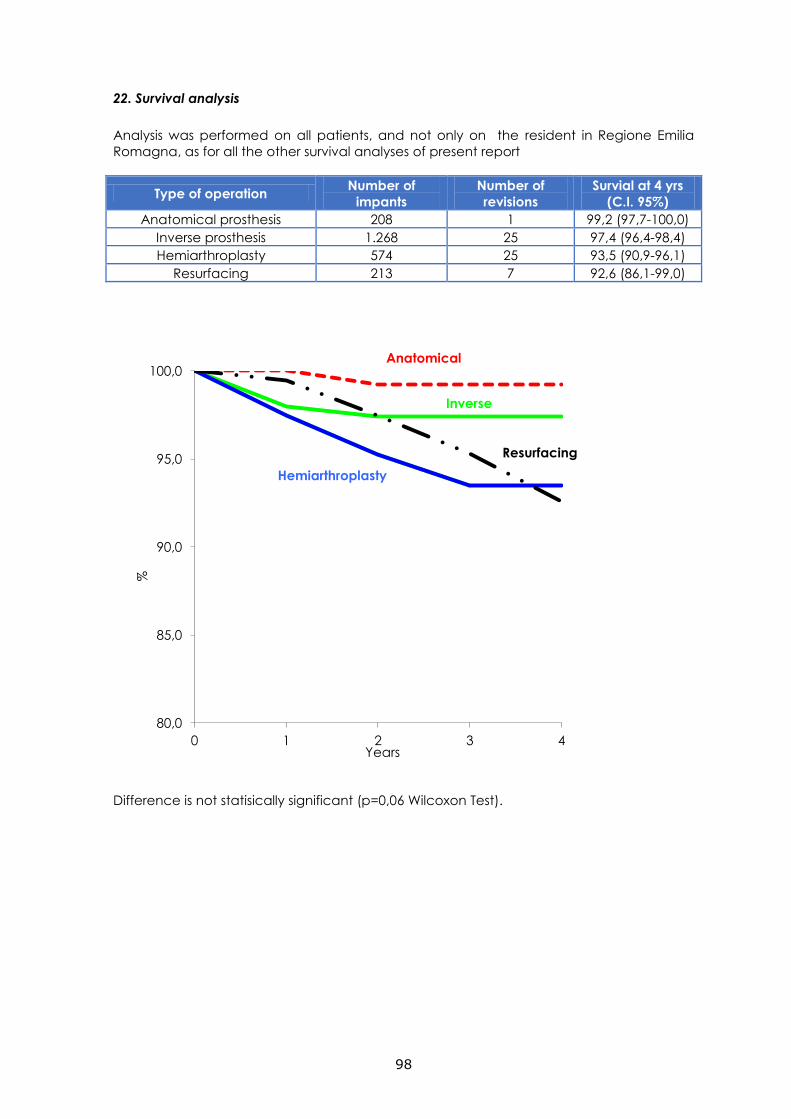
98
22. Survival analysis
Analysis was performed on all patients, and not only on the resident in Regione Emilia
Romagna, as for all the other survival analyses of present report
Type of operation Number of
impants
Number of
revisions
Survial at 4 yrs
(C.I. 95%)
Anatomical prosthesis 208 1 99,2 (97,7-100,0)
Inverse prosthesis 1.268 25 97,4 (96,4-98,4)
Hemiarthroplasty 574 25 93,5 (90,9-96,1)
Resurfacing 213 7 92,6 (86,1-99,0)
Difference is not statisically significant (p=0,06 Wilcoxon Test).
80,0
85,0
90,0
95,0
100,0
0 1 2 3 4
%
Years
Anatomical
Inverse
Hemiarthroplasty
Resurfacing
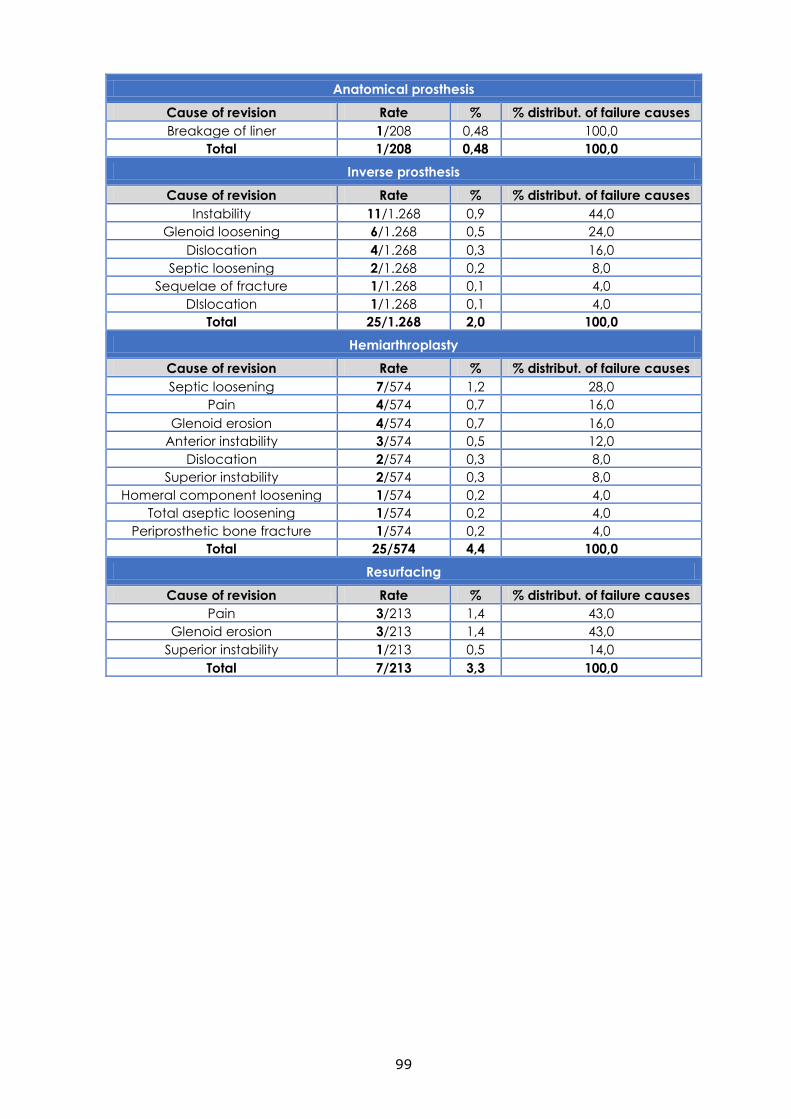
99
Anatomical prosthesis
Cause of revision Rate % % distribut. of failure causes
Breakage of liner 1/208 0,48 100,0
Total 1/208 0,48 100,0
Inverse prosthesis
Cause of revision Rate % % distribut. of failure causes
Instability 11/1.268 0,9 44,0
Glenoid loosening 6/1.268 0,5 24,0
Dislocation 4/1.268 0,3 16,0
Septic loosening 2/1.268 0,2 8,0
Sequelae of fracture 1/1.268 0,1 4,0
DIslocation 1/1.268 0,1 4,0
Total 25/1.268 2,0 100,0
Hemiarthroplasty
Cause of revision Rate % % distribut. of failure causes
Septic loosening 7/574 1,2 28,0
Pain 4/574 0,7 16,0
Glenoid erosion 4/574 0,7 16,0
Anterior instability 3/574 0,5 12,0
Dislocation 2/574 0,3 8,0
Superior instability 2/574 0,3 8,0
Homeral component loosening 1/574 0,2 4,0
Total aseptic loosening 1/574 0,2 4,0
Periprosthetic bone fracture 1/574 0,2 4,0
Total 25/574 4,4 100,0
Resurfacing
Cause of revision Rate % % distribut. of failure causes
Pain 3/213 1,4 43,0
Glenoid erosion 3/213 1,4 43,0
Superior instability 1/213 0,5 14,0
Total 7/213 3,3 100,0