Embed Size (px)
Citation preview
REGIONAL INPUT-OUTPUT ANALYSIS: APPLICATION ON RURAL REGIONS IN
GERMANY, THE CZECH REPUBLIC AND GREECE
Vilém Semerák1*, Kresimir Zigic1, Efstratios Loizou2, Antoaneta Golemanova-Kuharova3
1 CERGE-EI, Politických vězňů 7, Praha 1, 111 21, Czech Republic 2 Department of Agricultural Products Marketing and Quality Control, TEI of Western Macedonia -
Florina branch, Terma Kondopoulou, 53100 Florina, Greece 3 Univerza v Ljubljani, Biotehniška fakulteta, Jamnikarjeva 101, SI-1000 Ljubljana
* Corresponding author: E-mail: [email protected], Telephone No.: +420 224 005 167
Paper prepared for presentation at the 118th seminar of the EAAE
(European Association of Agricultural Economists),
‘Rural development: governance, policy design and delivery’
Ljubljana, Slovenia, August 25-27, 2010
This work draws on research for the project FOODIMA, financed by the 6th EU framework program (SSPE-CT-2006-044283)
Copyright 2010 by Vilém Semerák. All rights reserved. Readers may make verbatim copies of this document for non-commercial purposes by any means, provided that this copyright notice appears on all such copies.
Abstract:
While agriculture definitely is a traditional and important sector of national economy, it is also a sector the importance of which is often underestimated. More correct and realistic description of its economic role should be based on input-output methods. Unfortunately, regional level input-output tables are only rarely available. We therefore apply modified GRIT regionalization methodology on a remote rural NUTS 2 level region in three different countries (Germany, Greece, and the Czech Republic respectively) and demonstrate that this approach makes regional-level input-output analysis a viable tool in realistic evaluation of contribution of the agri-food production chain for local economies. We provide empirical results that enable us to describe the importance of regional role of agriculture (both individually and in combination with down-stream sectors) more realistically. Our research based on application of regional level input-output methods clearly demonstrates that the importance of agri-food production chain especially for remote regions remains very high – even for heavily industrialized countries; and its demise would lead to dramatic structural shocks. Keywords: input-output analysis, regionalization, intersectoral linkages, GRIT JEL classification: C67, Q11 1. Introduction
Economic role of agriculture is often described just by simple indicators such as its share in total employment or total value added. This simplistic view together with the fact that the agricultural sector seems to plays low and declining role in total employment and total economic activities of most industrial countries makes it easy to criticize and even to ridicule policies focused on support of the sector (such as the Common Agricultural Policy).
We believe that it is impossible to analyze and describe the real importance of a sector for both national and regional economies without proper analysis of its position and role in the network of intersectoral relations and that analysis necessary for responsible approach to the development of regional development strategies should always include analysis of intersectoral linkages. Application of economic policies designed without accounting for the relations with down-stream (and up-stream) sectors may lead to deep structural shocks with extreme welfare implications especially for less developed regions.
Application of this kind of analysis on the regional level ideally requires the knowledge of regional input-output tables (RIOT). Unfortunately, the costs (and time requirements) of constructing RIOTs directly from surveys and primary data are often prohibitive. Estimates of RIOTs based on methods less intensive in the required input data can be therefore extremely useful. Our paper is based on research carried out within the framework of Workpackage 6 of Foodima research project1
The paper is organized as follows: section 2 provides brief introduction into methodology; description of the three analyzed regions, and of the rationale for their selection is provided in section 3; section 4 describes sources of data and the applied regionalization procedure. Section 5 deals with the place of agriculture in the agro-food production chain and explains the effects of aggregation on the model of food production chain and necessary simplification. Section 6 contains results of traditional impact analysis of the role of the individual sectors of the agro-food sectors derived from the estimated RIOTs (linkage coefficients and elasticities), section 7 provides complex estimates of the
. The output of the research project includes detailed description of the modified methodology of estimation of RIOT based on the modified GRIT methodology with Flegg and Webber (2000) location quotients, describes application of the methodology on three remote/rural regions in Greece, Germany, and the Czech Republic (Ipeiros, Mecklenburg-Vorpommern, and Jihovýchod region respectively) and provides estimates of regional input-output tables as well as analytical indicators derived from the tables. This paper presents only a fraction of our results; the more complete results are described in output (deliverables 6.1, 6.2, and 6.3) of the Foodima project.
1 Project FOODIMA was financed by the 6th EU framework program (SSPE-CT-2006-044283).
joint importance of the whole production chain based on hypothetical extraction methodology. Section 8 attempts to evaluate simple scenarios of future development, section 9 concludes.
2. Methodology
Our paper is based on the estimation of regional input-output table and subsequent application of standard analytical tools used for evaluation of intersectoral linkages in the regional economy. Theory applied in the paper therefore comes from two main streams: (i) input-output literature that provides methodology for the analysis of importance of individual or multiple sectors in the form of linkage multipliers, income, employment and output elasticities, and hypothetical extraction. (ii) research on estimation of regionalization input-output tables based on national level input-output tables. While the first stream of literature originally dealt mainly with analysis at national level, the second stream of research searches for applicable and cost-efficient ways how to estimate regional input-output tables (RIOT).
The first stream of literature owes its origin to Wassily Leontief (with due credit to Quesnay’s “tableau economique” from 1758). The basic input-output analysis has been further developed in many directions, in our paper we primarily use the traditional input-output analysis supplemented with more modern versions of indicators of influence and importance of individual sectors – traditional simple Chenery-Watanabe (1958) direct linkages, Rassmusen and Hirschman multipliers for output, employment and income, Mattas and Shrestha (1991) elasticities, as well as Roberts (1994) and Papadas & Dahl (1999) supply driven linkages. Hypothetical extraction approach is then used to analyze joint importance of the sectors linked by the food production chain. 2.1 Regionalization Methodology2
It is possible to derive RIOTs in the same way as national input-output tables, i.e. with the use of detailed survey based data. This method is theoretically superior to the further mentioned alternatives as it relies on much less restrictive assumptions related to similarities of regional and national technologies. Unfortunately, deriving RIOT in this way remains prohibitively expensive for most common application.
An alternative approach consists in application of non-survey based methods. The gist of these approaches consists in attempts to adapt the national input-output tables with the use of location quotients derived from differences of regional and national employment and production patterns. There are multiple way how to define the location quotients and derive the resulting estimated table, we apply an advanced approach based on GRIT (Generation of Regional Input-Output Tables) methodology which is trying to merge positive aspects of survey and non-survey methods – it can be used to derive RIOTs without the need for expensive and time-consuming surveys, but additional superior data (if available) may be inserted into the algorithm in order to improve the quality of results.
Simple location quotients:
∑
∑
=
== n
i
Ni
Ni
n
i
Ri
Ri
i
XX
XXSLQ
1
1
Cross-industry location quotients: j
iij SLQ
SLQCILQ =
Flegg at al. location quotients: λ⋅= ijij CILQFLQ
where: δ
λ
+= ∑∑
==
n
i
Ni
n
i
Ri EE
112 1log with 10 <≤ δ ; 10 ≤≤ λ
XiR (Xi
N) is regional (national) indicator used for regionalization (output or employment) in sector i and Ei
R (EiN) is regional (national) employment in sector i.
2 More detailed description and analysis of the linkage indicators is provided in the original deliverable 6.1 of the Foodima project.
While older approaches to regionalization were often based on simple location quotients (SLQ) or cross-industry location quotients (CILQ) derived from structure of employment, we use a modification of the GRIT procedure that relies on Flegg & Webber (2000) location quotients. The advantage of Flegg et al. location quotients consists in better use of information about employment structures in the analyzed region, because unlike the simple versions this form of location quotients it simultaneously includes information about the relative size of supplying sector, the relative size of the purchasing sector, and the relative size of the region. 2.2. Impact Analysis: Linkage Indicators, Multipliers, and Elasticities3
What differentiates IOT based analysis from other approaches is the inherent ability to estimate indirect effects (effects on the value of inputs from backward-linked sectors in additional rounds of spending) and with proper closure also induced effects (value of increased spending by households caused by higher/lower income) of shocks to output of individual sectors. Depending on which of these effects are included in the analysis we can define Type I and Type II multipliers:
effectdirecteffectindirecteffectdirectmultiplierIType +
=
effectdirecteffectinducedeffectindirecteffectdirectmultiplierIIType ++
=
Although we also experimented with simple closure rules (schematic consumption function) and calculated some Type II multiplier, only the more standard and less ambiguous Type I multiplier are reported in our results. 2.3. Hypothetical Extraction
In order to deal with the possible objection of inability to judge the real regional influence of the individual stages of the food production chain by analyzing the standard backward linkage multipliers and elasticities4, we decided to apply the hypothetical extraction method. This method has an additional advantage because we can also use it as a baseline critical scenario that analyzes what happens in a case of complete destruction of local production of food products in the region. 5 The logic of the method is very simple; it consists in examination of effects of the following modifications of the estimated regional input output table:
1. Elimination of the sector(s)’ production in the region means that the vector describing the demand for intermediate inputs of the sector is turned into a zero vector. 2. Supply of the sector to other sectors (intermediate products) as well as to final demand is added to the imports of the region. Proper approach to the elimination of sectors from the RIOT makes it possible to estimate joint importance of several linked sectors without the danger of not accounting properly for the overlaps in indirect effects that is likely to happen if we simply aggregate estimated linkage indicators instead. Our impact analysis is based on four different sets of indicators: 1. Chenery and Watanabe backward linkage coefficient (direct effects) 2. Rasmussen and Hirschman I-O multipliers for output, income and employment which describe total (direct + indirect) aggregate effect of a unit change in demand for output of individual sector on output (income, employment). 3. Mattas & Shrestha elasticities which account for relative size of sectors and describe percentage change in the total aggregate output (income, employment) caused by percentage change in final demand for individual sectors. 4. Supply-driven I-O linkages based on Papadas and Dahl (1999) and Roberts (1994). 3 See the delirable 6.1 of the Foodima project for more details. 4 Simply adding together the results for individual sectors does not lead to consistent results (it tends to generate overestimated effects). 5 This scenario is highly improbable and can only be relevant for large-scale environmental disasters, but it provides absolute lower bound for the estimates of future development of the sector.
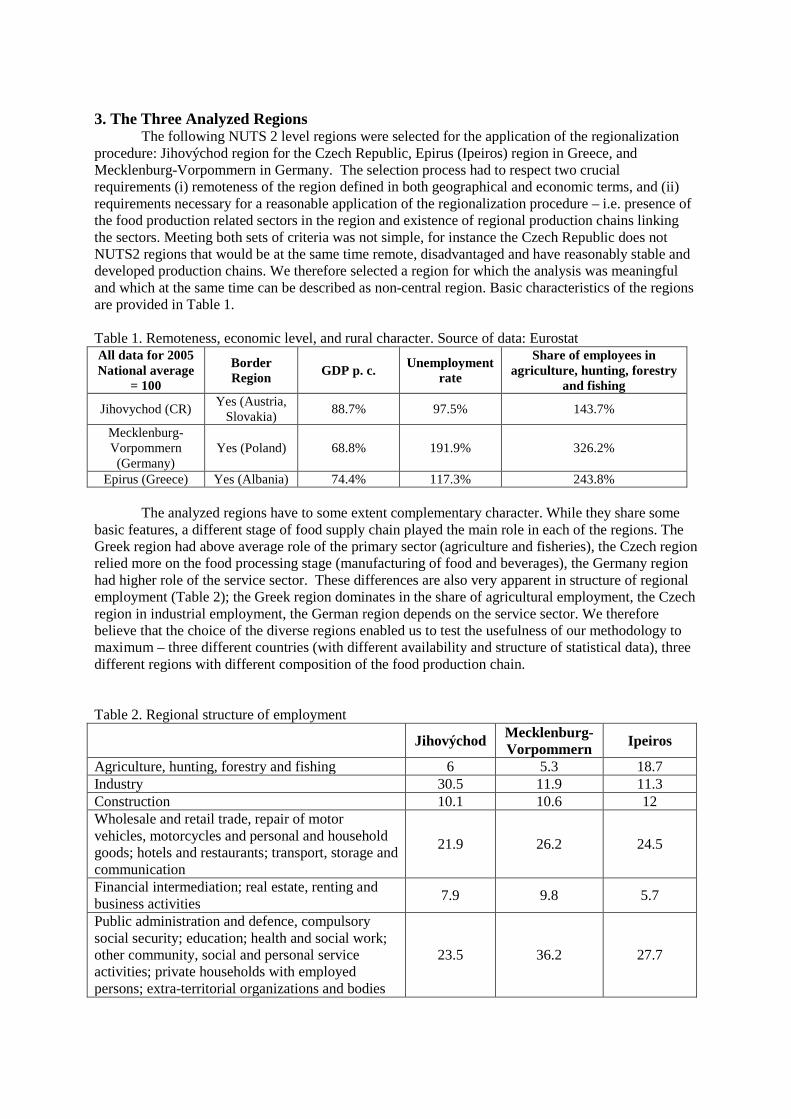
3. The Three Analyzed Regions
The following NUTS 2 level regions were selected for the application of the regionalization procedure: Jihovýchod region for the Czech Republic, Epirus (Ipeiros) region in Greece, and Mecklenburg-Vorpommern in Germany. The selection process had to respect two crucial requirements (i) remoteness of the region defined in both geographical and economic terms, and (ii) requirements necessary for a reasonable application of the regionalization procedure – i.e. presence of the food production related sectors in the region and existence of regional production chains linking the sectors. Meeting both sets of criteria was not simple, for instance the Czech Republic does not NUTS2 regions that would be at the same time remote, disadvantaged and have reasonably stable and developed production chains. We therefore selected a region for which the analysis was meaningful and which at the same time can be described as non-central region. Basic characteristics of the regions are provided in Table 1. Table 1. Remoteness, economic level, and rural character. Source of data: Eurostat All data for 2005 National average
= 100
Border Region GDP p. c. Unemployment
rate
Share of employees in agriculture, hunting, forestry
and fishing
Jihovychod (CR) Yes (Austria, Slovakia) 88.7% 97.5% 143.7%
Mecklenburg-Vorpommern (Germany)
Yes (Poland) 68.8% 191.9% 326.2%
Epirus (Greece) Yes (Albania) 74.4% 117.3% 243.8%
The analyzed regions have to some extent complementary character. While they share some basic features, a different stage of food supply chain played the main role in each of the regions. The Greek region had above average role of the primary sector (agriculture and fisheries), the Czech region relied more on the food processing stage (manufacturing of food and beverages), the Germany region had higher role of the service sector. These differences are also very apparent in structure of regional employment (Table 2); the Greek region dominates in the share of agricultural employment, the Czech region in industrial employment, the German region depends on the service sector. We therefore believe that the choice of the diverse regions enabled us to test the usefulness of our methodology to maximum – three different countries (with different availability and structure of statistical data), three different regions with different composition of the food production chain.
Table 2. Regional structure of employment
Jihovýchod Mecklenburg-Vorpommern Ipeiros
Agriculture, hunting, forestry and fishing 6 5.3 18.7 Industry 30.5 11.9 11.3 Construction 10.1 10.6 12 Wholesale and retail trade, repair of motor vehicles, motorcycles and personal and household goods; hotels and restaurants; transport, storage and communication
21.9 26.2 24.5
Financial intermediation; real estate, renting and business activities 7.9 9.8 5.7
Public administration and defence, compulsory social security; education; health and social work; other community, social and personal service activities; private households with employed persons; extra-territorial organizations and bodies
23.5 36.2 27.7

4. Data and Procedures
Regionalization was based on data for 2005 for all three regions. This decision was dictated by the availability of sufficiently detailed symmetric input-output tables for the three countries. The national input-output tables for domestic flows which were used as the starting point for the estimation of regional tables were in all three cases taken from Eurostat. They had very similar structure and methodology: 59 sectors, basic values (current prices).
Differences can be found mainly in the quality and the level of detail of data on regional and national structure of employment which we were able to obtain. Data necessary for calculations of the location quotients came from much more diverse sources and initially had fairly different level of detail. Indeed the availability and reliability of data seems to be biggest weakness of the application of GRIT methodology. We were able to get the most detailed data for Greece (data structured to 88 sectors at both national and regional level) and relatively least detailed data for the Mecklenburg-Vorpommern region of Germany (see Table 3 for details). The main reason for the problems with availability of data on regional employment structures were issues related with protection of sensitive business data – the numbers of firms in some of the sectors even at the level of NUTS2 regions reaches critical minimum that prevents the national statistical offices from disclosing more detailed data. In all three cases we were working with two sources of data – regional statistical offices and Eurostat:
• In the case of the Czech Republic we used regional data from regional statistical yearbooks for NUTS3 subregions of the analyzed NUTS2 regions (Statistická ročenka Jihomoravského kraje – 2008 and Statistická ročenka kraje Vysočina – 2008)
• In the case of Germany we used data from Eurostat, German Statistical Office and regional Statistical Office (Statistisches Amt Mecklenburg-Vorpommern)
• For the Greek region we gained access to very detailed data on regional employment for the Greek Statistical Office. The level of detail was higher than of the available national input-output tables (88 sectors).
Table 3. Comparison of data used for regionalization Czech Republic Germany Greece No of sectors 59x59 Technology assumption Product by product Year 2005 Intermediate flows Domestic Employment data 2005 (29 sectors) 2005 (18 sectors) 2008 (88 sectors) Source Czech Statistical
Office Eurostat, own
estimation Labour Force, 2008
Besides the data on structures of employment we also gathered data on value added, incomes
and numbers of enterprises in the sectors. These were used for checks of consistency of the results. The need for comparability of the results forced us to estimate a more aggregated version of the regional input-output tables that it would have been possible to estimate e.g. for Greece. The initial aggregation to 18 sectors (20 in the case of the Czech Republic) was done before the application of the regionalization procedure. Figure 1 in section 4.2 describes the resulting structure of the regional tables for the three analyzed regions. 4.1. Crucial Technical Details of the Applied Regionalization Procedures
The regionalized tables were derived from national input-output tables with provided by Eurostat. Regionalization was in all three cases based on data on employment structures, no survey data were used. Aggregation of the original tables according to the available employment data was carried out before the regionalization.
Regionalization was based on the application of Flegg location quotients (FLQ) for the 1st quadrant and simple location quotients (SLQ) for 2nd and 3rd quadrants, remaining vectors were estimated as residuals. The theoretical methodology developed in deliverable 6.1 was transformed into
an algorithm programmed in GAUSS software by Dr. Golemanova-Kuharova and Dr. Kuhar. While the program calculated results and search for optimal weights used in the FLQs, the results were subsequently sorted and checked for consistency by participating researchers.
In the Czech case we had to aggregate the original national input-output table to 20 sectors although we had regional employment data at the level of detail of 29 sectors because we wanted to achieve consistency with the results for Germany. The regionalization was based on structures of employment, no superior (primary) data were used. The resulting optimal level of δ used in the applied Flegg location quotients was determined to be 0.168.
In the German case the original national input-output table was aggregated to 18 sectors because of the low level of detail of available regional data. The regionalization was based on structures of employment, no superior (primary) data were used. The resulting optimal level of δ used in the applied Flegg location quotients was determined to be 0.21.
Although it would have been possible to estimate more detailed RIOT for the Greek region, we decided to aggregate the NIOT to 18 sectors even though we had even more detailed employment data (88 sectors). This was necessary in order to guarantee consistence with the other two regional tables while respecting the structure of the region’s economy. The regionalization was based on structures of employment, no superior (primary) data were used. The resulting optimal level of δ used in the applied Flegg location quotients was determined to be 0.03. 4.2. Estimated Regional Input-Output Tables
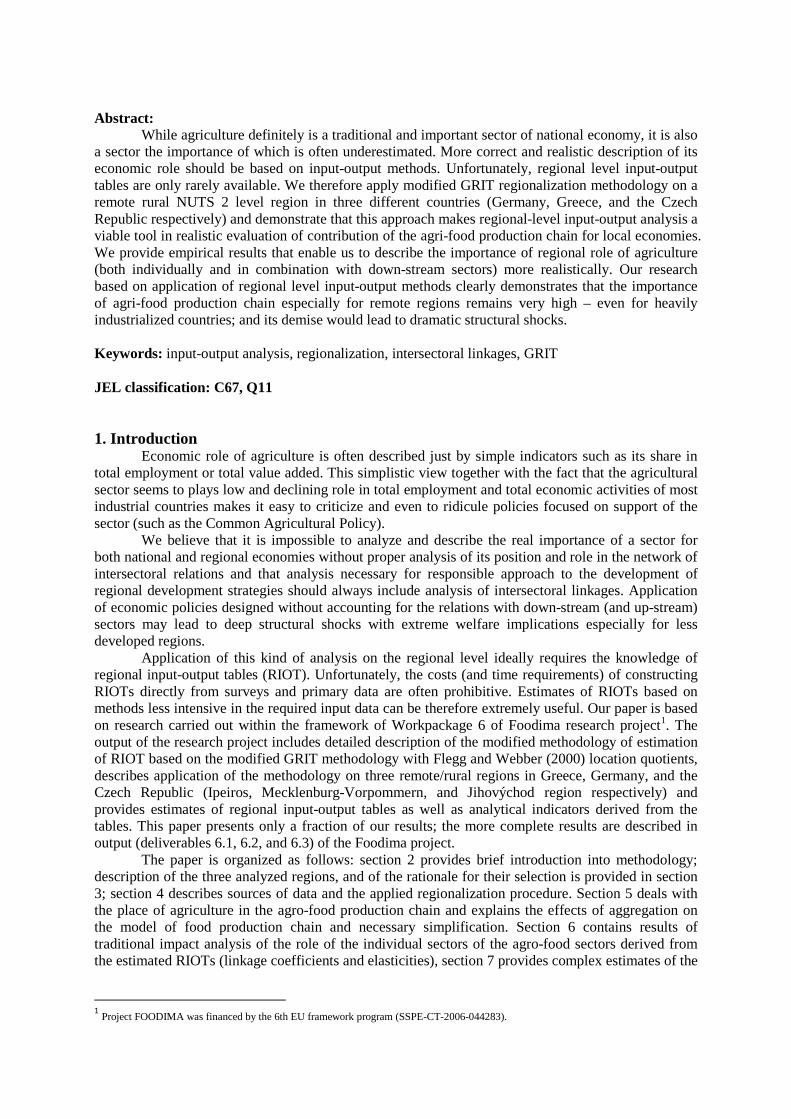
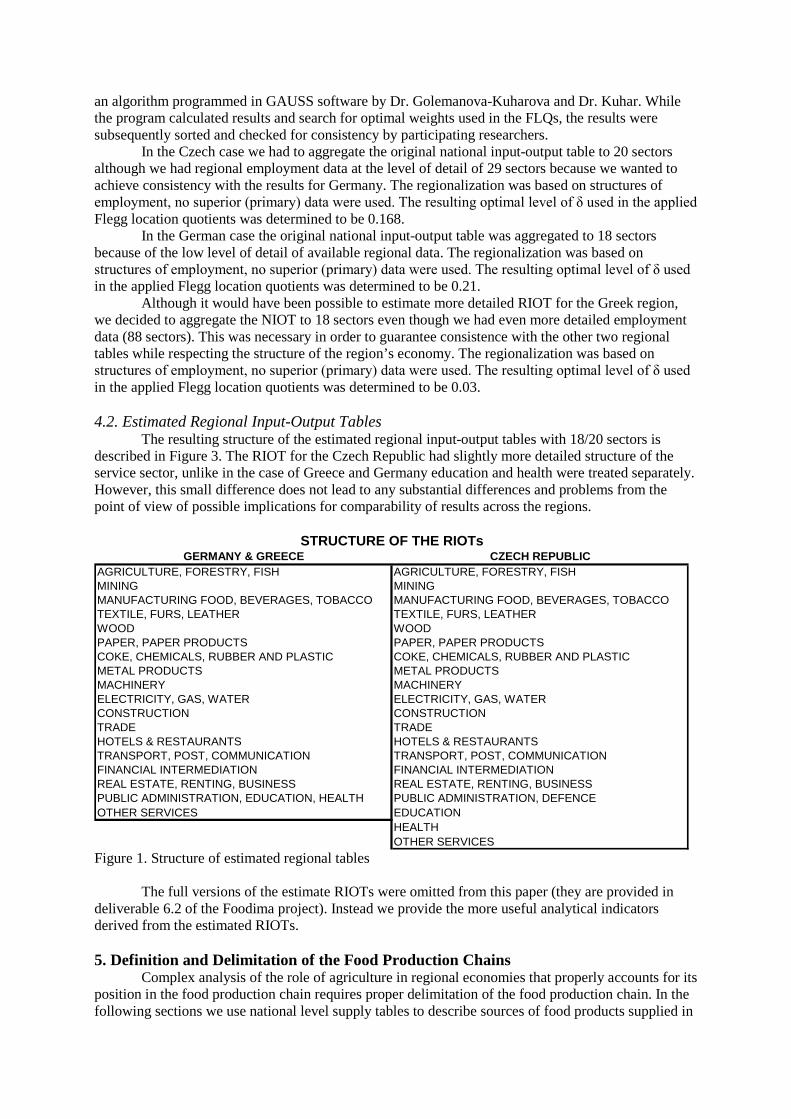
The resulting structure of the estimated regional input-output tables with 18/20 sectors is described in Figure 3. The RIOT for the Czech Republic had slightly more detailed structure of the service sector, unlike in the case of Greece and Germany education and health were treated separately. However, this small difference does not lead to any substantial differences and problems from the point of view of possible implications for comparability of results across the regions.
GERMANY & GREECE CZECH REPUBLICAGRICULTURE, FORESTRY, FISH AGRICULTURE, FORESTRY, FISHMINING MININGMANUFACTURING FOOD, BEVERAGES, TOBACCO MANUFACTURING FOOD, BEVERAGES, TOBACCOTEXTILE, FURS, LEATHER TEXTILE, FURS, LEATHERWOOD WOODPAPER, PAPER PRODUCTS PAPER, PAPER PRODUCTSCOKE, CHEMICALS, RUBBER AND PLASTIC COKE, CHEMICALS, RUBBER AND PLASTICMETAL PRODUCTS METAL PRODUCTSMACHINERY MACHINERYELECTRICITY, GAS, WATER ELECTRICITY, GAS, WATERCONSTRUCTION CONSTRUCTIONTRADE TRADEHOTELS & RESTAURANTS HOTELS & RESTAURANTSTRANSPORT, POST, COMMUNICATION TRANSPORT, POST, COMMUNICATIONFINANCIAL INTERMEDIATION FINANCIAL INTERMEDIATIONREAL ESTATE, RENTING, BUSINESS REAL ESTATE, RENTING, BUSINESSPUBLIC ADMINISTRATION, EDUCATION, HEALTH PUBLIC ADMINISTRATION, DEFENCEOTHER SERVICES EDUCATION
HEALTHOTHER SERVICES
STRUCTURE OF THE RIOTs
Figure 1. Structure of estimated regional tables
The full versions of the estimate RIOTs were omitted from this paper (they are provided in deliverable 6.2 of the Foodima project). Instead we provide the more useful analytical indicators derived from the estimated RIOTs. 5. Definition and Delimitation of the Food Production Chains
Complex analysis of the role of agriculture in regional economies that properly accounts for its position in the food production chain requires proper delimitation of the food production chain. In the following sections we use national level supply tables to describe sources of food products supplied in
the countries and input-output to analyze direct intersectoral linkages and describe necessary simplifications that had to be adopted because of higher degree of aggregation of the regional tables. 5.1. Supply of Food Products by Main Contributing Sectors
Supply of food products in all three countries is dominated by sector “manufacture of food products and beverages” and by imports. Table 4 describes the role of the main sectors in all three countries. It shows that the food and beverages manufacture sector supplies about 75-76% of all food products, another 21-22% are imported. This result is very similar for all three analyzed countries. As far as differences are concerned, Greece has substantially more important role of agriculture in the total supply. Table 4. Share of sectors in total supply of food products and beverages, 2006, basic prices
2006, % Agricult
ure, hunting
Fishing, etc.
Manufacture of food
products and beverages
Manufacture of chemicals and chemical
products
Wholesale trade and
commission trade
Retail trade, except of
motor vehicles and motorcycles;
Hotels and restaurants Imports
Greece 2.09 0 75.68 0.05 0.04 0 0 22.12 Germany 0.01 0 76.91 0.23 0.88 0.08 0.31 21.54 Czech Republic 0.88 0.06 75.64 0.10 0.80 0.86 0.01 21.09
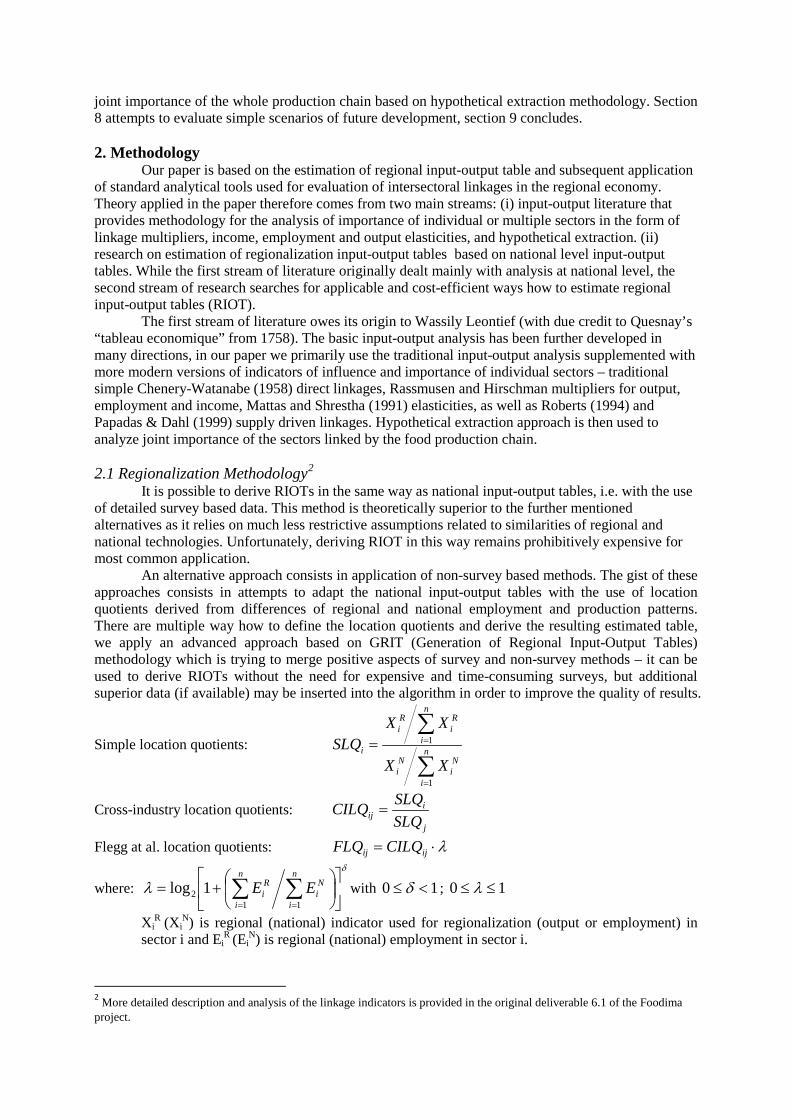
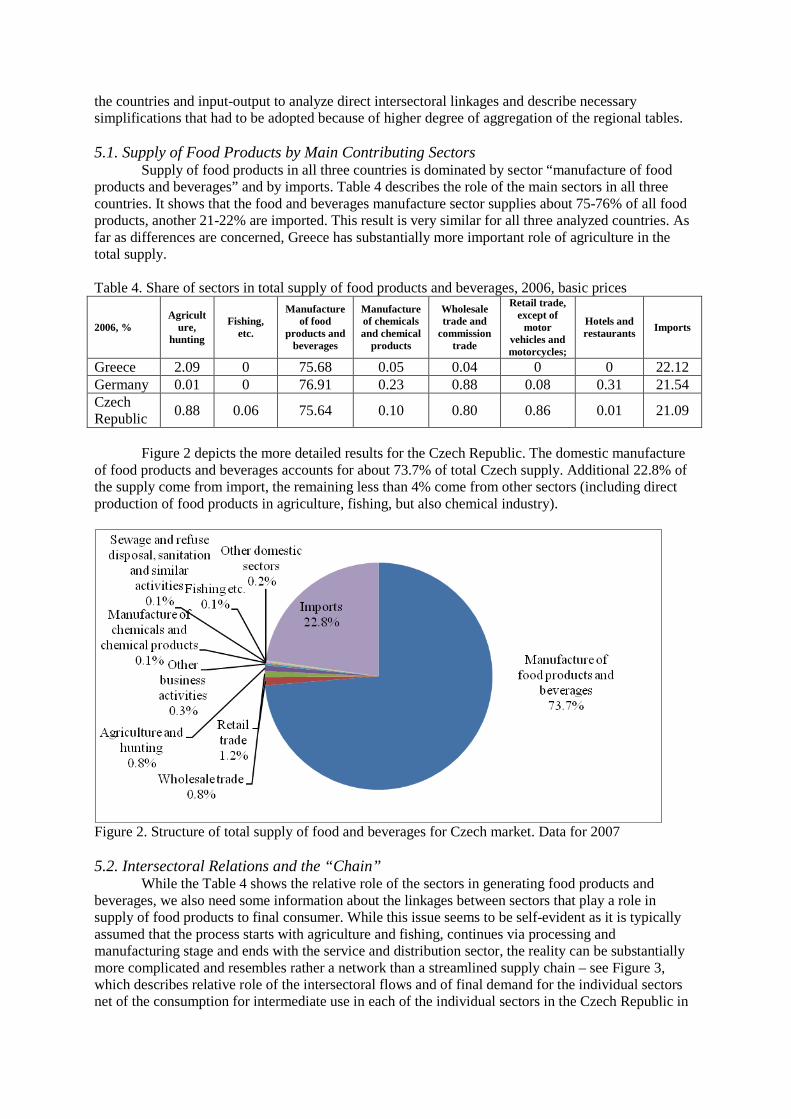
Figure 2 depicts the more detailed results for the Czech Republic. The domestic manufacture
of food products and beverages accounts for about 73.7% of total Czech supply. Additional 22.8% of the supply come from import, the remaining less than 4% come from other sectors (including direct production of food products in agriculture, fishing, but also chemical industry).
Figure 2. Structure of total supply of food and beverages for Czech market. Data for 2007 5.2. Intersectoral Relations and the “Chain”
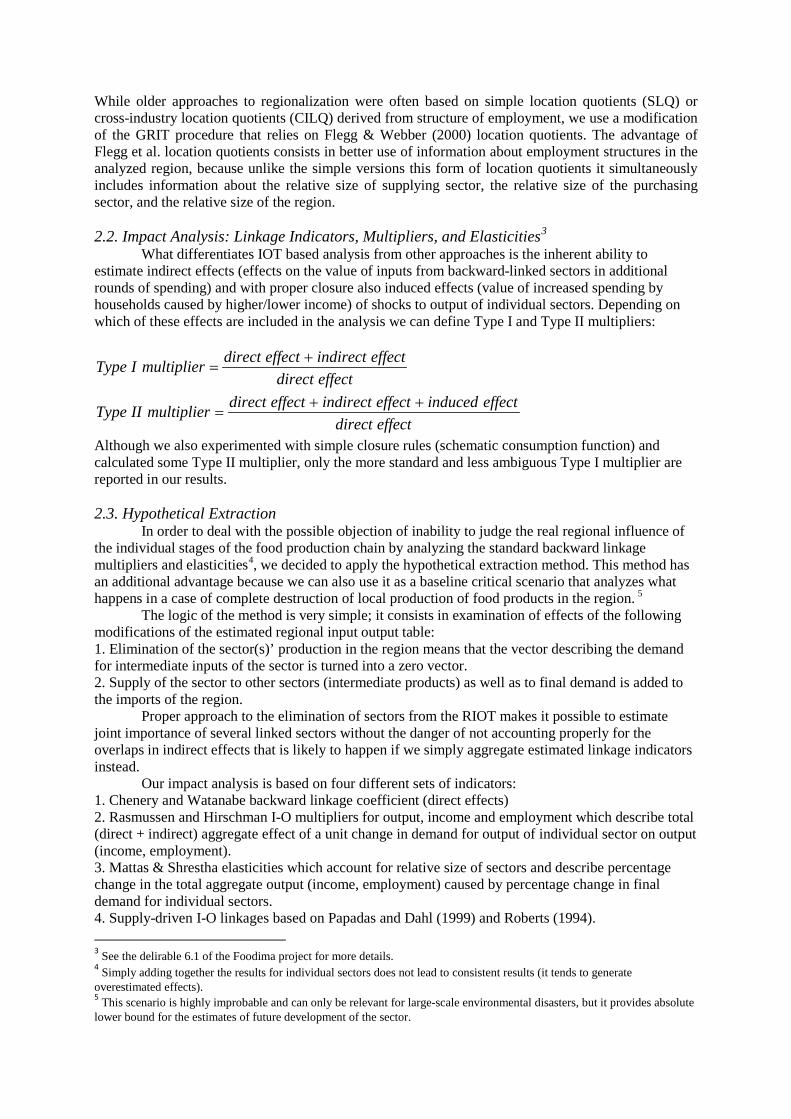
While the Table 4 shows the relative role of the sectors in generating food products and beverages, we also need some information about the linkages between sectors that play a role in supply of food products to final consumer. While this issue seems to be self-evident as it is typically assumed that the process starts with agriculture and fishing, continues via processing and manufacturing stage and ends with the service and distribution sector, the reality can be substantially more complicated and resembles rather a network than a streamlined supply chain – see Figure 3, which describes relative role of the intersectoral flows and of final demand for the individual sectors net of the consumption for intermediate use in each of the individual sectors in the Czech Republic in
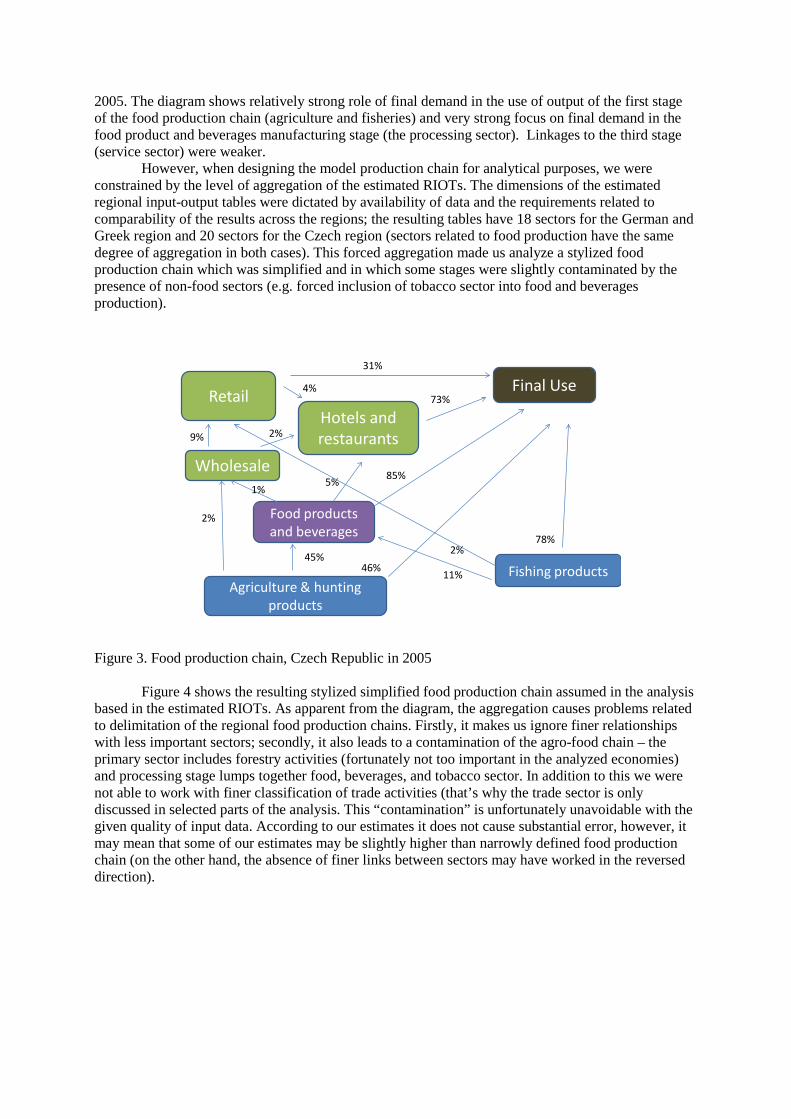
2005. The diagram shows relatively strong role of final demand in the use of output of the first stage of the food production chain (agriculture and fisheries) and very strong focus on final demand in the food product and beverages manufacturing stage (the processing sector). Linkages to the third stage (service sector) were weaker.
However, when designing the model production chain for analytical purposes, we were constrained by the level of aggregation of the estimated RIOTs. The dimensions of the estimated regional input-output tables were dictated by availability of data and the requirements related to comparability of the results across the regions; the resulting tables have 18 sectors for the German and Greek region and 20 sectors for the Czech region (sectors related to food production have the same degree of aggregation in both cases). This forced aggregation made us analyze a stylized food production chain which was simplified and in which some stages were slightly contaminated by the presence of non-food sectors (e.g. forced inclusion of tobacco sector into food and beverages production).
Final Use
Agriculture & hunting products
Fishing products
Food products and beverages
46%
78%45%
11%
85%
Hotels and restaurants
5%
73%Retail
1%
Wholesale
9%
2%
31%
2%
4%
2%
Figure 3. Food production chain, Czech Republic in 2005
Figure 4 shows the resulting stylized simplified food production chain assumed in the analysis based in the estimated RIOTs. As apparent from the diagram, the aggregation causes problems related to delimitation of the regional food production chains. Firstly, it makes us ignore finer relationships with less important sectors; secondly, it also leads to a contamination of the agro-food chain – the primary sector includes forestry activities (fortunately not too important in the analyzed economies) and processing stage lumps together food, beverages, and tobacco sector. In addition to this we were not able to work with finer classification of trade activities (that’s why the trade sector is only discussed in selected parts of the analysis. This “contamination” is unfortunately unavoidable with the given quality of input data. According to our estimates it does not cause substantial error, however, it may mean that some of our estimates may be slightly higher than narrowly defined food production chain (on the other hand, the absence of finer links between sectors may have worked in the reversed direction).
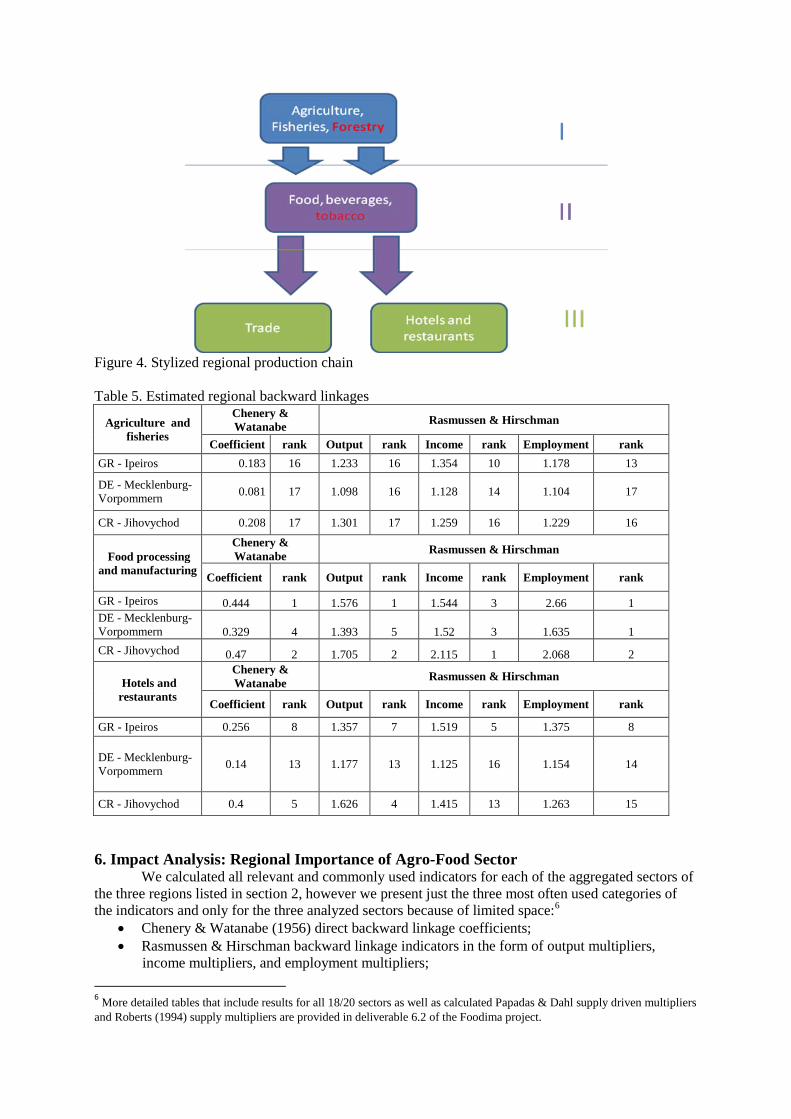
Figure 4. Stylized regional production chain Table 5. Estimated regional backward linkages
Agriculture and fisheries
Chenery & Watanabe Rasmussen & Hirschman
Coefficient rank Output rank Income rank Employment rank GR - Ipeiros 0.183 16 1.233 16 1.354 10 1.178 13
DE - Mecklenburg-Vorpommern 0.081 17 1.098 16 1.128 14 1.104 17
CR - Jihovychod 0.208 17 1.301 17 1.259 16 1.229 16
Food processing and manufacturing
Chenery & Watanabe Rasmussen & Hirschman
Coefficient rank Output rank Income rank Employment rank
GR - Ipeiros 0.444 1 1.576 1 1.544 3 2.66 1 DE - Mecklenburg-Vorpommern 0.329 4 1.393 5 1.52 3 1.635 1 CR - Jihovychod 0.47 2 1.705 2 2.115 1 2.068 2
Hotels and restaurants
Chenery & Watanabe Rasmussen & Hirschman
Coefficient rank Output rank Income rank Employment rank
GR - Ipeiros 0.256 8 1.357 7 1.519 5 1.375 8
DE - Mecklenburg-Vorpommern 0.14 13 1.177 13 1.125 16 1.154 14
CR - Jihovychod 0.4 5 1.626 4 1.415 13 1.263 15
6. Impact Analysis: Regional Importance of Agro-Food Sector
We calculated all relevant and commonly used indicators for each of the aggregated sectors of the three regions listed in section 2, however we present just the three most often used categories of the indicators and only for the three analyzed sectors because of limited space:6
• Chenery & Watanabe (1956) direct backward linkage coefficients;
• Rasmussen & Hirschman backward linkage indicators in the form of output multipliers, income multipliers, and employment multipliers;
6 More detailed tables that include results for all 18/20 sectors as well as calculated Papadas & Dahl supply driven multipliers and Roberts (1994) supply multipliers are provided in deliverable 6.2 of the Foodima project.
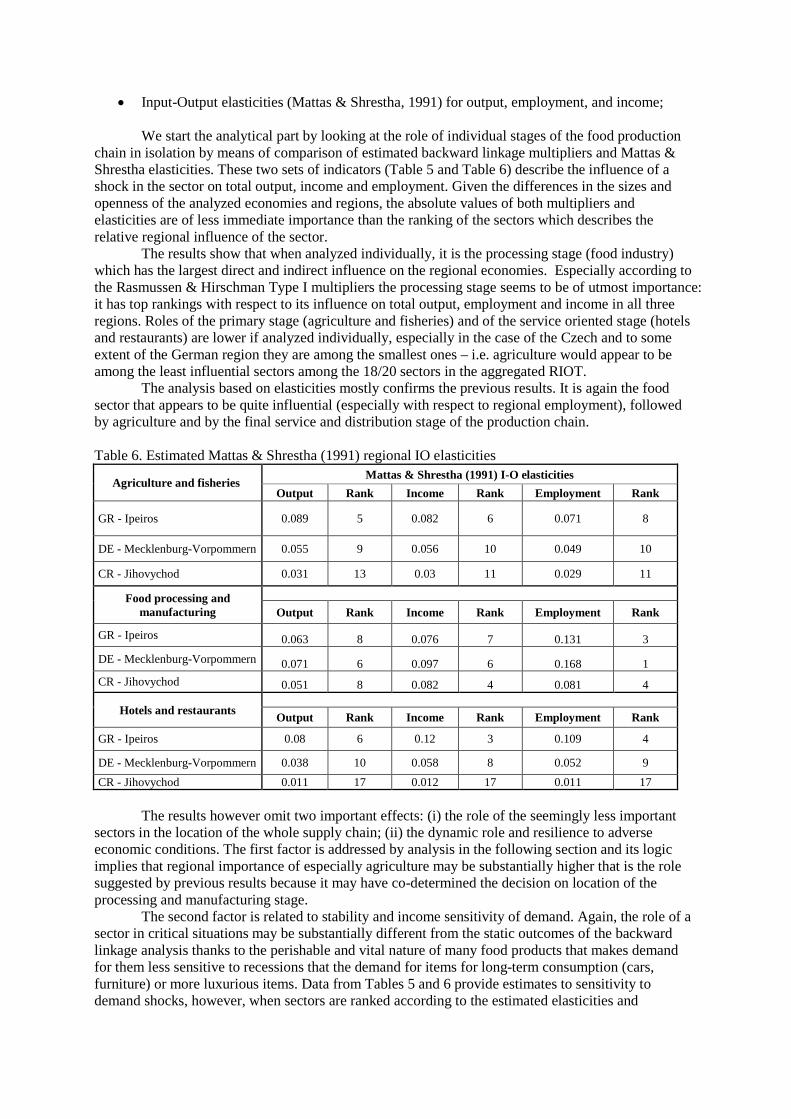
• Input-Output elasticities (Mattas & Shrestha, 1991) for output, employment, and income;
We start the analytical part by looking at the role of individual stages of the food production chain in isolation by means of comparison of estimated backward linkage multipliers and Mattas & Shrestha elasticities. These two sets of indicators (Table 5 and Table 6) describe the influence of a shock in the sector on total output, income and employment. Given the differences in the sizes and openness of the analyzed economies and regions, the absolute values of both multipliers and elasticities are of less immediate importance than the ranking of the sectors which describes the relative regional influence of the sector.
The results show that when analyzed individually, it is the processing stage (food industry) which has the largest direct and indirect influence on the regional economies. Especially according to the Rasmussen & Hirschman Type I multipliers the processing stage seems to be of utmost importance: it has top rankings with respect to its influence on total output, employment and income in all three regions. Roles of the primary stage (agriculture and fisheries) and of the service oriented stage (hotels and restaurants) are lower if analyzed individually, especially in the case of the Czech and to some extent of the German region they are among the smallest ones – i.e. agriculture would appear to be among the least influential sectors among the 18/20 sectors in the aggregated RIOT.
The analysis based on elasticities mostly confirms the previous results. It is again the food sector that appears to be quite influential (especially with respect to regional employment), followed by agriculture and by the final service and distribution stage of the production chain. Table 6. Estimated Mattas & Shrestha (1991) regional IO elasticities
Agriculture and fisheries Mattas & Shrestha (1991) I-O elasticities
Output Rank Income Rank Employment Rank
GR - Ipeiros 0.089 5 0.082 6 0.071 8
DE - Mecklenburg-Vorpommern 0.055 9 0.056 10 0.049 10
CR - Jihovychod 0.031 13 0.03 11 0.029 11
Food processing and manufacturing
Output Rank Income Rank Employment Rank
GR - Ipeiros 0.063 8 0.076 7 0.131 3 DE - Mecklenburg-Vorpommern 0.071 6 0.097 6 0.168 1 CR - Jihovychod 0.051 8 0.082 4 0.081 4
Hotels and restaurants
Output Rank Income Rank Employment Rank
GR - Ipeiros 0.08 6 0.12 3 0.109 4
DE - Mecklenburg-Vorpommern 0.038 10 0.058 8 0.052 9 CR - Jihovychod 0.011 17 0.012 17 0.011 17
The results however omit two important effects: (i) the role of the seemingly less important
sectors in the location of the whole supply chain; (ii) the dynamic role and resilience to adverse economic conditions. The first factor is addressed by analysis in the following section and its logic implies that regional importance of especially agriculture may be substantially higher that is the role suggested by previous results because it may have co-determined the decision on location of the processing and manufacturing stage.
The second factor is related to stability and income sensitivity of demand. Again, the role of a sector in critical situations may be substantially different from the static outcomes of the backward linkage analysis thanks to the perishable and vital nature of many food products that makes demand for them less sensitive to recessions that the demand for items for long-term consumption (cars, furniture) or more luxurious items. Data from Tables 5 and 6 provide estimates to sensitivity to demand shocks, however, when sectors are ranked according to the estimated elasticities and
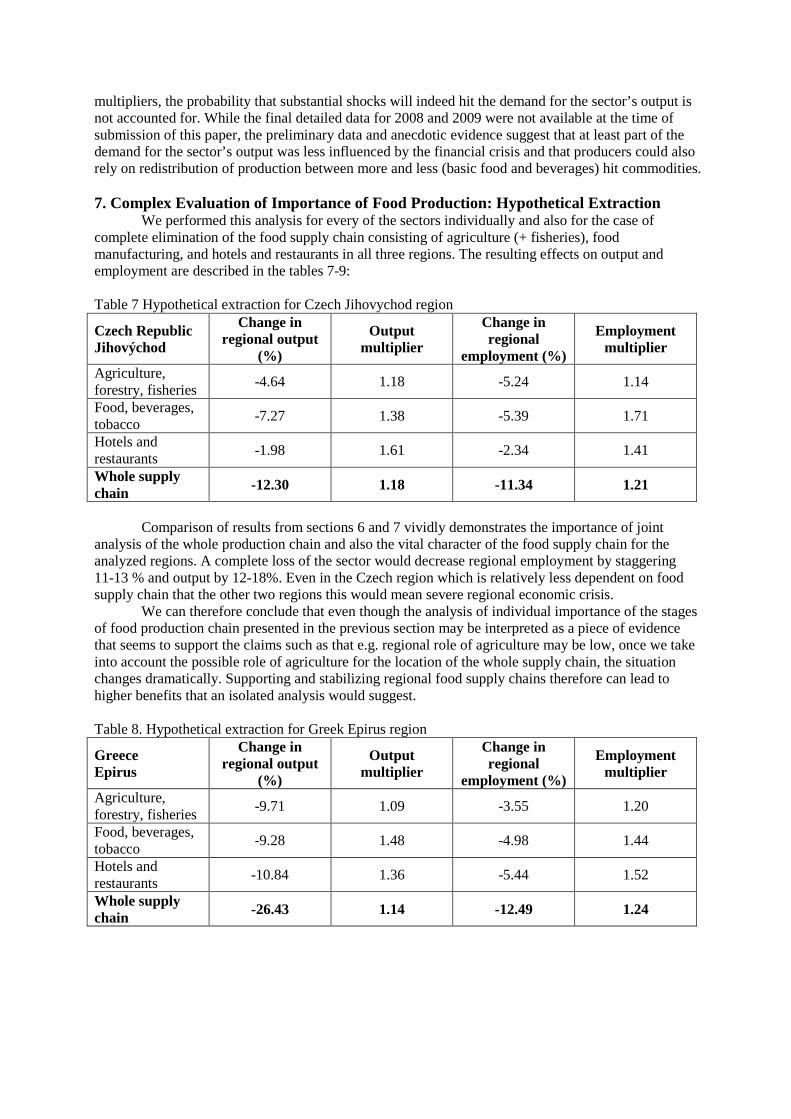
multipliers, the probability that substantial shocks will indeed hit the demand for the sector’s output is not accounted for. While the final detailed data for 2008 and 2009 were not available at the time of submission of this paper, the preliminary data and anecdotic evidence suggest that at least part of the demand for the sector’s output was less influenced by the financial crisis and that producers could also rely on redistribution of production between more and less (basic food and beverages) hit commodities. 7. Complex Evaluation of Importance of Food Production: Hypothetical Extraction
We performed this analysis for every of the sectors individually and also for the case of complete elimination of the food supply chain consisting of agriculture (+ fisheries), food manufacturing, and hotels and restaurants in all three regions. The resulting effects on output and employment are described in the tables 7-9: Table 7 Hypothetical extraction for Czech Jihovychod region
Czech Republic Jihovýchod
Change in regional output
(%)
Output multiplier
Change in regional
employment (%)
Employment multiplier
Agriculture, forestry, fisheries -4.64 1.18 -5.24 1.14
Food, beverages, tobacco -7.27 1.38 -5.39 1.71
Hotels and restaurants -1.98 1.61 -2.34 1.41
Whole supply chain -12.30 1.18 -11.34 1.21
Comparison of results from sections 6 and 7 vividly demonstrates the importance of joint
analysis of the whole production chain and also the vital character of the food supply chain for the analyzed regions. A complete loss of the sector would decrease regional employment by staggering 11-13 % and output by 12-18%. Even in the Czech region which is relatively less dependent on food supply chain that the other two regions this would mean severe regional economic crisis.
We can therefore conclude that even though the analysis of individual importance of the stages of food production chain presented in the previous section may be interpreted as a piece of evidence that seems to support the claims such as that e.g. regional role of agriculture may be low, once we take into account the possible role of agriculture for the location of the whole supply chain, the situation changes dramatically. Supporting and stabilizing regional food supply chains therefore can lead to higher benefits that an isolated analysis would suggest. Table 8. Hypothetical extraction for Greek Epirus region
Greece Epirus
Change in regional output
(%)
Output multiplier
Change in regional
employment (%)
Employment multiplier
Agriculture, forestry, fisheries -9.71 1.09 -3.55 1.20
Food, beverages, tobacco -9.28 1.48 -4.98 1.44
Hotels and restaurants -10.84 1.36 -5.44 1.52
Whole supply chain -26.43 1.14 -12.49 1.24
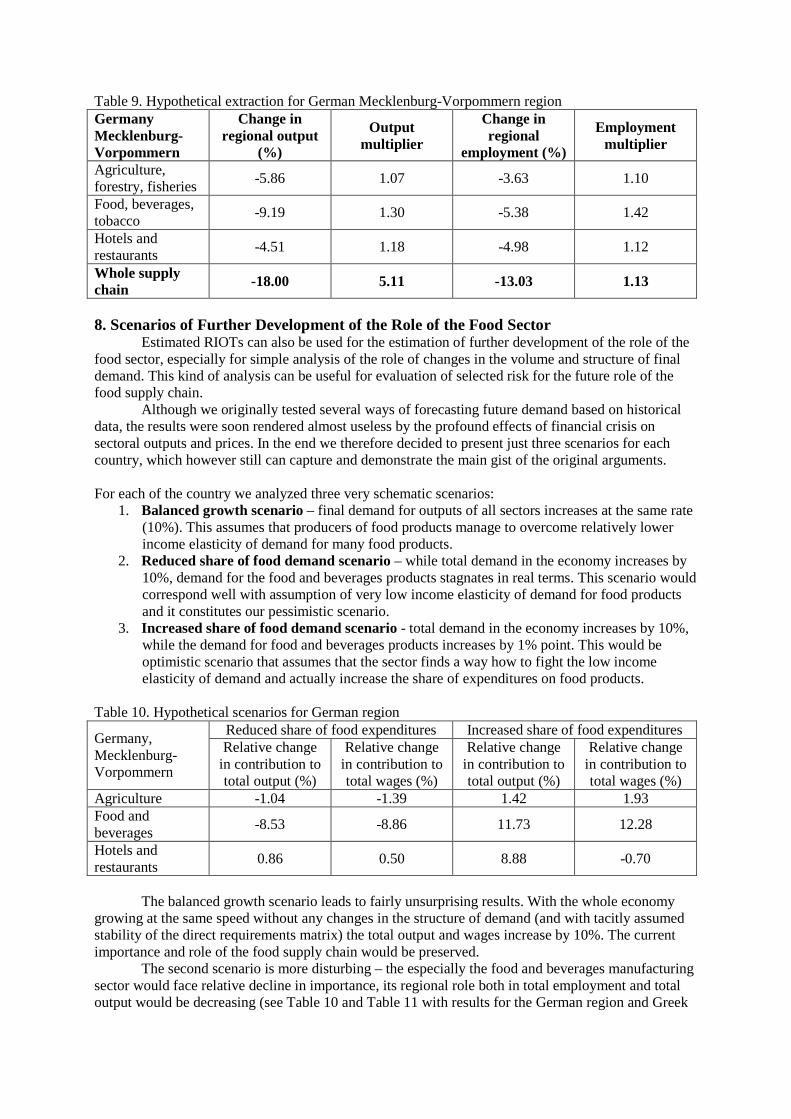
Table 9. Hypothetical extraction for German Mecklenburg-Vorpommern region Germany Mecklenburg-Vorpommern
Change in regional output
(%)
Output multiplier
Change in regional
employment (%)
Employment multiplier
Agriculture, forestry, fisheries -5.86 1.07 -3.63 1.10
Food, beverages, tobacco -9.19 1.30 -5.38 1.42
Hotels and restaurants -4.51 1.18 -4.98 1.12
Whole supply chain -18.00 5.11 -13.03 1.13
8. Scenarios of Further Development of the Role of the Food Sector
Estimated RIOTs can also be used for the estimation of further development of the role of the food sector, especially for simple analysis of the role of changes in the volume and structure of final demand. This kind of analysis can be useful for evaluation of selected risk for the future role of the food supply chain.
Although we originally tested several ways of forecasting future demand based on historical data, the results were soon rendered almost useless by the profound effects of financial crisis on sectoral outputs and prices. In the end we therefore decided to present just three scenarios for each country, which however still can capture and demonstrate the main gist of the original arguments. For each of the country we analyzed three very schematic scenarios:
1. Balanced growth scenario – final demand for outputs of all sectors increases at the same rate (10%). This assumes that producers of food products manage to overcome relatively lower income elasticity of demand for many food products.
2. Reduced share of food demand scenario – while total demand in the economy increases by 10%, demand for the food and beverages products stagnates in real terms. This scenario would correspond well with assumption of very low income elasticity of demand for food products and it constitutes our pessimistic scenario.
3. Increased share of food demand scenario - total demand in the economy increases by 10%, while the demand for food and beverages products increases by 1% point. This would be optimistic scenario that assumes that the sector finds a way how to fight the low income elasticity of demand and actually increase the share of expenditures on food products.
Table 10. Hypothetical scenarios for German region
Germany, Mecklenburg-Vorpommern
Reduced share of food expenditures Increased share of food expenditures Relative change
in contribution to total output (%)
Relative change in contribution to total wages (%)
Relative change in contribution to total output (%)
Relative change in contribution to total wages (%)
Agriculture -1.04 -1.39 1.42 1.93 Food and beverages -8.53 -8.86 11.73 12.28
Hotels and restaurants 0.86 0.50 8.88 -0.70
The balanced growth scenario leads to fairly unsurprising results. With the whole economy
growing at the same speed without any changes in the structure of demand (and with tacitly assumed stability of the direct requirements matrix) the total output and wages increase by 10%. The current importance and role of the food supply chain would be preserved.
The second scenario is more disturbing – the especially the food and beverages manufacturing sector would face relative decline in importance, its regional role both in total employment and total output would be decreasing (see Table 10 and Table 11 with results for the German region and Greek
region respectively). While this change does not have to mean immediate risks for the region (at least as far as other sectors indeed grow), the less visible stabilizing role of the food production chain can be negatively influenced.
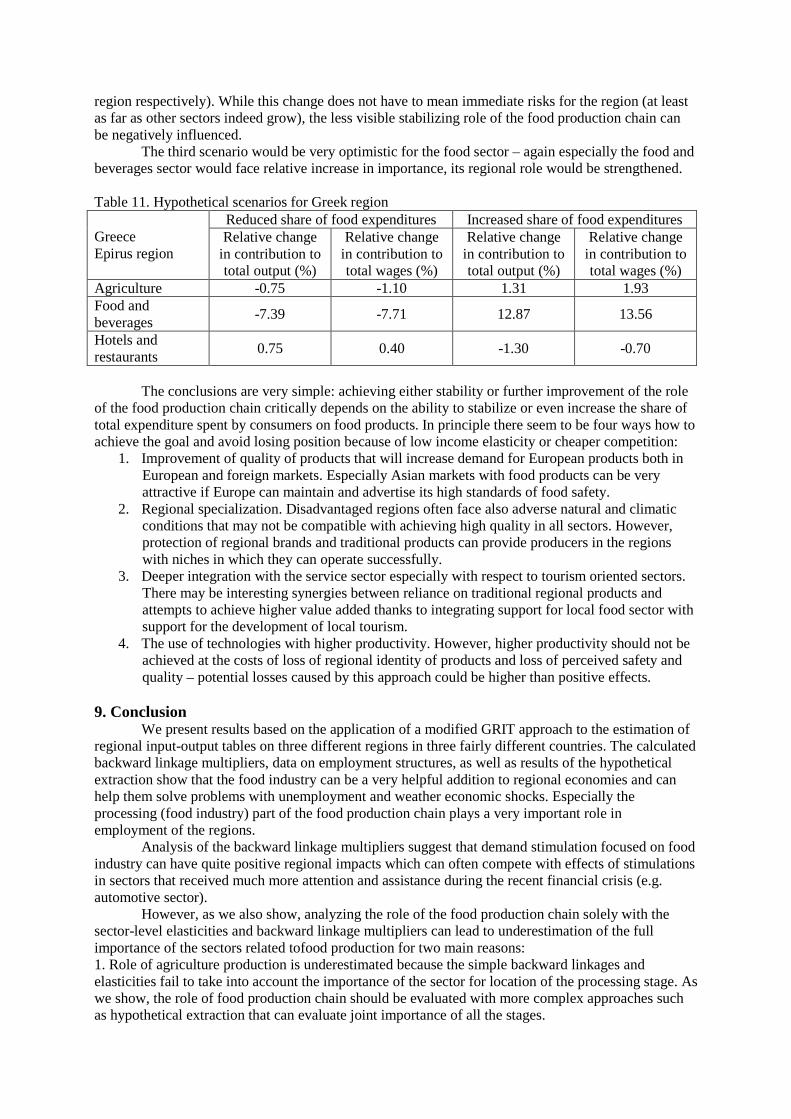
The third scenario would be very optimistic for the food sector – again especially the food and beverages sector would face relative increase in importance, its regional role would be strengthened. Table 11. Hypothetical scenarios for Greek region
Greece Epirus region
Reduced share of food expenditures Increased share of food expenditures Relative change
in contribution to total output (%)
Relative change in contribution to total wages (%)
Relative change in contribution to total output (%)
Relative change in contribution to total wages (%)
Agriculture -0.75 -1.10 1.31 1.93 Food and beverages -7.39 -7.71 12.87 13.56
Hotels and restaurants 0.75 0.40 -1.30 -0.70
The conclusions are very simple: achieving either stability or further improvement of the role
of the food production chain critically depends on the ability to stabilize or even increase the share of total expenditure spent by consumers on food products. In principle there seem to be four ways how to achieve the goal and avoid losing position because of low income elasticity or cheaper competition:
1. Improvement of quality of products that will increase demand for European products both in European and foreign markets. Especially Asian markets with food products can be very attractive if Europe can maintain and advertise its high standards of food safety.
2. Regional specialization. Disadvantaged regions often face also adverse natural and climatic conditions that may not be compatible with achieving high quality in all sectors. However, protection of regional brands and traditional products can provide producers in the regions with niches in which they can operate successfully.
3. Deeper integration with the service sector especially with respect to tourism oriented sectors. There may be interesting synergies between reliance on traditional regional products and attempts to achieve higher value added thanks to integrating support for local food sector with support for the development of local tourism.
4. The use of technologies with higher productivity. However, higher productivity should not be achieved at the costs of loss of regional identity of products and loss of perceived safety and quality – potential losses caused by this approach could be higher than positive effects.
9. Conclusion
We present results based on the application of a modified GRIT approach to the estimation of regional input-output tables on three different regions in three fairly different countries. The calculated backward linkage multipliers, data on employment structures, as well as results of the hypothetical extraction show that the food industry can be a very helpful addition to regional economies and can help them solve problems with unemployment and weather economic shocks. Especially the processing (food industry) part of the food production chain plays a very important role in employment of the regions.
Analysis of the backward linkage multipliers suggest that demand stimulation focused on food industry can have quite positive regional impacts which can often compete with effects of stimulations in sectors that received much more attention and assistance during the recent financial crisis (e.g. automotive sector).
However, as we also show, analyzing the role of the food production chain solely with the sector-level elasticities and backward linkage multipliers can lead to underestimation of the full importance of the sectors related tofood production for two main reasons: 1. Role of agriculture production is underestimated because the simple backward linkages and elasticities fail to take into account the importance of the sector for location of the processing stage. As we show, the role of food production chain should be evaluated with more complex approaches such as hypothetical extraction that can evaluate joint importance of all the stages.
2. The approach is very static. As the recent experience very clearly demonstrated, the stabilizing role of a sector does not depend only on its total share of employment, output or backward linkages, it also depends on the dynamic stability of the demand for its output during periods of economic distress. As we show, the food sector (thanks to the vital and perishable nature of its products) is less sensitive to negative economic shocks similar to the recent financial crisis and it can therefore play a very significant stabilization role especially for local employment.
Losing the agri-food business would constitute tremendous shock to regional economies. While regional employment shares in each individual stage of the food supply chain are seemingly small, once we take into account the indirect effects (intersectoral linkages) and also the role of the presence of linked sectors for location decision of investors, the effects of reduction of the role of the sectors in the analyzed regions could be catastrophic, decrease of unemployment by 11-13%, reduction of regional output by up to 26%.
At the same time, the opportunities for the further growth of the agri-food sector in the regions can be limited by the relatively small income elasticity of demand for most basic food products and by the relatively lower attractiveness of the sector for many employees caused by low wages (this is also the reason, why the sector is to some extent pushed to less central regions). Regional role of food sector will thus depend on regional specialization (decline of the sector in some regions opens the new opportunities for other regions), and on chances to increase not only total sales but also relative share in the final demand. This can be achieved it the food sector focuses on quality and diversification.
All in all, our results for the current and future role of the food sector are moderately optimistic and support the claims that the agro-food production chain remains vital and virtually irreplaceable. Although it has relatively lower space for future development (especially unless it focuses on quality and differentiated products), it will continue playing vital stabilizing role for regional economies, especially for regional employment. 10. References Chenery, H. B. and T. Watanabe (1958). International Comparisons of the Structure of Production. Econometrica 26: 487-521. Flegg T. A., and Webber C.D. (2000), Regional Size, Regional Specialization and the FLQ Formula, Regional Studies 34 (6): 563-69. Hirschman, A. O. (1958). The Strategy of Economic Development. New Haven: Yale University Press. Mattas, K. and Shrestha, C. (1991): A New Approach to Determining Sectoral Priorities in an Economy: Input-Output Elasticities. Applied Economics 23: 247-254 Papadas, C. T. and Dahl, D.C. (1999). Supply-Driven Input-Output Multipliers. Journal of Agricultural Economics 50(2):269-285. Rasmussen, P. N. (1956). Studies in Intersectoral Relations. Amsterdam: North-Holland. Roberts, D. (1994). Α Modified Leontief Model for Analyzing the Impact of Milk Quotas on the Wider Economy. Journal of Agricultural Economics 45(1): 90-101. Deliverables 6.1-6.3 of the Foodima project.