Embed Size (px)
Citation preview
Regional Greenhouse
Gas Inventory
2012 – 2014• Eastern Pima County• City of Tucson• Pima County Government• City of Tucson Government
FEBRUARY 2017(Updated June 2017)

PIMA ASSOCIATION OF GOVERNMENTS
2017 REGIONAL COUNCIL
Satish Hiremath, Chair
Mayor Town of Oro Valley
Peter Yucupicio, Vice Chair
Vice Chairman Pascua Yaqui Tribe
Edward Manuel, Treasurer
Chairman Tohono O’odham Nation
Ramón Valadez
Board of Supervisors Pima County
Jonathan Rothschild
Mayor City of Tucson
Tom Murphy
Mayor Town of Sahuarita
Ildefonso Green
Mayor South Tucson
Michael Hammond
AZ State Transportation Board
Ed Honea
Mayor Town of Marana
MANAGEMENT COMMITTEE
Vacant, Roads Division Manager, Tohono O’odham Nation
Sixto Molina, City Manager, City of South Tucson Danny Sharp, Interim Town Manager, Town of Oro Valley
Michael Ortega, City Manager, City of Tucson Gilbert Davidson, Town Manager, Town of Marana
Vacant- Tribal Council Member, Pascua Yaqui Tribe Chuck Huckelberry, Administrator, Pima County Kelly Udall, Town Manager, Town of Sahuarita
Rod Lane, Tucson District Engineer, ADOT
EXECUTIVE DIRECTOR
Farhad Moghimi
PAG DEPUTY DIRECTOR
Cherie Campbell
TECHNICAL SEVICES
Susanne Cotty, Senior Air Quality Planner Dave Atler, Program Director
Aichong Sun, Transportation Modeling Manager
February 2017 (Updated June 2017)
This report was funded in part through grant(s) from the Federal Highway Administration and/or Federal Transit Administration, U.S. Department of Transportation. The content of this report reflect the views and opinions of the author(s) who is responsible for the facts and accuracy of the data presented herein. The contents do not necessarily state or reflect the official views or policies of the U.S. Department of Transportation, or any other State or Federal Agency. This report does not constitute a standard, specification or regulation.
TABLE OF CONTENTS
List of Acronyms ............................................................................................................. v
Executive Summary ........................................................................................................ 1
Community Inventories Overview .................................................................................. 2
Government Operations Inventories Overview .............................................................. 4
Background ..................................................................................................................... 5
Project Objectives ........................................................................................................... 6
General Methodologies ................................................................................................... 6
Community Inventories .................................................................................................. 7
Government Operations Inventories ............................................................................ 12
Community Inventory Results ...................................................................................... 14
Eastern Pima County Regional Inventory Overview ..................................................... 14
Eastern Pima County Regional Synopsis .................................................................... 22
Tucson Community Inventory Overview ...................................................................... 22
Tucson Community Synopsis ...................................................................................... 28
Pima County Government Operations Inventory Overview .......................................... 28
County Government Synopsis ..................................................................................... 34
City of Tucson Government Operations Inventory Overview ........................................ 35
City Government Synopsis .......................................................................................... 40
References Cited ........................................................................................................... 41
Appendices .................................................................................................................... 42
LIST OF FIGURES
Figure 1. Map of Boundaries for the County and City Community GHG Inventories .......... 7 Figure 2. County Community Greenhouse Gas Emissions 2012 to 2014 ........................ 15 Figure 3. 2014 County Community Greenhouse Gas Emissions by Source .................... 15 Figure 4. 2014 County Community Stationary Energy Emissions .................................... 16 Figure 5. 2014 County Community Transportation Emissions ......................................... 17 Figure 6. 2014 County Community Waste Emissions ...................................................... 20 Figure 7. City Community Greenhouse Gas Emissions 2012 to 2014.............................. 22 Figure 8. 2014 City Community Greenhouse Gas Emissions by Source ......................... 23 Figure 9. 2014 City Community Stationary Energy Emissions ......................................... 24 Figure 10. 2014 City Community Transportation Emissions ............................................ 24 Figure 11. 2014 City Community Waste Emissions ......................................................... 27 Figure 12. County Government Greenhouse Gas Emissions 2012 to 2014 ..................... 29 Figure 13. 2014 County Government Greenhouse Gas Emissions by Source ................. 29 Figure 14. 2014 County Government Stationary Energy Use Emissions ......................... 30 Figure 15. 2014 County Government Transportation Emissions ...................................... 31 Figure 16. 2014 County Government Waste Emissions .................................................. 33 Figure 17. City Government Greenhouse Gas Emissions 2012 to 2014 .......................... 35 Figure 18. 2014 City Government Greenhouse Gas Emissions by Source ...................... 36 Figure 19. 2014 City Government Stationary Energy Use .............................................. 36 Figure 20. 2014 City Government Transportation Emissions ........................................... 38
LIST OF TABLES
Table 1. County Community GHG Emissions (metric tons CO2e) and Energy Consumption (million British thermal units- MMBtu) 2012 to 2014 ......................................................... 19 Table 2. Summary of County Recycled Material Totals and Emission and Energy Savings 2012 to 2014 ................................................................................................................... 21 Table 3. City Community GHG Emissions (metric tons CO2e) and Energy Consumption (MMBtu) 2012 to 2014 ..................................................................................................... 26 Table 4. Summary of City Community Recycled Materials Totals and Emission and Energy Savings 2012 to 2014 .......................................................................................... 28 Table 5. County Government GHG Emissions (metric tons CO2e) and Energy Consumption (MMBtu) 2012 and 2014 ........................................................................... 32 Table 6. County Government Recycled Material Totals, Emission and Energy Savings 2012 to 2014 ................................................................................................................... 33 Table 7. City Government GHG Emissions (metric tons CO2e) and Energy Consumption (MMBtu) 2012 to 2014 ..................................................................................................... 39 Table 8. City Government Recycled Material Totals and Emission and Energy Savings 2012 to 2014 ................................................................................................................... 40
Acknowledgments
Numerous representatives from various organizations have contributed information and direction for this report and their efforts are greatly appreciated. We extend a special note of thanks to Pima County and City of Tucson staff for their contributions. Additionally, various representatives of Pima Association of Governments, the University of Arizona, Tucson Electric Power Co., Southwest Gas, the Tohono O’odham Utility Authority, Trico Electric Cooperative Inc., Tucson International Airport, Ryan Airfield, Davis-Monthan, the Marana Airport, La Cholla Airport, Union Pacific Railroad and others provided valuable information needed for compiling this report. A full list of contributors is contained in Appendix A.
List of Acronyms
Btu British thermal units
ClearPath ICLEI’s online tool for quantifying greenhouse gases
CAP Central Arizona Project
CH4 Methane
CNG Compressed Natural Gas
CO2 Carbon dioxide
CO2e Carbon dioxide equivalents
DOE Department of Energy
EIA Energy Information Administration (department within DOE)
GHG Greenhouse gas
ICLEI Local Governments for Sustainability
KWh Kilowatt hours
MMBtu Million British thermal units
PAG Pima Association of Governments
PDEQ Pima County Department of Environmental Quality
RCI Residential, Commercial and Industrial sectors
SWG Southwest Gas
TEP Tucson Electric Power Co.
TRP Travel Reduction Program
TW Tucson Water
UPRR Union Pacific Railroad
USEPA U.S. Environmental Protection Agency
VMT Vehicle Miles Traveled
WARM EPA’s Waste Reduction Model

Regional Greenhouse Gas Inventory – 2012 to 2014
Executive Summary This inventory is the latest in a series of greenhouse gas (GHG) inventories for the eastern Pima County region, the last of which was completed in 2014. While there are similarities among these inventories, this report is organized differently and uses both new and updated emission models. Therefore, it is not possible to make accurate comparisons regarding GHG emission trends by comparing this inventory with past inventories. This inventory represents the results of using the most current tools and methodology and complies with the U.S. Community Protocol for Accounting and Reporting of Greenhouse Gas Emissions (ICLEI, 2013a) and the Local Government Operations Protocol for the Quantification and Reporting of Greenhouse Gas Emissions Inventories (ICLEI, 2010). The ICLEI-Local Governments for Sustainability’s ClearPath 2013 model was used to develop community and government operations GHG inventories for eastern Pima County and the City of Tucson for 2012, 2013 and 2014. All inventories track the production of the three major GHG: carbon dioxide (CO2), methane (CH4) and nitrous oxide (N2O). These are expressed as carbon dioxide equivalents (CO2e). Hydrofluorocarbons, perfluorocarbons and sulfur hexafluoride are not included since these emissions are expected to represent a very small proportion of the total GHG. These inventories do not track all the GHG emissions generated in the region but were designed to track emissions attributed to the communities’ and its governments’ actions and activities. Examples of emissions not covered in this report are those from hydrofluorocarbons and refrigerants, fugitive emissions from natural gas distribution, and those from agriculture-related activities. The aforementioned sources were not tracked due to unavailability of adequate information. The goal is to quantify the major GHG emission sources that are under the control of the two communities and their governments to possibly identify feasible practices and policies to reduce emissions. Pima Association of Governments (PAG), on behalf of member jurisdictions, including Pima County and the City of Tucson, developed this inventory that tracks GHG emissions from 2012 to 2014, and is organized as follows: Eastern Pima County Community GHG Emissions Inventory: (hereinafter referred to as County Community) Inventory includes emissions credited to the communities and governments of Tucson, South Tucson, Marana, Oro Valley, Sahuarita, the Tohono O’odham Nation, the Pascua Yaqui Tribe and unincorporated eastern Pima County. Included are emissions from stationary energy use by sector (electricity, natural gas, diesel), transportation (onroad, nonroad vehicle use, locomotive and aircraft); waste (solid and wastewater reclamation), industrial sources and Central Arizona Project (Other) energy use. Subsets of the County Community GHG Inventory:
Tucson Community GHG Emissions Inventory: (hereinafter referred to as the City Community). Inventory includes GHG emissions attributed to residents and activities within the Tucson city limits and by Tucson government operations. This inventory tracks emissions from stationary energy use by sector (electricity,

natural gas), transportation (onroad, nonroad vehicle use) waste (solid and the City’s portion of wastewater reclamation), and the City’s portion of Central Arizona Project (Other) energy use.
Pima County Government Operations GHG Emissions Inventory: (hereinafter referred to as the County Government). Inventory includes emissions from the activities under the County government’s control and contains emissions from stationary energy use (facilities, public lighting and wastewater reclamation) transportation (onroad, nonroad fleet use) waste (solid and wastewater reclamation) and employee commuting.
Tucson Government Operations GHG Emissions Inventory: (hereinafter referred to as the City Government). Inventory includes emissions from activities under the control of the City government and tracks emissions from stationary energy use (facilities, public lighting, potable, reclaimed and Central Arizona Project water handling) transportation (onroad, nonroad fleet use), solid waste and employee commuting.
Community Inventories Overview
From 2012 to 2014, County Community GHG emissions declined by 5 percent (Figure ES-1). Consequently per capita emissions declined due to a combination of a drop in emissions and population growth trends over this time (Appendix B). These results contrast with national trends which showed over a 3 percent increase over the same period and an increase in national per capita emissions (USEPA, 2016a). However, the major emission sources in Pima County mirror those of the nation. Electricity use and transportation are the major sources of both County and U.S. emissions. Figure ES-1. County Community Greenhouse Gas and Per Capita Emissions 2012 to 2014
13.5
14.0
14.5
15.0
15.5
13.5
14
14.5
15
2012 2013 2014
Per
Cap
ita
GH
G E
mis
sio
ns
(met
ric
ton
s)
GH
G E
mis
sio
ns
(mill
ion
met
ric
ton
s)
County Total GHG Emissions Per Capita GHG emissions
Over the inventory period, County Community emissions declined in all categories except industrial processes (Figure ES-2). Stationary energy use was the major source of County Community emissions, averaging over 60 percent of total emissions. The residential energy use component was the major contributor (45 percent) within the stationary energy use category. Electricity use is responsible for 90 percent of these emissions.
Figure ES-2. County Community Greenhouse Gas Emissions 2012 to 2014
Transportation emissions were the other major source of emissions, averaging 30 percent of total annual GHG emissions over 2012 to 2014. Private and commercial vehicle emissions comprised over 70 percent of total transportation emissions. Emissions by source from the most recent inventory year are shown below (Figure ES-3). Figure ES- 3. 2014 County Community GHG Emissions by Source
0
4
8
12
16
2012 2013 2014
GH
G (
mil
lio
n m
etr
ic t
on
s)
E. Pima County Total Stationary Energy
Transportation Waste
Industrial Processes Other
Stationary Energy
59%
Transportation31%
Waste1%
Industrial6%
Other3%
Results of the County and the City Community inventories show similar emission sources and trends, with stationary energy use and transportation being the largest components of City Community GHG totals. From 2012 to 2014, City Community emissions dropped by 9 percent. Emission reductions occurred in stationary energy use (14 percent); wastes (33 percent) and the Central Arizona Project (CAP) energy use (1 percent). Transportation emissions rose by 4 percent over the two-year period.
Government Operations Inventories Overview
County and City Government emissions were a small portion of their Community totals. Stationary energy, primarily electricity use, generated most of the County and City Governments’ emissions. For County Government, facility energy use was the dominant component of stationary energy use, averaging about 60 percent of emissions. Over the 2012 to 2014 period, County Government emissions dropped by 15 percent; the largest reductions occurred in transportation emissions (50 percent) and stationary energy use (18 percent). Over the survey period, emission increases occurred in waste (19 percent) and employee commuting (17 percent) (Figure ES-4).
Figure ES-4. County Government Greenhouse Gas Emissions 2012 to 2014
From 2012 to 2014, City government emissions dropped by 5 percent which likely can be attributed to a 6 percent drop in stationary energy use emissions. In all other categories emissions increased over the survey period (Figure ES-5).Water-related emissions generated the majority (85 percent) of the City Government’s stationary energy emissions.
0
0.004
0.008
0.012
0.016
0.02
0
0.04
0.08
0.12
0.16
2012 2013 2014
GH
G e
mis
sio
ns (
mil
lio
n m
etr
ic t
on
s)
GH
G e
mis
sio
ns (
mil
lio
n m
etr
ic t
on
s)
Transportation Employee commute
Waste Stationary energy
County Government Total
Figure ES-5. City Government Greenhouse Gas Emissions 2012 to 2014
Background In October 2007, the Pima Association of Governments’ (PAG) Regional Council adopted a resolution to conduct a greenhouse gas (GHG) emissions inventory for eastern Pima County. The goal of this resolution was to generate a regional, broad-based GHG emissions inventory to provide baseline information and support PAG’s regional partners in tracking progress and developing strategies to achieve their GHG reductions goals. Subsequently, Pima County and the City of Tucson have made commitments to reduce energy and fuel use as well as GHG emissions. Most recently, the Pima County’s Board of Supervisors (BOS) approved an update to the comprehensive plan, Pima Prospers (Pima County, 2015) which includes goals to increase use of renewable energy and reduce energy and fossil fuel use. Additionally, the County’s BOS adopted the second five-year Sustainable Action Plan for County Operations which contains specific goals for decreasing energy and water use and solid waste and increasing the use of renewable energy and alternative fuels (Pima County, 2014). In 2013, Tucson voters approved Plan Tucson, a 10-year general plan outlining the goals and principles to increase community resiliency in the social, economic sectors and the natural and built environments (City of Tucson, 2013). Also in 2013, Tucson Mayor Rothschild launched a 10,000 Tree Campaign, which set a goal to plant that amount of trees by 2014. In addition, Tucson’s Mayor and Council approved the Climate Mitigation Report-Recommendations which outlines specific strategies for reducing the City’s GHG emissions (City of Tucson, 2011) PAG also manages programs that help reduce GHG emissions. PAG’s support of the region’s rainwater harvesting programs work at reducing the demand for potable water for irrigation, and PAG’s Travel Reduction Program (TRP) promotes alternative transportation modes and carpooling to reduce single-occupancy vehicle travel. The
0.000
0.004
0.008
0.012
0.016
0.00
0.08
0.16
0.24
0.32
0.40
0.48
0.56
0.64
0.72
2012 2013 2014
GH
G e
mis
sio
ns (
mil
lio
n m
etr
ic t
on
s)
GH
G e
mis
sio
ns (
mil
lio
n m
etr
ic t
on
s)
Transportation Employee commute
Waste City Government Total
Stationary energy
Clean Cities program fosters the installation of local infrastructure and opportunities to advance the use of alternative fuels, which emit less GHG than traditional fuels (gasoline and diesel).
Project Objectives The goal of this report is to track regional GHG emissions, identify major emission sources to assist County and City officials and their staffs develop GHG reduction strategies and evaluate progress toward reaching their reduction goals. The inventory continues to be a living document and can be updated as new and more accurate data become available. It is important to note that this report has not been validated by an independent party and is not a tool designed for developing regulations. Care also should be exercised in comparing the results of this inventory to those done by other communities since the sources analyzed and/or the GHG included could be different.
General Methodology The ICLEI-Local Governments for Sustainability’s ClearPath 2013 model was used to develop a basic level1 emissions inventory for 2012 to 2014 County and City Community and their respective government operations2 inventories. The model was provided through the Compact of Mayors’ program, a global coalition of mayors and city officials committed to reducing local GHG emissions, enhancing resilience to climate change and tracking their progress publicly. This collaborative initiative was launched in 2014 by the U.N. Secretary-General Ban Ki-moon and his Special Envoy for Cities and Climate Change, Michael R. Bloomberg, under the leadership of the world’s global city networks, C40 Cities Climate Leadership Group, ICLEI-Local Governments for Sustainability and the United Cities and local governments. This initiative establishes a consistent platform to assess cities’ emissions and actions through standardized emissions measurement and a unified public reporting system. The ClearPath model is an advanced web application and is the most widely-used software tool for managing local climate mitigation efforts. This model estimates emissions from stationary energy use, transportation, waste, industrial processes and from other miscellaneous sources. The County/City Communities and Government operations inventories track these sources of emissions. All inventories chart the County’s and City’s production of the three major GHG: carbon dioxide (CO2), methane (CH4) and nitrous oxide (N2O). These are expressed as carbon dioxide equivalents (CO2e). Hydrofluorocarbons, perfluorocarbons and sulfur hexafluoride are not included since these emissions are expected to represent a very small proportion of the total GHG.
1 U.S. Community Protocol for Accounting and Reporting of GHG Emissions requires the
following activities of a basic level inventory: community electricity use; residential and 2 Local Government Operations Protocol for the Quantification and Reporting of GHG Emissions
Inventories requires the reporting of stationary energy use, onroad/nonroad fleet vehicles; emissions from district energy and biogas combustion, waste disposal, wastewater treatment and employee commuting. (ICLEI, 2010)
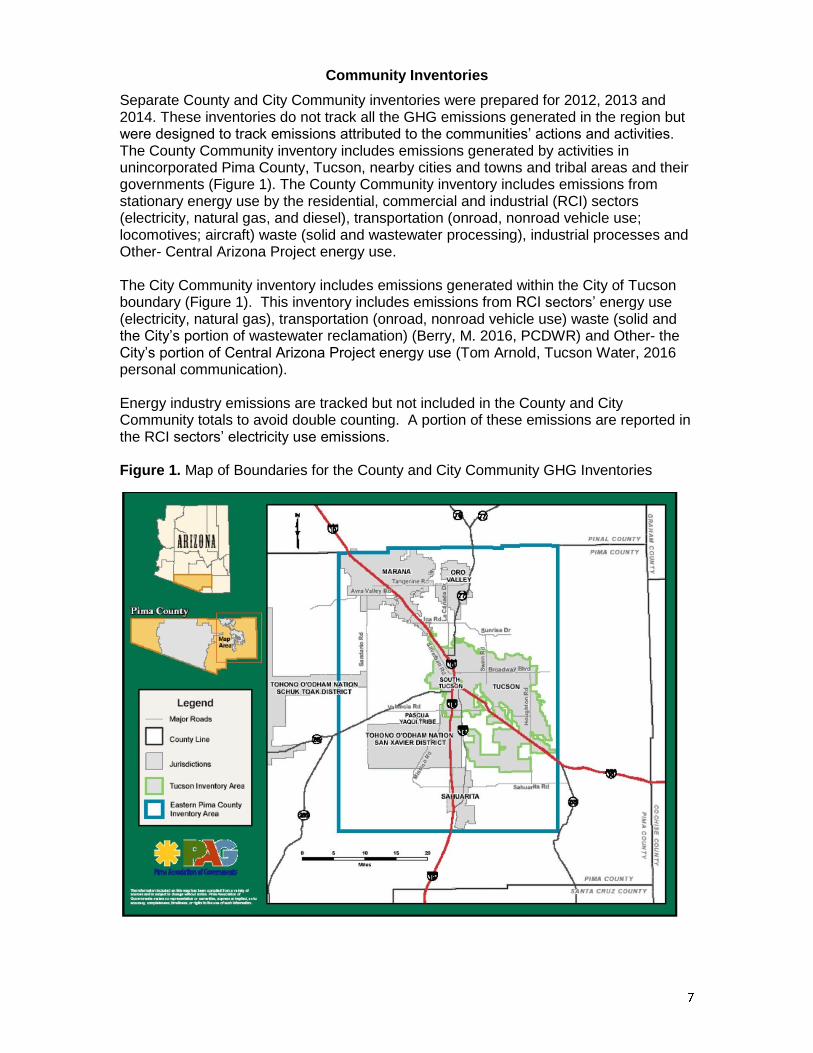
Community Inventories
Separate County and City Community inventories were prepared for 2012, 2013 and 2014. These inventories do not track all the GHG emissions generated in the region but were designed to track emissions attributed to the communities’ actions and activities. The County Community inventory includes emissions generated by activities in unincorporated Pima County, Tucson, nearby cities and towns and tribal areas and their governments (Figure 1). The County Community inventory includes emissions from stationary energy use by the residential, commercial and industrial (RCI) sectors (electricity, natural gas, and diesel), transportation (onroad, nonroad vehicle use; locomotives; aircraft) waste (solid and wastewater processing), industrial processes and Other- Central Arizona Project energy use. The City Community inventory includes emissions generated within the City of Tucson boundary (Figure 1). This inventory includes emissions from RCI sectors’ energy use (electricity, natural gas), transportation (onroad, nonroad vehicle use) waste (solid and the City’s portion of wastewater reclamation) (Berry, M. 2016, PCDWR) and Other- the City’s portion of Central Arizona Project energy use (Tom Arnold, Tucson Water, 2016 personal communication). Energy industry emissions are tracked but not included in the County and City Community totals to avoid double counting. A portion of these emissions are reported in the RCI sectors’ electricity use emissions. Figure 1. Map of Boundaries for the County and City Community GHG Inventories

Stationary Energy Residential, Commercial, Industrial (RCI) RCI sectors’ energy use includes fossil fuel combustion and grid-supplied electricity. The residential sector’s GHG emissions are based on household energy used for heating, cooling and lighting. The commercial sector encompasses electricity and natural gas used in non-residential buildings (e.g. schools, hospitals, retail, institutional and government-owned facilities). The industrial sector includes electricity, natural gas and diesel used in mining, agriculture and manufacturing operations. Southwest Gas (SWG) staff provided 2012 through 2014 RCI natural gas use for eastern Pima County and for the City of Tucson. The Tohono O'odham Nation and Pascua Yaqui Tribe’s natural gas use is captured in the SWG totals. Natural gas is the predominate component of fossil fuel consumption but the County Community industrial sector also includes non-vehicle diesel use. Industrial diesel use data were supplied by Pima County Department of Environmental Quality (PDEQ) staff. Emissions from fossil fuel combustion are calculated using fuel volume and ClearPath emission factors for natural gas and diesel. Tucson Electric Power Company (TEP) natural gas use was removed from the County Community and City Community industrial natural gas volumes for all years. This was done to avoid double counting since the GHG released in the generation of electricity were incorporated into the Energy Industry totals and in the 2012 to 2014 TEP emission factors to calculate RCI electricity emissions. Electricity use data (2012 to 2014) by sector were provided by TEP and by jurisdiction. TEP electricity use data are aggregated into customer classes based on average annual energy use, not necessarily by customer operations. Consequently, the industrial sector may include some large commercial operations, and the commercial sector may include some small industrial operations. Trico provided electricity use data by sector and by jurisdiction. Pascua Yaqui Tribe’s electricity use was included in the County’s Trico totals. The Tohono O'odham Utility Authority staff provided electricity use data (2012 to 2014) by sector and was reported in the County Community inventory only. Annual electricity generation emission factors for TEP and Trico were calculated by PAG staff using data supplied by the TEP contributors. Composite emission factors for 2012, 2013 and 2014 were developed by determining the fraction of electricity produced at each plant type and fuel type combination as compared to the annual generation. Each plant/fuel type combination has a unique emission factor (pounds GHG/MWh); see formulas below. The composite annual emission factor was determined by summing all the weighted emissions. The relative amount of electricity produced by each fuel/plant combination of electricity was compared to the total electricity produced to produce a fraction that represented each plant/fuel type combination. (Appendix D).
Fraction = Annual MWh (by Plant/Fuel type)/Total Annual Electricity Generation (MWh)
Annual Electricity Generation Emission Factor = sum (Fractions x Unique Generation Factor)
The Tohono O'odham Nation Utility Authority purchases electricity from TEP, so the TEP emission factors were used to estimate these GHG emissions.
Stationary energy emissions from RCI natural gas and electricity use are based on end-use energy consumption data; emissions from the local generation of electricity are listed under Energy Industries (Table 1) but are not included in the County or City Community totals to avoid double counting. Transportation Onroad Private and Commercial Vehicle Travel Annual vehicle miles traveled (VMT) shown in Appendices E and H represent total travel that occurred in eastern Pima county and the City of Tucson, respectively. It represents VMT by the jurisdictional residents, visitors and pass-through travelers. It does not include travel by community residents outside of these jurisdictions. This calculation method will over-report emissions for jurisdictions with a high proportion of pass-through traffic3. Annual VMT, meteorological, vehicle inspection parameters, Arizona Department of Transportation Pima County vehicle registrations, fuel, speed and vehicle travel patterns data were developed for 2012, 2013 and 2014 for eastern Pima County and for the City of Tucson by PAG staff. The EPA MOVES2014 model was used to estimate annual GHG emissions for all onroad vehicles’ use/travel. Transit emission totals were removed from the County and City GHG MOVES annual totals and calculated independently. Public transit
Various regional transportation staff provided VMT by fuel type and jurisdiction (Appendix A). County transit data included all VMT/fuel data from Cat Tran, the Loop, Special Needs, Sun Shuttle, Sun Shuttle (Oro Valley), Sun Tran, Sun Link, and Sun Van (Appendix E). For transit operating within the City of Tucson boundary, City VMT/fuel data were collected from Cat Tran, the Loop, Special Needs, Sun Shuttle, Sun Tran, Sun Link and Sun Van (Appendix H). County and City transit fuel use fractions by jurisdiction were developed for the 2012 to 2014 to create MOVES2014 input files using the data supplied by local transit providers. Individual MOVES2014 runs were conducted for 2012, 2013 and 2014 County and City transit VMT/fuel mix. Unique transit emission factors by jurisdiction were calculated based on the MOVES2014 model outputs (grams CO2e/mile) and each emission factor was applied to the total transit VMT for each year and jurisdiction. County and City public transportation emissions appear as one total and are referred to as ”Transit” in Tables 1 and 3, and in Figures 5 and 10, respectively. Nonroad The EPA’s MOVES2014 model was used to calculate Pima County nonroad vehicle emissions. The MOVES2014 model incorporates a nonroad vehicle component, which is a modified version of the EPA’s NONROAD2008a model. Nonroad vehicles include
3 ICLEI. 2013b
those from the agricultural, commercial, industrial and construction industries and residential lawn and garden equipment, airport and railroad support and recreational vehicles. County nonroad emissions represent 98 percent of the total Pima County MOVES2014 emission results reflecting the population, employment and land use data for the eastern portion of Pima County. City Community nonroad emissions were estimated by applying the City: County population ratio to County nonroad emissions for each year since many of the NONROAD2008a model emissions allocation factors are based on population. Locomotives Emissions from locomotive travel within eastern Pima County were calculated using diesel consumption data submitted by Union Pacific Railroad staff and a diesel emission factor (0.01 metric tons/gallon) embedded in the ClearPath model. Only the County Community inventory contains locomotive emissions due to the difficulty in separating tracks by jurisdiction. Aircraft Volumes of dispensed aviation gas and Jet A data were collected from the various airport staff for the Tucson International, Marana and La Cholla Airports, Davis Monthan and Ryan Airfield (Appendix A). Emissions were calculated using the Jet A and aviation gas emission factors and formula found in Appendix D of the U.S. Community Protocol for GHG Inventories [Equation TR6.B.1] (ICLEI, 2013b). Aircraft-associated emissions are included in the County Community inventory only due to the complexity of separating City and County airspace. Waste Solid waste disposal Waste emissions depend on the waste composition and the treatment method. County Community waste-associated emissions (2012 to 2014) for Los Reales, Harrison and Tangerine landfills were obtained from the EPA’s Greenhouse Gas Reporting Program (USEPA, 2016b). Sahuarita landfill waste totals and descriptions (FY2012 and Jan.-June 2013) were supplied by PDEQ staff. Beginning in July 2013, a private contractor assumed the daily operation of the Sahuarita landfill. Tucson Waste and Recycling Waste staff provided the July-Dec 2013 and the 2014 waste descriptions and totals. When the Sahuarita wastes were clearly identified (e.g. green waste), totals were directly entered into the model. For wastes without a clear description (e.g. mixed municipal waste) the ClearPath model’s default characterizations were used to estimate emissions. Construction waste was characterized using data from a Cascadia construction waste study (Cascadia, 2006) (Appendix F). The City Community waste emission totals were obtained from the EPA reported GHG totals (2012 to 2014) for Los Reales and Harrison landfills only (USEPA, 2016b).
Wastewater reclamation Pima County staff provided data for all regional facilities (2012 to 2014) and ClearPath model emission factors were used to calculate GHG emissions from the nitrification /denitrification process, lagoon treatment, digester gas flaring and digester gas combustion for onsite energy production. Nine facilities were included in the 2012 totals; nine facilities were included in 2013 reflecting half-year operations at the Roger Road and the Agua Nuevo facilities; in 2014, the data reflects the activities of the nine County facilities. The Town of Marana assumed the operation of a wastewater reclamation facility in 2012. Wastewater processing emissions data were submitted by the Town staff for 2012 through 2014. For the City Community inventory, 75 percent of County wastewater-associated process emissions were attributed to the City, reflecting the estimated portion of wastewater reclaimed by the County facilities (Berry, M. Pima County Wastewater Reclamation. Personal communication, 2016). Recycled materials The ClearPath model does not contain a method to estimate GHG emissions sinks or reduction benefits. County and City Community recycling emissions and energy savings are presented for informational purposes and are not included in the calculations for County or City Community inventory totals. Recycling emission and energy reductions were estimated using the EPA’s Waste Reduction Model (WARM) Version 14 - March 2016, (USEPA, 2016c). The model uses a life-cycle approach, accounting for emissions avoided in producing replacement materials (upstream) and disposal-related emissions (downstream). Calculations are based on the difference between the CO2e emitted and energy expended if materials were landfilled and the savings realized through alternate waste management practices (e.g. source reduction, recycling, composting). The results of the Cascadia Consulting Group’s study commissioned by the City of Tucson were used to characterize the County’s and the City’s recyclable materials (Cascadia, 2014). County Community recycling totals are from all County activities. County staff provided totals from Sahuarita [FY 2012, 2013 (6 months)] Tangerine landfills [FY 2012 and 2013 (6 months], and private haulers (CY 2012, 2013, 2014); Tucson Waste and Recycling Waste staff provided data from the Sahuarita landfill [2013 (6-months) and 2014]; and City of Tucson’s Environmental Services staff provided 2012 through 2014 recycling data which include curbside, commercial, community and Los Reales collections. The City Community recycling totals represent activities only within the City of Tucson’s boundary. Industrial Processes County Community emissions (2012 through 2014) from Cal Portland Cement (Arizona Portland Cement) were obtained from the EPA GHG Reporting Program (USEPA, 2016b).
City Community industrial process emissions were not included in the inventory since those facilities listed in the PDEQ inventory data and the EPA GHG reporting system showed natural gas combustion as the only CO2e source, which would be included in the industrial SWG totals. Other Emissions from the electricity used to deliver CAP water to Tucson Water (TW) facilities are listed as “Other”. CAP electricity use data (2012 to 2014) were provided by TW staff. Electricity used for CAP pumping is from the Navajo Generating Station (NGS). Electricity generation emission factors for the NGS (Appendix D) were calculated by PAG staff using the EPA GHG emissions reporting data 2012 to 2014 (USEPA, 2016b) and Department of Energy’s 2012 to 2014 energy production survey Form EIA-923 (DOE, 2016) . To estimate electricity use, TW staff calculated the KWh needed to pump water to individual pumping stations to deliver one acre-foot 4 (AF) of water to every location used by TW. A composite pumping electricity factor was developed for each year as the weighted average of the KWh/AF calculated for each facility (Philbin, A. 2012). This emission factor was applied to the total annual acre-feet delivered to TW facilities. Energy Industries These data were provided for informational purposes only, since a portion of these emissions were captured in the RCI electricity use emissions. County emissions (2012 to 2014) from energy generation and from power plant auxiliary equipment (TEP’s Irvington, DeMoss Petrie plants) were obtained from the EPA’s GHG Greenhouse Gas Reporting Program (USEPA, 2016b). PDEQ staff provided natural gas inventory data used to calculate emissions from TEP’s North Loop facility for the County Community inventory only. Energy industries data for City Community include the emissions associated with the TEP Irvington and DeMoss Petrie plants only.
Government Operations Inventories
Separate County and City Government inventories were prepared for 2012, 2013 and 2014. The County and City Government inventories track emissions generated from sources under the management of the specific government entity. The County and City Government inventories track emissions from stationary energy use, transportation, waste and from employee commuting Stationary Energy The County Government inventory includes purchased natural gas and electricity used in government facilities, wastewater reclamation and public lightning (street and traffic lights). All data were provided by Pima County staff.
4 An acre-foot (AF) equals 325,851 gallons, approximately the amount of water used by a family of four for
one year
The City Government inventory includes purchased natural gas and electricity used in facilities, fleet operations, CAP, potable and reclaimed water pumping/delivery and public lighting. The Bureau of Indian Affairs provides a portion of electricity for potable water pumping but no emissions are associated with it since it is primarily hydropower (Tom Arnold, Tucson Water, 2016 Personal communication). All data were provided by Tucson staff. In addition to these stationary sources, the City government purchases hot and chilled water and electricity from a district energy source operated by NRG Tucson. Combustion emissions from the burning of natural gas are included in the City Government totals. This energy is used to provide hot and chilled water to the Tucson Convention Center and hot and chilled water and electricity to police and fire station buildings in downtown Tucson (6 buildings). Transportation Onroad Onroad VMT by fuel and vehicle type data were provided by County and City government staff for 2012 to 2014. The emission factors developed in the County Community EPA’s MOVES2014 model runs were applied to the County and City fleets’ VMT by vehicle type (passenger car, motorcycles, light duty truck and heavy duty truck) and inventory year (2012, 2013 and 2014). Emissions for each vehicle type were totaled by year and jurisdiction to estimate County and City Governments’ fleet onroad emissions. Nonroad Nonroad vehicle fuel use data were provided by County and City government staff for 2012 to 2014. Emissions were calculated using ClearPath specific fuel emission factors for nonroad vehicles by fuel type. Waste Solid waste
Government-generated solid waste totals were supplied by County and City staff. Government solid wastes were characterized using the Default California Waste Characterization, 2007-Present (ICLEI, 2010) (Appendix F). Emissions were estimated using this characterization and waste emission factors contained in the ClearPath model.
Wastewater reclamation The County Government wastewater reclamation emissions for 2012 to 2014 were calculated using data submitted by County staff and ClearPath emission factors for nitrification/denitrification and lagoon treatment and flaring and combustion of digester gas. Recyclables The ClearPath model does not contain a tool to estimate GHG emissions sinks or reduction benefits. Recycling emissions and energy savings are presented for
informational purposes and were not used to calculate County or City Government inventory totals. County and City staff provided the recycling totals (2012-2014). Recycling emission and energy reductions were estimated using the EPA’s Waste Reduction Model (WARM) Version 14 - March 2016, (USEPA, 2016c). The results of the Cascadia Consulting Group’s study commissioned by the City of Tucson were used to characterize the County and City Governments’ recycled materials (Cascadia, 2014). Employee Commute PAG’s Travel Reduction Program (TRP) began in 1989 to reduce carbon monoxide levels and traffic congestion in the Tucson metropolitan area. Surveys are sent on a regular basis to regional employers with 100 or more full-time employees. The data in this section represents the most recent results from the County and City governments’ employee surveys. TRP staff provided County government employees’ survey data for annual, roundtrip drive-alone and carpool commuting VMT for 2012 and 2014. County employee 2013 travel data were interpolated using the 2012 and 2014 data. TRP staff provided City government employees’ survey data for annual, roundtrip drive-alone and carpool VMT for 2011 and 2014. The 2012 and 2013 VMT was interpolated using the 2011 and 2014 data. County and City Government employee commuting emissions (2012 to 2014) were estimated using a MOVES2014 composite emission factor for each survey year (grams CO2e /mile) calculated from VMT-weighted factors for “commuter vehicles” (motorcycles, passenger cars and passenger trucks). Energy Generation County and City Government solar energy production totals are included for information purposes only since the process produces zero emissions.
Community Inventory Results
Eastern Pima County Regional Inventory Overview
From 2012 to 2014, County Community emissions dropped by 5 percent (Figure 2, Table 1). Emission reductions occurred in all categories except for industrial processes. For all inventory years, stationary energy use was the major contributor to GHG emissions, averaging 60 percent of annual total emissions. More than 90 percent of these stationary energy emissions were from electricity use; natural gas use was responsible for the remaining 10 percent. Transportation emissions (onroad, nonroad vehicle use, aircraft and railroad) averaged about 30 percent of total GHG emissions during the survey years. Private and commercial vehicle travel was the largest component of these emissions, contributing over 70 percent to total transportation emissions.
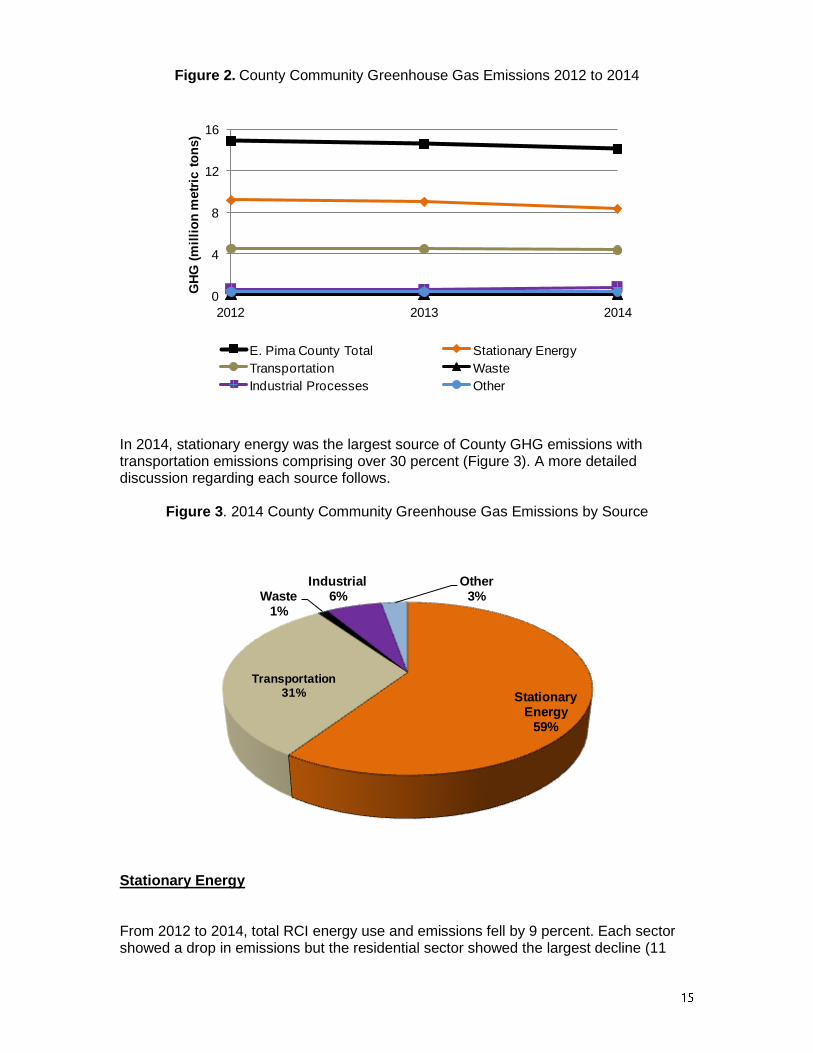
Figure 2. County Community Greenhouse Gas Emissions 2012 to 2014
In 2014, stationary energy was the largest source of County GHG emissions with transportation emissions comprising over 30 percent (Figure 3). A more detailed discussion regarding each source follows.
Figure 3. 2014 County Community Greenhouse Gas Emissions by Source
Stationary Energy From 2012 to 2014, total RCI energy use and emissions fell by 9 percent. Each sector showed a drop in emissions but the residential sector showed the largest decline (11
0
4
8
12
16
2012 2013 2014
GH
G (
mil
lio
n m
etr
ic t
on
s)
E. Pima County Total Stationary Energy
Transportation Waste
Industrial Processes Other
Stationary Energy
59%
Transportation31%
Waste1%
Industrial6%
Other3%

percent) (Table 1). Electricity emissions from all sectors fell by 8 percent; natural gas emissions from all sectors dropped by 13 percent over the survey period. In 2014, stationary energy use generated 59 percent of annual emissions (Figure 3). As in other survey years, residential energy use was the largest component (44 percent) of 2014 stationary energy use emissions (Figure 4). Residential Energy Use From 2012 to 2014, residential energy use emissions dropped by 11 percent, reflecting reductions in both electricity and natural gas use. Estimated 2014 County Community per household energy-associated emissions was approximately 9.6 metric tons per year (Appendix C). Residential energy use contributed 26 percent to the 2014 County Community emission total.
Figure 4. 2014 County Community Stationary Energy Emissions
Commercial Energy Use Commercial energy use emissions 2012 to 2014 fell by 9 percent over the survey period, reflecting reductions in both electricity and natural gas use. In 2014, commercial energy use produced 15 percent of the total County Community emissions. Industrial Energy Use Industrial energy use includes fossil fuel combustion (natural gas and diesel) and electricity use. From 2012 to 2014, sector emissions declined by 6 percent. Although both components showed declines, fossil fuel combustion exhibited the most precipitous drop (58 percent).
Residential Energy Use
44%
Commercial Energy Use
25%
Industrial Energy Use
31%
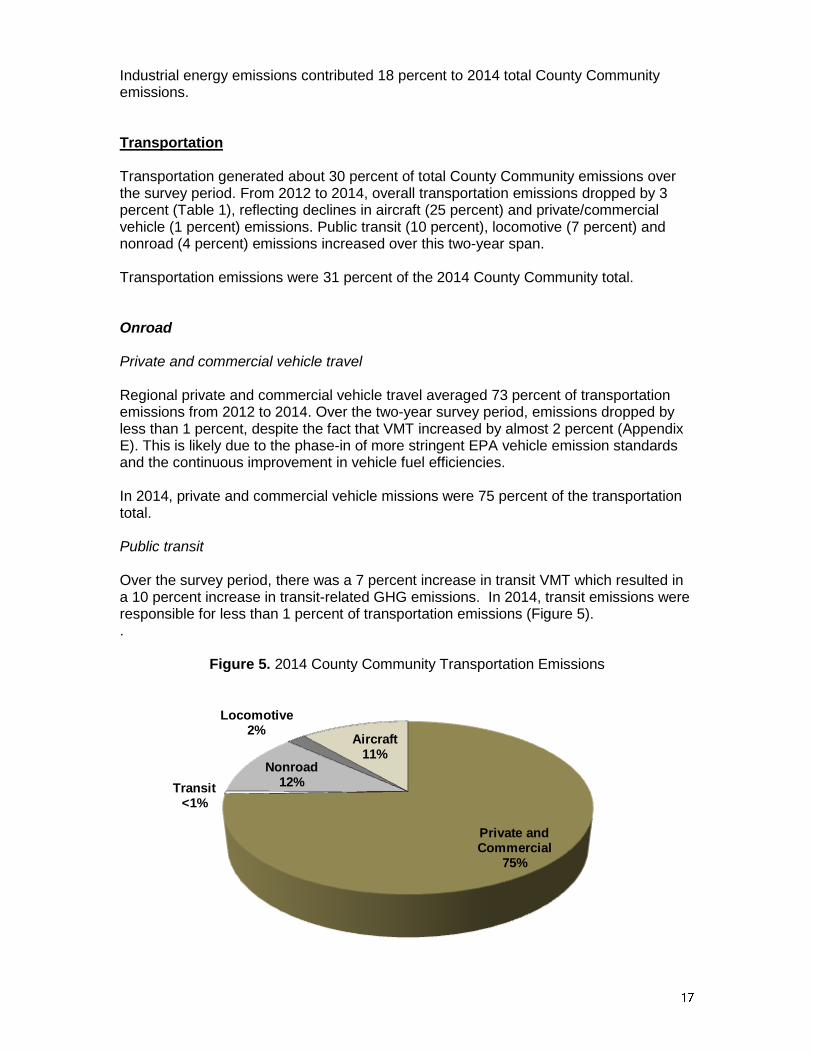
Industrial energy emissions contributed 18 percent to 2014 total County Community emissions. Transportation Transportation generated about 30 percent of total County Community emissions over the survey period. From 2012 to 2014, overall transportation emissions dropped by 3 percent (Table 1), reflecting declines in aircraft (25 percent) and private/commercial vehicle (1 percent) emissions. Public transit (10 percent), locomotive (7 percent) and nonroad (4 percent) emissions increased over this two-year span. Transportation emissions were 31 percent of the 2014 County Community total. Onroad Private and commercial vehicle travel Regional private and commercial vehicle travel averaged 73 percent of transportation emissions from 2012 to 2014. Over the two-year survey period, emissions dropped by less than 1 percent, despite the fact that VMT increased by almost 2 percent (Appendix E). This is likely due to the phase-in of more stringent EPA vehicle emission standards and the continuous improvement in vehicle fuel efficiencies. In 2014, private and commercial vehicle missions were 75 percent of the transportation total. Public transit Over the survey period, there was a 7 percent increase in transit VMT which resulted in a 10 percent increase in transit-related GHG emissions. In 2014, transit emissions were responsible for less than 1 percent of transportation emissions (Figure 5). .
Figure 5. 2014 County Community Transportation Emissions
Private and Commercial
75%
Transit<1%
Nonroad12%
Locomotive2%
Aircraft11%
Nonroad Nonroad emissions represent the 2012 to 2014 Pima County MOVES Nonroad2008a values based on Pima County population, sector employment and land use data. Over the survey period, nonroad emissions increased by 4 percent due to the projected increase in nonroad vehicle population. Nonroad vehicle emissions were 12 percent of transportation emissions and about 4 percent of 2014 total County Community emissions. Locomotives Emissions from Union Pacific Railroad travel increased by 7 percent over the survey period, which is likely due to the increase in total gross tons transported over this period (Union Pacific, 2016). In 2014, locomotive emissions were 2 percent of transportation emissions and less than 1 percent of total County emissions (Figure 5). Aircraft Aircraft emissions represent the combustion of Avgas and Jet A dispensed at the Tucson International, Marana and La Cholla Airports, Ryan Airfield and Davis Monthan. There was a 25 percent decline in emissions over the survey period. According to commercial aircraft staff, these declines might be attributed to the economic slowdown and reduced demand for air travel. In 2014, aircraft emissions represented 11 percent of the transportation emissions and about 4 percent of total County Community emissions.

Table 1. County Community GHG Emissions (metric tons CO2e) and Energy Consumption (million British thermal units- MMBtu) 2012 to 2014
CO2e
(metric tons) MMBtu
CO2e
(metric tons) MMBtu
CO2e
(metric tons) MMBtu
STATIONARY ENERGY
Residential
Fossil fuel combustion 421,774 7,931,800 467,482 8,791,423 371,535 6,987,100
Grid-supplied electricity 3,709,426 15,344,361 3,632,806 14,796,141 3,309,504 14,323,513
Residential subtotal 4,131,200 23,276,161 4,100,288 23,587,564 3,681,039 21,310,613 -11
Commercial
Fossil fuel combustion 367,704 6,915,005 381,770 7,179,520 343,761 6,464,739
Grid-supplied electricity 1,958,181 8,092,132 1,893,312 7,747,002 1,776,338 7,687,981
Commercial subtotal 2,325,885 15,007,137 2,275,082 14,926,522 2,120,099 14,152,719 -9
Industrial
Fossil fuel combustion 72,122 1,360,988 32,550 609,702 30,319 565,786
Grid-supplied electricity 2,662,458 11,006,826 2,661,189 10,897,611 2,551,056 11,040,956
Industrial subtotal 2,734,580 12,367,814 2,693,739 11,507,313 2,581,375 11,606,742 -6
STATIONARY ENERGY TOTAL 9,191,665 50,651,111 9,069,108 50,021,399 8,382,513 47,070,074 -9
TRANSPORTATION
Onroad
Private & commercial vehicle travel 3,291,662 42,653,984 3,279,454 42,521,942 3,267,466 42,543,283
Transit 22,149 285,866 22,167 286,108 24,470 306,659
Onroad subtotal 3,313,811 42,939,850 3,301,621 42,808,050 3,291,936 42,849,942 -1
Nonroad 489,340 n.a. 499,768 n.a. 510,187 n.a. 4
Locomotives 79,346 1,063,042 82,781 1,109,059 84,820 1,136,387 7
Aircraft 656,878 818,768 610,804 8,116,156 495,356 6,582,937 -25
TRANSPORTATION TOTAL 4,539,375 44,821,659 4,494,973 52,033,265 4,382,299 50,569,266 -3
WASTE
Solid waste disposal 153,901 n.a. 145,285 n.a. 144,447 n.a. -6
Wastewater treatment process 2,368 190,942 2,581 165,204 2,623 174,109 11
WASTE TOTAL 156,269 190,942 147,866 165,204 147,070 174,109 -6
INDUSTRIAL PROCESSES TOTAL 624,792 n.a 552,298 n.a 828,921 n.a 33
OTHER- Central Arizona Project 390,220 1,366,914 377,493 1,354,493 387,402 1,326,174 -1
E. PIMA COUNTY COMMUNITY GHG TOTAL 14,902,321 97,030,627 14,641,739 103,574,361 14,128,205 99,139,623 -5
ENERGY INDUSTRIES TOTAL* 573,685 n.a. 593,313 n.a. 681,842 n.a. 19
Percent
CO2e change
2014-2012
2012 2013 2014
*Energy industries emissions not included in County Community totals
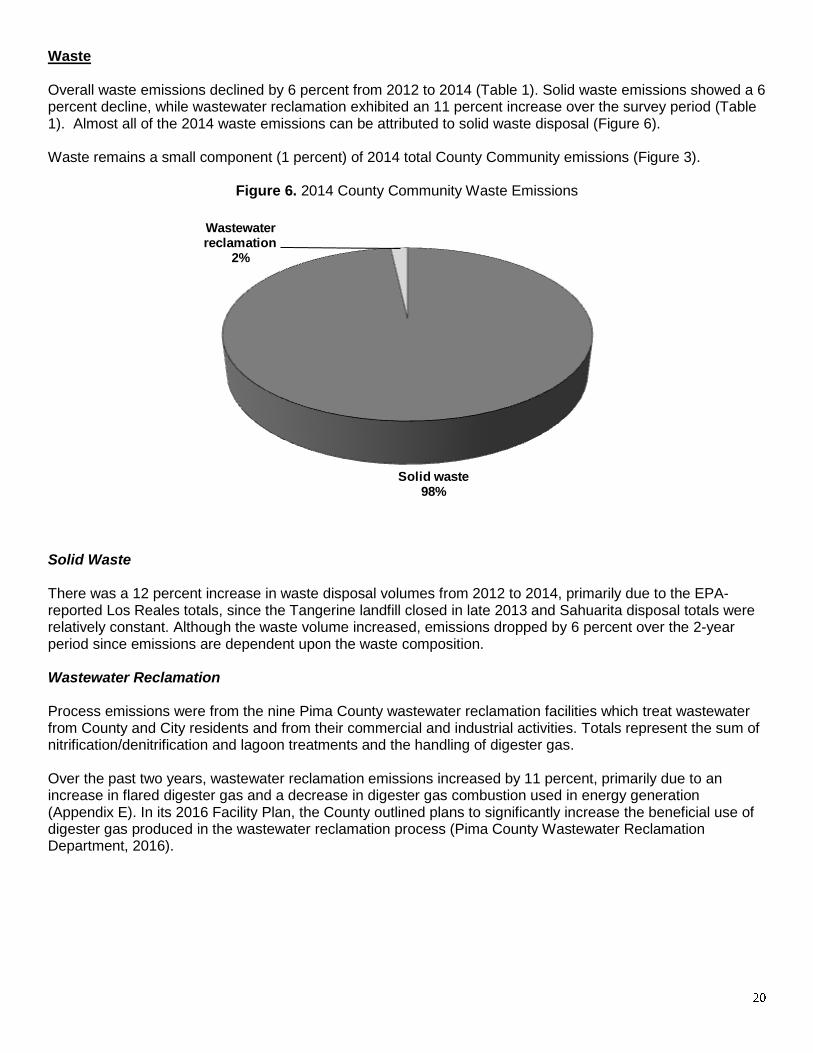
Waste Overall waste emissions declined by 6 percent from 2012 to 2014 (Table 1). Solid waste emissions showed a 6 percent decline, while wastewater reclamation exhibited an 11 percent increase over the survey period (Table 1). Almost all of the 2014 waste emissions can be attributed to solid waste disposal (Figure 6). Waste remains a small component (1 percent) of 2014 total County Community emissions (Figure 3).
Figure 6. 2014 County Community Waste Emissions
Solid Waste There was a 12 percent increase in waste disposal volumes from 2012 to 2014, primarily due to the EPA-reported Los Reales totals, since the Tangerine landfill closed in late 2013 and Sahuarita disposal totals were relatively constant. Although the waste volume increased, emissions dropped by 6 percent over the 2-year period since emissions are dependent upon the waste composition. Wastewater Reclamation Process emissions were from the nine Pima County wastewater reclamation facilities which treat wastewater from County and City residents and from their commercial and industrial activities. Totals represent the sum of nitrification/denitrification and lagoon treatments and the handling of digester gas. Over the past two years, wastewater reclamation emissions increased by 11 percent, primarily due to an increase in flared digester gas and a decrease in digester gas combustion used in energy generation (Appendix E). In its 2016 Facility Plan, the County outlined plans to significantly increase the beneficial use of digester gas produced in the wastewater reclamation process (Pima County Wastewater Reclamation Department, 2016).
Solid waste98%
Wastewater reclamation
2%
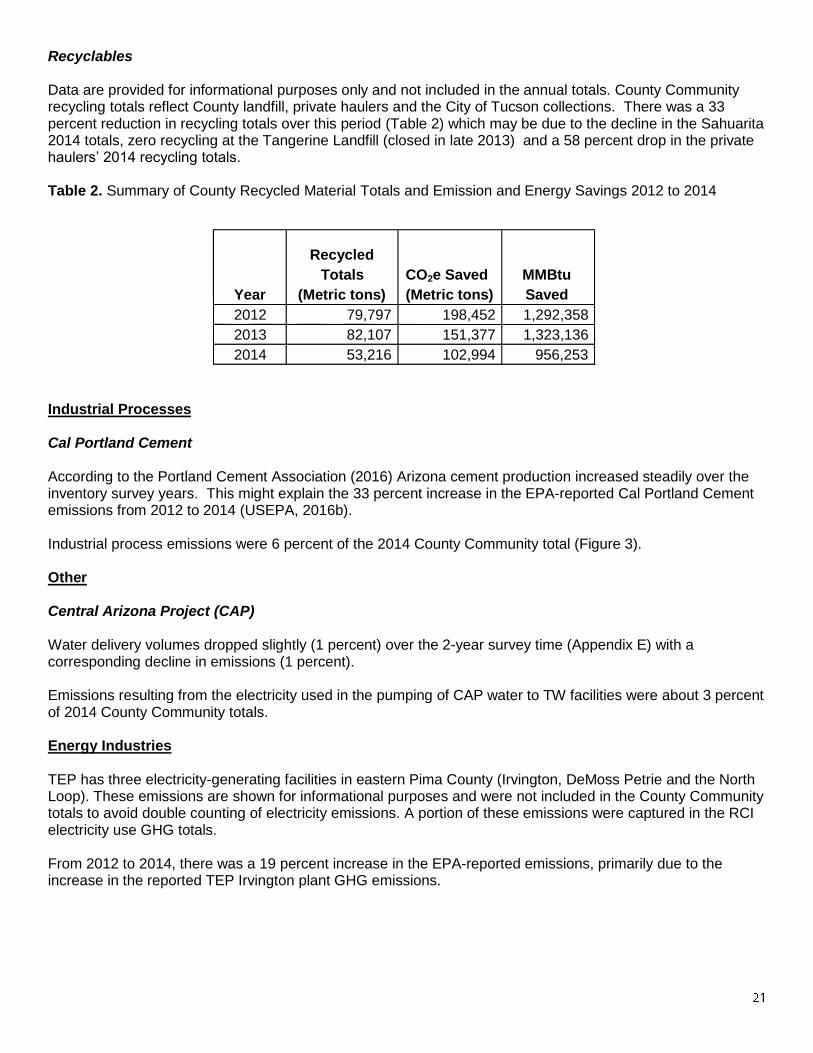
Recyclables Data are provided for informational purposes only and not included in the annual totals. County Community recycling totals reflect County landfill, private haulers and the City of Tucson collections. There was a 33 percent reduction in recycling totals over this period (Table 2) which may be due to the decline in the Sahuarita 2014 totals, zero recycling at the Tangerine Landfill (closed in late 2013) and a 58 percent drop in the private haulers’ 2014 recycling totals.
Table 2. Summary of County Recycled Material Totals and Emission and Energy Savings 2012 to 2014
Industrial Processes Cal Portland Cement According to the Portland Cement Association (2016) Arizona cement production increased steadily over the inventory survey years. This might explain the 33 percent increase in the EPA-reported Cal Portland Cement emissions from 2012 to 2014 (USEPA, 2016b). Industrial process emissions were 6 percent of the 2014 County Community total (Figure 3). Other Central Arizona Project (CAP) Water delivery volumes dropped slightly (1 percent) over the 2-year survey time (Appendix E) with a corresponding decline in emissions (1 percent). Emissions resulting from the electricity used in the pumping of CAP water to TW facilities were about 3 percent of 2014 County Community totals. Energy Industries TEP has three electricity-generating facilities in eastern Pima County (Irvington, DeMoss Petrie and the North Loop). These emissions are shown for informational purposes and were not included in the County Community totals to avoid double counting of electricity emissions. A portion of these emissions were captured in the RCI electricity use GHG totals. From 2012 to 2014, there was a 19 percent increase in the EPA-reported emissions, primarily due to the increase in the reported TEP Irvington plant GHG emissions.
Year
Recycled
Totals
(Metric tons)
CO2e Saved
(Metric tons)
MMBtu
Saved
2012 79,797 198,452 1,292,358
2013 82,107 151,377 1,323,136
2014 53,216 102,994 956,253
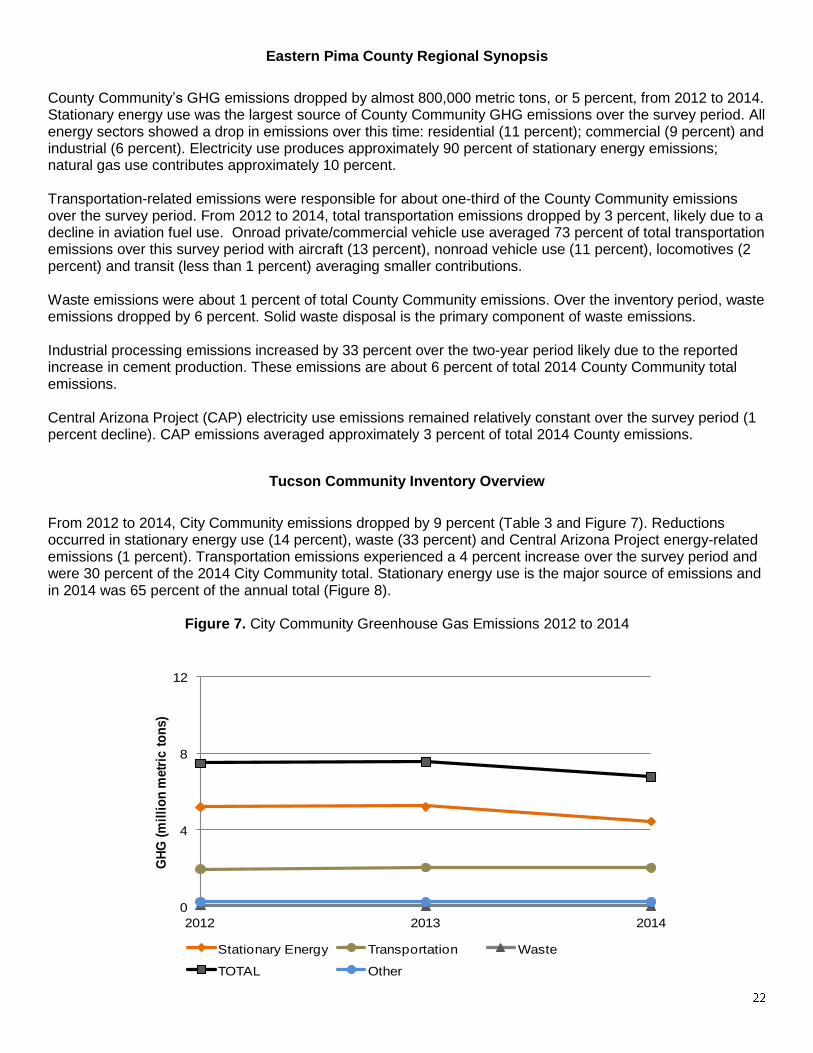
Eastern Pima County Regional Synopsis
County Community’s GHG emissions dropped by almost 800,000 metric tons, or 5 percent, from 2012 to 2014. Stationary energy use was the largest source of County Community GHG emissions over the survey period. All energy sectors showed a drop in emissions over this time: residential (11 percent); commercial (9 percent) and industrial (6 percent). Electricity use produces approximately 90 percent of stationary energy emissions; natural gas use contributes approximately 10 percent. Transportation-related emissions were responsible for about one-third of the County Community emissions over the survey period. From 2012 to 2014, total transportation emissions dropped by 3 percent, likely due to a decline in aviation fuel use. Onroad private/commercial vehicle use averaged 73 percent of total transportation emissions over this survey period with aircraft (13 percent), nonroad vehicle use (11 percent), locomotives (2 percent) and transit (less than 1 percent) averaging smaller contributions. Waste emissions were about 1 percent of total County Community emissions. Over the inventory period, waste emissions dropped by 6 percent. Solid waste disposal is the primary component of waste emissions. Industrial processing emissions increased by 33 percent over the two-year period likely due to the reported increase in cement production. These emissions are about 6 percent of total 2014 County Community total emissions. Central Arizona Project (CAP) electricity use emissions remained relatively constant over the survey period (1 percent decline). CAP emissions averaged approximately 3 percent of total 2014 County emissions.
Tucson Community Inventory Overview
From 2012 to 2014, City Community emissions dropped by 9 percent (Table 3 and Figure 7). Reductions occurred in stationary energy use (14 percent), waste (33 percent) and Central Arizona Project energy-related emissions (1 percent). Transportation emissions experienced a 4 percent increase over the survey period and were 30 percent of the 2014 City Community total. Stationary energy use is the major source of emissions and in 2014 was 65 percent of the annual total (Figure 8).
Figure 7. City Community Greenhouse Gas Emissions 2012 to 2014
0
4
8
12
2012 2013 2014
GH
G (
mil
lio
n m
etr
ic t
on
s)
Stationary Energy Transportation Waste
TOTAL Other

Figure 8. 2014 City Community Greenhouse Gas Emissions by Source
Stationary Energy From 2012 to 2014, total City Community RCI energy-related emissions declined by 14 percent. Reductions occurred in all sectors with industrial emissions showing the sharpest decline (25 percent); residential and commercial energy emissions dropped by 12 percent and 9 percent, respectively. Residential energy use was the major contributor to stationary energy emissions, averaging 40 percent of stationary energy emissions from 2012 to 2014. Residential From 2012 to 2014, the City Community total residential energy use emissions dropped by 12 percent, resulting from a 45 percent drop in natural gas and 6 percent drop in electricity emissions. In 2014, the estimated City per household energy-related emissions was 9.1 metric tons per year (Appendix C). Residential energy use was responsible for 27 percent of the 2014 City Community’s total emissions. Commercial From 2012 to 2014, City commercial energy use emissions fell by 9 percent; both natural gas (15 percent) and electricity (7 percent) emissions showed declines. Commercial energy emissions were more than one-third of total 2014 stationary energy emissions (Figure 9) and represented 22 percent of the 2014 City Community total emissions. Industrial From 2012 to 2014, industrial electricity use emissions declined by 25 percent due to a large drop in natural gas use (82 percent) and a 23 percent reduction in electricity use emissions. Industrial energy use was responsible for 16 percent of the 2014 City Community annual emissions.
Stationary Energy
65%
Transportation
30%
Waste1%
Other4%
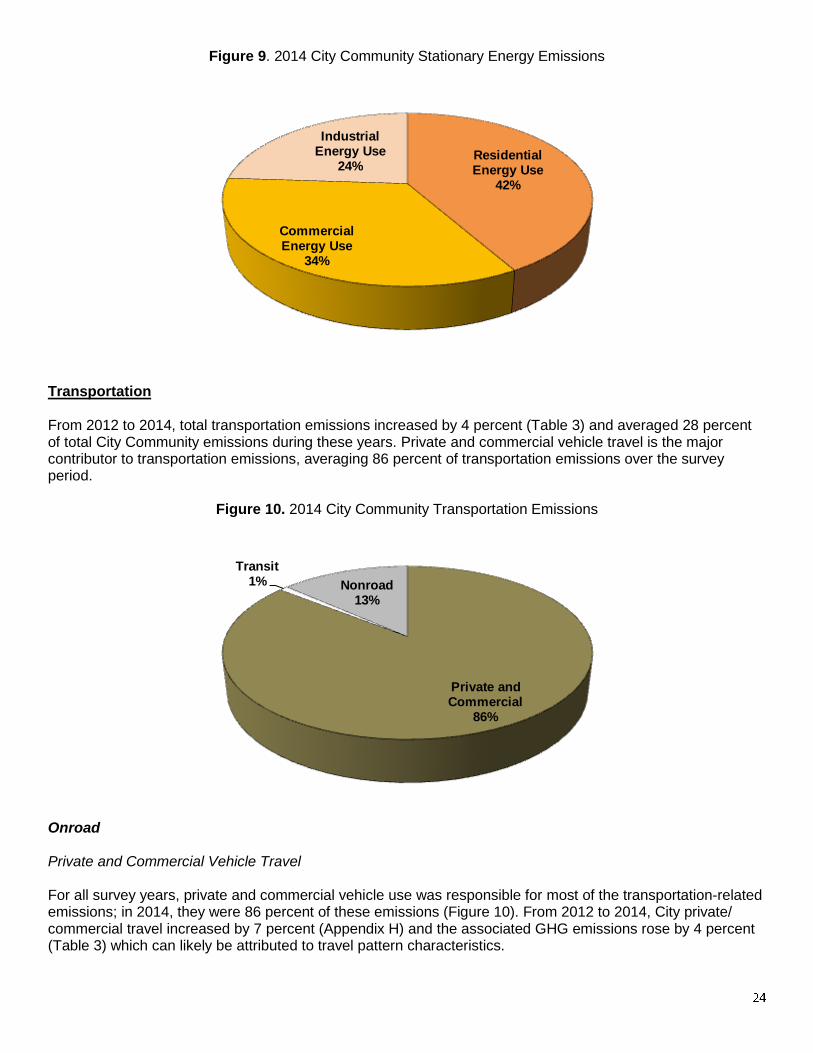
Figure 9. 2014 City Community Stationary Energy Emissions
Transportation From 2012 to 2014, total transportation emissions increased by 4 percent (Table 3) and averaged 28 percent of total City Community emissions during these years. Private and commercial vehicle travel is the major contributor to transportation emissions, averaging 86 percent of transportation emissions over the survey period.
Figure 10. 2014 City Community Transportation Emissions
Onroad Private and Commercial Vehicle Travel For all survey years, private and commercial vehicle use was responsible for most of the transportation-related emissions; in 2014, they were 86 percent of these emissions (Figure 10). From 2012 to 2014, City private/ commercial travel increased by 7 percent (Appendix H) and the associated GHG emissions rose by 4 percent (Table 3) which can likely be attributed to travel pattern characteristics.
Residential Energy Use
42%
Commercial Energy Use
34%
Industrial Energy Use
24%
Private and Commercial
86%
Transit1% Nonroad
13%
Public Transit From 2012 to 2014, City Community public transit VMT rose by 4 percent and emissions rose by 7 percent. Transit emissions are a small portion of onroad transportation emissions, averaging about 1 percent over the survey period. Nonroad These nonroad emissions represent the 2012 to 2014 MOVES Nonroad2008a Pima County values proportioned by the 2012 to 2014 City: County population ratios. Over the survey period, nonroad emissions increased by 4 percent due to the projected increase in nonroad vehicle population. In 2014, nonroad vehicle emissions were 13 percent of the total transportation emissions and 4 percent of the annual City Community emissions.
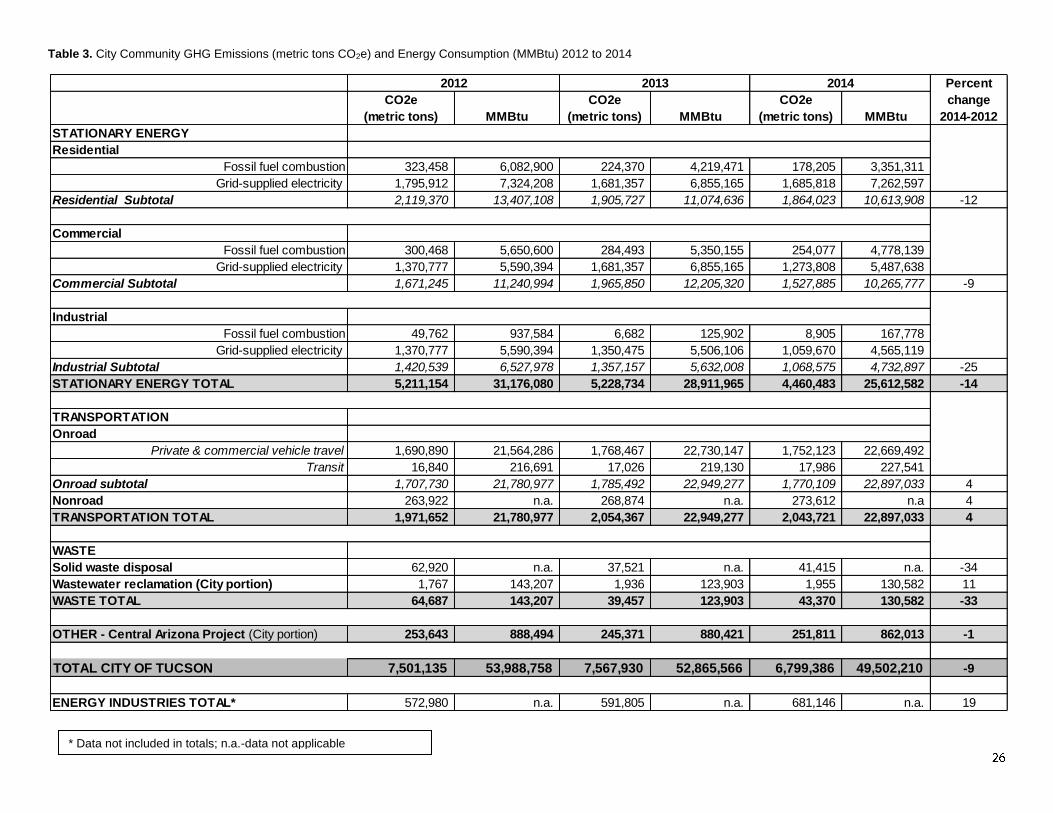
Table 3. City Community GHG Emissions (metric tons CO2e) and Energy Consumption (MMBtu) 2012 to 2014
CO2e
(metric tons) MMBtu
CO2e
(metric tons) MMBtu
CO2e
(metric tons) MMBtu
STATIONARY ENERGY
Residential
Fossil fuel combustion 323,458 6,082,900 224,370 4,219,471 178,205 3,351,311
Grid-supplied electricity 1,795,912 7,324,208 1,681,357 6,855,165 1,685,818 7,262,597
Residential Subtotal 2,119,370 13,407,108 1,905,727 11,074,636 1,864,023 10,613,908 -12
Commercial
Fossil fuel combustion 300,468 5,650,600 284,493 5,350,155 254,077 4,778,139
Grid-supplied electricity 1,370,777 5,590,394 1,681,357 6,855,165 1,273,808 5,487,638
Commercial Subtotal 1,671,245 11,240,994 1,965,850 12,205,320 1,527,885 10,265,777 -9
Industrial
Fossil fuel combustion 49,762 937,584 6,682 125,902 8,905 167,778
Grid-supplied electricity 1,370,777 5,590,394 1,350,475 5,506,106 1,059,670 4,565,119
Industrial Subtotal 1,420,539 6,527,978 1,357,157 5,632,008 1,068,575 4,732,897 -25
STATIONARY ENERGY TOTAL 5,211,154 31,176,080 5,228,734 28,911,965 4,460,483 25,612,582 -14
TRANSPORTATION
Onroad
Private & commercial vehicle travel 1,690,890 21,564,286 1,768,467 22,730,147 1,752,123 22,669,492
Transit 16,840 216,691 17,026 219,130 17,986 227,541
Onroad subtotal 1,707,730 21,780,977 1,785,492 22,949,277 1,770,109 22,897,033 4
Nonroad 263,922 n.a. 268,874 n.a. 273,612 n.a 4
TRANSPORTATION TOTAL 1,971,652 21,780,977 2,054,367 22,949,277 2,043,721 22,897,033 4
WASTE
Solid waste disposal 62,920 n.a. 37,521 n.a. 41,415 n.a. -34
Wastewater reclamation (City portion) 1,767 143,207 1,936 123,903 1,955 130,582 11
WASTE TOTAL 64,687 143,207 39,457 123,903 43,370 130,582 -33
OTHER - Central Arizona Project (City portion) 253,643 888,494 245,371 880,421 251,811 862,013 -1
TOTAL CITY OF TUCSON 7,501,135 53,988,758 7,567,930 52,865,566 6,799,386 49,502,210 -9
ENERGY INDUSTRIES TOTAL* 572,980 n.a. 591,805 n.a. 681,146 n.a. 19
2012 20142013 Percent
change
2014-2012
* Data not included in totals; n.a.-data not applicable

Waste From 2012 to 2014, City Community total waste emissions declined by 33 percent, which can be largely attributed to the drop in the solid waste portion (Table 3). Solid wastes were the major component of waste emissions (Figure 11) but were consistently a small portion of annual City Community emissions (1 percent) (Figure 8). In 2014, wastes were 1 percent of the annual total.
Figure 11. 2014 City Community Waste Emissions
Solid Waste Data shown here represents emissions from Los Reales and Harrison (closed) landfill as reported to EPA (EPA, 2016b). Although the Los Reales reported waste volumes increased over the survey period, total GHG emissions dropped by 34 percent, reflecting declines in both Los Reales and Harrison landfills’ emissions. Landfill emissions are determined by the type of waste, which affect the rate of decomposition and GHG production. Wastewater Reclamation Emissions represent the portion of City Community wastewater treated by the Pima County wastewater Reclamation Department, estimated by County staff to be 75 percent (Berry, M. 2016). Totals represent the sum of nitrification/denitrification and lagoon treatment and the handling of digester gas. Over the survey period, waste reclamation emissions increased by 11 percent. Recyclables Emission and energy saving data are provided for information purposes only (Table 4) and are not incorporated into to the City Community totals. Recycling totals reflect curbside, community and landfill collections. Emissions and recycling totals have declined by 4 percent over the two-year survey period (Table 4).
Wastewater reclamation
5%
Solid waste95%
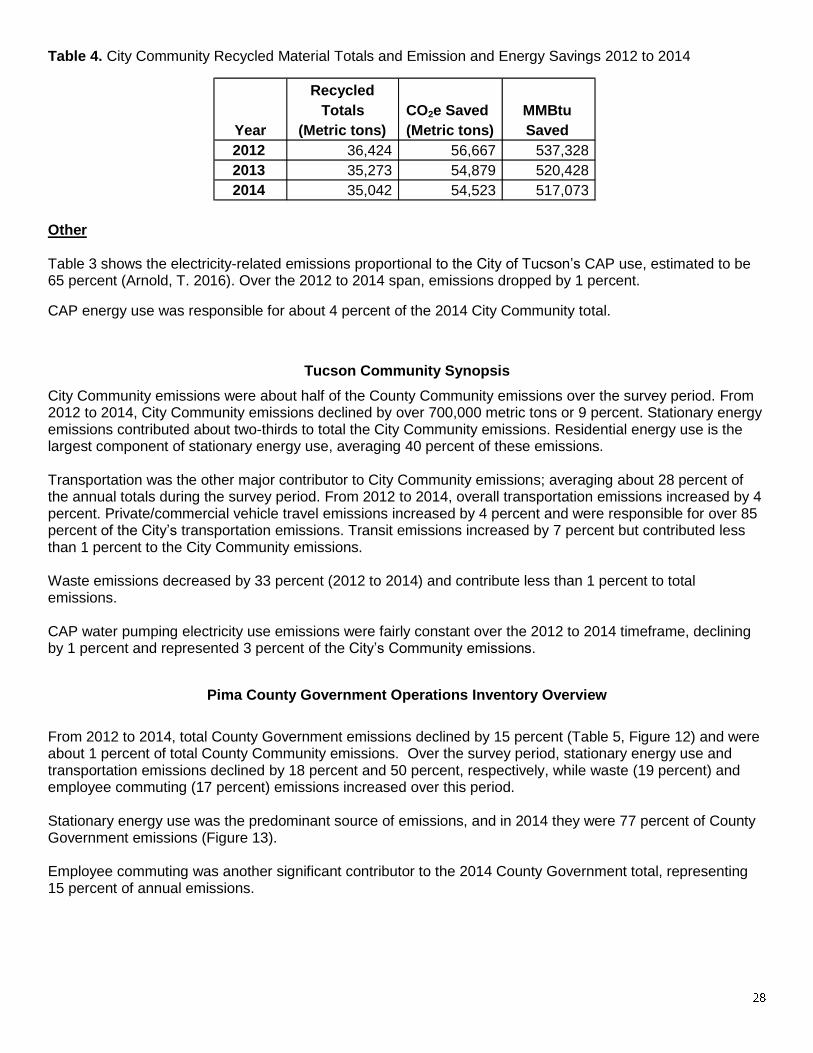
Table 4. City Community Recycled Material Totals and Emission and Energy Savings 2012 to 2014
Other Table 3 shows the electricity-related emissions proportional to the City of Tucson’s CAP use, estimated to be 65 percent (Arnold, T. 2016). Over the 2012 to 2014 span, emissions dropped by 1 percent.
CAP energy use was responsible for about 4 percent of the 2014 City Community total.
Tucson Community Synopsis
City Community emissions were about half of the County Community emissions over the survey period. From 2012 to 2014, City Community emissions declined by over 700,000 metric tons or 9 percent. Stationary energy emissions contributed about two-thirds to total the City Community emissions. Residential energy use is the largest component of stationary energy use, averaging 40 percent of these emissions. Transportation was the other major contributor to City Community emissions; averaging about 28 percent of the annual totals during the survey period. From 2012 to 2014, overall transportation emissions increased by 4 percent. Private/commercial vehicle travel emissions increased by 4 percent and were responsible for over 85 percent of the City’s transportation emissions. Transit emissions increased by 7 percent but contributed less than 1 percent to the City Community emissions. Waste emissions decreased by 33 percent (2012 to 2014) and contribute less than 1 percent to total emissions. CAP water pumping electricity use emissions were fairly constant over the 2012 to 2014 timeframe, declining by 1 percent and represented 3 percent of the City’s Community emissions.
Pima County Government Operations Inventory Overview
From 2012 to 2014, total County Government emissions declined by 15 percent (Table 5, Figure 12) and were about 1 percent of total County Community emissions. Over the survey period, stationary energy use and transportation emissions declined by 18 percent and 50 percent, respectively, while waste (19 percent) and employee commuting (17 percent) emissions increased over this period. Stationary energy use was the predominant source of emissions, and in 2014 they were 77 percent of County Government emissions (Figure 13). Employee commuting was another significant contributor to the 2014 County Government total, representing 15 percent of annual emissions.
Year
Recycled
Totals
(Metric tons)
CO2e Saved
(Metric tons)
MMBtu
Saved
2012 36,424 56,667 537,328
2013 35,273 54,879 520,428
2014 35,042 54,523 517,073
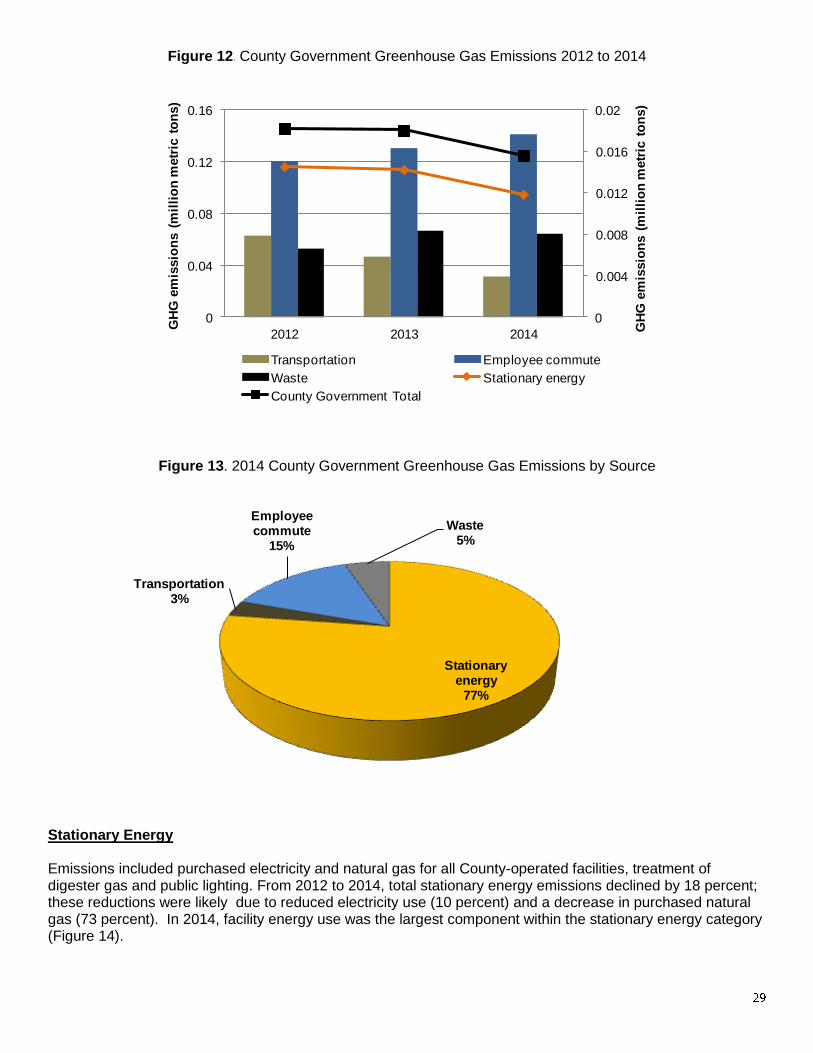
Figure 12. County Government Greenhouse Gas Emissions 2012 to 2014
Figure 13. 2014 County Government Greenhouse Gas Emissions by Source
Stationary Energy Emissions included purchased electricity and natural gas for all County-operated facilities, treatment of digester gas and public lighting. From 2012 to 2014, total stationary energy emissions declined by 18 percent; these reductions were likely due to reduced electricity use (10 percent) and a decrease in purchased natural gas (73 percent). In 2014, facility energy use was the largest component within the stationary energy category (Figure 14).
0
0.004
0.008
0.012
0.016
0.02
0
0.04
0.08
0.12
0.16
2012 2013 2014
GH
G e
mis
sio
ns (
mil
lio
n m
etr
ic t
on
s)
GH
G e
mis
sio
ns (
mil
lio
n m
etr
ic t
on
s)
Transportation Employee commute
Waste Stationary energy
County Government Total
Stationary energy
77%
Transportation3%
Employee commute
15%
Waste5%
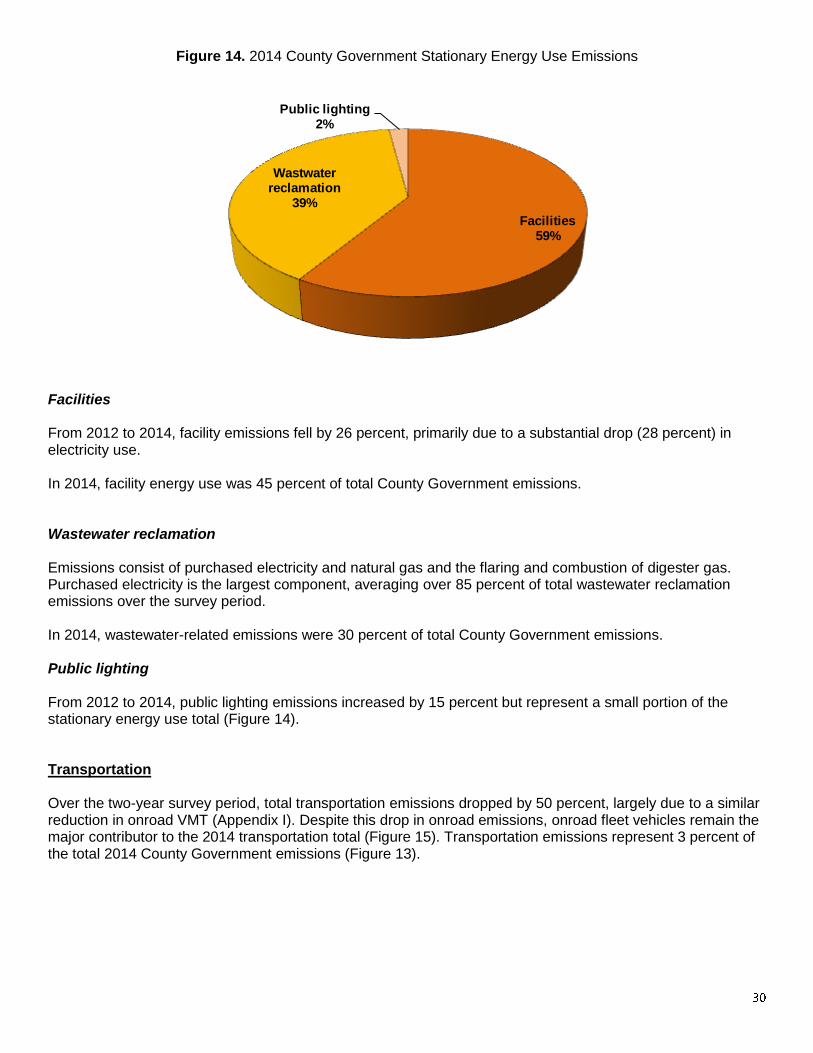
Figure 14. 2014 County Government Stationary Energy Use Emissions
Facilities From 2012 to 2014, facility emissions fell by 26 percent, primarily due to a substantial drop (28 percent) in electricity use. In 2014, facility energy use was 45 percent of total County Government emissions. Wastewater reclamation Emissions consist of purchased electricity and natural gas and the flaring and combustion of digester gas. Purchased electricity is the largest component, averaging over 85 percent of total wastewater reclamation emissions over the survey period. In 2014, wastewater-related emissions were 30 percent of total County Government emissions. Public lighting From 2012 to 2014, public lighting emissions increased by 15 percent but represent a small portion of the stationary energy use total (Figure 14). Transportation Over the two-year survey period, total transportation emissions dropped by 50 percent, largely due to a similar reduction in onroad VMT (Appendix I). Despite this drop in onroad emissions, onroad fleet vehicles remain the major contributor to the 2014 transportation total (Figure 15). Transportation emissions represent 3 percent of the total 2014 County Government emissions (Figure 13).
Facilities 59%
Wastwater reclamation
39%
Public lighting2%

Figure 15. 2014 County Government Transportation Emissions
Onroad From 2012-2014, emissions from the County Government fleet emissions dropped by 53 percent, reflecting an approximate 50 percent drop in VMT. Nonroad County government nonroad equipment is used primarily in construction. From 2012 to 2014, emissions increased by 18-fold but are a small portion of transportation emissions (5 percent) (Figure 15) and the County Government total. Waste Emissions include solid waste disposal and wastewater processing emissions. Solid waste was the major component in this category in 2014 (Figure 16) and for all survey years (Figure 16). From 2012 to 2014, waste emissions increased by 19 percent primarily due to a 32 percent increase in waste disposal volumes (Appendix I). Waste emissions were 5 percent of the total 2014 County Government emissions (Figure 13).
Onroad95%
Nonroad5%

Table 5. County Government GHG Emissions (metric tons CO2e) and Energy Consumption (MMBtu) 2012 and 2014
CO2e
(metric tons) MMBtu
CO2e
(metric tons) MMBtu
CO2e
(metric tons) MMBtu
STATIONARY ENERGY
Facilities
Fossil fuel combustion 4,349 81,783 4,073 76,588 4,418 83,090
Grid-supplied electricity 71,278 291,965 58,245 238,514 51,273 221,909
Facilities subtotal 75,627 373,748 62,318 315,102 55,691 304,999 -26
Wastewater reclamation
Fossil fuel combustion 11,784 221,618 4,145 77,947 8 157
Grid-supplied electricity 26,571 108,837 45,202 185,101 36,508 158,125
Digester gas flaring 420 92,101 622 136,591 748 164,189
Digester gas combustion for energy 26 98,841 8 28,613 3 9,920
Wastewater reclamation subtotal 38,801 521,397 49,977 428,252 37,267 332,391 -4
Public lighting
Grid-supplied electricity 1,694 6,938 1,661 6,806 1,945 8,416 15
STATIONARY ENERGY TOTAL 116,122 902,083 113,956 750,160 94,903 645,806 -18
TRANSPORTATION
County fleet onroad 7,879 101,836 5,581 72,238 3,712 48,304 -53
County fleet nonroad 12 170 253 3,432 214 2,865 1,683
TRANSPORTATION TOTAL 7,891 102,006 5,834 75,670 3,926 51,169 -50
WASTE
Solid waste 3,369 n.a. 4,571 n.a. 4,435 n.a. 32
Wastewater processing
Nitrification/denitrification 1,606 n.a. 1,686 n.a. 1,606 n.a.
Lagoons 303 n.a. 251 n.a. 251 n.a.
Wastewater processing subtotal 1,909 n.a. 1,937 n.a. 1,857 n.a. -3
WASTE TOTAL 5,278 n.a. 6,508 n.a. 6,292 n.a. 19
EMPLOYEE COMMUTE TOTAL 15,077 n.a. 16,319 n.a. 17,620 n.a. 17
TOTAL COUNTY GOVERNMENT GHG EMISSIONS 144,368 1,004,089 142,617 825,830 122,741 696,975 -15
ENERGY GENERATION
Solar 0 32,983 0 46,677 0 46,677
2012 2013 2014Percent change
2014 to 2012
n.a. - not applicable
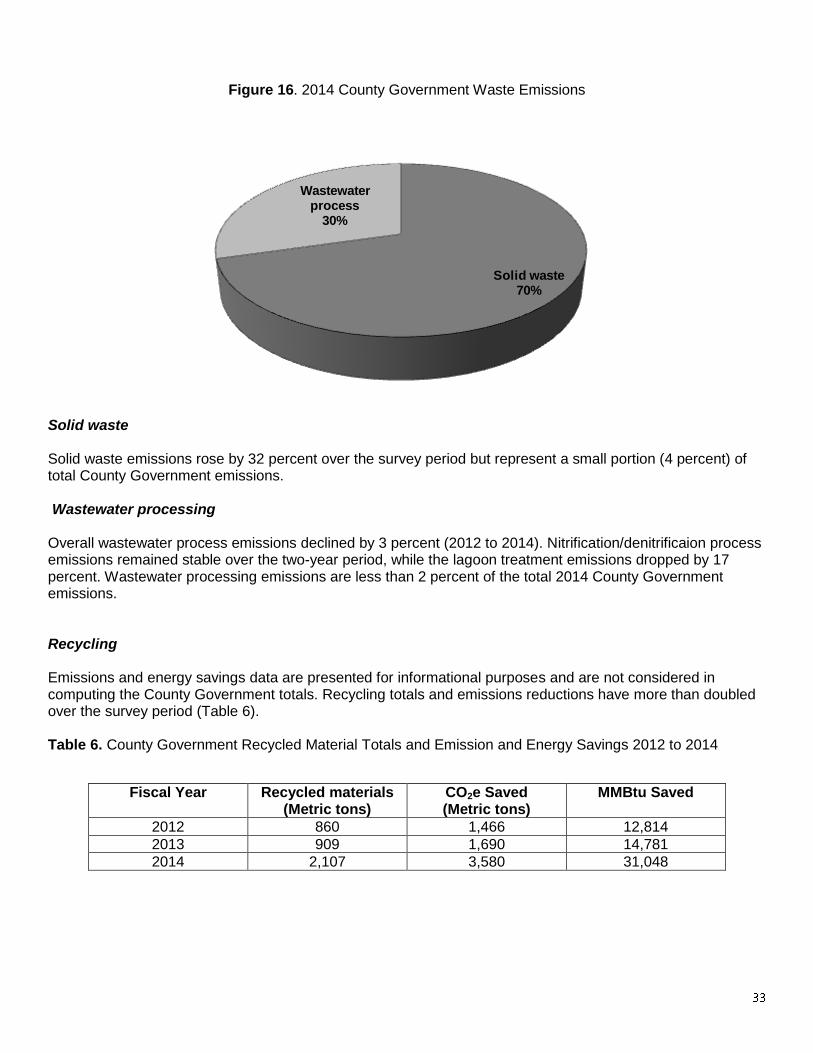
Figure 16. 2014 County Government Waste Emissions
Solid waste Solid waste emissions rose by 32 percent over the survey period but represent a small portion (4 percent) of total County Government emissions. Wastewater processing Overall wastewater process emissions declined by 3 percent (2012 to 2014). Nitrification/denitrificaion process emissions remained stable over the two-year period, while the lagoon treatment emissions dropped by 17 percent. Wastewater processing emissions are less than 2 percent of the total 2014 County Government emissions. Recycling Emissions and energy savings data are presented for informational purposes and are not considered in computing the County Government totals. Recycling totals and emissions reductions have more than doubled over the survey period (Table 6). Table 6. County Government Recycled Material Totals and Emission and Energy Savings 2012 to 2014
Fiscal Year Recycled materials (Metric tons)
CO2e Saved (Metric tons)
MMBtu Saved
2012 860 1,466 12,814
2013 909 1,690 14,781
2014 2,107 3,580 31,048
Solid waste70%
Wastewater process
30%
Employee Commute County government employee commuting VMT increased by 18 percent over the two-year survey period, accounting for a similar increase in GHG emissions (Table 5). In 2014, County Government commuting emissions were 15 percent of the annual total (Figure 13). Energy Generation Solar electricity generation does not contribute to GHG emissions but is included for informational purposes. From 2012 to 2014, the County government expanded its solar energy production by 42 percent (Table 5). Approximately 10 percent of County government’s energy needs are met using solar-generated electricity (Pima County, 2016b).
County Government Synopsis
County Government emissions are a small portion of the County Community’s total. From 2012 to 2014, County Government emissions dropped by more than 21,000 metric tons, or 15 percent. Emission reductions occurred in stationary energy use (18 percent) and in transportation (50 percent). Waste and employee commuting emissions increased over the survey period, by 19 percent and 17 percent, respectively. Stationary energy use was the major GHG source and, in 2014, was 77 percent of the County Government’s annual total. Electricity use is responsible for over 90 percent of stationary energy emissions. The County Government’s generation of renewable energy has expanded by over 40 percent during the survey period. Transportation emissions averaged about 4 percent of total County Government emissions (2012 to 2014). Although nonroad emissions increased considerably from 2012 to 2014, the large reduction in onroad emissions (53 percent) more than compensated for this increase. In 2014, County fleet vehicle use contributed 3 percent to the annual total. Waste emissions were a small component of total County Government emissions, averaging about 4 percent over the survey period. From 2012 to 2014, waste emissions grew by 19 percent which can be attributed to a 32 percent increase in solid waste volumes. Employee commuting VMT increased by 18 percent over the survey period and was a significant contributor to County Government totals. Commuting emissions averaged 12 percent over the survey period and contributed 15 percent to the 2014 annual total.
City of Tucson Government Operations Inventory Overview
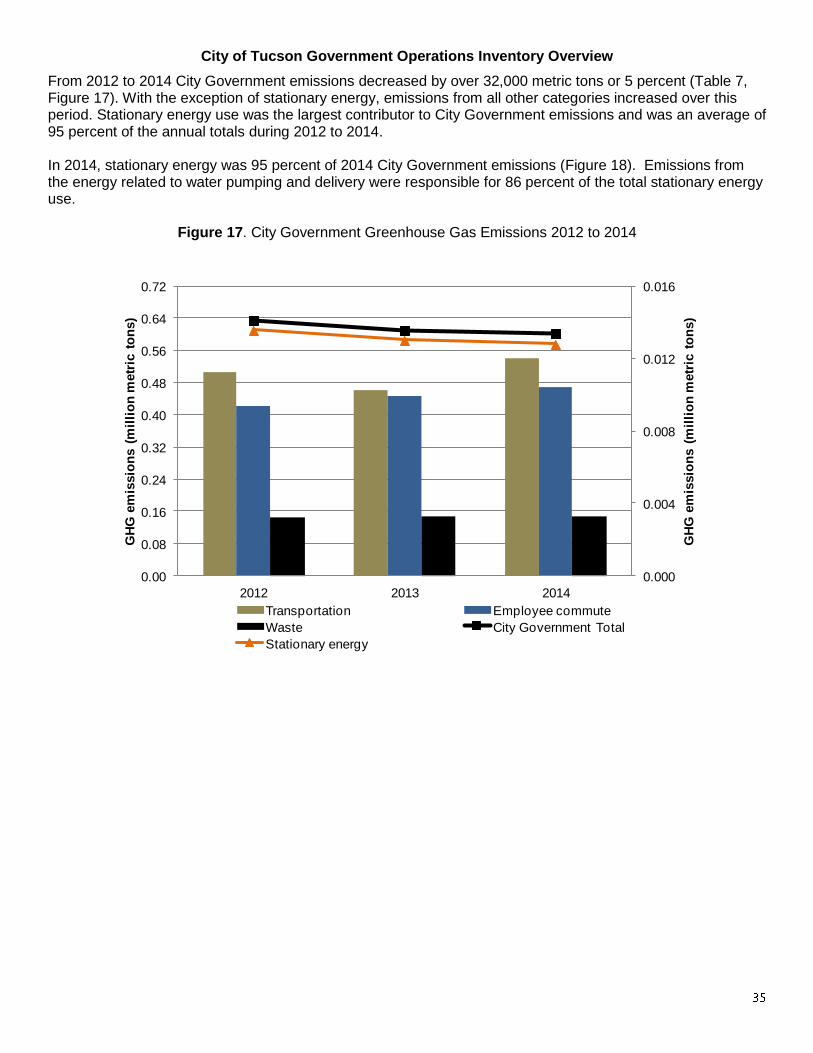
From 2012 to 2014 City Government emissions decreased by over 32,000 metric tons or 5 percent (Table 7, Figure 17). With the exception of stationary energy, emissions from all other categories increased over this period. Stationary energy use was the largest contributor to City Government emissions and was an average of 95 percent of the annual totals during 2012 to 2014. In 2014, stationary energy was 95 percent of 2014 City Government emissions (Figure 18). Emissions from the energy related to water pumping and delivery were responsible for 86 percent of the total stationary energy use.
Figure 17. City Government Greenhouse Gas Emissions 2012 to 2014
0.000
0.004
0.008
0.012
0.016
0.00
0.08
0.16
0.24
0.32
0.40
0.48
0.56
0.64
0.72
2012 2013 2014
GH
G e
mis
sio
ns (
mil
lio
n m
etr
ic t
on
s)
GH
G e
mis
sio
ns (
mil
lio
n m
etr
ic t
on
s)
Transportation Employee commute
Waste City Government Total
Stationary energy
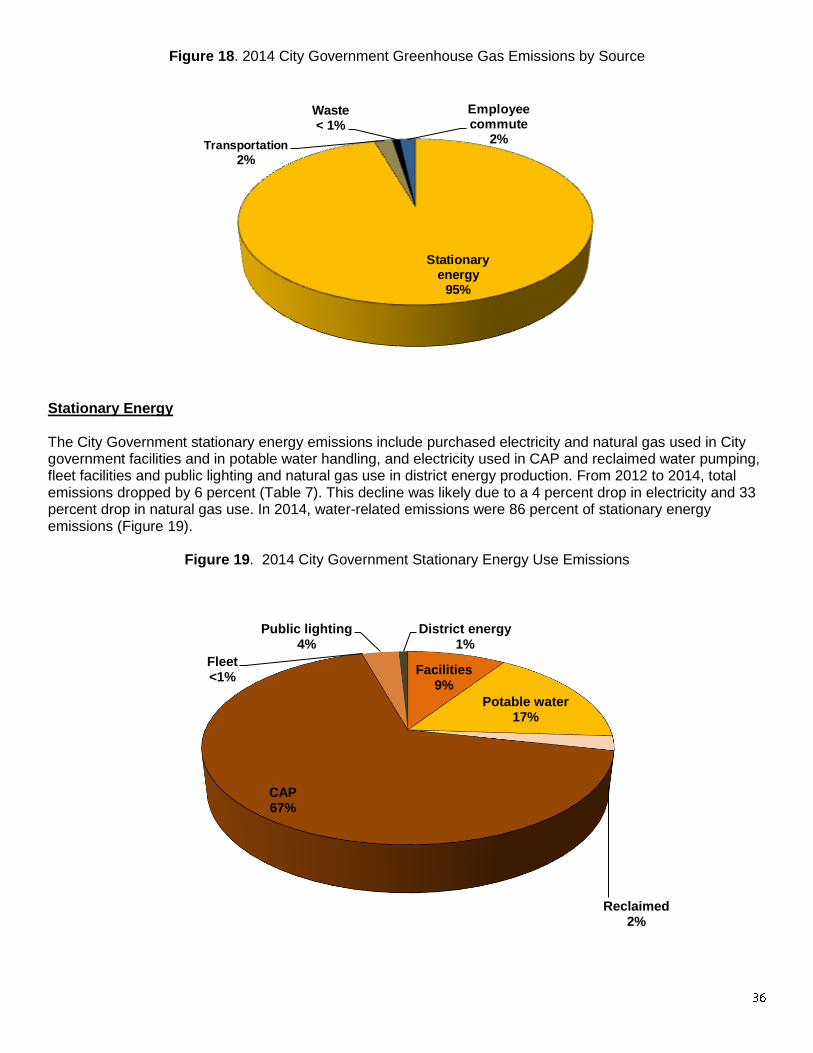
Figure 18. 2014 City Government Greenhouse Gas Emissions by Source
Stationary Energy The City Government stationary energy emissions include purchased electricity and natural gas used in City government facilities and in potable water handling, and electricity used in CAP and reclaimed water pumping, fleet facilities and public lighting and natural gas use in district energy production. From 2012 to 2014, total emissions dropped by 6 percent (Table 7). This decline was likely due to a 4 percent drop in electricity and 33 percent drop in natural gas use. In 2014, water-related emissions were 86 percent of stationary energy emissions (Figure 19).
Figure 19. 2014 City Government Stationary Energy Use Emissions
Stationary energy
95%
Transportation
2%
Waste< 1%
Employee commute
2%
Facilities 9%
Potable water 17%
Reclaimed 2%
CAP 67%
Fleet <1%
Public lighting 4%
District energy 1%
Facility Energy Use Over the survey period, facility energy use emissions dropped by 19 percent due to a 16 percent and 36 percent decline in electricity and natural gas emissions, respectively. Facility energy use was approximately 9 percent of the 2014 City Government total. Tucson Water Electricity used for potable and reclaimed water handling and CAP water delivery and natural gas used in potable water handling are presented separately. Over the 2012 to 2014 period, total water-related GHG emissions dropped by 4 percent, resulting from a 2 percent drop in total electricity use and a 39 percent drop in natural gas use. Potable Water System TW is responsible for the pumping, treatment and delivery of potable water to much of eastern Pima County. Emissions associated with water delivery fell 16 percent over the two-year survey period. Both electricity and natural gas emissions dropped over the survey period, 9 percent and 39 percent, respectively. Potable water energy use emissions were 16 percent of the 2014 City Government total. Reclaimed Water System Reclaimed water is used at almost 900 sites in Pima County for landscape irrigation in parks, golf courses, schools and homes (Tucson Water, 2013). From 2012 to 2014, reclaimed water-related energy use emissions increased slightly (2 percent). Reclaimed water energy use was 2 percent of the 2014 City total. Central Arizona Project (CAP) Most of the Colorado River water delivered to Tucson is directed into TW recharge basins in Avra Valley at the Clearwater Renewable Resource Facility. The water percolates into the ground and blends with the native groundwater in the aquifer. The blend is then recovered by a number of wells and treated before delivery to TW customers. The use of this blended water reduces reliance on groundwater and allows the water table to recover from over-pumping. Energy-related emissions associated with CAP water conveyance decreased by 1 percent from 2012 to 2014, reflecting a 1 percent decrease in water volume deliveries (Table 7, Appendix I). CAP energy use emissions were 64 percent of the 2014 City Government total. Fleet These emissions represent the electricity used to pump CNG used in the City Government fleet. Emissions from 2012 to 2014 dropped by 49 percent and are a minor component in total City Government emissions. Public lighting From 2012 to 2014, public lighting emissions fell by 8 percent; they were 4 percent of stationary energy emissions (Figure 19) and were 3 percent of the 2014 annual total.
District energy District energy emissions grew by almost 12 percent over the two-year survey period, but were a small component of City Government emissions. Transportation From 2012 to 2014, total transportation emissions rose by 6 percent (Table 7). Almost three-quarters of City Government transportation emissions are from onroad fleet travel; the nonroad fleet use contributed about one-fourth to the 2014 City Government’s transportation totals (Figure 20).
Figure 20. 2014 City Government Transportation Emissions
Onroad Emissions from onroad vehicles remained constant over the 2-year survey period (Table 7) despite a 5 percent increase in VMT. These results were primarily due to a drop in diesel usage and large increase in CNG usage (Appendix J). Onroad fleet vehicle emissions contributed less than 2 percent to the 2014 City Government total. Nonroad Nonroad emissions increased by 30 percent over the survey period due to increases in diesel and LPG fuel use over the two-year survey period. Nonroad fleet vehicle emissions contributed less than 1 percent to the 2014 City Government total. Waste Solid waste City government waste emissions were only from solid waste disposal. Over the survey period, disposal volumes increased by 8 percent, resulting in a similar increase in GHG emissions. In 2014, waste represented less than 1 percent of total 2014 City Government emissions (Figure 18).
Onroad74%
Nonroad26%
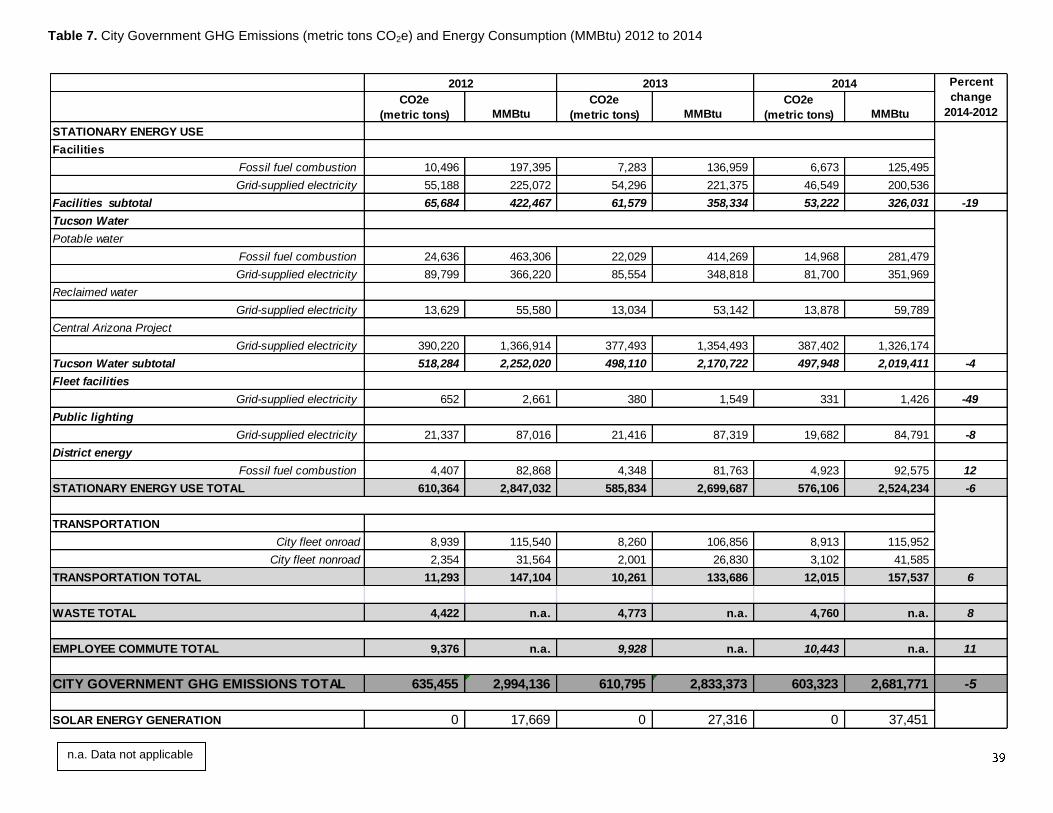
Table 7. City Government GHG Emissions (metric tons CO2e) and Energy Consumption (MMBtu) 2012 to 2014
CO2e
(metric tons) MMBtu
CO2e
(metric tons) MMBtu
CO2e
(metric tons) MMBtu
STATIONARY ENERGY USE
Facilities
Fossil fuel combustion 10,496 197,395 7,283 136,959 6,673 125,495
Grid-supplied electricity 55,188 225,072 54,296 221,375 46,549 200,536
Facilities subtotal 65,684 422,467 61,579 358,334 53,222 326,031 -19
Tucson Water
Potable water
Fossil fuel combustion 24,636 463,306 22,029 414,269 14,968 281,479
Grid-supplied electricity 89,799 366,220 85,554 348,818 81,700 351,969
Reclaimed water
Grid-supplied electricity 13,629 55,580 13,034 53,142 13,878 59,789
Central Arizona Project
Grid-supplied electricity 390,220 1,366,914 377,493 1,354,493 387,402 1,326,174
Tucson Water subtotal 518,284 2,252,020 498,110 2,170,722 497,948 2,019,411 -4
Fleet facilities
Grid-supplied electricity 652 2,661 380 1,549 331 1,426 -49
Public lighting
Grid-supplied electricity 21,337 87,016 21,416 87,319 19,682 84,791 -8
District energy
Fossil fuel combustion 4,407 82,868 4,348 81,763 4,923 92,575 12
STATIONARY ENERGY USE TOTAL 610,364 2,847,032 585,834 2,699,687 576,106 2,524,234 -6
TRANSPORTATION
City fleet onroad 8,939 115,540 8,260 106,856 8,913 115,952
City fleet nonroad 2,354 31,564 2,001 26,830 3,102 41,585
TRANSPORTATION TOTAL 11,293 147,104 10,261 133,686 12,015 157,537 6
WASTE TOTAL 4,422 n.a. 4,773 n.a. 4,760 n.a. 8
EMPLOYEE COMMUTE TOTAL 9,376 n.a. 9,928 n.a. 10,443 n.a. 11
CITY GOVERNMENT GHG EMISSIONS TOTAL 635,455 2,994,136 610,795 2,833,373 603,323 2,681,771 -5
SOLAR ENERGY GENERATION 0 17,669 0 27,316 0 37,451
Percent
change
2014-2012
2013 20142012
n.a. Data not applicable
Recycled materials Emissions and energy savings are presented for informational purposes and are not considered in the calculation of the City Government totals. The City Government recycling totals and emissions savings grew by 20 percent from 2012 to 2014 (Table 8). Table 8. City Government Recycled Material Totals and Emission and Energy Savings 2012 to 2014
Fiscal Year Recycled waste (Metric tons)
CO2e saved (Metric tons)
MMBtu saved
2012 1,106 1,721 16,321
2013 1,326 2,063 19,545
2014 1,328 2,065 19,561
Employee Commute City government employees’ VMT increased an estimated 12 percent resulting in an 11 percent increase in emissions. Employee commuting contributed 2 percent to the 2014 City Government emissions. Energy Generation Solar energy production data were provided for informational purposes since emissions are not produced (Table 7). Over the survey period City Government solar energy production has more than doubled. Currently, 13 percent of Tucson government electricity needs are met by its solar generation (Laros. J. 2016. Personal communication).
City Government Synopsis
The City Government’s emissions were a small portion of the City Community’s totals over the survey period. From 2012 to 2014, City Government emissions dropped by more than 32 metric tons, or 5 percent. Reductions occurred in stationary energy (6 percent) but increases occurred in all other categories: employee commuting (11 percent), waste (8 percent) and transportation (6 percent). In 2014, stationary energy emissions were 95 percent of the total; water-related energy use emissions were 83 percent of the 2014 total. The energy-related emissions from CAP energy-related emissions were 64 percent of 2014 total emissions. Electricity use from all sources generated 90 percent of City Government emissions over the survey period. City government has made advances in meeting its energy needs through renewable energy sources. From 2012 to 2014, the City’s implementation of solar energy has more than doubled. Over the 2012 to 2014 period, transportation emissions increased by 6 percent due to a rise in nonroad emissions. However, onroad vehicle fleet use was the primary source of transportation emissions. In 2014, transportation emissions were 2 percent of the annual total. Waste disposal volumes rose by 8 percent over the two-year survey period, resulting in a corresponding increase in GHG emissions. In 2014, City Government’s emissions from waste disposal were less than 1 percent of its annual total. Employee commuting emissions rose by an estimated 11 percent over this two-year period. This is likely attributed to an estimated 12 percent increase in VMT.
References Cited Arizona Department of Administration (ADOA-EPS). Accessed 2016. https://population.az.gov/ Arnold, Tom. 2016. Tucson Water. 2016. Personal communication. Berry, Marla. 2016. Pima County Department of Water Reclamation. Personal communication. Cascadia Consulting Group Inc. 2014. City of Tucson Waste Diversion Plan and Roadmap. https://www.tucsonaz.gov/files/es/Cascadia.pdf Cascadia Consulting Group Inc. 2006. Detailed Characterization of Construction and Demolition Waste. Contractor’s Report to the California Integrated Waste Management Board. City of Tucson. 2013. Plan Tucson. http://www.tucsonaz.gov/plantucson City of Tucson. 2011. Action Climate Mitigation Report Recommendations Tucson. http://www.tucsonaz.gov/sites/default/files/ocsd/act_phase1report_final_6dec11.pdf Department of Energy. 2012, 2013, 2014. EIA form 923. https://www.eia.gov/electricity/data/eia923/ ICLEI. 2013a. (Local Governments for Sustainability) U.S. Community Protocol for Accounting and Reporting of Greenhouse Gas Emissions. Version 1.1. ICLEI. 2013b. U.S. Community Protocol for Accounting and Reporting of Greenhouse Gas Emissions. Appendix D: Transportation and Other Mobile Emission Activities and Sources Version 1.1 ICLEI.2010. Local Government Operations Protocol for the Quantification and Reporting of Greenhouse Gas Emissions Inventories. Version 1.1 https://www.arb.ca.gov/cc/protocols/localgov/pubs/lgo_protocol_v1_1_2010-05-03.pdf Laros, Jason. 2016. City of Tucson Energy Manager. Personal communication. Philbin, A. 2012. Formally of Tucson Water. Personal communication. Pima County. 2016a. 2016 Pima County Wastewater Reclamation Department Facility Plan. http://webcms.pima.gov/UserFiles/Servers/Server_6/File/Government/Wastewater%20Reclamation/Publibations/FacilityPlan_2016.pdf Pima County. 2016b. Sustainable Action Plan for County Operations Report Card FY 2014/2015. http://webcms.pima.gov/UserFiles/Servers/Server_6/File/Government/Sustainability%20and%20Conservation/Sustainability%20and%20Conservation%20newsroom/Report%20Cards/2015%20Sustainability%20Report%20Card_Final_Revised_030916.pdf Pima County. 2015. Comprehensive Plan Update Pima Prospers. http://webcms.pima.gov/government/pima_prospers/

Pima County. 2014. Sustainable Action Plan for County Operations. http://webcms.pima.gov/UserFiles/Servers/Server_6/File/Government/Sustainability%20and%20Conservation/Sustainability%20and%20Conservation%20newsroom/Sustainable%20Action%20Plan/2014%20Sustainable%20Action%20Plan-Final%20Copy-High%20Resolution.pdf Portland Cement Association. 2016. Arizona Cement Industry. http://www.cement.org/docs/default-source/ga-pdfs/cement-industry-by-state-2015/arizona.pdf?sfvrsn=2 Tucson Water. 2013. Reclaimed Water Facts. https://www.tucsonaz.gov/water/reclaimed-water-facts Union Pacific Railroad. 2016. UPRR Pima County Fuel Consumption Data Report. U. S. Environmental Protection Agency (USEPA) 2016a. Inventory of U.S. Greenhouse Gas Emissions and Sinks: 1990-2014. EPA 430-R-16-002 https://www3.epa.gov/climatechange/Downloads/ghgemissions/US-GHG-Inventory-2016-Main-Text.pdf U. S. Environmental Protection Agency (USEPA). 2016b. Greenhouse Gas Reporting Program for Calendar Years 2012, 2013, 2014. http://www.epa.gov/climatechange/emissions/ghgdata/index.html
U. S. Environmental Protection Agency (USEPA). 2016c .WARM model, March 2016; Version 14. http://epa.gov/epawaste/conserve/tools/warm/index.html
Appendices
A. Inventory Data Sources B. Population Estimates, 2012 to 2014 C. Number of Households in eastern Pima County and the City of Tucson 2012 to 2014 D. Emissions Factors for PAG GHG Inventory Electricity Use E. Eastern Pima County Community Inventory Data Summary F. Waste Characterizations G. EPA’s WARM Model Emission Factors H. City of Tucson Community Inventory Data Summary I. Pima County Government Inventory Data Summary J. City of Tucson Government Inventory Data Summary K. Energy Conversion Factors L. Per Capita Greenhouse Gas Emissions
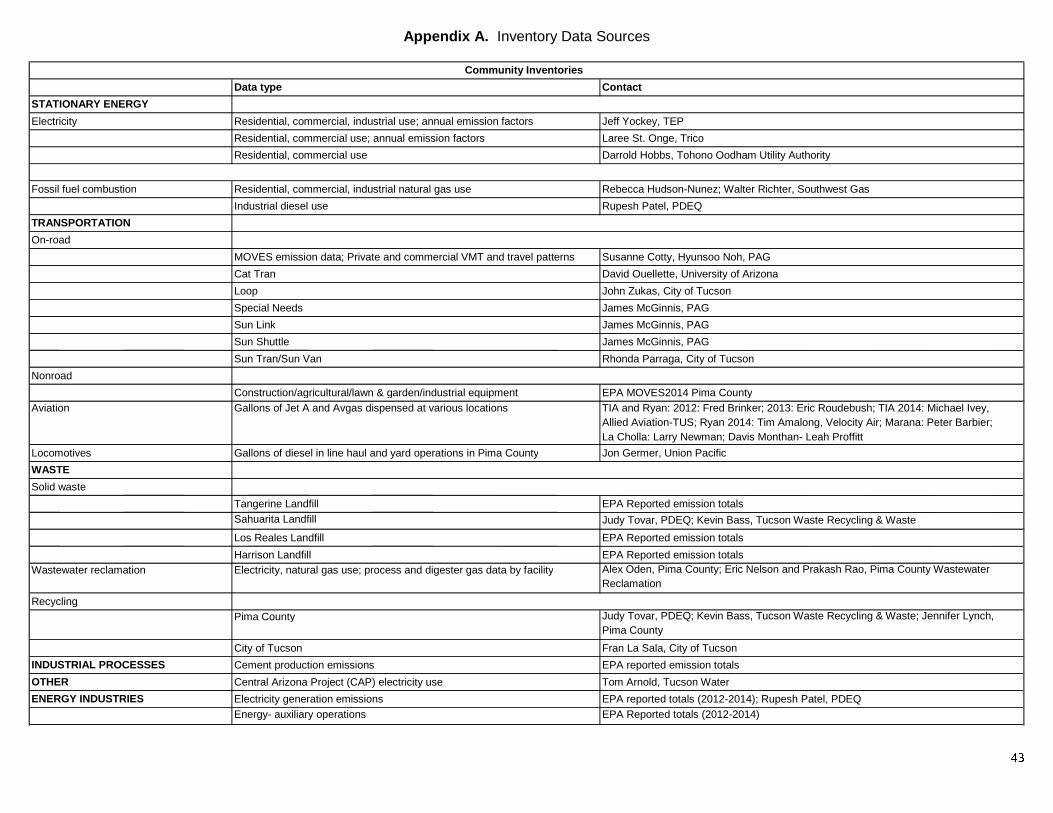
Appendix A. Inventory Data Sources
Data type Contact STATIONARY ENERGY
Electricity Residential, commercial, industrial use; annual emission factors Jeff Yockey, TEP Residential, commercial use; annual emission factors Laree St. Onge, Trico Residential, commercial use Darrold Hobbs, Tohono Oodham Utility Authority
Fossil fuel combustion Residential, commercial, industrial natural gas use Rebecca Hudson-Nunez; Walter Richter, Southwest Gas Industrial diesel use Rupesh Patel, PDEQ
TRANSPORTATION On-road
MOVES emission data; Private and commercial VMT and travel patterns Susanne Cotty, Hyunsoo Noh, PAG Cat Tran David Ouellette, University of Arizona Loop John Zukas, City of Tucson Special Needs James McGinnis, PAG Sun Link James McGinnis, PAG Sun Shuttle James McGinnis, PAG Sun Tran/Sun Van Rhonda Parraga, City of Tucson
Nonroad Construction/agricultural/lawn & garden/industrial equipment EPA MOVES2014 Pima County
Aviation Gallons of Jet A and Avgas dispensed at various locations TIA and Ryan: 2012: Fred Brinker; 2013: Eric Roudebush; TIA 2014: Michael Ivey, Allied Aviation-TUS; Ryan 2014: Tim Amalong, Velocity Air; Marana: Peter Barbier; La Cholla: Larry Newman; Davis Monthan- Leah Proffitt
Locomotives Gallons of diesel in line haul and yard operations in Pima County Jon Germer, Union Pacific WASTE Solid waste
Tangerine Landfill EPA Reported emission totals Sahuarita Landfill Judy Tovar, PDEQ; Kevin Bass, Tucson Waste Recycling & Waste
Los Reales Landfill EPA Reported emission totals Harrison Landfill EPA Reported emission totals
Wastewater reclamation Electricity, natural gas use; process and digester gas data by facility Alex Oden, Pima County; Eric Nelson and Prakash Rao, Pima County Wastewater Reclamation
Recycling Pima County Judy Tovar, PDEQ; Kevin Bass, Tucson Waste Recycling & Waste; Jennifer Lynch,
Pima County
City of Tucson Fran La Sala, City of Tucson INDUSTRIAL PROCESSES Cement production emissions EPA reported emission totals OTHER Central Arizona Project (CAP) electricity use Tom Arnold, Tucson Water ENERGY INDUSTRIES Electricity generation emissions EPA reported totals (2012-2014); Rupesh Patel, PDEQ
Energy- auxiliary operations EPA Reported totals (2012-2014)
Community Inventories

Data type Contact
STATIONARY ENERGY
Facilities
Electricity use Pima County Alex Oden, Pima County
City of Tucson Jason Laros, Mandi Leatherland, City of Tucson
Fossil fuel combustion Pima County Alex Oden, Pima County
City of Tucson Jason Laros, Mandi Leatherland, City of Tucson
Water and Wastewater Reclamation
Electricity use Pima County Alex Oden, Pima County; Eric Nelson and Prakash Rao, Pima County Wastewater
Reclamation
City of Tucson Tom Arnold, Tucson Water (potable, reclaimed, Central Arizona Project)
Fossil fuel combustion Pima County Alex Oden, Pima County; Eric Nelson and Prakash Rao, Pima County Wastewater
Reclamation
City of Tucson Tom Arnold, Tucson Water
Fleet City of Tucson Jason Laros, Mandi Leatherland, City of Tucson
Public lighting Pima County Alex Oden, Pima County
City of Tucson Jason Laros, Mandi Leatherland, City of Tucson
TRANSPORTATION Pima County Alex Oden, Pima County
City of Tucson Tony Leon, City of Tucson
WASTE
Solid waste disposed: Recycling totals Pima County Alex Oden, Pima County
City of Tucson Chris Leverenz (2012); Daniel Stanton (2013, 2014), City of Tucson
Wastewater treatment process Pima County Eric Nelson and Prakash Rao, Pima County Wastewater Reclamation
EMPLOYEE COMMUTING Employee Commute Ruth Reiman, PAG
Government Operations Inventories
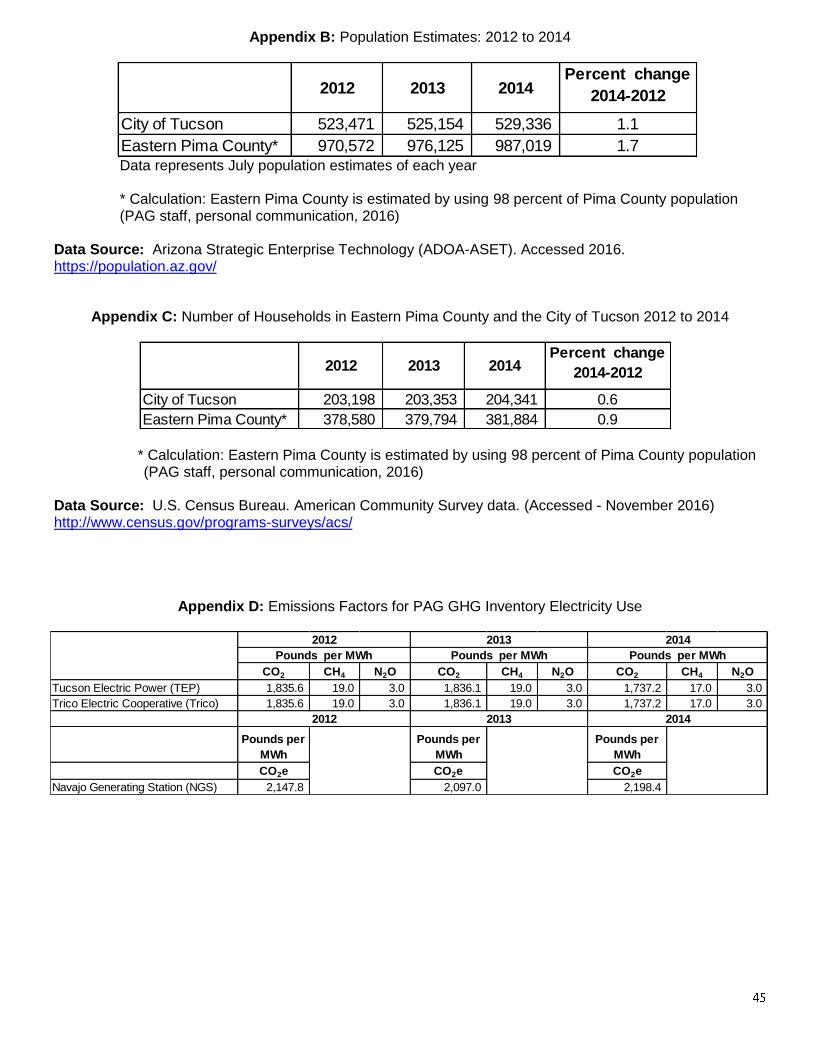
Appendix B: Population Estimates: 2012 to 2014
Data represents July population estimates of each year * Calculation: Eastern Pima County is estimated by using 98 percent of Pima County population (PAG staff, personal communication, 2016)
Data Source: Arizona Strategic Enterprise Technology (ADOA-ASET). Accessed 2016. https://population.az.gov/
Appendix C: Number of Households in Eastern Pima County and the City of Tucson 2012 to 2014
* Calculation: Eastern Pima County is estimated by using 98 percent of Pima County population (PAG staff, personal communication, 2016)
Data Source: U.S. Census Bureau. American Community Survey data. (Accessed - November 2016) http://www.census.gov/programs-surveys/acs/
Appendix D: Emissions Factors for PAG GHG Inventory Electricity Use
2012 2013 2014Percent change
2014-2012
City of Tucson 523,471 525,154 529,336 1.1
Eastern Pima County* 970,572 976,125 987,019 1.7
2012 2013 2014Percent change
2014-2012
City of Tucson 203,198 203,353 204,341 0.6
Eastern Pima County* 378,580 379,794 381,884 0.9
CO2 CH4 N2O CO2 CH4 N2O CO2 CH4 N2O
Tucson Electric Power (TEP) 1,835.6 19.0 3.0 1,836.1 19.0 3.0 1,737.2 17.0 3.0
Trico Electric Cooperative (Trico) 1,835.6 19.0 3.0 1,836.1 19.0 3.0 1,737.2 17.0 3.0
Pounds per
MWh
Pounds per
MWh
Pounds per
MWh
CO2e CO2e CO2e
Navajo Generating Station (NGS) 2,147.8 2,097.0 2,198.4
2012
Pounds per MWh Pounds per MWh Pounds per MWh
2013 2014
2012 2013 2014

Appendix E. Eastern Pima County Community Inventory Data Inputs 2012 2013 2014
STATIONARY ENERGY
Residential
Fossil fuel combustion (therms) 79,318,352 87,914,225 69,870,557
Grid-supplied electricity (KWh)
TEP 3,820,637,000 3,866,665,000 3,727,000,000
Trico 436,897,697 405,521,685 410,327,818
Tohono O'odham 237,912,992 62,747,724 59,461,628
Commercial
Fossil fuel combustion (therms) 69,150,048 71,795,196 64,647,385
Grid-supplied electricity (KWh)
TEP 2,219,450,000 2,219,445,000 2,203,000,000
Trico 22,994,616 21,343,247 21,596,201
Tohono Oodham 128,106,995 29,528,341 27,981,942
Industrial
Fossil fuel combustion (therms) 13,519,446 6,002,628 5,520,910
Grid-supplied electricity (KWh)- TEP 3,224,732,000 3,192,809,000 3,235,000,000
TRANSPORTATION
Onroad
Private & commercial vehicle travel 7,360,107,060 7,404,203,530 7,494,877,490
Cat Tran 215,937 206,825 174,459
LOOP 27,830 27,757 27,757
Oro Valley Sun Shuttle 295,149 408,853 442,796
Special Needs 1,083,879 1,220,143 1,619,569
Sun Shuttle 1,038,394 1,007,397 1,047,621
SunTran 9,362,881 9,508,838 9,566,033
SunVan 4,256,851 4,375,213 4,464,354
SunLink (6 months) 0 0 83,173
Transit total 16,280,921 16,755,025 17,425,761
Nonroad
Locomotives
Diesel 7,697,888 8,031,117 8,229,006
Aircraft
Avgas 519,963 380,366 399,669
Jet A 67,710,673 63,050,870 51,054,505
WASTE
Solid waste
Los Reales 438,929 454,169 545,704
Tangerine 44,784 110,402 0-closed
Sahuarita 23,898 26,802 24,118
Harrison 0-closed 0- closed 0-closed
Wastewater reclamation
Pima County Nitrification/denitrification 616,054 653,717 621,703
Marana Nitrification/denitrification 4,973 5,356 5,649
Pima County Lagoons (Biochemical oxygen demand [BOD5] load)
Digester gas flared 402,117 596,361 716,854
Digester gas combustion for energy 431,544 124,925 43,311
INDUSTRIAL PROCESSES
Cement production
OTHER
Grid-supplied electricity (KWh)- CAP 400,505,785 396,866,478 388,569,062
Water deliveries (acre-feet) 144,172 144,172 142,315
ENERGY INDUSTRIES*
Energy generation (Irvington; DeMoss Petrie); plant auxiliary operations
Energy generation supplied to grid (North Loop) (therms) 132,855 284,162 131,162
Miles
EPA reported emissions 2012-2014
EPA reported emissions 2012-2014
Metric tons disposed/year
Population served
Standard cubic feet/day
Varies by treatment facility
EPA MOVE2014 - Pima County 2012-2014
Gallons
Gallons
* Emissions not included in totals
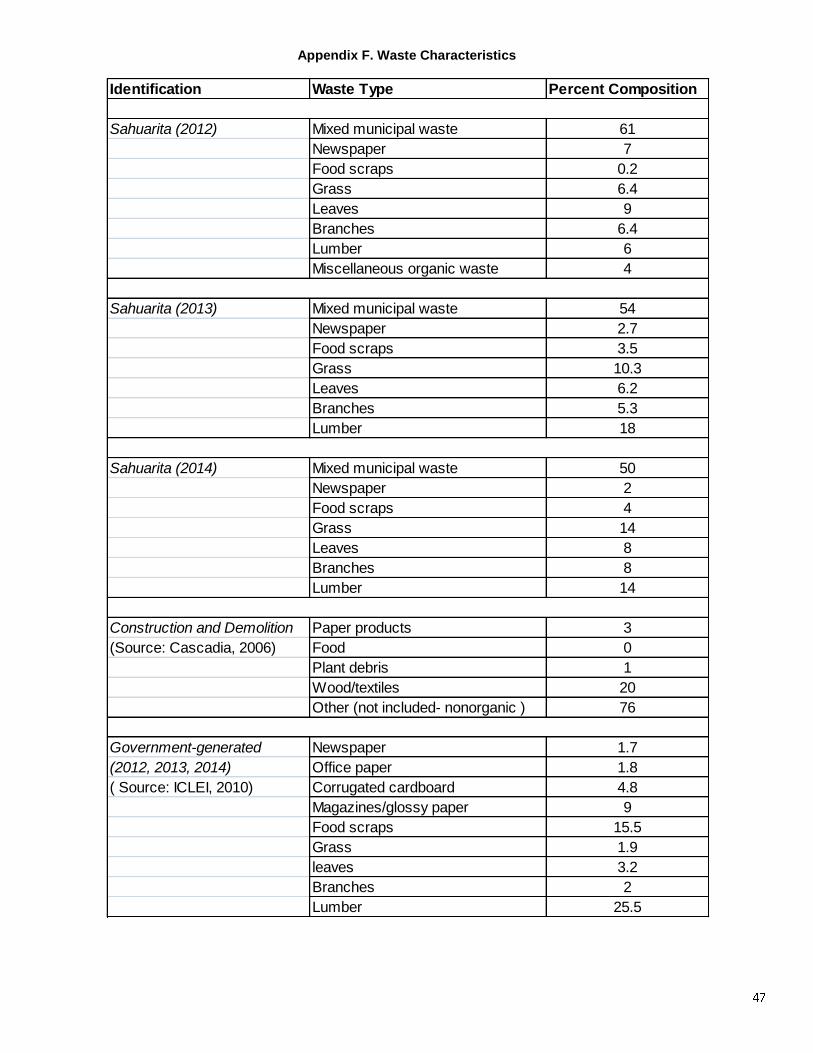
Appendix F. Waste Characteristics
Identification Waste Type Percent Composition
Sahuarita (2012) Mixed municipal waste 61
Newspaper 7
Food scraps 0.2
Grass 6.4
Leaves 9
Branches 6.4
Lumber 6
Miscellaneous organic waste 4
Sahuarita (2013) Mixed municipal waste 54
Newspaper 2.7
Food scraps 3.5
Grass 10.3
Leaves 6.2
Branches 5.3
Lumber 18
Sahuarita (2014) Mixed municipal waste 50
Newspaper 2
Food scraps 4
Grass 14
Leaves 8
Branches 8
Lumber 14
Construction and Demolition Paper products 3
(Source: Cascadia, 2006) Food 0
Plant debris 1
Wood/textiles 20
Other (not included- nonorganic ) 76
Government-generated Newspaper 1.7
(2012, 2013, 2014) Office paper 1.8
( Source: ICLEI, 2010) Corrugated cardboard 4.8
Magazines/glossy paper 9
Food scraps 15.5
Grass 1.9
leaves 3.2
Branches 2
Lumber 25.5
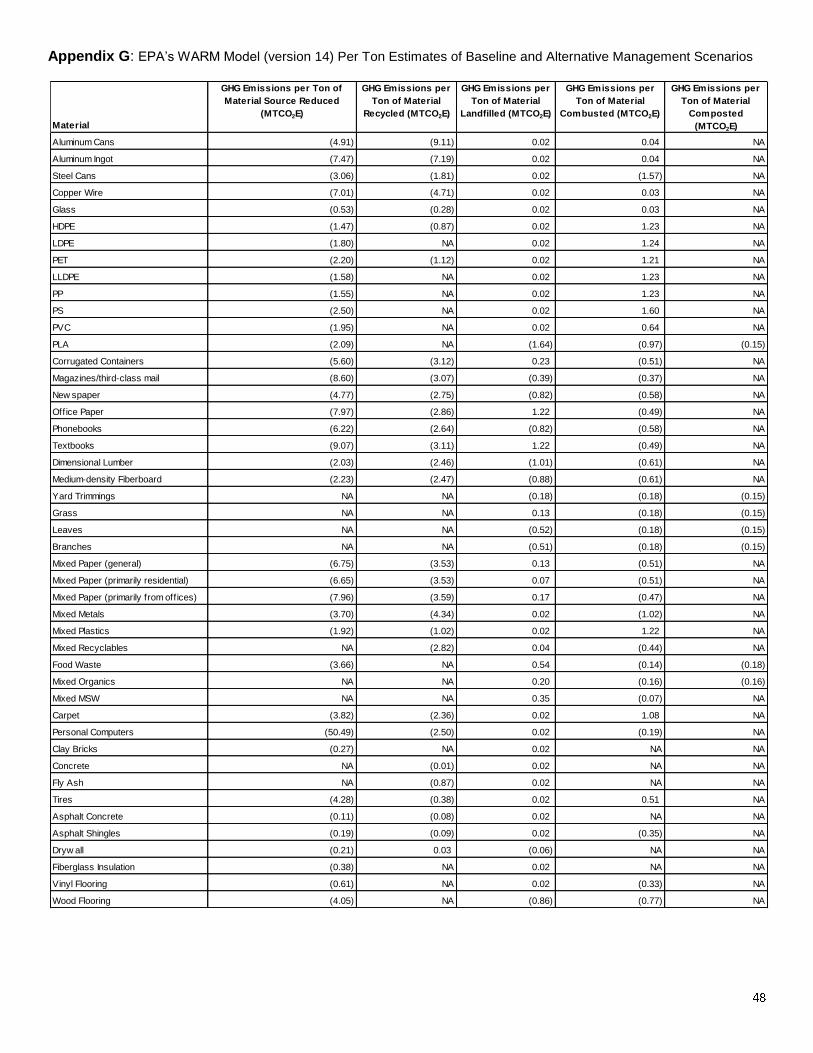
Appendix G: EPA’s WARM Model (version 14) Per Ton Estimates of Baseline and Alternative Management Scenarios
Material
GHG Emissions per Ton of
Material Source Reduced
(MTCO2E)
GHG Emissions per
Ton of Material
Recycled (MTCO2E)
GHG Emissions per
Ton of Material
Landfilled (MTCO2E)
GHG Emissions per
Ton of Material
Combusted (MTCO2E)
GHG Emissions per
Ton of Material
Composted
(MTCO2E)
Aluminum Cans (4.91) (9.11) 0.02 0.04 NA
Aluminum Ingot (7.47) (7.19) 0.02 0.04 NA
Steel Cans (3.06) (1.81) 0.02 (1.57) NA
Copper Wire (7.01) (4.71) 0.02 0.03 NA
Glass (0.53) (0.28) 0.02 0.03 NA
HDPE (1.47) (0.87) 0.02 1.23 NA
LDPE (1.80) NA 0.02 1.24 NA
PET (2.20) (1.12) 0.02 1.21 NA
LLDPE (1.58) NA 0.02 1.23 NA
PP (1.55) NA 0.02 1.23 NA
PS (2.50) NA 0.02 1.60 NA
PVC (1.95) NA 0.02 0.64 NA
PLA (2.09) NA (1.64) (0.97) (0.15)
Corrugated Containers (5.60) (3.12) 0.23 (0.51) NA
Magazines/third-class mail (8.60) (3.07) (0.39) (0.37) NA
New spaper (4.77) (2.75) (0.82) (0.58) NA
Office Paper (7.97) (2.86) 1.22 (0.49) NA
Phonebooks (6.22) (2.64) (0.82) (0.58) NA
Textbooks (9.07) (3.11) 1.22 (0.49) NA
Dimensional Lumber (2.03) (2.46) (1.01) (0.61) NA
Medium-density Fiberboard (2.23) (2.47) (0.88) (0.61) NA
Yard Trimmings NA NA (0.18) (0.18) (0.15)
Grass NA NA 0.13 (0.18) (0.15)
Leaves NA NA (0.52) (0.18) (0.15)
Branches NA NA (0.51) (0.18) (0.15)
Mixed Paper (general) (6.75) (3.53) 0.13 (0.51) NA
Mixed Paper (primarily residential) (6.65) (3.53) 0.07 (0.51) NA
Mixed Paper (primarily from off ices) (7.96) (3.59) 0.17 (0.47) NA
Mixed Metals (3.70) (4.34) 0.02 (1.02) NA
Mixed Plastics (1.92) (1.02) 0.02 1.22 NA
Mixed Recyclables NA (2.82) 0.04 (0.44) NA
Food Waste (3.66) NA 0.54 (0.14) (0.18)
Mixed Organics NA NA 0.20 (0.16) (0.16)
Mixed MSW NA NA 0.35 (0.07) NA
Carpet (3.82) (2.36) 0.02 1.08 NA
Personal Computers (50.49) (2.50) 0.02 (0.19) NA
Clay Bricks (0.27) NA 0.02 NA NA
Concrete NA (0.01) 0.02 NA NA
Fly Ash NA (0.87) 0.02 NA NA
Tires (4.28) (0.38) 0.02 0.51 NA
Asphalt Concrete (0.11) (0.08) 0.02 NA NA
Asphalt Shingles (0.19) (0.09) 0.02 (0.35) NA
Dryw all (0.21) 0.03 (0.06) NA NA
Fiberglass Insulation (0.38) NA 0.02 NA NA
Vinyl Flooring (0.61) NA 0.02 (0.33) NA
Wood Flooring (4.05) NA (0.86) (0.77) NA
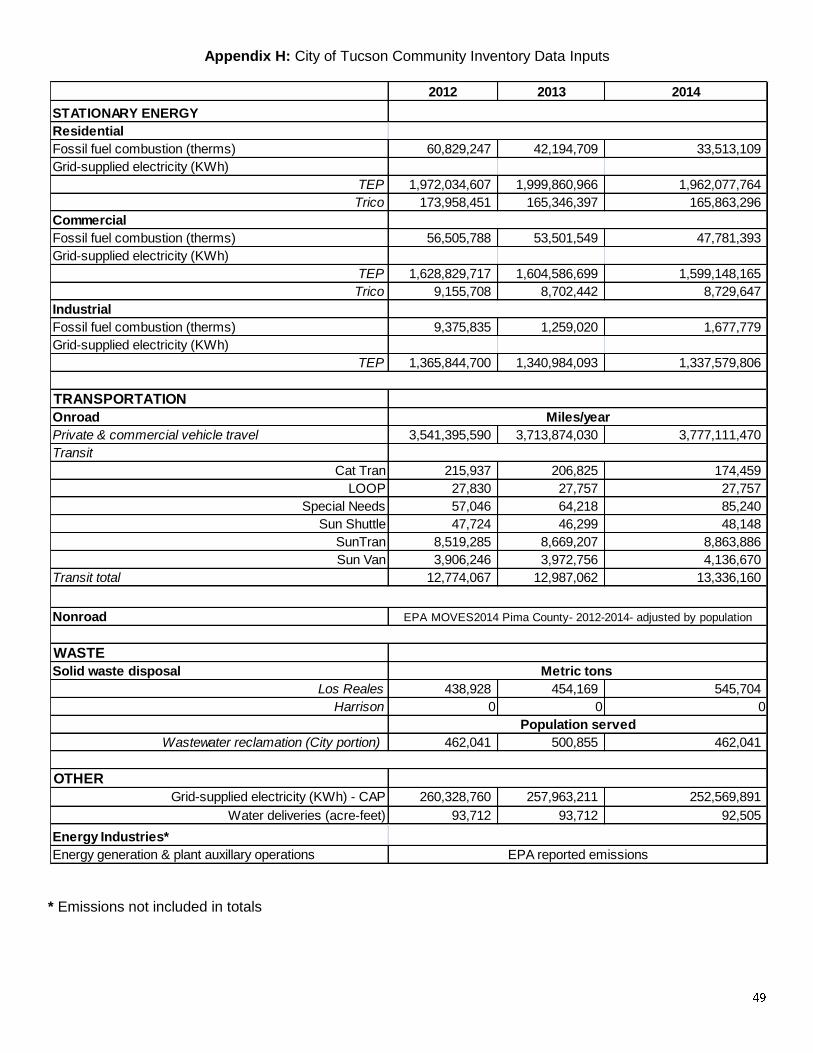
Appendix H: City of Tucson Community Inventory Data Inputs
* Emissions not included in totals
2012 2013 2014
STATIONARY ENERGY
Residential
Fossil fuel combustion (therms) 60,829,247 42,194,709 33,513,109
Grid-supplied electricity (KWh)
TEP 1,972,034,607 1,999,860,966 1,962,077,764
Trico 173,958,451 165,346,397 165,863,296
Commercial
Fossil fuel combustion (therms) 56,505,788 53,501,549 47,781,393
Grid-supplied electricity (KWh)
TEP 1,628,829,717 1,604,586,699 1,599,148,165
Trico 9,155,708 8,702,442 8,729,647
Industrial
Fossil fuel combustion (therms) 9,375,835 1,259,020 1,677,779
Grid-supplied electricity (KWh)
TEP 1,365,844,700 1,340,984,093 1,337,579,806
TRANSPORTATION
Onroad
Private & commercial vehicle travel 3,541,395,590 3,713,874,030 3,777,111,470
Transit
Cat Tran 215,937 206,825 174,459
LOOP 27,830 27,757 27,757
Special Needs 57,046 64,218 85,240
Sun Shuttle 47,724 46,299 48,148
SunTran 8,519,285 8,669,207 8,863,886
Sun Van 3,906,246 3,972,756 4,136,670
Transit total 12,774,067 12,987,062 13,336,160
Nonroad
WASTE
Solid waste disposal
Los Reales 438,928 454,169 545,704
Harrison 0 0 0
Wastewater reclamation (City portion) 462,041 500,855 462,041
OTHER
Grid-supplied electricity (KWh) - CAP 260,328,760 257,963,211 252,569,891
Water deliveries (acre-feet) 93,712 93,712 92,505
Energy Industries*
Energy generation & plant auxillary operations
Population served
EPA reported emissions
Metric tons
Miles/year
EPA MOVES2014 Pima County- 2012-2014- adjusted by population
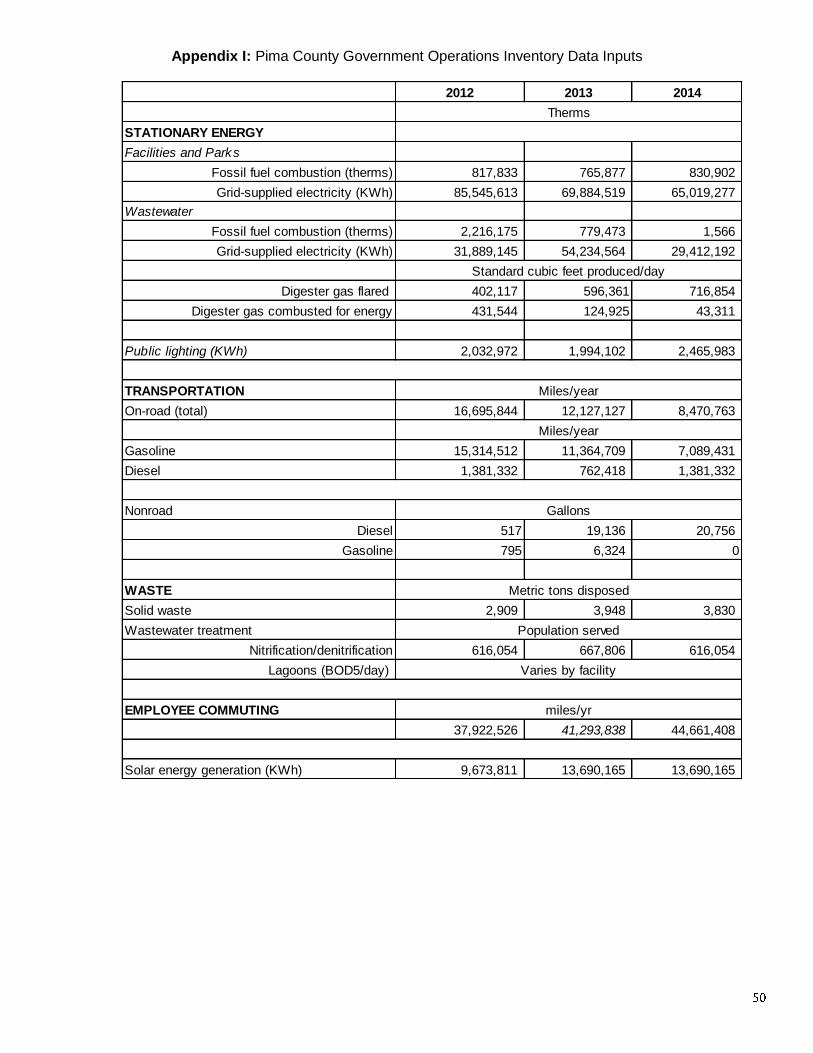
Appendix I: Pima County Government Operations Inventory Data Inputs
2012 2013 2014
STATIONARY ENERGY
Facilities and Parks
Fossil fuel combustion (therms) 817,833 765,877 830,902
Grid-supplied electricity (KWh) 85,545,613 69,884,519 65,019,277
Wastewater
Fossil fuel combustion (therms) 2,216,175 779,473 1,566
Grid-supplied electricity (KWh) 31,889,145 54,234,564 29,412,192
Digester gas flared 402,117 596,361 716,854
Digester gas combusted for energy 431,544 124,925 43,311
Public lighting (KWh) 2,032,972 1,994,102 2,465,983
TRANSPORTATION
On-road (total) 16,695,844 12,127,127 8,470,763
Gasoline 15,314,512 11,364,709 7,089,431
Diesel 1,381,332 762,418 1,381,332
Nonroad
Diesel 517 19,136 20,756
Gasoline 795 6,324 0
WASTE
Solid waste 2,909 3,948 3,830
Wastewater treatment
Nitrification/denitrification 616,054 667,806 616,054
Lagoons (BOD5/day)
EMPLOYEE COMMUTING
37,922,526 41,293,838 44,661,408
Solar energy generation (KWh) 9,673,811 13,690,165 13,690,165
Therms
miles/yr
Metric tons disposed
Standard cubic feet produced/day
Population served
Varies by facility
Miles/year
Miles/year
Gallons
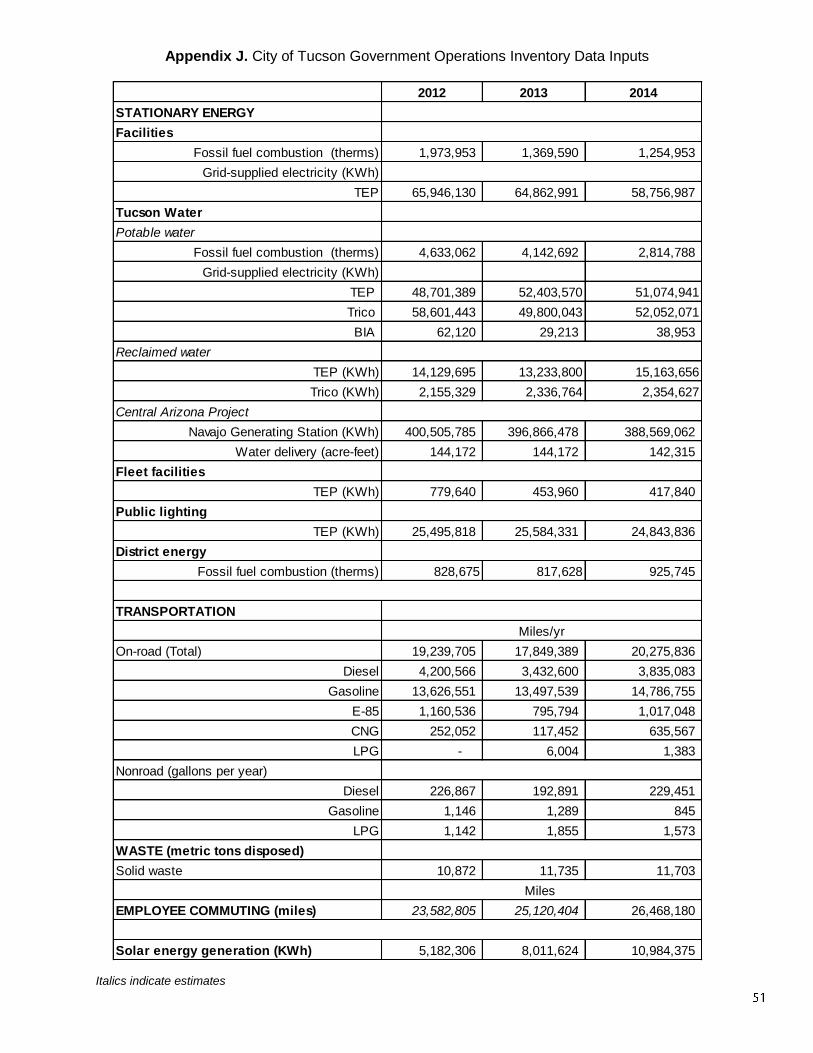
Appendix J. City of Tucson Government Operations Inventory Data Inputs
Italics indicate estimates
2012 2013 2014
STATIONARY ENERGY
Facilities
Fossil fuel combustion (therms) 1,973,953 1,369,590 1,254,953
Grid-supplied electricity (KWh)
TEP 65,946,130 64,862,991 58,756,987
Tucson Water
Potable water
Fossil fuel combustion (therms) 4,633,062 4,142,692 2,814,788
Grid-supplied electricity (KWh)
TEP 48,701,389 52,403,570 51,074,941
Trico 58,601,443 49,800,043 52,052,071
BIA 62,120 29,213 38,953
Reclaimed water
TEP (KWh) 14,129,695 13,233,800 15,163,656
Trico (KWh) 2,155,329 2,336,764 2,354,627
Central Arizona Project
Navajo Generating Station (KWh) 400,505,785 396,866,478 388,569,062
Water delivery (acre-feet) 144,172 144,172 142,315
Fleet facilities
TEP (KWh) 779,640 453,960 417,840
Public lighting
TEP (KWh) 25,495,818 25,584,331 24,843,836
District energy
Fossil fuel combustion (therms) 828,675 817,628 925,745
TRANSPORTATION
On-road (Total) 19,239,705 17,849,389 20,275,836
Diesel 4,200,566 3,432,600 3,835,083
Gasoline 13,626,551 13,497,539 14,786,755
E-85 1,160,536 795,794 1,017,048
CNG 252,052 117,452 635,567
LPG - 6,004 1,383
Nonroad (gallons per year)
Diesel 226,867 192,891 229,451
Gasoline 1,146 1,289 845
LPG 1,142 1,855 1,573
WASTE (metric tons disposed)
Solid waste 10,872 11,735 11,703
EMPLOYEE COMMUTING (miles) 23,582,805 25,120,404 26,468,180
Solar energy generation (KWh) 5,182,306 8,011,624 10,984,375
Miles
Miles/yr
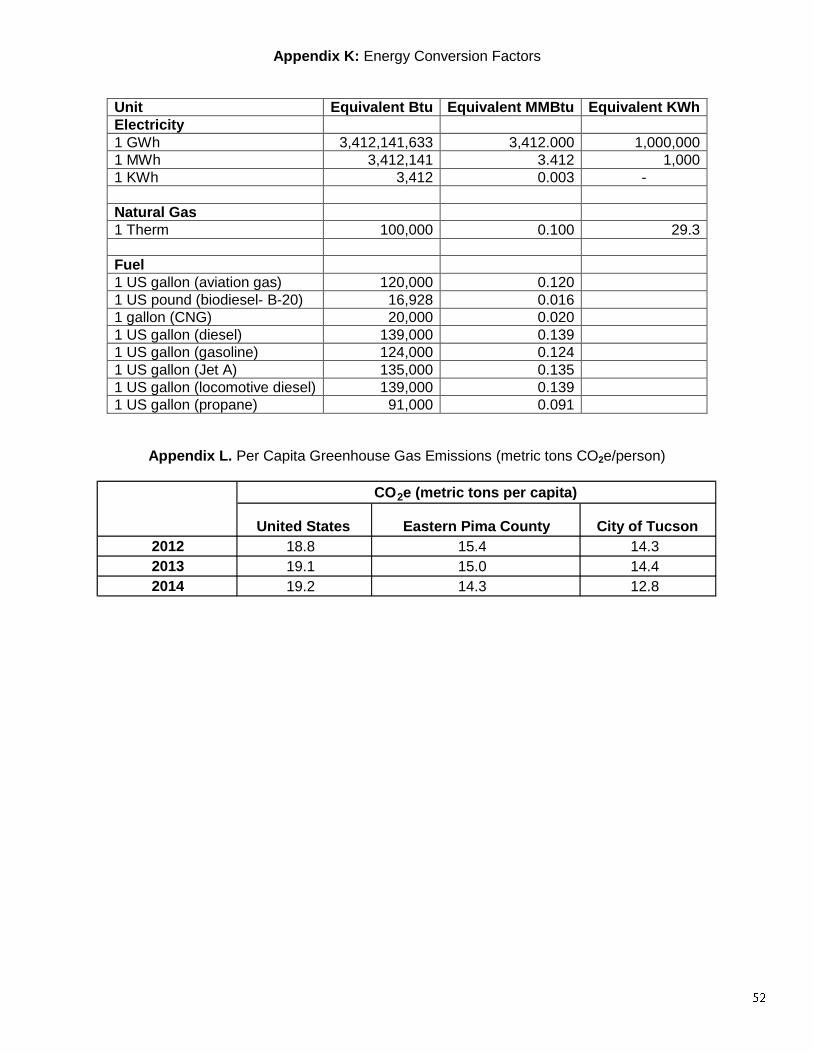
Appendix K: Energy Conversion Factors
Unit Equivalent Btu Equivalent MMBtu Equivalent KWh
Electricity
1 GWh 3,412,141,633 3,412.000 1,000,000
1 MWh 3,412,141 3.412 1,000
1 KWh 3,412 0.003 -
Natural Gas
1 Therm 100,000 0.100 29.3
Fuel
1 US gallon (aviation gas) 120,000 0.120
1 US pound (biodiesel- B-20) 16,928 0.016
1 gallon (CNG) 20,000 0.020
1 US gallon (diesel) 139,000 0.139
1 US gallon (gasoline) 124,000 0.124
1 US gallon (Jet A) 135,000 0.135
1 US gallon (locomotive diesel) 139,000 0.139
1 US gallon (propane) 91,000 0.091
Appendix L. Per Capita Greenhouse Gas Emissions (metric tons CO2e/person)
United States Eastern Pima County City of Tucson
2012 18.8 15.4 14.3
2013 19.1 15.0 14.4
2014 19.2 14.3 12.8
CO 2 e (metric tons per capita)