Embed Size (px)
Citation preview
Regional Climate Impacts Research Plan for 2012 - 2016
April 2012
Trevor Q. Murdock
Francis W. Zwiers

ii
iii
Regional Climate Impacts Research Plan for 2012 - 2016
April 2012
Trevor Q. Murdock Francis W. Zwiers
iv
Citation
Murdock, T.Q., and F.W. Zwiers, 2012: Regional Climate Impacts, Research Plan for 2012-2016. Pacific Climate Impacts Consortium, University of Victoria, Victoria, BC, 15 pp.
About PCIC
The Pacific Climate Impacts Consortium is a regional climate service centre at the University of Victoria that provides practical information on the physical impacts of climate variability and change in the Pacific and Yukon Region of Canada. PCIC operates in collaboration with climate researchers and regional stakeholders on projects driven by user needs. For more information see http://pacificclimate.org/.
Disclaimer
This information has been obtained from a variety of sources and is provided as a public service by the Pacific Climate Impacts Consortium (PCIC). While reasonable efforts have been undertaken to assure its accuracy, it is provided by PCIC without any warranty or representation, express or implied, as to its accuracy or completeness. Any reliance you place upon the information contained within this document is your sole responsibility and strictly at your own risk. In no event will PCIC be liable for any loss or damage whatsoever, including without limitation, indirect or consequential loss or damage, arising from reliance upon the information within this document.

v

vi
Acknowledgements
The authors are grateful for feedback from PCIC colleagues Dr. Gerd Bürger, Steve Sobie, Dr. Faron Anslow, Markus Schnorbus, Cassbreea Dewis, Dr. Alex Cannon, and Dr. Andrew Weaver as well as PCIC Program Advisory Committee members Thomas White, Dr. Dave Spittlehouse, Dirk Nyland, and Dr. Daniel Caya.

vii
viii
Regional Climate Impacts
Research Plan for 2012-2016
About PCIC ................................................................................................................................................... ii
Acknowledgements ...................................................................................................................................... iii
1. Introduction ............................................................................................................................................... 1
2. Research Plan ............................................................................................................................................ 3
2.1 Purpose .............................................................................................................................................. 3
2.2 Collaboration ..................................................................................................................................... 3
2.3 Outreach ............................................................................................................................................ 3
2.4 Motivation ......................................................................................................................................... 3
2.5 Applied research objectives .............................................................................................................. 4
2.5.1 Objective 1 – Downscaling .......................................................................................................... 4
2.5.2 Objective 2 – Extremes ................................................................................................................ 5
2.5.3 Objective 3 – Impacts ................................................................................................................... 5
3. Approach ................................................................................................................................................... 6
3.1 Objectives1 and 2 – Downscaling and Extremes .............................................................................. 6
3.2 Objective 3 – Impacts ........................................................................................................................ 7
4. Applied research ....................................................................................................................................... 8
4.1 Requirement 1 – Climate Modelling ................................................................................................. 8
4.2 Requirement 2 – Statistical Downscaling ......................................................................................... 8
4.3 Requirement 3 – Quantify Uncertainty ............................................................................................. 9
4.4 Requirement 4 – Communicating and synthesizing results ............................................................ 10
References ................................................................................................................................................... 11
Appendix 1: Schematic of proposed approach ........................................................................................... 14
Appendix 2: Quantifying uncertainty ......................................................................................................... 15
Appendix 3: Indices of Extremes ................................................................................................................ 16

ix
1
1. Introduction
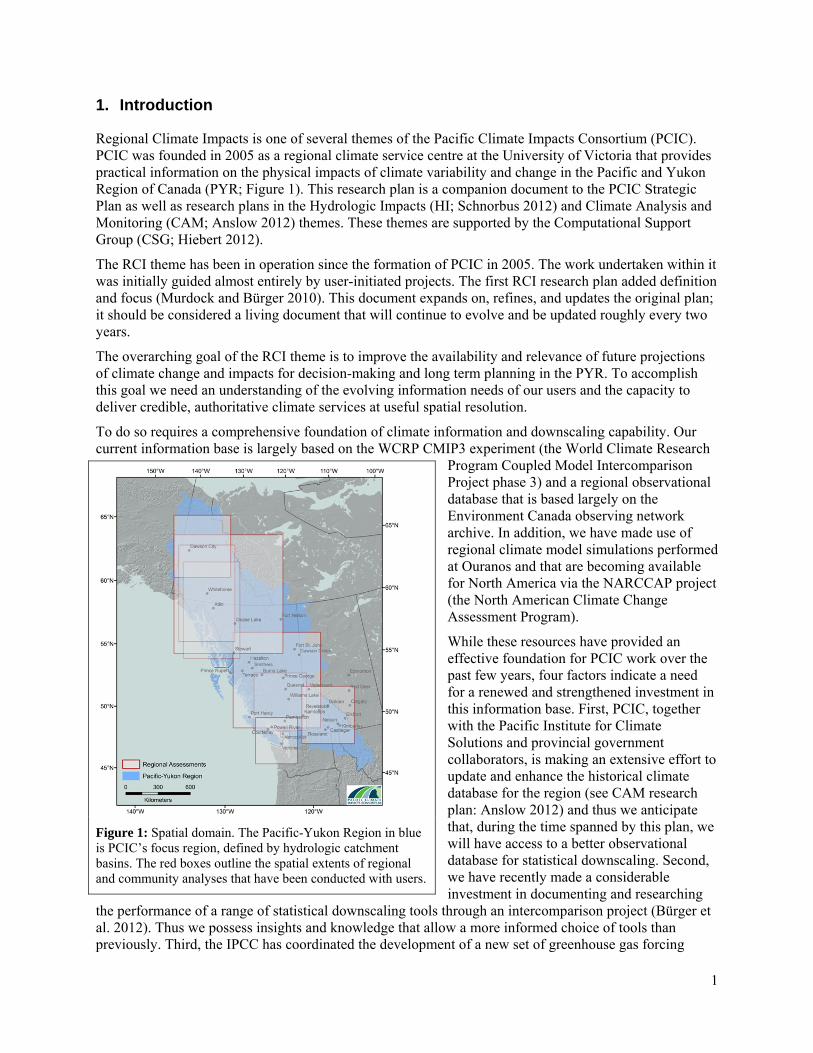
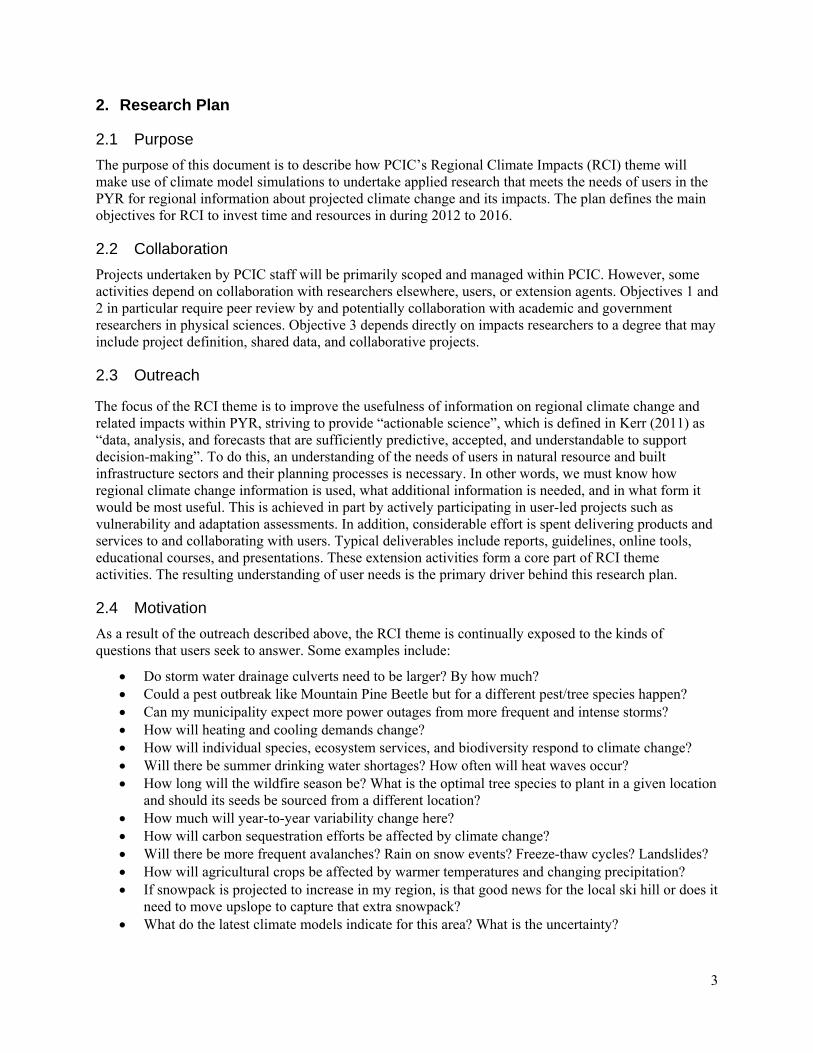
Regional Climate Impacts is one of several themes of the Pacific Climate Impacts Consortium (PCIC). PCIC was founded in 2005 as a regional climate service centre at the University of Victoria that provides practical information on the physical impacts of climate variability and change in the Pacific and Yukon Region of Canada (PYR; Figure 1). This research plan is a companion document to the PCIC Strategic Plan as well as research plans in the Hydrologic Impacts (HI; Schnorbus 2012) and Climate Analysis and Monitoring (CAM; Anslow 2012) themes. These themes are supported by the Computational Support Group (CSG; Hiebert 2012).
The RCI theme has been in operation since the formation of PCIC in 2005. The work undertaken within it was initially guided almost entirely by user-initiated projects. The first RCI research plan added definition and focus (Murdock and Bürger 2010). This document expands on, refines, and updates the original plan; it should be considered a living document that will continue to evolve and be updated roughly every two years.
The overarching goal of the RCI theme is to improve the availability and relevance of future projections of climate change and impacts for decision-making and long term planning in the PYR. To accomplish this goal we need an understanding of the evolving information needs of our users and the capacity to deliver credible, authoritative climate services at useful spatial resolution.
To do so requires a comprehensive foundation of climate information and downscaling capability. Our current information base is largely based on the WCRP CMIP3 experiment (the World Climate Research
Program Coupled Model Intercomparison Project phase 3) and a regional observational database that is based largely on the Environment Canada observing network archive. In addition, we have made use of regional climate model simulations performed at Ouranos and that are becoming available for North America via the NARCCAP project (the North American Climate Change Assessment Program).
While these resources have provided an effective foundation for PCIC work over the past few years, four factors indicate a need for a renewed and strengthened investment in this information base. First, PCIC, together with the Pacific Institute for Climate Solutions and provincial government collaborators, is making an extensive effort to update and enhance the historical climate database for the region (see CAM research plan: Anslow 2012) and thus we anticipate that, during the time spanned by this plan, we will have access to a better observational database for statistical downscaling. Second, we have recently made a considerable investment in documenting and researching
the performance of a range of statistical downscaling tools through an intercomparison project (Bürger et al. 2012). Thus we possess insights and knowledge that allow a more informed choice of tools than previously. Third, the IPCC has coordinated the development of a new set of greenhouse gas forcing
Figure 1: Spatial domain. The Pacific-Yukon Region in blue is PCIC’s focus region, defined by hydrologic catchment basins. The red boxes outline the spatial extents of regional and community analyses that have been conducted with users.
2
scenarios called Representative Concentration Pathways (RCPs; Moss et al. 2010) that replace the familiar SRES scenarios (e.g., B1, A1B, A2; Nakicenovic et al. 2000) and the WCRP has coordinated new climate modelling experiments (CMIP5) using updated earth system models that exploit these new scenarios. The CMIP5 archive of climate change simulations will, over the course of the next 2 to 3 years, supplant the existing CMIP3 archive, in terms of comprehensiveness, range and complexity of models, and resolution. Finally, the richness of the available ensemble of regional climate model (RCM) simulations that include the PYR has been growing rapidly. This expansion includes further simulations that continue to become available under NARCCAP, additional simulations performed at Ouranos (with the Canadian RCM – CRCM), a range of simulations performed with a new regional climate model developed at the Canadian Centre for Climate Modelling and Analysis (CanRCM), planned simulations by CORDEX (the coordinated regional climate downscaling experiment organized by WCRP that cover most land areas globally, including North America), and an extensive suite of high resolution (15 km) simulations with CRCM that are being performed jointly by UVic (Weaver) and Ouranos (Caya) as part of an NSERC Collaborative Research and Development grant and support from BC Hydro, Rio-Tinto Alcan, and Hydro-Québec.
This plan outlines how the RCI theme will exploit these developments over the coming five years, with the objective of ensuring that we will be well positioned to provide our users with robust climate scenarios that are based on current climate modelling capabilities. We will use RCM simulations and statistical downscaling methods to deliver state-of-the-science projections that will allow us to conduct sophisticated types of analysis such as the assessment of projected changes to extremes and other impacts. We also envision that the culmination of this work will form a major contribution to a regional climate impacts assessment for the Pacific and Yukon region similar to that of Miles et al. (2010) for the US Pacific Northwest and BACC (2008) for the region surrounding the Baltic Sea. The remainder of this document provides details of the RCI research plan, how it will be implemented, and dependencies on other work at PCIC and in the climate research community more broadly.
3
2. Research Plan
2.1 Purpose
The purpose of this document is to describe how PCIC’s Regional Climate Impacts (RCI) theme will make use of climate model simulations to undertake applied research that meets the needs of users in the PYR for regional information about projected climate change and its impacts. The plan defines the main objectives for RCI to invest time and resources in during 2012 to 2016.
2.2 Collaboration
Projects undertaken by PCIC staff will be primarily scoped and managed within PCIC. However, some activities depend on collaboration with researchers elsewhere, users, or extension agents. Objectives 1 and 2 in particular require peer review by and potentially collaboration with academic and government researchers in physical sciences. Objective 3 depends directly on impacts researchers to a degree that may include project definition, shared data, and collaborative projects.
2.3 Outreach
The focus of the RCI theme is to improve the usefulness of information on regional climate change and related impacts within PYR, striving to provide “actionable science”, which is defined in Kerr (2011) as “data, analysis, and forecasts that are sufficiently predictive, accepted, and understandable to support decision-making”. To do this, an understanding of the needs of users in natural resource and built infrastructure sectors and their planning processes is necessary. In other words, we must know how regional climate change information is used, what additional information is needed, and in what form it would be most useful. This is achieved in part by actively participating in user-led projects such as vulnerability and adaptation assessments. In addition, considerable effort is spent delivering products and services to and collaborating with users. Typical deliverables include reports, guidelines, online tools, educational courses, and presentations. These extension activities form a core part of RCI theme activities. The resulting understanding of user needs is the primary driver behind this research plan.
2.4 Motivation
As a result of the outreach described above, the RCI theme is continually exposed to the kinds of questions that users seek to answer. Some examples include:
Do storm water drainage culverts need to be larger? By how much? Could a pest outbreak like Mountain Pine Beetle but for a different pest/tree species happen? Can my municipality expect more power outages from more frequent and intense storms? How will heating and cooling demands change? How will individual species, ecosystem services, and biodiversity respond to climate change? Will there be summer drinking water shortages? How often will heat waves occur? How long will the wildfire season be? What is the optimal tree species to plant in a given location
and should its seeds be sourced from a different location? How much will year-to-year variability change here? How will carbon sequestration efforts be affected by climate change? Will there be more frequent avalanches? Rain on snow events? Freeze-thaw cycles? Landslides? How will agricultural crops be affected by warmer temperatures and changing precipitation? If snowpack is projected to increase in my region, is that good news for the local ski hill or does it
need to move upslope to capture that extra snowpack? What do the latest climate models indicate for this area? What is the uncertainty?
4
Many of these questions cannot actually be answered by the RCI theme, at least not directly or immediately. Therefore, our intention with this research plan is to describe investments of time and resources into activities that will improve our ability to inform user driven questions such as these and also increase the capacity of our users to answer such questions on their own. Answering many of these questions requires using climate model output to provide future climate conditions to process-based or spatially explicit impacts models. Others may be addressed directly through the analysis of indices of extremes. In all cases, regional information at high spatial resolution is necessary (downscaling). This provides the basis for our three applied research objectives below.
2.5 Applied research objectives
The majority of assessments of regional climate change, extremes, and impacts in PYR so far have been based on CMIP3 results, which have been available for use since 2005. As discussed in the introduction, there is a need to reinvest in the development of improved climate change scenarios given the rapid developments in the availability of new historical climate data, new ways of specifying greenhouse gas forcing scenarios, the increasing availability of CMIP5 results produced with a more advanced set of climate models, and developments in downscaling methods including RCMs.
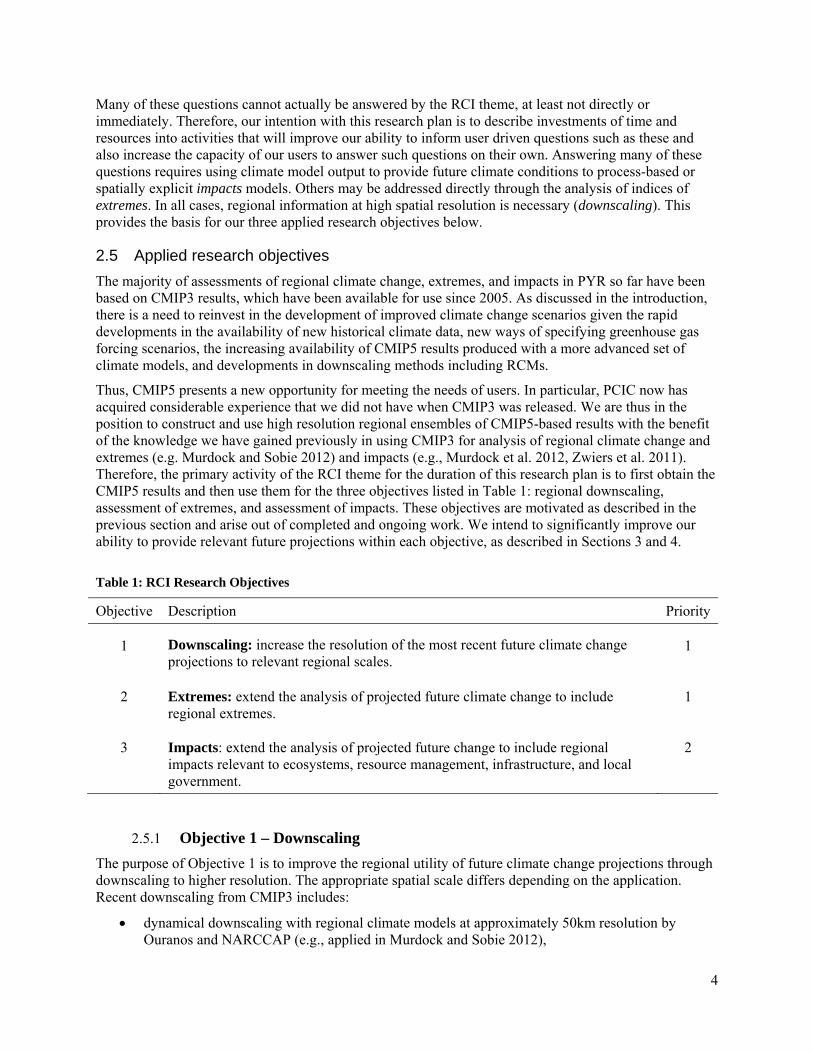
Thus, CMIP5 presents a new opportunity for meeting the needs of users. In particular, PCIC now has acquired considerable experience that we did not have when CMIP3 was released. We are thus in the position to construct and use high resolution regional ensembles of CMIP5-based results with the benefit of the knowledge we have gained previously in using CMIP3 for analysis of regional climate change and extremes (e.g. Murdock and Sobie 2012) and impacts (e.g., Murdock et al. 2012, Zwiers et al. 2011). Therefore, the primary activity of the RCI theme for the duration of this research plan is to first obtain the CMIP5 results and then use them for the three objectives listed in Table 1: regional downscaling, assessment of extremes, and assessment of impacts. These objectives are motivated as described in the previous section and arise out of completed and ongoing work. We intend to significantly improve our ability to provide relevant future projections within each objective, as described in Sections 3 and 4.
Table 1: RCI Research Objectives
Objective Description Priority
1
Downscaling: increase the resolution of the most recent future climate change projections to relevant regional scales.
1
2 Extremes: extend the analysis of projected future climate change to include regional extremes.
1
3 Impacts: extend the analysis of projected future change to include regional impacts relevant to ecosystems, resource management, infrastructure, and local government.
2
2.5.1 Objective 1 – Downscaling
The purpose of Objective 1 is to improve the regional utility of future climate change projections through downscaling to higher resolution. The appropriate spatial scale differs depending on the application. Recent downscaling from CMIP3 includes:
dynamical downscaling with regional climate models at approximately 50km resolution by Ouranos and NARCCAP (e.g., applied in Murdock and Sobie 2012),
5
1/16° statistical downscaling mainly for hydrological applications (Werner 2011) empirical downscaling that uses reconstructed observations (at 4 km; Daly et al. 2009) to adjust
global climate model output with bias and elevation corrections (e.g., www.Plan2Adapt.ca), and station-based statistical downscaling for intercomparison (Bürger et al. 2012) and case studies
(e.g., City of Castlegar 2011).
The first major component of RCI downscaling efforts will be to create statistically downscaled results over PYR from the CMIP5 ensemble, using the methods described in Section 3. One challenge will be the communication of results in a way that adequately reflects their use as a range of projected future scenarios (Pielke and Wilby 2012) without over- or under-representing uncertainty: i.e., providing results that are both scientifically robust and also useful (Section 4.3 and Appendix 2).
2.5.2 Objective 2 – Extremes
Like downscaling to high resolution, the analysis of projected changes to rare or extremely rare events is aimed at improving the relevance of climate information to users (Tyler 2012). There is a relationship between the two: the higher the spatial resolution of projected changes in climate extremes, the more useful the information is to regional and local planning. Conversely, the assessment of extremes pushes downscaling techniques to their limits, and the challenge of addressing skill and uncertainty becomes both more complicated and of greater importance.
The purpose of Objective 2 is to extend downscaled projections of regional climate change to the analysis of indices of extremes. One challenge will be to select the most useful and appropriate indices for PYR. We intend to focus on return periods of modest duration (e.g., 25-years) and a small number of other relevant indices selected with input from users (Section 3.1). Another challenge facing the analysis of extremes is that, by definition, they are rare. Statistical science provides a strong theoretical foundation for the analysis of rare events, either on the basis of the analysis of series of annual extremes (the block-maximum approach, which has been extensively applied in operational hydrology, for example), or on the basis of the analysis of exceedances across a high threshold (the peaks-over-threshold approach).
2.5.3 Objective 3 – Impacts
The purpose of Objective 3 is to facilitate analyses of climate change impacts based on temperature, precipitation, and related extremes. On its own, PCIC would be limited to basic parameters such as temperature, precipitation, related indices of extremes, and some hydrological impacts in collaboration with HI.
The vision for this objective is to contribute results towards a regional version of an impacts assessment. Such an assessment was recently completed by the Climate Impacts Group for Washington State (Miles et al. 2010). Regional assessments have also been carried out in other parts of the world, such as the Baltic nations (BACC 2008). These examples were both built on a strong foundation of downscaled climate change projections including extremes and impacts.
Progress on impacts will depend on user demand, funding and collaboration opportunities, and the results of Objectives 1 and 2. Activity contributing to this objective is expected to take place throughout the time period covered by this plan given its importance to users and the planned regional impacts assessment. Nevertheless, it has been given a somewhat lower priority due to its necessarily less structured objectives and because of the primary importance placed on the need to renew our investment in maintaining a comprehensive information base for impacts and adaptation applications.
6
3. Approach
3.1 Objectives1 and 2 – Downscaling and Extremes
To meet the need for high spatial resolution climate change projections we will conduct downscaling for the region on an ensemble of CMIP5 climate change projections, including indices of extremes, at several resolutions.
The steps that we will take under this core activity, described in more detail below, are:
1. Obtain and quality control CMIP5 results for PYR 2. Prepare a large ensemble at coarse global climate model (GCM) resolution 3. Develop guidelines for selecting subsets of the full ensemble for different purposes 4. Compare quantile-based downscaling methods and select one for further use 5. Conduct statistical downscaling for PYR on a subset of the full CMIP5 ensemble using statistical
downscaling for the 21st century, using: i. a regression-based method for point locations
ii. quantile-based method (Step 4) for gridded downscaling at multiple resolutions iii. empirical downscaling (“delta method” with high resolution baseline)
6. Obtain and quality control regional climate model (RCM) results as they become available, including from the UVic/Ouranos 15 km project,
7. Select, in collaboration with users, a limited number of indices of extremes and return periods 8. Determine projected changes to extremes using statistical and dynamical downscaling 9. Quantify downscaling uncertainty. Possible methods include:
i. Compare results of statistical downscaling methods to each other and RCMs ii. Combine information from GCMs, RCMs, and statistical downscaling
iii. Compare regionally-averaged quantities to site-specific data iv. Assess differences in components of downscaling methods
10. Make results available through reports, presentations, and online tools
Steps 1-3: We will obtain and construct a large ensemble that includes as many projections as feasible. Guidelines for choosing different subsets of the full ensemble for different purposes will be developed following, to the extent possible, precedents set for CMIP3 (Murdock and Spittlehouse 2011). CMIP5 models are driven by scenarios with considerably less (RCP2.6) and also more (RCP8.5) greenhouse gas forcing than was spanned by the commonly used SRES scenarios. We anticipate that the largest numbers of simulations will be available for RCP2.6, RCP4.5 and RCP8.5, and thus we will focus on them. To place this into the context of currently available scenarios, note that RCP4.5 and RCP6 produce a similar range of greenhouse gas forcing by the 2050s as that spanned by SRES B1, A1B, and A2.
Step 4: Downscaled future projections will be produced using two methods. A recently completed assessment of downscaling method skill indicated that Bias Corrected Spatial Disaggregation (BCSD) provides reasonable skill for the data required of it, and that eXpanded DownScaling (XDS) generally provides more skill but has more comprehensive data requirements (Bürger et al. 2012). We plan to use XDS for site specific downscaling. For gridded downscaling, we will first compare BCSD to related similar methods such as CDF-t (Michelangeli et al. 2009) and select a method for further use.
Step 5: The three primary targeted spatial resolutions for statistical downscaling of CMIP5 results will be as follows: 50 km for comparison to RCMs and gridded observations (e.g. CANGRID; Zhang et al. 2000), 15 km for comparison to the UVic/Ouranos project RCM results, and 1/16° to provide new projections for the Hydrologic Impacts theme. In addition, simple empirical downscaling (Wang et al. 2012) consisting of draping projected change over a high resolution historical baseline will make use of an updated 800 m PRISM climatology (Daly et al. 2009) being constructed by CAM. Downscaling to stations will be carried out as needed for specific case studies.
7
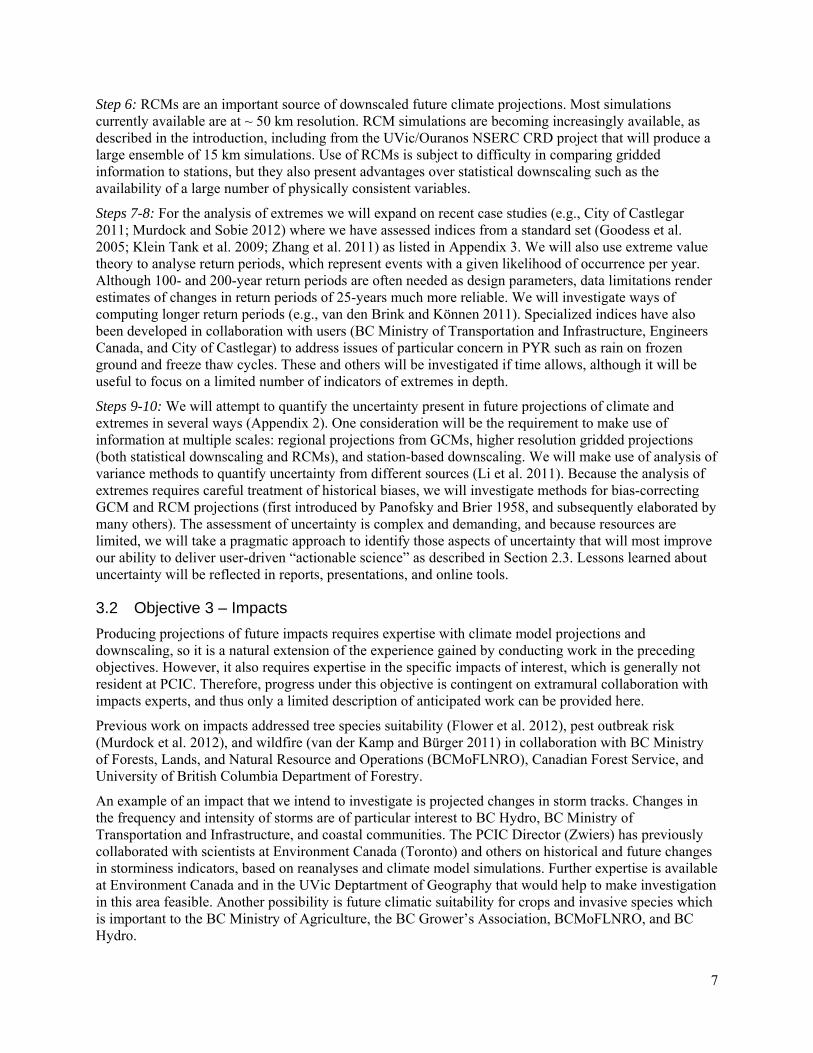
Step 6: RCMs are an important source of downscaled future climate projections. Most simulations currently available are at ~ 50 km resolution. RCM simulations are becoming increasingly available, as described in the introduction, including from the UVic/Ouranos NSERC CRD project that will produce a large ensemble of 15 km simulations. Use of RCMs is subject to difficulty in comparing gridded information to stations, but they also present advantages over statistical downscaling such as the availability of a large number of physically consistent variables.
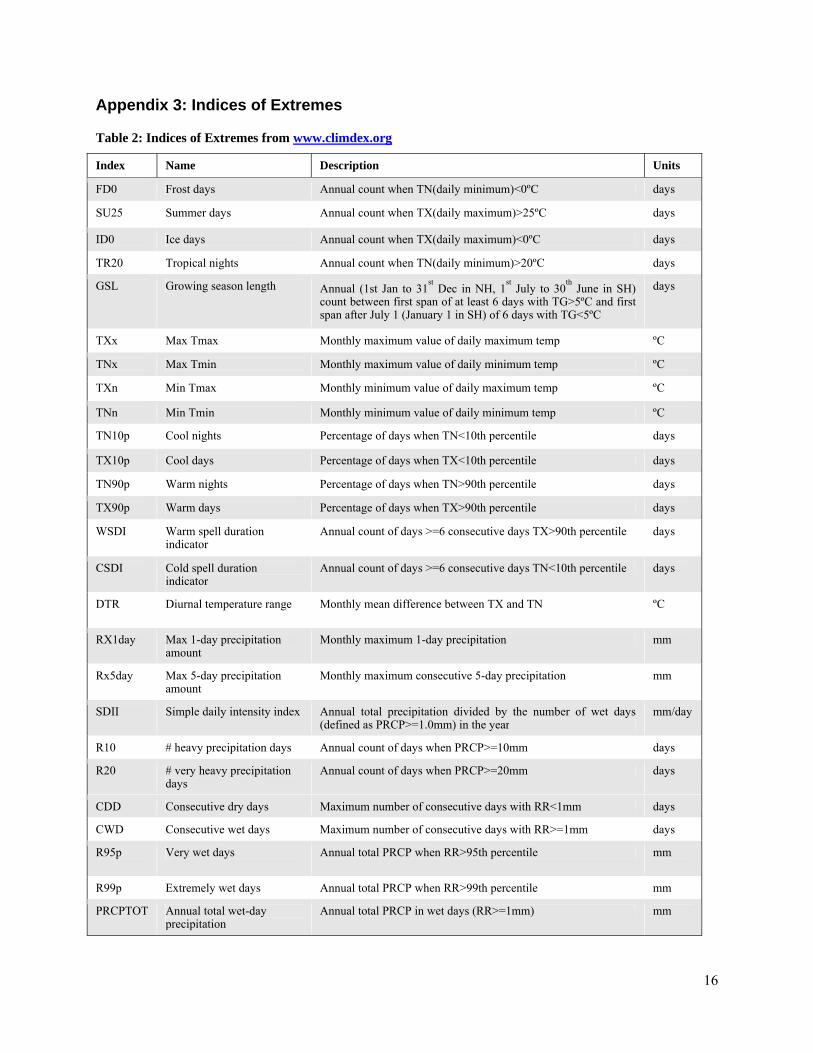
Steps 7-8: For the analysis of extremes we will expand on recent case studies (e.g., City of Castlegar 2011; Murdock and Sobie 2012) where we have assessed indices from a standard set (Goodess et al. 2005; Klein Tank et al. 2009; Zhang et al. 2011) as listed in Appendix 3. We will also use extreme value theory to analyse return periods, which represent events with a given likelihood of occurrence per year. Although 100- and 200-year return periods are often needed as design parameters, data limitations render estimates of changes in return periods of 25-years much more reliable. We will investigate ways of computing longer return periods (e.g., van den Brink and Können 2011). Specialized indices have also been developed in collaboration with users (BC Ministry of Transportation and Infrastructure, Engineers Canada, and City of Castlegar) to address issues of particular concern in PYR such as rain on frozen ground and freeze thaw cycles. These and others will be investigated if time allows, although it will be useful to focus on a limited number of indicators of extremes in depth.
Steps 9-10: We will attempt to quantify the uncertainty present in future projections of climate and extremes in several ways (Appendix 2). One consideration will be the requirement to make use of information at multiple scales: regional projections from GCMs, higher resolution gridded projections (both statistical downscaling and RCMs), and station-based downscaling. We will make use of analysis of variance methods to quantify uncertainty from different sources (Li et al. 2011). Because the analysis of extremes requires careful treatment of historical biases, we will investigate methods for bias-correcting GCM and RCM projections (first introduced by Panofsky and Brier 1958, and subsequently elaborated by many others). The assessment of uncertainty is complex and demanding, and because resources are limited, we will take a pragmatic approach to identify those aspects of uncertainty that will most improve our ability to deliver user-driven “actionable science” as described in Section 2.3. Lessons learned about uncertainty will be reflected in reports, presentations, and online tools.
3.2 Objective 3 – Impacts
Producing projections of future impacts requires expertise with climate model projections and downscaling, so it is a natural extension of the experience gained by conducting work in the preceding objectives. However, it also requires expertise in the specific impacts of interest, which is generally not resident at PCIC. Therefore, progress under this objective is contingent on extramural collaboration with impacts experts, and thus only a limited description of anticipated work can be provided here.
Previous work on impacts addressed tree species suitability (Flower et al. 2012), pest outbreak risk (Murdock et al. 2012), and wildfire (van der Kamp and Bürger 2011) in collaboration with BC Ministry of Forests, Lands, and Natural Resource and Operations (BCMoFLNRO), Canadian Forest Service, and University of British Columbia Department of Forestry.
An example of an impact that we intend to investigate is projected changes in storm tracks. Changes in the frequency and intensity of storms are of particular interest to BC Hydro, BC Ministry of Transportation and Infrastructure, and coastal communities. The PCIC Director (Zwiers) has previously collaborated with scientists at Environment Canada (Toronto) and others on historical and future changes in storminess indicators, based on reanalyses and climate model simulations. Further expertise is available at Environment Canada and in the UVic Deptartment of Geography that would help to make investigation in this area feasible. Another possibility is future climatic suitability for crops and invasive species which is important to the BC Ministry of Agriculture, the BC Grower’s Association, BCMoFLNRO, and BC Hydro.
8
4. Applied research
This section describes the specific requirements to meet each of the objectives with approximate timelines. Actual timing will depend upon PCIC staff capacity, evolving user needs, opportunities for collaboration, and funding opportunities.
4.1 Requirement 1 – Climate Modelling
The first activity for RCI is to obtain climate model results, as described in the introduction, Section 2.5, and Section 3.1:
4.1.1 Obtain CMIP5 results – Download and quality control CMIP5 data. Update online tools to use them. ▪ Timeline: 2012/13 ▪ Lead: RCI ▪ Support: CSG ▪ Data: Earth System Grid (CMIP5), CCCma
4.1.2 Obtain RCM results – Download and quality control NARCCAP data as they continue to be made available and other RCM results (e.g. CORDEX) as opportunities arise. Update online tools to use RCM results where feasible (see Requirement 4). ▪ Timeline: ongoing ▪ Lead: CSG ▪ Support: RCI ▪ Data: CCCma + Ouranos + Earth System Grid (NARCCAP)
4.1.3 Assess 15km RCM results – Obtain experimental 15 km RCM projections and compare to other projections. Assess whether there is sufficient value added for assessment of extremes and impacts. ▪ Timeline: 2012/14 ▪ Lead: UVic/Ouranos ▪ Support: RCI + CSG
4.2 Requirement 2 – Statistical Downscaling
Producing a region-wide set of downscaled future projections requires making a choice to either downscale on a gridded basis or downscale to stations and then use geospatial methods to produce gridded results (Murdock and Bürger 2010). Ideally, we would pursue both and compare. However, resource limitations dictate a more practical approach, which is to conduct gridded downscaling and complement it with selected downscaling to stations, using methods described in Section 3.1 (Step 4). This decision also recognizes that the downscaling we do is intended to serve multiple purposes, including the projection of extremes. A characteristic of extremes is that the ability to conveniently characterize the spatial dependence between extreme events at different locations diminishes as one extends further into the tails of the probability distribution. This characteristic, and often skewed nature of extreme value distributions, makes it much more difficult to grid results with classical geospatial gridding methods such as Kriging or optimal interpolation,
We will concentrate on producing downscaled projections for two periods within the 21st century: the 2050s (2041-2070) and the 2090s (2080-2099). The 2050s is the period for which the most dynamical downscaling results are currently available, although a growing number of regional climate model simulations are becoming available for the full 21st century, including from Ouranos and the ensemble of 15 km simulations that are currently being undertaken by UVic and Ouranos jointly. The 2090s is more suitable for longer term planning purposes and matches the period used by IPCC (Christensen et al. 2007). Some applications, particularly impacts, will require time series for the full 21st century.
Investments in downscaling will include the use of improved historical baseline datasets (for methods that depend on them). We will also seek ways to capitalize on the different strengths of dynamical and statistical downscaling methods (e.g., 4.2.2). One challenge is to quantify the additional uncertainty introduced by methods that downscale to high resolution (see 4.3.3). Long term improvement in the usefulness of statistical downscaling will include investigating the components of different methods that contribute to skill and uncertainty. For example, instead of assessing three different methods with arbitrarily different bias correction schemes, the differences between which confound the ability to
9
compare results, we will set out to understand the role and effect of different bias correction techniques on results.
4.2.1 Downscale CMIP5 – Produce an ensemble of CMIP5 GCM projections downscaled to 50 km, 15 km, 1/16° and at stations. Complement with empirical downscaling using baseline historical datasets from 4.2.3 and selected standard interpolation techniques (4.3.1 in HI research plan). ▪ Timeline: 2013/14 ▪ Lead: RCI ▪ Support: HI + CAM
4.2.2 Downscale RCMs to stations – Conduct further statistical downscaling of RCMs to stations for use in regional assessments of climate change, extremes, impacts, and quantifying uncertainty. ▪ Timeline: 2012/14 ▪ Lead: RCI ▪ Support: CSG
4.2.3 Baseline historical data sets – Make use of gridded baseline data sets for the Pacific and Yukon region as they become available, including new datasets created by HI (4.3.2 in HI research plan) and CAM themes in 2012 ▪ Timeline: 2012/14 ▪ Lead: RCI ▪ Support: HI + CAM
4.2.4 Downscaling development – Re-evaluate downscaling for the region based on CMIP5, making use of advancements and new methods. Assess the importance of different components separately such as bias-correction, predictor variables, spatial domains, historical time periods, and data sets. ▪ Timeline: 2014/16 ▪ Lead: RCI ▪ Support: CSG
4.3 Requirement 3 – Quantify Uncertainty
A good understanding of the uncertainty inherent in future climate scenarios from various sources is a key element for interpreting future projections and providing users with “actionable science” (see Section 2.3). Assessment and communication of uncertainty is non-trivial, particularly with respect to extremes. However, quantifying some aspects of uncertainty is essential. For example, the difference in impacts between higher and lower greenhouse gas emissions or concentrations is important for long-term planning because adaptation and mitigation planning are relatively integrated at the regional and local level. Five sources of uncertainty to address are listed in Appendix 2.
4.3.1 GCM and emissions uncertainty – select sets of ensembles from the full CMIP5 for different purposes accounting for new developments in GCMs and changes such as the replacement of SRES emissions scenarios with RCPs. ▪ Timeline: 2012/14 ▪ Lead: RCI
4.3.2 RCM uncertainty – compare simulated historical climate to observations for RCMs with and without bias-corrections, threshold scaling, and statistical downscaling. ▪ Timeline: 2012/14 ▪ Lead: RCI ▪ Support: CSG
4.3.3 Statistical downscaling uncertainty – compare uncertainty from different statistical downscaling methods to each other and to other sources of uncertainty (e.g., Li et al. 2011). ▪ Timeline: 2013/14 ▪ Lead: RCI
4.3.4 Historical bias correction – assess the effect of historical GCM and RCM temperature and precipitation bias on projected change in extremes. Determine recommendations for climate model bias correction, particularly for quantities that depend on thresholds. Conduct subsequent analysis using bias-corrected RCMs. ▪ Timeline: 2012/14 ▪ Lead: RCI ▪ Support: CSG + HI
4.3.5 Multimodel ensembles – determine methods, benefits and limitations of combining projections from GCMs and RCMs (e.g., Kendon et al. 2010) including those driven by different emissions scenarios and from regional climate model emulators (Li et al. 2011). ▪ Timeline: 2014/15 ▪ Lead: RCI
10
4.4 Requirement 4 – Communicating and synthesizing results
Carrying out the three research objectives in this document promises to produce a large volume of information. The principal means that we will use to communicate and synthesize this information will be through an updated regional climate assessment that will be initiated in 2013.
An important aspect of communicating results about the projected future climate is to provide context with historical trends and variability. A focus on extremes (Objective 2) brings a need to assess historical trends and variability of extremes (Klein Tank et al. 2009). Because of the rare nature of extremes, by their very definition, trends of extremes will present additional challenges to assess, and may not be feasible to assess for all indices.
Another key piece of communicating results is the online display of spatial information and statistical summaries. When upgrading online tools with new features and new model results, we will strive to integrate them with the PCIC Data Portal (Hiebert 2012) and other available online tools whenever possible. We will focus our own development on tools that provide added value for regional users in PYR will coordinate our efforts in this regard with other information providers (e.g., Environment Canada).
4.4.1 Updated regional assessment – conduct a PYR-wide assessment of climate change, extremes, and impacts to expand on the previous BC Climate Overview (Rodenhuis et al. 2009) using CMIP5, RCM and regional downscaling including information short-term (monthly to annual) and near-term (annual to multi-decadal predictions) if available. ▪ Timeline: 2013/16 ▪ Lead: PCIC ▪ Support: RCI + HI + CAM + CSG
4.4.2 Historical trends and variability – Extend the computation of historical trends and composites to indices of extremes. ▪ Timeline: 2012/13 ▪ Lead: CAM+RCI ▪ Support: HI +CSG
4.4.3 Statistical and GIS analysis tools – develop tools using, where possible, open-source platforms. Publish tools for peer review and as a service. ▪ Timeline: ongoing ▪ Lead: CSG ▪ Support: RCI + HI
4.4.4 Update online tools – add CMIP5 results to Plan2Adapt online scenarios tool. Add open GIS layers. Incorporate elements of elevation-corrected downscaling and interpolation into online tools, including further developments such as coastal corrections, and new gridded baselines. Integrate Plan2Adapt and Regional Analysis Tool with EC tools. ▪ Timeline: 2012/14 ▪ Lead: CSG ▪ Support: RCI + HI + CAM
11
References
Anslow, F., 2012: Climate Analysis and Monitoring, Research Plan for 2012-2016.University of Victoria, Victoria BC, 21 pp.
BACC, 2008: Assessment of climate change for the Baltic Sea Basin - BALTEX Assessment of Climate Change for the Baltic Sea Basin. Springer-Verlag, Berlin, 473 pp.
Bürger, G., T. Q. Murdock, A. T. Werner, S. R. Sobie, and A. J. Cannon, 2012: Downscaling extremes - an intercomparison of multiple statistical methods for present climate. Journal of Climate, (in press), doi:10.1175/JCLI-D-11-00408.1.
City of Castlegar, 2011: Adapting to Climate Change Project Summary Report & Action Plan. City of Castlegar, 69 pp.
Christensen, J. H., B. Hewitson, A. Busuioc, A. Chen, X. Gao, and I. Held, 2007: Regional Climate Projections, in Climate Change 2007: The Scientific Basis, Contribution of Working Group I to the Fourth Assessment Report of the Intergovernmental Panel on Climate Change, ed. S. Solomon, Cambridge University Press, New York.
Daly, C., D.R. Conklin, M.H. Unsworth, 2009: Local Atmospheric Decoupling in Complex Topography Alters Climate Change Impacts. International Journal of Climatology, 30(12): 1857-1864.
Fleming, S.W. and P.H. Whitfield, 2010: Spatiotemporal mapping of ENSO and PDO surface meteorological signals in BC, Yukon, and southeast Alaska, Atmosphere-Ocean, 48:2, 122-131
Flower, A., T. Q. Murdock, S. Taylor, and F. W. Zwiers, 2012: Using an ensemble of downscaled climate model projections to assess impacts of climate change on the potential distribution of spruce and Douglas-fir forests in British Columbia (in review). Journal of Environmental Science and Policy.
Goodess, C. M., C. Frei, and J. Schmidli, 2005: Temperature and precipitation extremes at the station and climate model grid-point scales: Some lessons learnt from the statistical and dynamical approaches to downscaling used in the STARDEX project. Geophysical Research Abstracts, 7, 03758.
Hiebert, J., 2012: CSG Support Plan for 2012 to 2016, Pacific Climate Impacts Consortium, University of Victoria, Victoria, BC, (in review).
Kerr, R. A., 2011: Time to Adapt to a Warming World, But Where’s the Science? Science, 334, 1052 –1053, doi:10.1126/science.334.6059.1052.
Klein Tank, A. M. G., F. W. Zwiers, and X. Zhang, 2009: Guidelines on analysis of extremes in a changing climate in support of informed decisions for adaptation, World Meteorological Organization, Geneva, Switzerland, 56 pp.
Li, G., X. Zhang, F. Zwiers, and Q. H. Wen, 2011: Quantification of uncertainty in high resolution temperature scenarios for North America. Journal of Climate, 111221122205005, doi:10.1175/JCLI-D-11-00217.1.
Michelangeli, P. A., M. Vrac, and H. Loukos, 2009: Probabilistic downscaling approaches: Application to wind cumulative distribution functions. Geophysical Research Letters, 36, 1–6, doi:10.1029/2009GL038401.
Miles, E. L., M. M. Elsner, J. S. Littell, L. W. Binder, and D. P. Lettenmaier, 2010: Assessing regional impacts and adaptation strategies for climate change: the Washington Climate Change Impacts Assessment. Climatic Change, 102, 9–27, doi:10.1007/s10584-010-9853-2.
12
Moss, R.H., J.A. Edmonds, K.A. Hibbard, M.R. Manning, S.K. Rose, D.P. van Vuuren, T.R. Carter, S. Emori, M. Kainuma, T. Kram, G.A. Meehl, J.F.B. Mitchell, N. Nakicenovic, K. Riahi, S.J. Smith, R.J. Stouffer, A.M. Thomson, J.P. Weyant, T.J. Wilbanks, 2010: The Next Generation of Scenarios for Climate Change Research and Assessment. Nature, 463(7282): 747-756.
Murdock, T. Q., and G. Bürger, 2010: Research Plan for Regional Climate Impacts, Pacific Climate Impacts Consortium, University of Victoria, Victoria, BC, 39 pp.
Murdock, T. Q., and D. Spittlehouse, 2011: Selecting and Using Climate Change Scenarios for British Columbia, Pacific Climate Impacts Consortium, University of Victoria, Victoria, BC, 35 pp.
Murdock, T. Q., and S. R. Sobie, 2012: Climate Extremes in the Canadian Columbia Basin: A Preliminary Assessment. Pacific Climate Impacts Consortium, University of Victoria, Victoria, BC, (in review).
Murdock, T. Q., S. Taylor, A. Flower, A. Mehlenbacher, A. Montenegro, F. W. Zwiers, and R. Alfaro, 2012: (submitted) Pest outbreak distribution and forest management impacts in a changing climate in British Columbia. Journal of Environmental Science and Policy.
Nakicenovic, N. et al., 2000: Special Report on Emissions Scenarios, Intergovernmental Panel on Climate Change.
Panofsky, H. A., and G. W. Brier, 1958: Some applications of statistics to meteorology. Pennsylvania State University, Pennsylvania.
Pielke, R. A. S., and R. L. Wilby, 2012: Regional climate downscaling: What’s the point? Eos Trans. AGU, 93, PAGE 52, doi:201210.1029/2012EO050008.
Pike, R. G., K. E. R. T. E. Bennett, A. T. S. D. L. Werner, R. D. M. T. Q. Moore, J. S. B. D. Beckers, K. D. F. V. N. Bladon, and D. A. T. P. J. Campbell, 2011: Climate Change Effects on Watershed Processes in British Columbia, Chapter 19. Compendium of forest hydrology and geomorphology in British Columbia, R. G. Pike, T. E. Redding, R. D. Moore, R. D. Winkler, and K. D. Bladon, Eds., BC Ministry of Forests and Range with FORREX Forum for Research and Extension in Natural Resources, 699-747.
Rodenhuis, D., K. Bennett, A. Werner, T. Q. Murdock, and D. Bronaugh, 2009: Hydro-climatology and Future Climate Impacts in British Columbia, revised 2009, 132 pp.
Schnorbus, M. A., 2012: Hydrologic Impacts, Research Plan for 2012 - 2016,. Pacific Climate Impacts Consortium, University of Victoria, Victoria, BC.
Tyler, K., 2012: Plan2Adapt User Interviews and Implications for Website Upgrades, Adaptive Resource Management, 5 pp.
van den Brink, H. W., and G. P. Können, 2011: Estimating 10000-year return values from short time series. International Journal of Climatology, 31, 115-126.
van der Kamp, D. W., and G. Bürger, 2011: Future projections of fire weather severity in southeast British Columbia using statistical downscaling, 30 pp.
Wang, T., A. Hamann, D. L. Spittlehouse, and T. Q. Murdock, 2012: ClimateWNA—High-Resolution Spatial Climate Data for Western North America. Journal of Applied Meteorology and Climatology, 51, 16–29, doi:10.1175/JAMC-D-11-043.1.
Werner, A. T., 2011: BCSD Downscaled Transient Climate Projections for Eight Select GCMs over British Columbia, Pacific Climate Impacts Consortium, University of Victoria, Victoria, BC, 63 pp.

13
Zhang, X., and Coauthors, 2011: Indices for Monitoring Changes in Extremes Based on Daily Temperature and Precipitation Data. Wiley Interdisciplinary Reviews: Climate Change.
Zhang, X., L. A. Vincent, W. D. Hogg, and A. Niitsoo, 2000: Temperature and precipitation trends in Canada during the 20th Century. Atmosphere-Ocean, 38, 395-429.
Zwiers, F. W., M. A. Schnorbus, and G. D. Maruszeczka, 2011: Hydrologic Impacts of Climate Change on BC Water Resources: Summary Report for the Campbell, Columbia and Peace River Watersheds, Pacific Climate Impacts Consortium, University of Victoria, Victoria, BC, 17 pp.
14
Appendix 1: Schematic of proposed approach
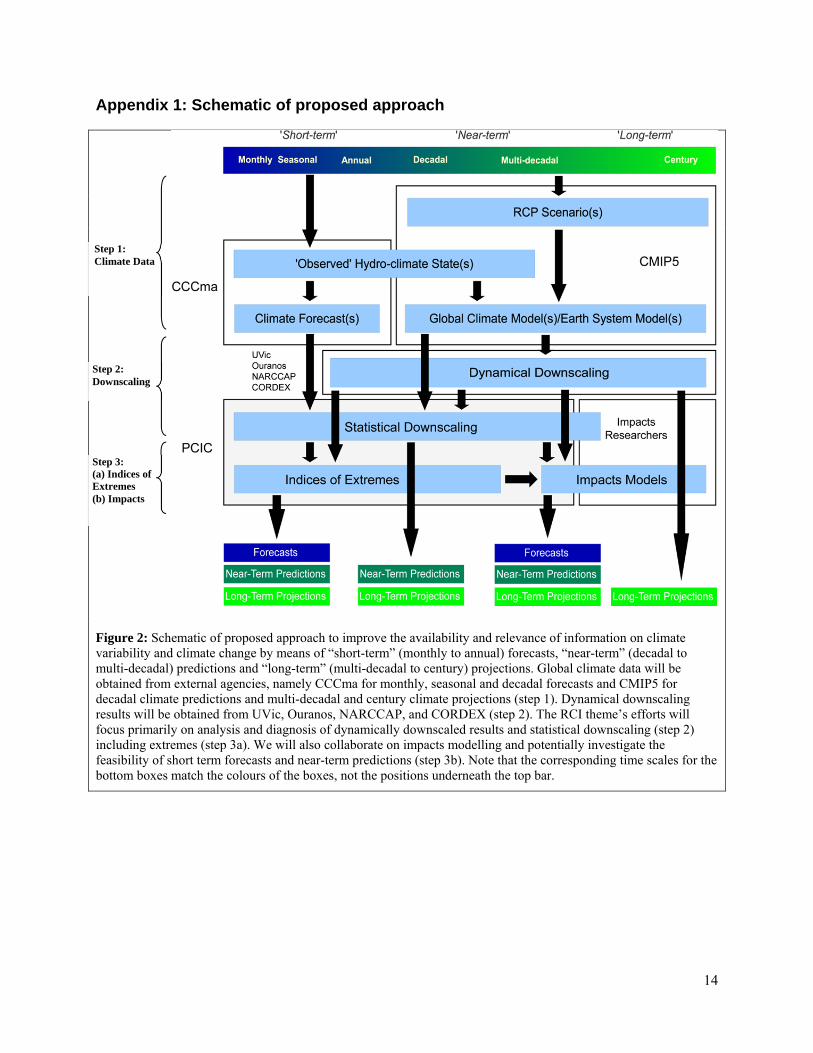
Figure 2: Schematic of proposed approach to improve the availability and relevance of information on climate variability and climate change by means of “short-term” (monthly to annual) forecasts, “near-term” (decadal to multi-decadal) predictions and “long-term” (multi-decadal to century) projections. Global climate data will be obtained from external agencies, namely CCCma for monthly, seasonal and decadal forecasts and CMIP5 for decadal climate predictions and multi-decadal and century climate projections (step 1). Dynamical downscaling results will be obtained from UVic, Ouranos, NARCCAP, and CORDEX (step 2). The RCI theme’s efforts will focus primarily on analysis and diagnosis of dynamically downscaled results and statistical downscaling (step 2) including extremes (step 3a). We will also collaborate on impacts modelling and potentially investigate the feasibility of short term forecasts and near-term predictions (step 3b). Note that the corresponding time scales for the bottom boxes match the colours of the boxes, not the positions underneath the top bar.
Step 1: Climate Data
Step 2: Downscaling
Step 3: (a) Indices of Extremes (b) Impacts
15
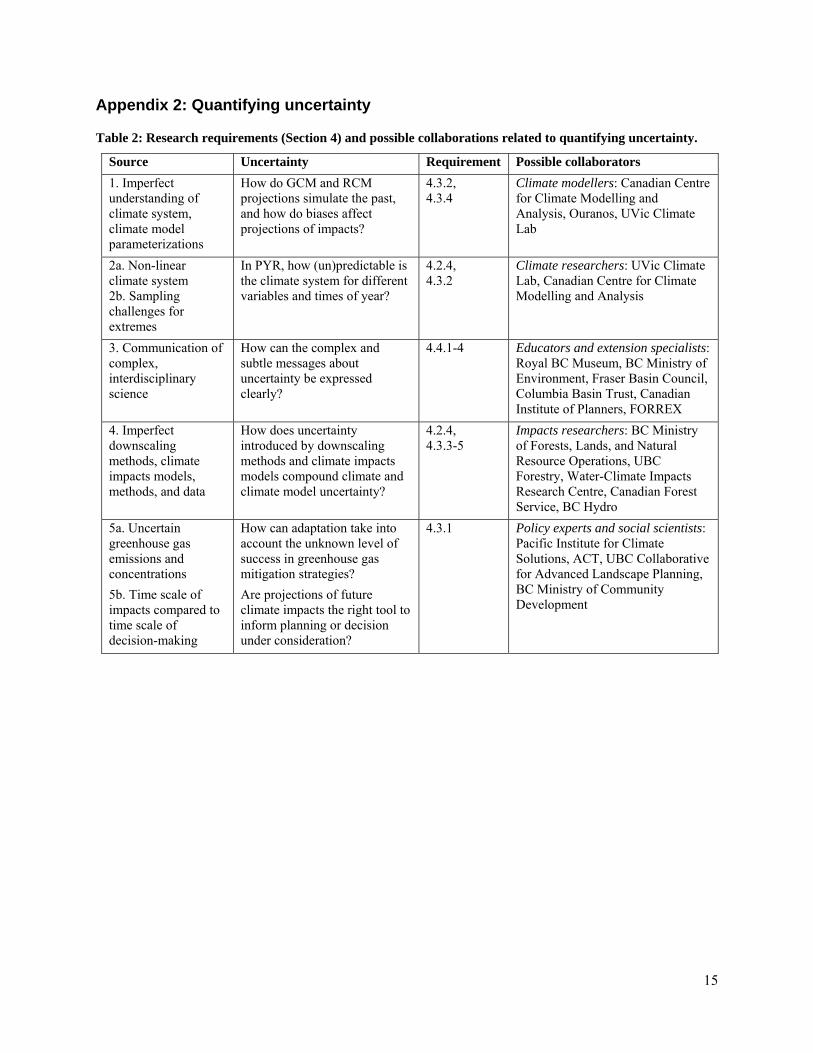
Appendix 2: Quantifying uncertainty
Table 2: Research requirements (Section 4) and possible collaborations related to quantifying uncertainty.
Source Uncertainty Requirement Possible collaborators
1. Imperfect understanding of climate system, climate model parameterizations
How do GCM and RCM projections simulate the past, and how do biases affect projections of impacts?
4.3.2, 4.3.4
Climate modellers: Canadian Centre for Climate Modelling and Analysis, Ouranos, UVic Climate Lab
2a. Non-linear climate system 2b. Sampling challenges for extremes
In PYR, how (un)predictable is the climate system for different variables and times of year?
4.2.4, 4.3.2
Climate researchers: UVic Climate Lab, Canadian Centre for Climate Modelling and Analysis
3. Communication of complex, interdisciplinary science
How can the complex and subtle messages about uncertainty be expressed clearly?
4.4.1-4
Educators and extension specialists: Royal BC Museum, BC Ministry of Environment, Fraser Basin Council, Columbia Basin Trust, Canadian Institute of Planners, FORREX
4. Imperfect downscaling methods, climate impacts models, methods, and data
How does uncertainty introduced by downscaling methods and climate impacts models compound climate and climate model uncertainty?
4.2.4, 4.3.3-5
Impacts researchers: BC Ministry of Forests, Lands, and Natural Resource Operations, UBC Forestry, Water-Climate Impacts Research Centre, Canadian Forest Service, BC Hydro
5a. Uncertain greenhouse gas emissions and concentrations
5b. Time scale of impacts compared to time scale of decision-making
How can adaptation take into account the unknown level of success in greenhouse gas mitigation strategies?
Are projections of future climate impacts the right tool to inform planning or decision under consideration?
4.3.1 Policy experts and social scientists: Pacific Institute for Climate Solutions, ACT, UBC Collaborative for Advanced Landscape Planning, BC Ministry of Community Development
16
Appendix 3: Indices of Extremes
Table 2: Indices of Extremes from www.climdex.org
Index Name Description Units
FD0 Frost days Annual count when TN(daily minimum)<0ºC days
SU25 Summer days Annual count when TX(daily maximum)>25ºC days
ID0 Ice days Annual count when TX(daily maximum)<0ºC days
TR20 Tropical nights Annual count when TN(daily minimum)>20ºC days
GSL Growing season length Annual (1st Jan to 31st Dec in NH, 1
st July to 30
th June in SH)
count between first span of at least 6 days with TG>5ºC and first span after July 1 (January 1 in SH) of 6 days with TG<5ºC
days
TXx Max Tmax Monthly maximum value of daily maximum temp ºC
TNx Max Tmin Monthly maximum value of daily minimum temp ºC
TXn Min Tmax Monthly minimum value of daily maximum temp ºC
TNn Min Tmin Monthly minimum value of daily minimum temp ºC
TN10p Cool nights Percentage of days when TN<10th percentile days
TX10p Cool days Percentage of days when TX<10th percentile days
TN90p Warm nights Percentage of days when TN>90th percentile days
TX90p Warm days Percentage of days when TX>90th percentile days
WSDI Warm spell duration indicator Annual count of days >=6 consecutive days TX>90th percentile days
CSDI Cold spell duration indicator Annual count of days >=6 consecutive days TN<10th percentile days
DTR Diurnal temperature range Monthly mean difference between TX and TN ºC
RX1day Max 1-day precipitation amount
Monthly maximum 1-day precipitation mm
Rx5day Max 5-day precipitation amount
Monthly maximum consecutive 5-day precipitation mm
SDII Simple daily intensity index Annual total precipitation divided by the number of wet days (defined as PRCP>=1.0mm) in the year
mm/day
R10 # heavy precipitation days Annual count of days when PRCP>=10mm days
R20 # very heavy precipitation days
Annual count of days when PRCP>=20mm days
CDD Consecutive dry days Maximum number of consecutive days with RR<1mm days
CWD Consecutive wet days Maximum number of consecutive days with RR>=1mm days
R95p Very wet days Annual total PRCP when RR>95th percentile mm
R99p Extremely wet days Annual total PRCP when RR>99th percentile mm
PRCPTOT Annual total wet-day precipitation
Annual total PRCP in wet days (RR>=1mm) mm