Embed Size (px)
Citation preview

January 2020
Julie PittiniDirector | Treasury Services | FinanceRegion of Peel
Region of PeelInvestor Presentation

Meet the Region of PeelTable of Contents
Overview……………………………………… 2
Economic Highlights…………………….. 8
Financial Overview………………………. 14
Debt Financing…………………………….. 19
Contact Details…………………………….. 26
2

Overview

2nd Largest Municipality in Ontario and Growing
4
The Region of Peel is the 2nd largest municipality in Ontario. It is located in the GTA with1.48 million residents and growing.
Consisting of the Town of Caledon, and the Cities of Brampton and Mississauga, it has undergone a major transition during the past few decades.
Rapid growth and commercial development have transformed the Region of Peel into a dynamic urban community with a vibrant economic base.
Greater Toronto Area (GTA)

PeelResidents 1.48 millionresidents
RegionalCouncil Regional Chair and 24 Councillors
Executive Leadership Team Chief Administrative Officerand 6 Commissioners
Six Operating Departments Corporate Services
Finance
Health Services
Human Services
Public Works
Digital and Information Services
Corporate Governance Structure
5

2015-2035 Strategic PlanOur 20-year vision for the Region of Peel is "Community for Life.“
6

Region of Peel Financed External Programs
TransHelpParamedicsLong Term CareAdult Care Income SupportEmployee SupportCommunity InvestmentHousing SupportHomelessness SupportChild Care
Early Growth and DevelopmentChronic Disease PreventionInfectious Disease PreventionWater SupplyWastewaterWaste Management Roads and Transportation Land Use Planning Heritage, Arts and Culture
Enterprise Programs and Services
PoliceConservation AuthoritiesAssessment Services
Local Municipality Operating and Capital ServicesStorm Water, Local Roads, Parks & Recreation, Fire, Transit
Living
7
Region of Peel Operating and Capital Services
Service and Program ResponsibilitiesThriving Leading

Economic Highlights

Strategic Advantages of the Region of Peel
Estimated daily value of goods movementWithin Canada’s largest economic hub (the GTA)(1)
Close to large United States markets
Bordering Lake Ontario
Have at least a high school education83%
Have a post-secondary education 65%
Years old is youngest average age in the GTA
We are strategically located We are a transportation hub
We are highly educated(2) We are a young population(2)
9
38
$1.8B
(1) GTA = Greater Toronto Area(2) Statistics Canada, 2016 Census
18% 2nd highest ratio of children in the GTA
Major highways & regional / national rail5
Home to Canada’s largest airport

Strong Population Growth and Labour Market
10
Population GrowthIn Millions of People1976 – 2018 | 2041 (Forecast)
Population by Local MunicipalityPeople2018
Employment GrowthIn Thousands of Jobs2013 – 2018
Unemployment RatePercentage2013 | 2015 | 2017 | 2018
8.9%2013
7.7%2015
6.9%2017
6.8%2018
5%
44%
51%

Strong and Diverse Business Sector
Business EstablishmentsIn Thousands2014 - 2018
= Services Sector = Goods Producing Sector
Over 155,000 Business Establishments, with growth of over 5% CAGR (compound annual growth rate) in last 5 years
✓ Services Sector stable at ~85% of total
✓ Top Employers are Royal Bank of Canada, Suncor Energy, Rogers Communications and Hewlett Packard
✓ Lowest water / wastewater rates in Greater Toronto Area attract businesses like Coca-Cola, Pepsi and Cott Beverages
Distribution of Business SectorsPercentages2018
11
= Strong Year-over-Year Growth

Stable Housing Sector and Strong Household Income
12
Building PermitsIn Billions of Dollars2014 - 2018
Housing StartsIn Thousands2014 - 2018
Household Income (Median After-Tax)In Thousands of DollarsStatistics Canada, 2016 Census
✓ 25% higher than Canada
✓ 17% higher than Ontario
✓ 10% higher than Toronto CMA
2019 Housing Starts rebounding to historical 10 year average of ~5,700
Building Permits began to rebound in 2018 after new government measures implemented in 2016 and 2017 to cool over-heated housing market

Source: Municipal Property Assessment Corporation (MPAC) and Region of Peel
13
Sustainable Growth in Taxable Assessment
Taxable AssessmentIn Billions of Dollars1998 | 2008 | 2013 |2018 | 2019
Residential Non-Residential
1 Year Growth
10 Year Average
Brampton 2.9% 2.9%
Caledon 2.0% 2.2%
Mississauga 0.8% 0.8%
Residential 1.8% 1.7%
Non-Residential 0.9% 1.1%
Total 1.6% 1.6%
$277(1)
(1) Does not add due to rounding

Financial Overview

Financial Strengths
15
Focus on Long-Term Financial Planning Strategy with a 10-year Operating Budget Model
Commitment to planning and funding infrastructure replacement / state of good repair- Tax rate: +1% average annual increase to reserves since 2008- Utility rate: +4% average annual increase to reserves since 2009
Integrated approach to managing growth- Growth Management Committee overseeing 2041 growth forecasts- Earlier and more integrated consultation with local municipalities, Province and building industry
Development Charges (DCs) By-Law updated in 2015- Resulting in the earlier collection of residential DCs to offset $100M in borrowing
Financial flexibility for additional revenue generation due to lowest utility rates in Greater Toronto Area
AAA Credit Rating and Strong Liquidity

2020 Budget Highlights
16
$2.6 billionOperating Budget
$1.1 billionCapital Budget
$3.7billion invested in services that advance and support Council’s current term priorities and longer term outcomes
$43 million
$902 million
$982 million
$1.47 billion
$33 million
$199 million
Living:People’s lives are improved in their time of need.
Thriving:Communities are integrated, safe and complete.
Leading:Government is future-orientedand accountable.

Tax-Rate Supported $4,045M
10 Year Capital Plan Highlights
(1)
17
Water Supply $1,959M, 20%
Living: Housing Support,
Long-Term Care, Paramedics
Wastewater $3,409M, 37%
$1,210M, 13%
Thriving: Roads and Transportation,
Police Services, Waste Management$2,638M, 28%
Leading: Office Technology and
State of Good Repair, Climate Change
$197M, 2%
Expenditures$9.4 Billion Capital Reserves $4,324M, 46%
DevelopmentCharges
$4,230M, 45%
Debt $282M, 3%
External $564M, 6%
Financing$9.4 Billion
Utility-Rate Supported $5,368M
(1) Based on 2020-2029 Capital Plan

Development Charges (DCs) Overview
Levy DCs against new development to fund growth-related infrastructure (Provincial legislation)
A “growth pays for growth” philosophy to ensure existing tax base not affected by cost of development
DC rates must be updated at least every 5 years
- Last by-law updated in 2015 with a new by-law scheduled for 2020
Borrowing needs are for long life projects
Water, wastewater, roads are major programs funded by DCs
18
Water and Wastewater Infrastructure Investments2019-2041 (Forecast)
Town of Caledon
City of Brampton
City of Mississauga

Debt Financing

Debt issuance for capital projects, primarily growth related for water, wastewater and roads
Continued focus on liquid benchmark issuance
All debt is general obligation
Borrowing Strategy
Benchmark Size IssuerFor Large Capital Projects
C$150+ million10 – 40 year
Bullet with sinking fund
Smaller Size Issuer For Small Capital Projects at Region and Local Municipalities
C$25 to C$100 million10 year
Serial or Bullet with sinking fund
20

Source: Region of Peel
21
Issued in the last 10 years = $1.778 billion
Anticipated future issuance✓ ~$275 million in 2020✓ ~$375 million in 2021
Historical Public Debt Issuance
Public Debt IssuanceIn Millions of Dollars2010 – 2019
37 40 39 53
310
400
300333
191
75
2010 2011 2012 2013 2014 2015 2016 2017 2018 2019
Serial Bullet
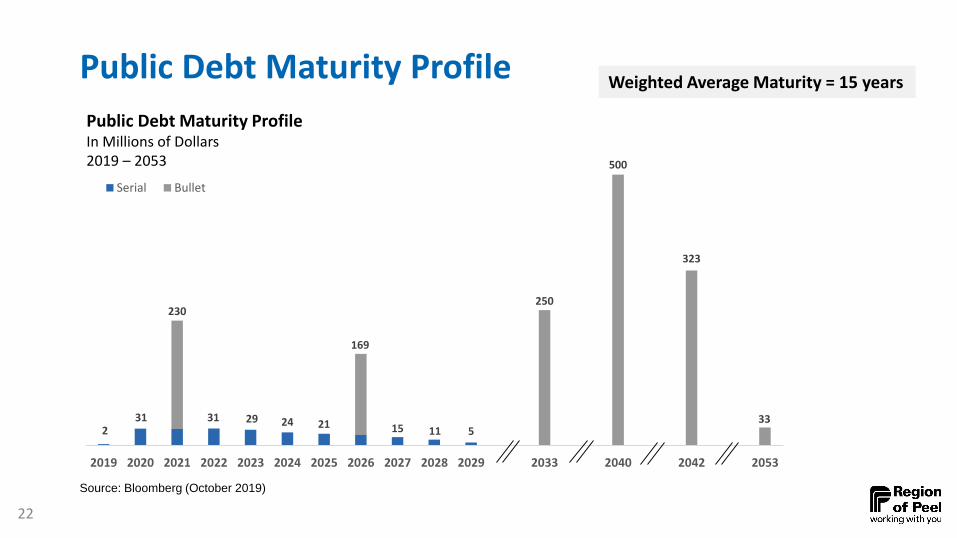
Public Debt Maturity Profile
Source: Bloomberg (October 2019)
22
Public Debt Maturity ProfileIn Millions of Dollars2019 – 2053
Weighted Average Maturity = 15 years
231
230
31 29 24 21
169
15 11 5
250
500
323
33
2019 2020 2021 2022 2023 2024 2025 2026 2027 2028 2029 2033 2040 2042 2053
Serial Bullet

Strong Regulatory Framework Supports Debt IssuanceOntario Municipal Act, 2001
Municipal Debentures Rank
Pari Passus.408(7)
Annual Budgeting Requirements
(Debt Provision and No Operating Deficits)
s.289 and s.290
Limitations on Use of Proceeds
s.413(1) and s.408(2.1)
Debenture By-Law Permanence
s.414(1)
Doctrine of Ultra Vires
s.9 and s.17
Municipal Officer Guilty of an Offense
s.422
Member of Council Diversion of Funds
Liabilitys.424
23
No Bankruptcy Allowed (No Equivalent of Chapter 9 in USA)

AAA Credit Ratings, Strong Liquidity Position and Compelling Investor Returns
| AAA (Stable) since 2001
| Aaa (Stable) since 2011
Credit Ratings Liquidity
“…..a track record of consistent, positive fiscal outcomes supported by prudent, forward-looking fiscal and budget policies, and the region's growing, diversified economy with strong population growth.”
C$2.5 Billion in investments✓ Highly liquid portfolio with strong
credit quality✓ Large annual budget contributions
to reserves for state of good repair
“Peel continues to benefit from a strongeconomy, which helps the region to generate strong revenues, exceptional liquidity, and a declining debt burden.”
Historical Yield Pick-Up vs. Ontario(1)
(1) Indicative credit spread comparison24

25