Embed Size (px)
DESCRIPTION
Climate Change and Peel Region. Adaptation to WHAT?. Neil Comer, Simon Eng, Heather Auld, Erik Sparling. TRCA logo??? CC-RAI logo???. Shuttle Mission Topography/Elevation data. Weather : Conditions today and over the next few days; “ operate day-to-day based on weather ” - PowerPoint PPT Presentation
Citation preview

Climate Change and Peel Region.Adaptation to WHAT?
Shuttle Mission Topography/Elevation data
Neil Comer, Simon Eng, Heather Auld, Erik Sparling
TRCA logo???CC-RAI logo???

Weather: Conditions today and over the next few days; “operate day-to-day based on weather” Climate: Weather over time: Its Extremes, Trends, Changes; “plan on longer term based on climate”
Climate consists of:
• Average weather – now with new averages and trends
• Celebrity high impact storms, the “unusual”
January 12, 2013: High of 14.8C broke records from 1938-2012

Peel Region Climate and Weather Events
October 29, 2012: Remnants of Hurricane Sandy… “In Mississauga, 2,000 customers reported being without power.”
March 22, 2012: Toronto Pearson high temperature reaches 26.0 C; warmest March on record for many stations (Toronto Pearson & City)
Winter 2009-2010: warmest in Canada since nationwide records began in 1948 - 4.0°C above normal; Lake Ontario temperatures peak at 24C
July 21, 2011: Toronto Pearson Humidex exceeds 48; extreme at 50.3 in July, 1995

Peel Region Climate and Weather Events
October 29, 2012: Remnants of Hurricane Sandy… “In Mississauga, 2,000 customers reported being without power.”
March 22, 2012: Toronto Pearson high temperature reaches 26.0 C; warmest March on record for many stations (Toronto Pearson & City)
Winter 2009-2010: warmest in Canada since nationwide records began in 1948 - 4.0°C above normal; Lake Ontario temperatures peak at 24C
August 4, 2009: One hour rainfall from a Mississauga gauge exceeded 1 in 100 year event; flooding damages private properties, municipal and Peel Region infrastructureTornadoes in Peel Region: June 10 1979 & May 31, 1980, Brampton; July 7, 1985 Meadowvale; June 1923, Hornby to Long Branch; etc.

2007: Toronto Pearson experienced driest summer in nearly 50 years with 95 consecutive days without significant rainfall.Lake Ontario water levels down 0.25 metre from long-term average
Peel Region Climate and Weather Events
2009: tornado outbreaks; > 18 tornadoes; Vaughan tornado > $10M in damages; largest single-day tornado outbreak in Canadian history
2005: southern Ontario tornado outbreak Kitchener-Oshawa; Finch Ave washout; ~100mm/hour; highest insured loss in Ontario’s history
Winter, 2007-08: Pearson snow total 194 cm; 13 cm shy of record… Summer 2008: wettest June, July and August on record (396 mm).

January, 1999: Snowiest two-week period since 1846
Winter, 2001: 104 day stretch with snow on the ground; longest snowcover period in record (dating to 1840)Summer, 2001: Driest summer in 54 years of records (Pearson)
Peel Region Climate and Weather Events
2005: southern Ontario tornado outbreak Kitchener-Oshawa; Finch Ave washout; ~100mm/hour; highest insured loss in Ontario’s history
Climate variability and extremes…
May 12, 2000: Severe t-storms; “extensive damage” Port Credit Yacht Club, power outages Brampton and Mississauga
Tornadoes in Peel Region: June 10 1979 & May 31, 1980, Brampton; July 7, 1985 Meadowvale; June 1923, Hornby to Long Branch; etc.

7.3
7.7
8.8
Updated Climate Normals (Averages) indicate that Toronto Pearson Airport has warmed significantly …
YYZ Annual Mean Temperatures (Normals)1961-1990 7.3 C1971-2000 7.7 C1981-2010 8.8 C
Toronto’s Climate has been changing in many ways…

U.S. study: >75%of natural disasters are triggered directly or indirectly by weather and climate
Need to protect critical municipal assets & services – water, transportation, telecomm, buildings and shelters, electricity, energy
Why the concern over weather, climate and its changes?

hurricane
flood
heat
cold
windice storm
tornadolightning/thunderstorm
drought
Weather Hazards from the “Top 10” List: HIRA’s web-based and survey (226 municipalities)
blizzard/snowstorm
fog
41% of Ontario municipalities named power failures in their top 10 hazards63% municipalities in this region named power failure in the top 10 hazards
hail
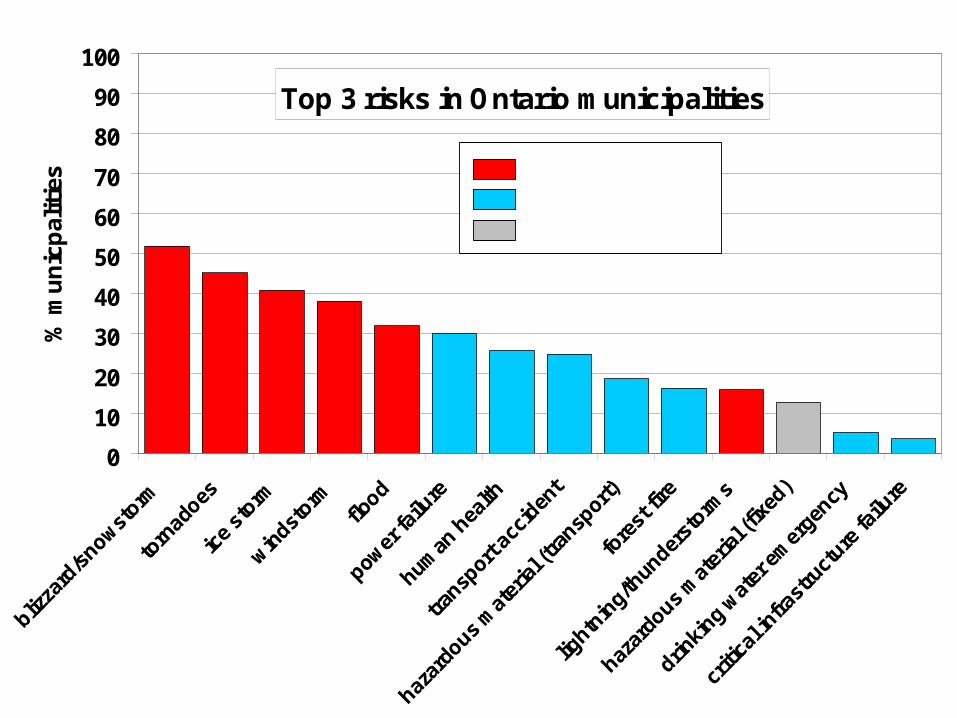
Top 3 risks in Ontario municipalities
0
10
20
30
40
50
60
70
80
90
100%
mu
nic
pal
itie
s Weather
Non-weather
Weather related

STRUCTURES Ice Storms and Wet Snow
Rainfall Intensity & Accum.
Extreme Winds
Summer Storms & Tornadoes
Extreme Snow
Power Lines & Transmission Structures
FAILURE ice + wind
ADDITIVE FAILURE FAILURE SOME
Communication FAILUREice + wind
ADDITIVE FAILURE FAILURE SOME
Buildings WET SNOWDRAINAGE & FAILURE
FAILURE FAILURE FAILURE
Roads, Bridges OPERATION RISKS
DRAINAGE & EROSION
OPERATION& RISKS
FAILURE RISK OPERATION
Stormwater & Wastewater
POWER FAILURES
TOTAL FAILURE
POWER FAILURES
FAILURE RISKS
Water Supply & Distribution
POWER FAILURES
DROUGHTPOWERFAILURE
POWER FAILURE
RISKS
Risks to Various Infrastructure Types from Increasing Climate/Weather Extremes (Frequencies/Intensities)

Structures Expected Lifecycle
Houses/Buildings Retrofit/alterations 15-20 yrsDemolition 50-100 yrs
Sewer Major upgrade 50 yr
Dams/Water Supply Refurbishment 20-30 yrsReconstruction 50 yrs
Bridges Maintenance annuallyResurface concrete 20-25 yrsReconstruction 50-100 yrs
Flexible adaptation options: Work with Infrastructure Lifecycles

“Tornado proofing”: Building Code &“tornado prone” regions

Confirmed and Probable Tornadoes by Fujita Scale – Revised and Updated Database (to 2009)

1960
1965
1970
1975
1980
1985
1990
1995
2000
2005
2010
0
2
4
6
8
10
12
14
16
South - Max/Mean/Min Temperature Trend
Southern Peel Region Temperature Trends
Average Highs
Average Lows
Daily Averages

Many implications for a changing climate…. Requiring adaptation

Climate Change and Peel Region.Adaptation to WHAT?
Shuttle Mission Topography/Elevation data
Neil Comer, Simon Eng, Heather Auld, Erik Sparling

Environment Canada Stations
Data Length

EC Intensity-Duration-Frequency Stations in the Area (extreme rainfall)

Environment Canada
Lightning Detection Network
(Proxy for extreme events?)

EC – Long Term Historical Climate Indices
- Other climate indices have also been calculated using this dataset
Temperature Stations
Precipitation Stations

19181922
19261930
19341938
19421946
19501954
19581962
19661970
19741978
19821986
19901994
19982002
20062010
73.5
74
74.5
75
75.5
76
Historical Lake Ontario Level (m) (IGLD 1985 Datum)
Jan Feb Mar Apr May Jun Jul Aug Sep Oct Nov Dec74
74.2
74.4
74.6
74.8
75
75.2
75.4
75.6
Lake Ontario Monthly Average Level 1918-2011 (m)
Jan Feb Mar Apr May Jun Jul Aug Sep Oct Nov Dec0.24
0.26
0.28
0.3
0.32
0.34
Lake Ontario Monthly Standard Dev (m)

Wave and Wind Statistics
- Also ice coverage, freezeup/breakup (erosion protection)- Also 2 buoys in western Lake Ontario (seasonal) (45139, 45159)

Historical Wind Frequency and Strength – Pearson A, Toronto Island A
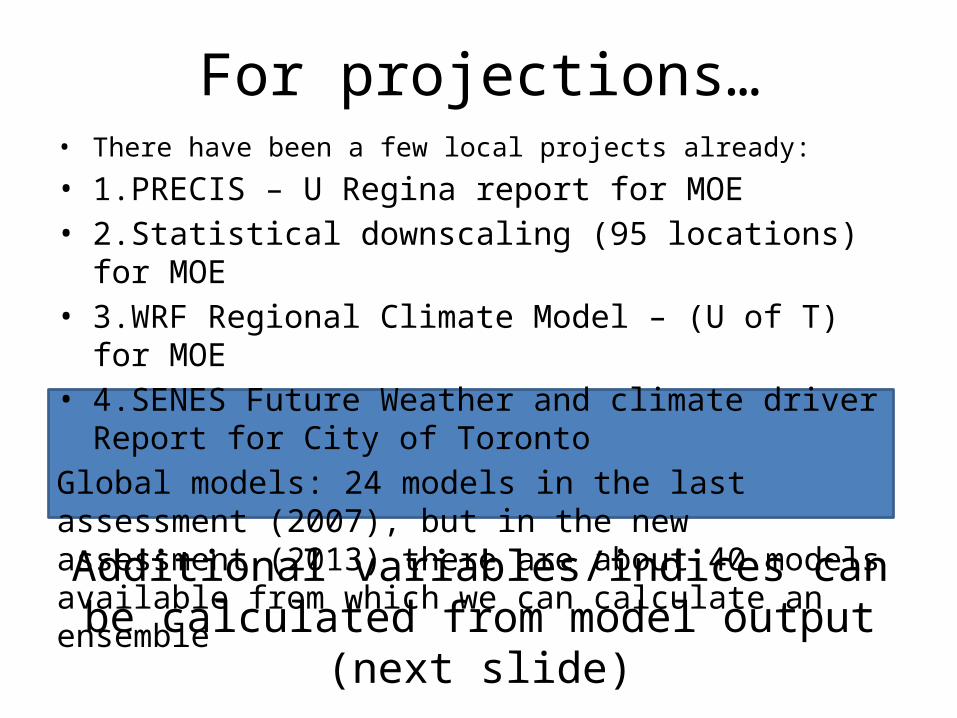
For projections…• There have been a few local projects already:
• 1.PRECIS – U Regina report for MOE• 2.Statistical downscaling (95 locations) for MOE• 3.WRF Regional Climate Model – (U of T) for MOE• 4.SENES Future Weather and climate driver Report for City of
TorontoGlobal models: 24 models in the last assessment (2007), but in the new assessment (2013) there are about 40 models available from which we can calculate an ensemble
Additional variables/indices can be calculated from model output (next slide)

27 PROJECTED Climate Change Core Indices (useful for this study?) :
1. FD, Number of frost days: Annual count of days when TN (daily minimum temperature) < 0oC2. SU, Number of summer days: Annual count of days when TX (daily maximum temperature) > 25oC.3. ID, Number of icing days: Annual count of days when TX (daily maximum temperature) < 0oC.4. TR, Number of tropical nights: Annual count of days when TN (daily minimum temperature) > 20oC.5. GSL, Growing season length: Annual (1st Jan to 31st Dec in Northern Hemisphere count between first span of at least 6 days with daily mean temperature TG>5oC and first span after July 1st of 6 days with TG<5oC. 6. TXx, Monthly maximum value of daily maximum temperature: 7. TNx, Monthly maximum value of daily minimum temperature: 8. TXn, Monthly minimum value of daily maximum temperature: 9. TNn, Monthly minimum value of daily minimum temperature: 10. TN10p, Percentage of days when TN < 10th percentile: 11. TX10p, Percentage of days when TX < 10th percentile: 12. TN90p, Percentage of days when TN > 90th percentile: 13. TX90p, Percentage of days when TX > 90th percentile: 14. WSDI, Warm spell duration index: Annual count of days with at least 6 consecutive days when TX > 90th percentile

15. CSDI, Cold spell duration index: Annual count of days with at least 6 consecutive days when TN < 10th percentile16. DTR, Daily temperature range: Monthly mean difference between TX and TN17. Rx1day, Monthly maximum 1-day precipitation:18. Rx5day, Monthly maximum consecutive 5-day precipitation:19. SDII Simple precipitation intensity index: the daily precipitation amount on wet days, (RR ≥ 1mm), divided by number of wet days.20. R10mm Annual count of days when PRCP≥ 10mm21. R20mm Annual count of days when PRCP≥ 20mm: 22. User defined PRCP threshold.23. CDD. Maximum length of dry spell, maximum number of consecutive days with RR < 1mm24. CWD. Maximum length of wet spell, maximum number of consecutive days with RR ≥ 1mm25. R95pTOT. Annual total PRCP when RR > 95p. 26. R99pTOT. Annual total PRCP when RR > 99p.27. PRCPTOT. Annual total precipitation

Example of Canadian Regional Model output variables (CANRCM4) from Env. Canada