Embed Size (px)
Citation preview

Regenerative Anti Lock Braking System
Mohamed Nabil
Teaching Assistance,
Department of Mechatronics
Faculty of Engineering Ain Shams
University, Cairo, Egypt
Adham Mohamed Doctor,
Department of Automotive
Faculty of Engineering Ain Shams
University, Cairo, Egypt.
Farid Tolba Professor,
Department of Mechatronics
Faculty of Engineering Ain Shams
University, Cairo, Egypt
Abstract— The braking system of vehicles uses the usual
technology of hydraulic braking that generates thermal energy
out of the loss of kinetic energy resulting from difference in
motion of pads and wheels. The Regenerative Braking System
(RBS) works on converting the excess kinetic energy into
electrical energy that can be used in recharging the car battery
during the vehicle deceleration. The RBS has some limitations
that are related to the vehicle speed; as in low speed the system is
inefficient to convert the kinetic energy and generate current.
Also the RBS is uncapable of completely stopping the vehicle regardless of the traveling speed. The study in this paper
emphasizes the Regenerative Anti lock Braking System (RABS)
in saving energy and reducing energy loss, also enhancing
braking performance at low speed rates. RABS comprehensive
model has been constructed on Matlab / Simulink for simulation
purposes in order to collect reliable results about system
perfomance and experimental test rig has been constructed on a
hybrid golf cart in two different modes; one of which is speed
reducing mode and the other one is stopping mode and shows
multiple conditions of braking such as braking on non-slippery
surfaces as dry-surface (asphalt) and braking on slippery
surfaces as wet-surface (asphalt) and oily-surface (asphalt).
Keywords: Anti-lock Braking System, Regenerative Braking
System, Hybrid Electric Vehicle, Motor Generator, State Of
Charge.
I. INTRODUCTION
Nowadays, saving energy becomes important because of
decreasing amount of petroleum and problems of energy. The
total energy dissipated through braking during an urban drive
cycle may reach up to 34% of the total traction energy [1].
The results show that, the braking energy which dissipates as
thermal energy can represent more than 70% of the required
useful motor-energy during an urban drive cycle [2].
According to the energy law of conservation, the energy
cannot be destroyed nor created, but changes from one type
into another one, therefore, the RBS is used in most hybrid
vehicles with assistance of conventional hydraulic brakes to
get the complete stopping of vehicles and reducing energy loss
that can be reused again [3]. The RBS makes the hybrid
electric vehicles capable of recovering a significant amount of
electric energy [4-5]. Studies show that vehicles consume
about one half to one-third of the energy required for the
operation of the vehicle in braking by using a conventional
hydraulic brake. The RBS is used to reduce energy loss and
transform lost energy into another form of reusable energy.
The energy saved by RBS ranges from 8% to 25% of the lost
energy according to driving conditions, and it`s more efficient
for frequently applied braking [3]. In the regenerative braking
in Hybrid Electric Vehicles (HEVs) area, some studies have
focused on developing regenerative models [6], simulation of
regenerative system models [7] and motor control [8]. The
Regenerative cooperation brake system which HEV are
generally equipped with has stroke simulation. This paper
focuses on regenerating the losses of energy in braking at
lower speeds by using a high speed ratio reaching to 1:75 in
order to make sure that the generator speeds in the range of
generating current at lower speeds of vehicles in different
surface conditions. The generator load torque with a high gear
ratio is used to apply braking torque and the anti lock braking
is performed by controlling the field current of the generator
according to the slip- ratio desired between wheel`s speed and
vehicle speed.
II. SYSTEM MODELING
A. Modeling of Regenerative Anti lock Braking System
Fig. 1, shows the schematic diagram of the RABS for a hybrid
golf cart being studied in this paper. As shown in fig. 1, the
Motor Generator (MG) shaft is connected to the rear wheel by
a magnetic clutch, the magnetic clutch transmits the torque of
the vehicle to the MG through two sets of sprockets chains
each set of this sprockets chains has a sproket ratio reaching to
1:2.5 and a differential gearbox which has a large gear ratio
reaching to 1:12, therefore, the speed ratio between the wheel
and the MG shaft reaches to 1:75.
RABS dynamic model consists of five main blocks shown in
fig. 2:
- vehicle and wheel dynamics
- MG dynamics
- Mechanical brake system
- Controller
- Observer.
International Journal of Engineering Research & Technology (IJERT)
ISSN: 2278-0181http://www.ijert.org
IJERTV7IS010016(This work is licensed under a Creative Commons Attribution 4.0 International License.)
Published by :
www.ijert.org
Vol. 7 Issue 01, January-2018
100

Fig. 1. Schematic diagram of Regenerative Anti lock Braking System
Fig. 2. Regenerative system dynamic model (Adapted from. [1])
B. Vehicle and Wheel dynamics
Vehicle and wheel dynamic block accounts for vehicle
dynamics, wheel dynamic and road conditions. A model of
two wheels for HEV, which this paper studies its braking is
shown in fig. 3. It is possible to take the wind effect force, the
force of hill climbing and rolling resistance into consideration
but these forces are simple and cannot be taken into
consideration because of the wind speed is random and may
be with the direction of vehicle braking or in the direction of
against to the vehicle braking, so the wind effect force cannot
be taking into consideration, also the vehicle may be in the
direction of climbing the hill or in the direction of down
warding the hill, so the hill climbing force is random and
cannot be taking into consideration, but for the rolling
resistance, the rolling resistance force acts in the direction of
retarding in vehicle speed and will reduce the stopping
distance, this rolling resistance force is small with reference to
the braking force so the rolling resistance force can be
neglected. The tire deformation increases when the wheel be
rotating at high speeds by the centrifugal force effect and
decreases by the weight transforming at braking, therefore, the
tire deformation is not taking into account because of this
paper emphasizes the performance of the RABS at low speed.
In this figure, Fr is the force of braking acting on the rear
wheel, Nr is a normal force on the wheel, Tr is tire torque and
R is the wheel radius. The ratio of slip of the vehicle wheel is
the relative difference between the linear wheel speed and the
vehicle speed and can be expressed as:
(1)
Where V is the speed of the vehicle, ω is the wheel angular
speed and R is the wheel radius. The braking force that is
shown in fig. 3 is expressed as:
(2)
Where Sr is the slip ratio of rear wheel µr is the coefficient of
adhesion between the tire of rear wheel and the road surface
which is a function of the ratio of slip (s) Also, Nr is the rear
wheel tire normal force by neglect the force of hill climbing,
wind force and rolling resistance, the motion equation of the
vehicle can be expressed as:
(3)
The wheel motion equation can be expressed as:
(4)
Where Jr is the moment of inertia of the wheel and Tr is the
total torque of braking.
The force of braking is a function of the coefficient of
adhesion between a terrain and tire and is determined by the
condition of the road surface and the slip-ratio as shown in
expression (2). Fig. 4, shows the variations of road coefficient
of adhesion versus the slip- ratio of the wheel. The coefficient
of adhesion reaches its max value (µm) at the critical ratio of
slip (Sm) for most conditions of the road. When the ratio of
slip is below (Sm), the traction force can be enhanced by
increasing the ratio of slip. Once the ratio of slip exceeds (Sm),
the braking force will decrease because of the decreasing of
the coefficient of adhesion down the value of sliding µs.
The adhesive coefficient in the lateral direction, a major factor
in the stability and the steerability of the vehicle, increases by
decreasing the slip-ratio. Therefore, to guarantee the stability
and the steer ability of the vehicle, the slip-ratio has to be
under the critical slip-ratio of (Sm) [10].
International Journal of Engineering Research & Technology (IJERT)
ISSN: 2278-0181http://www.ijert.org
IJERTV7IS010016(This work is licensed under a Creative Commons Attribution 4.0 International License.)
Published by :
www.ijert.org
Vol. 7 Issue 01, January-2018
101

Fig. 3. Wheel model of Golf cart (Adapted from. [9])
Fig. 4. Road adhesive coefficient (Adapted from. [1])
C. Dynamics of Motor Generator
The MG dynamic block includes the MG, batteries and
generator electric field switch transistor. MG and the rear
Fig. 5. Schematic diagram of regenerative anti lock braking system
wheels are coupled together to drive a train. Fig. 5, shows a
schematic diagram of RABS.
As shown in fig. 5, the two infrared proximity sensors give
signals of rear and front wheel pulses to the controller 1, then
the controller 1 calculates the angular speed of the rear wheel,
then the controller 1 calculates the slip-ratio of the on road
vehicle and compares the favorable slip-ratio with calculated
on road vehicle slip-ratio, and according to this comparison,
the controller 1 switches the transistor to be ON or OFF and
therefore switches the magnetic field of the alternator. The
controller 2 takes the signal from the current sensor, and then
calculates the alternator braking torque.
In the electric vehicle under study, the efficiency of the MG is
the ratio of electric output power to mechanical input power.
(5)
Where Pout is electrical output power, Pin is mechanical input
power and η is the MG efficiency.
By the law of conservation of energy, the mechanical input
power is equal to the electrical output power plus the losses:
(6)
So that:
(7)
The map of an efficiency of the MG is shown in fig. 6.
International Journal of Engineering Research & Technology (IJERT)
ISSN: 2278-0181http://www.ijert.org
IJERTV7IS010016(This work is licensed under a Creative Commons Attribution 4.0 International License.)
Published by :
www.ijert.org
Vol. 7 Issue 01, January-2018
102

Fig. 6. Characteristics of efficiency of an Motor Generator (Adapted from.
[11])
During braking, the RABS works to prevent the locking of the
wheel because of the locking of wheels doesn’t only lead to
the increase of stopping distance, but also it lowers the amount
of recovered energy. That is because in locking wheels case,
the rotating speed is close to
zero which decreases the maximum amount of power for MG.
Regenerated energy by the MG is charged to the battery. The
battery stores a part of this electrical energy, according to its
available capacity and other physical limitations. Rarely the
regenerative braking cannot occur is only when the battery is
already fully charged [12]. There are three 12 Volt deep cycle
batteries utilized in the golf cart under study each with 100 Ah
rated capacity. The battery charge level is expressed by the
State Of Charge percentage (SOC). The amount of energy
absorbed in a battery is determined through the MG dynamic
block.
D. Regenerative Anti lock Braking System mechanical brake
The mechanical brake in the RABS is a normal mechanical
brake which acts on rear wheels only, this mechanical brake
has a constant braking torque, which equal to the maximum
torque generated by the MG and uses in the second mode of
braking (stopping mode). The total torque of braking of the
rear wheel is a sum of mechanical braking and generator
braking torque which is provided by MG.
III. BRAKING CONTROLLER
The amount of code used in control systems of the
regenerative braking varies in different estimates for different
vehicles [13], it is estimated that modern hybrid electric
vehicles run approximately 100 million lines of code [14]. The
inputs of the controller unit of the RABS are the angular speed
of the rear wheel and the command of the selected mode,
(speed reducing or stopping modes). In the brake controller
module, the brake control strategy determines the braking
torque according to the type of braking mode. There are two
modes; one of which is the speed reducing mode, the braking
torque in the speed reducing mode is applied by MG torque
only. The other one is stopping mode, the braking torque in
stopping mode is a sum of constant mechanical brake and MG
braking torque without using any conventional mechanical
anti-lock braking system [14]. If locking of the wheels is
predicted by the controller. The controller opens the transistor
of electric field generator to switch off the MG torque to allow
the wheel to reach their optimum ratio of slip. If the ratio of
slip of the rear wheel is below the desired slip-ratio, the
braking torque of MG is applied to the wheels with constant
mechanical brake. If the ratio of slip of the rear wheels
exceeds the desired slip-ratio the brake controller lets the
constant mechanical brake and stops the MG torque to allow
the wheels accelerate. When the risk of locking has removed,
The MG torque is applied again to the wheel. The decision
algorithm of brake controller is shown in fig. 7.
Fig. 7. Flow chart for the Brake control
International Journal of Engineering Research & Technology (IJERT)
ISSN: 2278-0181http://www.ijert.org
IJERTV7IS010016(This work is licensed under a Creative Commons Attribution 4.0 International License.)
Published by :
www.ijert.org
Vol. 7 Issue 01, January-2018
103

As shown in fig. 7 the decision of brake controller depends on
the detection of the road surface condition. The curves of the
coefficient of adhesion with slip-ratio in various road
conditions are illustrated in fig. 8.
IV. SPEED AND SLIP-RATIO OBSERVER
The function of the Speed and Slip-ratio observer block is to
calculate the vehicle absolute velocity and the slip-ratio of the
wheel from the values of wheel applied torque and wheel
acceleration. To compute the absolute velocity of the vehicle,
vehicle deceleration is calculated by the derived formula of
vehicle dynamic then integrated.
Where R is the wheel radius, Fr is the force of braking acting
on the rear wheel, Tr is tire torque, ω is the wheel angular
speed and Jr is the moment of inertia of the rear wheel.
From expression (4) where no locking of rear wheels (ω > 0),
the total torque of braking acting on a vehicle is:
(8)
Where
(9)
Therefore, the vehicle deceleration becomes:
(10)
V0 and Vr are the vehicles initial absolute speed initial rear
wheels linear speed respectively. By integrating the absolute
velocity of the vehicle can be obtained as:
(11)
Where Tr is the torque of braking of rear wheels. Then the
slip-ratio of the rear wheel can be calculated by the expression
(1).
In the golf car that is under study in this paper, there are two
wheel encoders with the proximity switch systems, one of
them is attached to the rear wheel and the other one to the
front wheel of the golf cart, according to the number of pulses
that generates by the encoder the angular speed of the wheel is
calculated, and because of no braking is applied to the front
wheel, the golf cart absolute velocity is calculated from the
angular speed of the front wheel by the expression:
(12)
Where ωf is the angular speed of the front wheel.
Fig. 8. Coefficient of adhesion with slip ratio in various road conditions
(Adapted from. [9])
II. DESIGN OF EXPERIMENTAL SETUP
To transfer from the environment of simulation work done on
the computer into the actual system an experimental test rig
has been constructed on a golf cart. The golf cart in the
experimental test rig has specifications of a maximum speed
of 25km/h, mass of 750kg and wheels radius of 0.3m. The
longitudinal force of the tire applied on the surface of the road
has been constructed as the load torque to the MG. There are
two modes of operation; the first one is executed through the
activation of the clutch of regenerative braking system only,
which transmits the torque and motion from the rear wheel to
the MG through a differential gear box and a set of sprockets
and chains. The other one is executed through the activation of
both braking torques (mechanical torque and regenerative anti
lock braking torque). The switching mechanism for the anti
lock braking system is carried out by controlling the field
current of MG by transistor according to the speed rates of the
vehicle and the wheels. The electrical power is calculated and
measured by the controller, the current sensor and voltage
sensor. The experimental test rig setup is shown in fig. 9.
The photo interrupter of the infrared sensor attached to the
rear wheel of the vehicle is shown in fig. 10, which gives
signal for the angular speed for the rear wheel.
Fig. 9. Experimental test rig setup 1.Alternator 2.Mgnetic clutch 3. First
sprocket chain 4.second sprocket chain 5. Beraings chairs 6.electric wires
International Journal of Engineering Research & Technology (IJERT)
ISSN: 2278-0181http://www.ijert.org
IJERTV7IS010016(This work is licensed under a Creative Commons Attribution 4.0 International License.)
Published by :
www.ijert.org
Vol. 7 Issue 01, January-2018
104
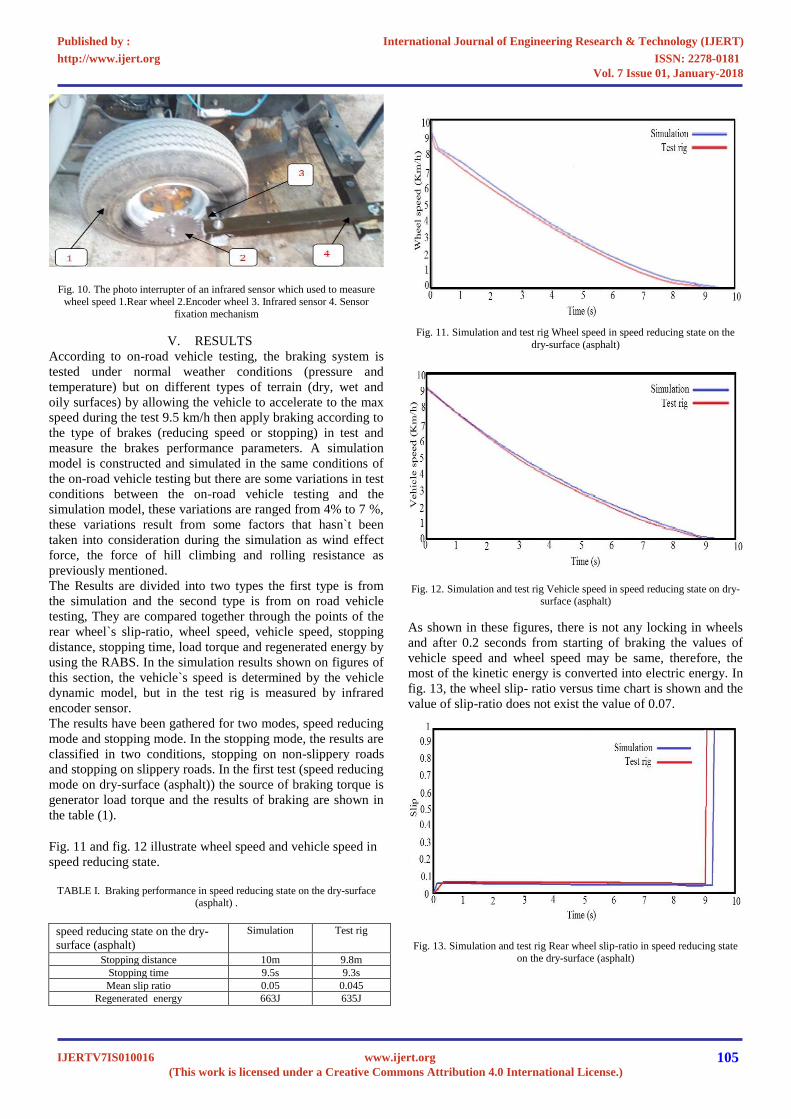
Fig. 10. The photo interrupter of an infrared sensor which used to measure
wheel speed 1.Rear wheel 2.Encoder wheel 3. Infrared sensor 4. Sensor
fixation mechanism
V. RESULTS
According to on-road vehicle testing, the braking system is
tested under normal weather conditions (pressure and
temperature) but on different types of terrain (dry, wet and
oily surfaces) by allowing the vehicle to accelerate to the max
speed during the test 9.5 km/h then apply braking according to
the type of brakes (reducing speed or stopping) in test and
measure the brakes performance parameters. A simulation
model is constructed and simulated in the same conditions of
the on-road vehicle testing but there are some variations in test
conditions between the on-road vehicle testing and the
simulation model, these variations are ranged from 4% to 7 %,
these variations result from some factors that hasn`t been
taken into consideration during the simulation as wind effect
force, the force of hill climbing and rolling resistance as
previously mentioned.
The Results are divided into two types the first type is from
the simulation and the second type is from on road vehicle
testing, They are compared together through the points of the
rear wheel`s slip-ratio, wheel speed, vehicle speed, stopping
distance, stopping time, load torque and regenerated energy by
using the RABS. In the simulation results shown on figures of
this section, the vehicle`s speed is determined by the vehicle
dynamic model, but in the test rig is measured by infrared
encoder sensor.
The results have been gathered for two modes, speed reducing
mode and stopping mode. In the stopping mode, the results are
classified in two conditions, stopping on non-slippery roads
and stopping on slippery roads. In the first test (speed reducing
mode on dry-surface (asphalt)) the source of braking torque is
generator load torque and the results of braking are shown in
the table (1).
Fig. 11 and fig. 12 illustrate wheel speed and vehicle speed in
speed reducing state.
TABLE I. Braking performance in speed reducing state on the dry-surface
(asphalt) .
speed reducing state on the dry-
surface (asphalt)
Simulation Test rig
Stopping distance 10m 9.8m
Stopping time 9.5s 9.3s
Mean slip ratio 0.05 0.045
Regenerated energy 663J 635J
Fig. 11. Simulation and test rig Wheel speed in speed reducing state on the
dry-surface (asphalt)
Fig. 12. Simulation and test rig Vehicle speed in speed reducing state on dry-
surface (asphalt)
As shown in these figures, there is not any locking in wheels
and after 0.2 seconds from starting of braking the values of
vehicle speed and wheel speed may be same, therefore, the
most of the kinetic energy is converted into electric energy. In
fig. 13, the wheel slip- ratio versus time chart is shown and the
value of slip-ratio does not exist the value of 0.07.
Fig. 13. Simulation and test rig Rear wheel slip-ratio in speed reducing state
on the dry-surface (asphalt)
International Journal of Engineering Research & Technology (IJERT)
ISSN: 2278-0181http://www.ijert.org
IJERTV7IS010016(This work is licensed under a Creative Commons Attribution 4.0 International License.)
Published by :
www.ijert.org
Vol. 7 Issue 01, January-2018
105

Fig. 14, shows the load braking torque that results from the
generator and gearbox according to the regenerated current
and battery state of charge.
Fig. 15, shows the regenerated current curve, which likes the
load torque curve due to the proportional relation between the
load torque and current from the generator.
As shown in figure 17, the current being equal to zero after 8.5
seconds when the wheel speed tends to 0.314 m/s because
according to this wheel speed, the generator speed would be
below 750 RPM (The speed that below it the generator cannot
generate current).
In stopping test, there are two stopping conditions, the first
one is non slippery stopping and the second one is slippery
stopping as stopping on wet-surface (asphalt) and oily-surface
(asphalt). In the stopping test, the sources of braking torque
are the generator load torque and a constant mechanical torque
equal to the maximum value of generator load torque. The
results of the test are presented in tables 2-3-4.
Fig. 14. Simulation and test rig Generator load torque in speed reducing state
on the dry-surface (asphalt)
Fig. 15. Simulation and test rig Regenerated current in speed reducing state on
the dry-surface (asphalt)
TABLE II. Braking performance in Stopping state on dry –surface (asphalt).
Stopping state on the dry-surface
(asphalt)
Simulation Test rig
Stopping distance 7m 6.6m
Stopping time 5.4s 5.2s
Mean slip ratio 0.09 0.1
Regenerated energy 405J 385J
TABLE III. Braking performance in stopping state on wet-surface (asphalt)
Stopping state on the wet- surface
(asphalt)
Simulation Test rig
Stopping distance 8m 7.5m
Stopping time 6s 5.9s
Mean slip ratio 0.14 0.15
Regenerated energy 395J 370J
TABLE IV. Braking performance in Stopping state on oily -surface (asphalt).
Fig. 16 and fig. 17, illustrate wheel speed and vehicle speed in
stopping test on dry-surface (asphalt).
As shown in fig. 17, after 5 seconds from starting of braking
there are changes in vehicle speed because the slip ratio of the
wheel exceed the limit of 0.2 as shown in fig. 18 and the
wheel tends to lock, therefore, the transistor switch is turned
off the current of an electric field to the generator which lead
to turning off the generator and decrease the generator load
torque to no load torque and according to it the braking torque
is a mechanical torque only.
Fig. 19 and fig. 20, show the load braking torque that results
from the generator and meshed gearbox and current
regenerated respectively.
As shown in the figures, the generator stopped generating
current after 5.3 seconds from the braking start due to after 5.3
second the wheel speed will decreases than 0.314m/s and the
generator speed will be below 750 RPM.
Fig. 16. Simulation and test rig Wheel speed in stopping station dry-surface
(asphalt)
Stopping state on the oily- surface
(asphalt)
Simulation Test rig
Stopping distance 10.2m 9.8m
Stopping time 10.6s 10.59s
Mean slip ratio 0.245 0.265
Regenerated energy 378J 352J
International Journal of Engineering Research & Technology (IJERT)
ISSN: 2278-0181http://www.ijert.org
IJERTV7IS010016(This work is licensed under a Creative Commons Attribution 4.0 International License.)
Published by :
www.ijert.org
Vol. 7 Issue 01, January-2018
106

Fig. 17. Simulation and test rig Vehicle speed in stopping state on dry-surface
(asphalt)
Fig. 18. Simulation and test rig Rear wheel slip ratio in stopping state on dry-
surafce (asphalt)
Fig. 19. Simulation and test rig Generator load torque in stopping state on dry-
surafce (asphalt)
Fig. 20. Simulation and test rig Regenerated current in stopping state on dry-
surface (asphalt)
In slippery stopping conditions as stopping on wet-surface
(asphalt) and oily-surface (asphalt), the wheel tends to lock
during the braking more than the braking on the dry-surface
(asphalt).
Therefore, the regenerated energy in this test is lower than the
energy that regenerated in the dry-surface (asphalt) test, but
the duration of the braking is significantly larger than on the
dry-surface (asphalt) condition.
Therefore, a large amount of energy is dissipated through the
mechanical brake.
Fig. 21, illustrate the wheel speed on wet asphalt and fig. 22,
illustrate the vehicle speed on wet asphalt.
In the wet asphalt condition the wheel tends to lock at the end
of the baking duration as shown in fig. 21.
Fig. 21. Simulation and test rig Wheel speed in stopping state on wet-surface
(asphalt)
International Journal of Engineering Research & Technology (IJERT)
ISSN: 2278-0181http://www.ijert.org
IJERTV7IS010016(This work is licensed under a Creative Commons Attribution 4.0 International License.)
Published by :
www.ijert.org
Vol. 7 Issue 01, January-2018
107

Fig. 22. Simulation and test rig Vehicle speed in stopping state on wet-surface
(asphalt)
In fig. 23, the wheel slip ratio versus time chart is shown for
wet asphalt.
Fig. 24 shows the generator braking torque, the fluctuation
does not appear in the generator braking torque due to the
wheel start tending to lock after the generator speed lower the
750 RPM.
In fig. 25, the current regenerated from the generator for wet
asphalt conditions is shown.
Fig. 23. Simulation and test rig Rear wheel slip ratio in stopping state on wet -
surface (asphalt)
Fig. 24. Simulation and test rig Generator load torque in stopping state on
wet-surface (asphalt)
Fig. 25. Simulation and test rig Regenerated current in stopping state on wet-
Surface (asphalt)
The second test in slippery stopping conditions is on the oily-
surface (asphalt). Fig. 26, Shows the wheel speed for stoping
state on the oily-surface (asphalt), the fluctuation of the wheel
appears at the start of braking.
Fig. 27, illustrate the vehicle speed on oily-surface (asphalt).
Fig. 26. Simulation and test rig Wheel speed in stopping state on the oily-
surface (asphalt)
Fig. 27. Simulation and test rig Vehicle speed in stopping state on the oily-
surface (asphalt)
International Journal of Engineering Research & Technology (IJERT)
ISSN: 2278-0181http://www.ijert.org
IJERTV7IS010016(This work is licensed under a Creative Commons Attribution 4.0 International License.)
Published by :
www.ijert.org
Vol. 7 Issue 01, January-2018
108

In fig. 28, The wheel slip-ratio versus time chart is shown for oily-
surface (asphalt).
Fig. 29, Shows the generator braking torque for oily-surface (asphalt)
condition, the fluctuation appears in the generator braking torque at
the start of braking on the oily-surface (asphalt) condition due to the
wheel tends to lock.
In fig. 30, The current regenerated from the generator for the oily-
surface (asphalt) condition is shown.
Fig. 28. Simulation and test rig Rear wheel slip-ratio in stopping state on the
oily-surface (asphalt)
Fig. 29. Simulation and test rig Generator load torque in stopping state on the
oily-surface (asphalt)
Fig. 30. Simulation and test rig Regenerated current in stopping state on the
oily-surface (asphalt)
CONCLUSION
In this study, a new regenerative braking system is simulated
and tested at very low speed rates lower than 10 km/h. Two
modes of braking are applied in this system, one of them for
reducing speed and the other one dealing with complete
stopping. The proposed system allows speed reducing mode
by using regenerative braking torque and for the emergency
brake situation and complete stopping a constant mechanical
torque brake with regenerative torque is allowed. The anti lock
system is operated by controlling the load torque from the
generator by changing the states (on-off) of the transistor,
which allows current to pass and produce the electric field for
the generator according to the error between the measured
slip- ratio of the vehicle and the desired slip-ratio based on the
surface condition. The state of the transistor is set to off if the
measured slip-ratio is larger than the desired slip-ratio and set
to on when the measured slip-ratio is smaller than the desired
slip-ratio. One feature of the anti lock regenerative braking
used in a golf cart is utilizing a large gear ratio reduction to
allow the system to recover energy at low speed rates of the
vehicle. By this system, the recovered energy reaches to 25 %
of energy losses in thermal energy. The RABS which is
studied in this paper is easy to adapt and can be used for others
hybrid vehicles.
REFERENCES [1] Tehrani.M.M, Hairi, Yazdi.M.R, Haghpanah, Jahromi, Esfahanian.V,
Amiri.M, Jafari, A, R,“Design of Anti lock Regenerative braking system for series Hyprid electric vehicle,” in International journal of Automative Engineering, vol.1, number 2, June 2011, pp.14-27.
[2] L. A. S. B. Martins, J. M. O. Brito, A. M. D. Rocha, and J. J. G. Martins, "Regenerative Braking Potential and Energy Simulations for a Plug-In Hybrid Electric Vehicle Under Real Driving Conditions," pp. 525-532, 2009.
[3] Wimj.c.Melis, “Fully Regenerative braking and improved acceleration for electrical vehicles,” in International journal of sustainable energy development (IJSED), vol.2, issues 1 and 2, March/June 2013, pp. 75-80.
[4] Wicks, F, Donnelly K,“Modeling Regenerative braking and storage for vehicles,”S.Hall, IEEE Energy conversion ENG. Conf., 1997, 2030-2035.
[5] Gao, Y, Chen L, and Ehsani M,“Investigation of the effectiveness of regenerative braking for EV and HEV,” in society of Automotive engineers (SAE) J., sp-1466, paper No. 1999-01-2901-1999.
[6] Cikanek S. R., Bailey K. E., “Regenerative braking system for Hybrid electric vehicle,” in Proc. Amer. Control Conf., Anchorage, AK, May 2002, 3129-3134.
[7] Yeo, H, Kim H,“Hardware in the loop simulation of regenerative braking for a hybrid electric vehicle,”in Proc. Inst. Mech. Eng. Vol. 216, 2002, pp.855-864.
[8] Gao, H, Gao Y, Ehsani M,“Design issues of the switched reluctance motor drive for propulsion and regenerative braking in EV and HEV,” IEEE Electronic Mach. Drives. Conf., (2001), 571-575.
[9] Sagar. M, Sudeendra. K, Kamalakanta. M, “Regenerative and Anti-Lock Braking System in Electric Vehicles”, Proc. of IEEE International Conference on Advanced Communication, Control and Computing Technologies (ICACCCT), Tamilnadu, India, May 2014.
[10] KEC,Ghaziabad,“Regenerative braking for an electric vehicle using hybrid energy storage system,” in International journal of electrical and electronics engineering research(IJEEEK), vol.3, issue 4, Oct 2013, pp.42-45.
[11] Mike.B. Improving Alternator Efficiency Measurably Reduces Fuel Costs. [20th Apr 2017]; Available from:http:// www.delcoremy.com/AlternatorsHighEff.aspx.
[12] “Regen Braking” Q4D Sales Information Web Page, http://4qd.co.uk/fea/regen.html, viewed: [ 15th Jan 2017];
International Journal of Engineering Research & Technology (IJERT)
ISSN: 2278-0181http://www.ijert.org
IJERTV7IS010016(This work is licensed under a Creative Commons Attribution 4.0 International License.)
Published by :
www.ijert.org
Vol. 7 Issue 01, January-2018
109

[13] Michael.K,“Through-life management of electric vehicles,”2nd international through-life engineering services conference-Ashutosh Tiwari, Jul 2013
[14] Charette RN. This Car Runs on Code. 2009 [25th February 2013]; Available from:
http://spectrum.ieee.org/green-tech/advanced-cars/thiscar- runs-on-code.
International Journal of Engineering Research & Technology (IJERT)
ISSN: 2278-0181http://www.ijert.org
IJERTV7IS010016(This work is licensed under a Creative Commons Attribution 4.0 International License.)
Published by :
www.ijert.org
Vol. 7 Issue 01, January-2018
110