Embed Size (px)
Citation preview
© 2012 United Air Lines, Inc. All rights reserved.
September 10, 2012
CEO Kaiser Leads UATP
Tech Overhaul16
Judge Won’t Dismiss AA
Antitrust Suit4
GlobalStar’s Van Iersel
Talks Change12
Ringing in The new
Some new brands rise in the ranks in BTN’s Annual Hotel Chain
Survey. Page 18
Issue Date
aD ClosIng
MaterIal Due Features show
DIstrIbutIon
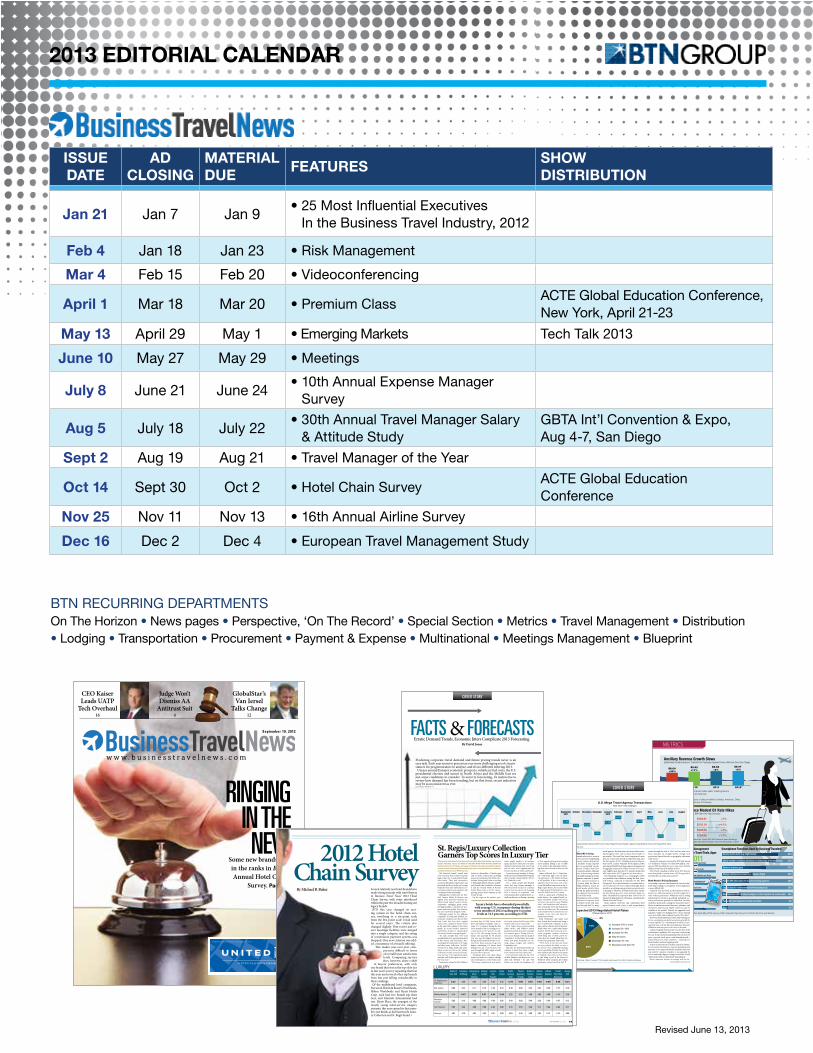
Jan 21 Jan 7 Jan 9• 25 Most Influential Executives
In the Business Travel Industry, 2012
Feb 4 Jan 18 Jan 23 • Risk Management
Mar 4 Feb 15 Feb 20 • Videoconferencing
april 1 Mar 18 Mar 20 • Premium ClassACTE Global Education Conference, New York, April 21-23
May 13 April 29 May 1 • Emerging Markets Tech Talk 2013
June 10 May 27 May 29 • Meetings
July 8 June 21 June 24• 10th Annual Expense Manager
Survey
aug 5 July 18 July 22• 30th Annual Travel Manager Salary
& Attitude Study GBTA Int’l Convention & Expo, Aug 4-7, San Diego
sept 2 Aug 19 Aug 21 • Travel Manager of the Year
oct 14 Sept 30 Oct 2 • Hotel Chain SurveyACTE Global Education Conference
nov 25 Nov 11 Nov 13 • 16th Annual Airline Survey
Dec 16 Dec 2 Dec 4 • European Travel Management Study
BTN RECuRRING DEPARTMENTSOn The Horizon • News pages • Perspective, ‘On The Record’ • Special Section • Metrics • Travel Management • Distribution • Lodging • Transportation • Procurement • Payment & Expense • Multinational • Meetings Management • Blueprint
.com
METRICS
8 JULY 23, 2012
Ancillary Revenue Growth SlowsSystemwide Ancillary Revenue* Collected Per Passenger Segment Flown, With Year-Over-Year Change
Source: Travel Leaders Corporate, based on "nearly 625,000 business travel bookings in the first quarter of 2012" and "roughly 600,000 bookings" from the first quarter of 2011
Smartphone Functions Used by Business TravelersResponsibilities Of Travel ManagementFunction Regarding Mobile Travel Tools, Apps
Hotel Tiers Experience Modest Q1 Rate HikesAverage Cost Per Night By Category, With Year-Over-Year Increases
Source: AirPlus April-May 2012 survey of 92 corporate travel buyers in North America and Europe
Research/recommend tools for possible purchase
Contribute to strategic plans for using tools
Educate self/company about apps and how travelers use them
Implement and manage use of sanctioned tools
Source, negotiate and purchase tools
Damage control
Other
No responsibilities
32% 23%
27% 23%
27% 16%
24% 18%
20% 16%
5% 4%
5% 9%
52% 55%
2012 2011Receive travel alerts (e.g., flight delays) 84%
Check weather conditions, directions or restaurants at the destination 81%
Serve as boarding pass 67%
Change existing travel plans (e.g., rebook a flight) 46%
Provide GPS information for traveler tracking systems 38%
Capture data for reimbursement of the business trip 35%
Communicate with the travel manager or other travelers via social media 28%
Pay small travel expenses directly via mobile 6%
Other 5%
2009 2010 2011 2012**
$8.60 +36%
$9.52+11%
$9.68 +2%
$9.97 +3%
* Includes bags, priority access, onboard cabin sales, ticketing/service charges, change fees, minor fees and pet fees** Through AprilSources: Airlines for America analysis of data provided by Alaska, American, Delta, JetBlue, Southwest/AirTran, United and US Airways
Upper Upscale $163.91 <1%
Upscale $132.10 +4.1%
Upper Midscale $108.19 <1%
Midscale $103.06 +1.7%
10 OCTOBER 8, 2012 .com
COVER STORY
Predicting corporate travel demand and future pricing trends never is an easy task. Each year seems to present an ever more challenging set of circum-stances for prognosticators to analyze, and it’s no di� erent entering 2013.
Unease around Europe’s economic prospects, volatile jet fuel costs, the U.S. presidential election and unrest in North Africa and the Middle East are just some conditions to consider. To assist in forecasting, it’s instructive to review how demand has been trending, but on that front, recent indicators may be as inconsistent as ever.
Erratic Demand Trends, Economic Jitters Complicate 2013 Forecasting By David Jonas
CONTINUED ON PAGE 12
FACTS & FORECASTS
12 OCTOBER 8, 2012 .com
COVER STORY
Where We’ve Been, Where We’re Going� ere is a wide array of demand indicators to assess in determining whether corporate travel is strengthening or weakening, and by how much. Airlines all year have reported very strong or modestly strong corporate business, though some have cut second-half capacity amid macroeconomic concerns. Hoteliers have been even more bullish on the corporate market, o� ering a steady stream of commentary on their strong transient business travel trends, and strengthening group trends.
Data from travel management companies is mixed. Some in recent months have reported sustained or stronger corporate travel activity, while the likes of American Express and Hogg Robinson Group for their second quarters reported weaker activity. Sabre, meanwhile, described as strong the global growth in its global distribution system segments, but noted that U.S. growth lags that of the rest of the world.
Taken together, no trend from the past year is evident. Perhaps one of the better indicators of corporate travel demand is the growth (or decline) in the total num-ber of transactions processed through ARC by mega
travel agencies. But that metric has been rollercoaster-ing throughout 2012, with as many down months as up months. � e trend line hasn’t experienced more than two consecutive months in either direction since the � rst quarter of 2011. Including American Express, BCD Travel, Carlson Wagonlit Travel, Egencia, HRG and Omega World Travel, mega agencies in August had an aggregate transaction volume decrease of 0.7 per-cent, slightly more than the 0.15 percent decline that ARC reported for all U.S. agencies (see chart above).
Describing that trend line as a seismograph, GDSX vice president Tom Wilkinson during � e Beat Quar-terly webinar conducted in September by � e BTN Group said, “If you paid attention to economic indica-tors over the past two years, it kind of feels right. Every month we are getting some great news on interest rates, or housing or whatever, all which drives the economy, but then Europe goes into crisis, and then things sta-bilize. � e markets do respond to that. Travel is one of the great leading indicators of business, certainly in the United States and Europe.”
Many industry observers and constituents don’t expect business travel activity to pick up much more
steam through the end of 2012 and into next year. Some anticipate an outright decline, though such projections depend heavily on geography and many other factors.
Among 63 companies surveyed by BTN with annual U.S.-booked air volumes of at least $30 million, aver-age total T&E spending this year is expected to be $234 million, down from $242 million in 2011.
BCD Travel consultancy Advito in its 2013 forecast wrote that global economic jitters will “slow growth in travel for the rest of this year and 2013.”
North America Pricing ForecastsForecasting corporate travel demand is even more dif-� cult than tracking it as it happens. Forecasting prices is more di� cult still.
“Anybody who has been in the business travel in-dustry for a while has learned to be pretty skeptical of some of these predictions,” Wilkinson said. In noting expectations for oil prices speci� cally and global eco-nomic performance generally he added that “the odds of all those predictions coming true are pretty remote.” � row in unforeseen natural disasters, epidemics and civil unrest, and forecasts simply “cannot account for volatility in the market.” Instead, he suggested travel managers “ought to be thinking about a price-demand curve sort of like what is indicated on the ARC chart.”
However, should unforeseen events with wide impact be few, assumptions on global economies generally be accurate and the U.S. economy grow at about 1.5 per-cent next year, as it has this year, then price forecasts, Wilkinson said, may prove to be close to the mark.
Carlson Wagonlit Travel in July was the � rst of the usual bunch to publish a 2013 corporate travel pricing forecast. It expected modest global growth next year for most corporate travel prices, with demand growth—despite hesitancy by some companies—outpacing very limited airline and hotel supply growth.
A more recent forecast by Advito, issued in Septem-ber, also projected moderate corporate demand growth next year. It too expected airfares and hotel rates next year paid by corporate travelers to rise generally by low-to-mid single-digit percentages around the world, “either in line with or a little faster than in� ation.”
North American airfares on average will rise be-CONTINUED ON PAGE 16
CONTINUED FROM PAGE 10
U.S. Mega Travel Agency TransactionsYear-Over-Year Changes
Note: Mega agencies include American Express, BCD Travel, Carlson Wagonlit Travel, Expedia's Egencia, Hogg Robinson Group and Omega World Travel.
Source: Airlines Reporting Corp.
September2011
October November December January2012
February March April May June July August
+1.7%+0.2%
+1.3%-0.5%
-4.6%
-0.7%
+4.3% +3%
+2.1%
+4.2%
-5.8% -6.5%
Expected 2013 Negotiated Hotel RatesChange Versus 2012
Source: AirPlus International Aug. 2-Sept. 8 survey of 133 corporate travel buyers from North America and Europe
Increase 10% or more
Increase 5%–10%
Increase 1%–5%
Stay the same
Decrease 1%–5%
Decrease more than 5%
1%
24%
9%
52%
11%
3%
2013 eDItorIal CalenDar
Revised June 13, 201318 september 10, 2012 .com .com september 10, 2012 19
2012 Hotel Chain Survey
By Michael B. Baker
LUXURYQuality of Sales Staff
Consistency of Offering
Arrange Group Travel/
Meetings
Meetings Facilities
Corporate Rate
Programs
Quality of Food
Helpful, Courteous
Staff
Physical Appearance of Hotels
Quality of Business Center
In-Room Business Amenities
In-Room Amenities
Overall Price/Value Relationship
Average Total
St. Regis/Luxury Collection 5.27 5.40 5.04 5.04 4.52 5.33 5.70 5.80 5.50 5.50 5.60 5.05 5.31
Ritz-Carlton 5.06 5.24 5.11 5.15 4.49 5.18 5.49 5.59 5.34 5.32 5.48 4.77 5.19
Waldorf Astoria 5.18 5.47 5.19 5.31 4.94 5.44 5.25 5.25 5.08 4.92 5.08 4.75 5.16
Mandarin Oriental 5.05 5.15 4.89 4.89 4.58 5.05 5.40 5.60 5.40 5.20 5.40 4.87 5.12
Four Seasons 5.05 5.33 4.88 5.00 4.43 5.20 5.18 5.55 5.32 5.11 5.42 4.82 5.11
Fairmont 4.82 4.79 4.84 4.84 3.91 5.00 5.04 5.46 5.08 4.92 5.12 4.75 4.88
Several relatively new hotel brands have made strong inroads with travel buyers in Business Travel News’ 2012 Hotel Chain Survey, with some introduced within the past two decades beating out legacy brands.
BTN this year changed its scor-ing system in the hotel chain sur-vey, switching to a six-point scale from the five-point scale it had used for several years. The criteria also changed slightly. Non-resort and re-sort meetings facilities were merged into a single category, and the rating of commission payment systems was dropped. One new criterion was add-ed: consistency of a brand’s offering.
This makes year-over-year com-parisons difficult in terms of overall buyer satisfaction levels. Comparing surveys does, however, show a shift
in buyers’ preferences, with only one brand that was at the top of its tier in last year’s survey repeating that feat this year and several other top brands from last year falling considerably in their rankings.
Of the multibrand hotel companies, Starwood Hotels & Resorts Worldwide, Hilton Worldwide and Hyatt Hotels Corp. each had two brands top their tiers, and Marriott International had one. Hyatt Place, the youngest of the mostly young select-service category entrants, this year earned its first num-ber-one finish, as did Starwood’s Luxu-ry Collection and St. Regis brand.
Two luxury hotel brands that sprung from iconic New York hotels were travel buyers’ favorites across all criteria in the 2012 Hotel Chain Survey. Starwood Hotels & Resorts’ St. Regis and Luxury Collection brands earned the highest overall score in the luxury tier, breaking the years-long hold that Four Seasons and Ritz-Carlton had in BTN’s survey.
Astoria is a bit smaller—22 hotels open and 13 under construction, including properties in Panama City, Berlin, Am-sterdam, Beijing and Dubai, according to Hilton global head of luxury and life-style brands John Vanderslice. Between it and the Conrad Hotels & Resorts brand, Hilton aims to be the “fastest-growing luxury hotel company in the world,” he said.
On the ropes in the austere post-
recession days of 2008, luxury hotels have rebounded powerfully, with av-erage U.S. occupancy during the first seven months of 2012 reaching pre-re-cession levels at 72.5 percent, accord-ing to STR. The average January-July luxury rate increased by 4.8 percent year over year, the highest of any tier, though it still remains below pre-reces-sion levels. Rates are poised to go even higher, considering U.S. luxury hotel demand was up 3 percent year over year through July while supply actually decreased by 0.5 percent.
“Properties had a very short, sharp bounce in terms of occupancy, though rate took longer to recover,” James said. “The luxury, urban hotels were places
where people needed to do business again, and if you add in the core inter-national travel group, they were back and we were soon supplemented by boom economies in China and Brazil.”
Corporate group business at luxury hotels also has rebounded following the days of media scrutiny and the AIG ef-fect, Vanderslice said.
“For a while, people had dropped down and were having meetings at lower-tier hotels because of economic reasons, but now they’re all bouncing back to luxury,” he explained. “Our travel partners have realized there’s ac-tually an efficiency to having a meeting
or event at a luxury hotel because of the facilities and services we provide.”
At St. Regis, those services include butler service, and Waldorf Astoria properties provide personal concierges for transient guests. Having such ser-vices across brands is the true mark of “consistency” in the luxury tier, where hotels now pride themselves on cre-ating unique designs and facilities, Vanderslice said.
They also are how luxury hotels can continue to show their value to high-level corporate travelers, James said.
“Our customers tend to be the CEOs of their business, and there is no ‘on-duty’ and ‘off-duty,’ ” he said. “The butlers can wrestle the mundane out
of their agenda: getting their boarding passes printed, having a cup of coffee or tea ready in the morning or know-ing their tastes in food so they can edit their stay.”
James attributed the St. Regis/Lux-ury Collection’s high score in physi-cal appearance to the relative newness of the portfolio. It also is investing in upgrades where necessary, such as the recent $40 million renovation at the St. Regis Aspen Resort, the second-oldest St. Regis property that had been con-verted in 1998 from a Ritz-Carlton.
Food is a major part of Waldorf As-toria’s history—the original hotel’s cu-linary inventions include veal Oscar, red velvet cake and, of course, Waldorf salad—and Vanderslice said “extraordi-nary restaurants” led to the brand’s top score for food this year. The restaurant at the brand’s Rome Cavelieri hotel, for example, is the city’s only three-Mi-chelin-starred eatery.
Both Vanderslice and James said their brands also benefit from being a part of multibrand companies, as does Ritz-Carlton, which is part of Marriott. While there was a time when luxury travelers turned their noses up at re-wards programs, modern executives relish being part of them, partly be-cause they also benefit when they stay at lower-tier properties, James said.
“CEOs born in the dot-com boom are more relaxed, less likely to wear a tie and are very comfortable moving across a portfolio of hotels,” he said. “If their business takes them to Cincinnati or Oshkosh, that’s where a Four Points is, and being a part of the Starwood Preferred Guest program gives them much more control over their stay.”
St. Regis/Luxury Collection Garners Top Scores In Luxury Tier
The Starwood brands’ overall joint score was more than a tenth of a point higher than the second-ranked brand, Ritz-Carlton. They had near-perfect scores for their physical appearance and hotel staff, and also were the top-scoring brands for their sales staff, business cen-ter, business and in-room amenities and overall price/value relationship.
Although the overall score for Wal-dorf Astoria Hotels & Resorts was slightly lower than Ritz-Carlton’s, the Hilton brand topped several criteria: consistency, arranging group travel, meetings facilities, corporate rate pro-grams and food quality. Four Seasons, last year’s top brand, dropped to fifth.
Although owned by two different companies, St. Regis and Waldorf As-toria have common roots. The two New York hotels that bear their original names were companion hotels owned in the early 20th century by the Astor family. In recent decades, Starwood and Hilton decided to expand them into luxury brands covering the globe.
“It’s only recently that we’ve had enough hotels to be seriously measured in this survey,” said Paul James, Star-wood’s global brand leader for St. Regis and the Luxury Collection. “In 2007, we had 13 St. Regis hotels and some-where in the low 60s for the Luxury Collection, heavily focused in Europe. Now, we have 31 St. Regis hotels open, and that will double again in about a five year-cycle.”
Launched as a brand in 2006, Waldorf
Luxury hotels have rebounded powerfully, with average U.S. occupancy during the first seven months of 2012 reaching pre-recession
levels at 72.5 percent, according to STR.
2013 eDItorIal CalenDar
w w w . b u s i n e s s t r a v e l n e w s . c o m
2012CORPORATE TRAVELCORPORAATTEE TTRRAAVVEELLINDEX
March 19, 2012
SPONSORED IN PART BY
DAILY COSTS OF BUSINESS TRAVEL
June 4, 2012
2012 BUSINESS TRAVEL SURVEY
w w w . b u s i n e s s t r a v e l n e w s . c o m
July 9, 2012
BUSINESSTRAVELBUYER’SHANDBOOK2012SPONSORED IN PART BY
SPONSORED IN PART BY
CORPORATE TRAVEL
2012100
September 24, 2012
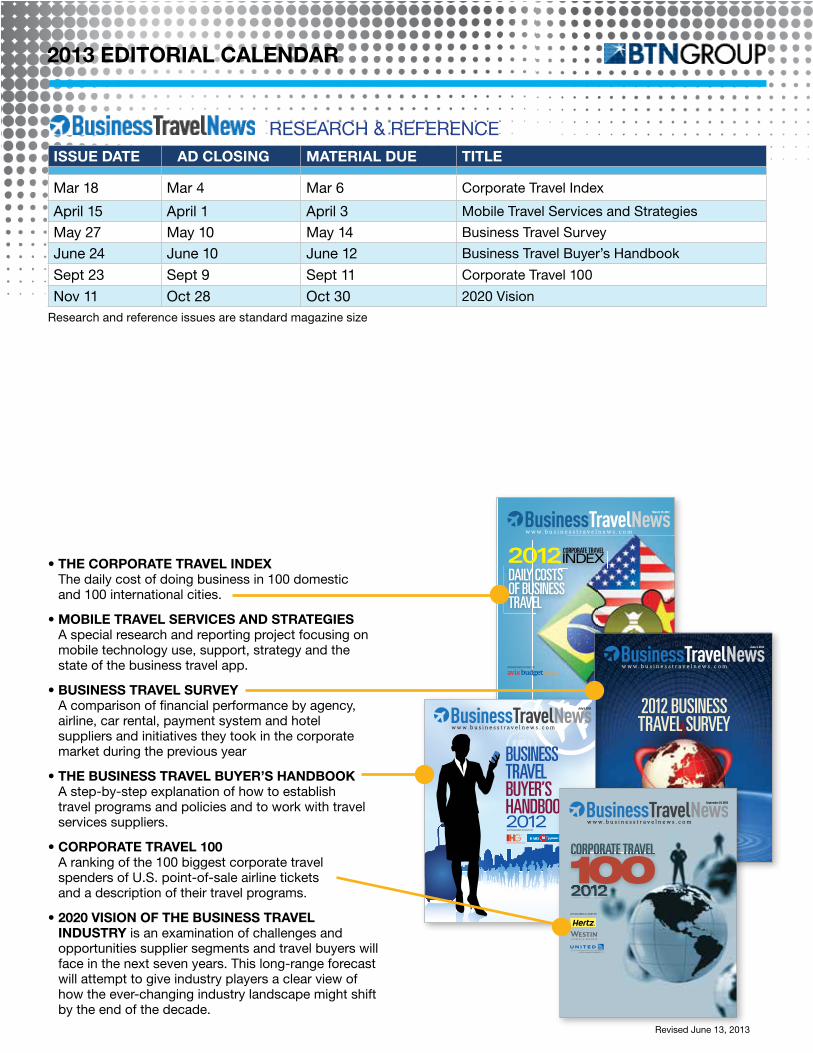
• the Corporate travel InDex The daily cost of doing business in 100 domestic and 100 international cities.
• MobIle travel servICes anD strategIes A special research and reporting project focusing on mobile technology use, support, strategy and the state of the business travel app.
• busIness travel survey A comparison of financial performance by agency, airline, car rental, payment system and hotel suppliers and initiatives they took in the corporate market during the previous year
• the busIness travel buyer’s hanDbook A step-by-step explanation of how to establish travel programs and policies and to work with travel services suppliers.
• Corporate travel 100 A ranking of the 100 biggest corporate travel spenders of u.S. point-of-sale airline tickets and a description of their travel programs.
• 2020 vIsIon oF the busIness travel InDustry is an examination of challenges and opportunities supplier segments and travel buyers will face in the next seven years. This long-range forecast will attempt to give industry players a clear view of how the ever-changing industry landscape might shift by the end of the decade.
Issue Date aD ClosIng MaterIal Due tItle
Mar 18 Mar 4 Mar 6 Corporate Travel Index
April 15 April 1 April 3 Mobile Travel Services and Strategies
May 27 May 10 May 14 Business Travel Survey
June 24 June 10 June 12 Business Travel Buyer’s Handbook
Sept 23 Sept 9 Sept 11 Corporate Travel 100
Nov 11 Oct 28 Oct 30 2020 Vision
Research and reference issues are standard magazine size
RESEARCH & REFERENCE
Revised June 13, 2013
2013 eDItorIal CalenDar
Issue Date aD ClosIng
MaterIal Due show DIstrIbutIon
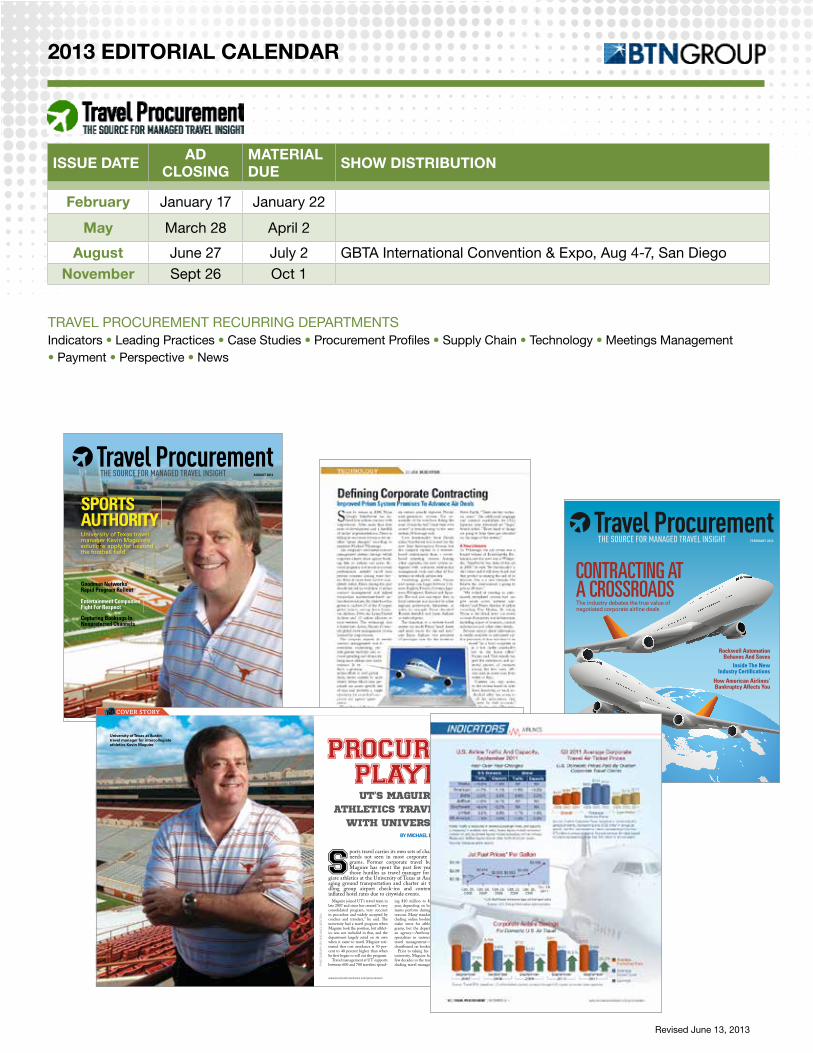
February January 17 January 22
May March 28 April 2
august June 27 July 2 GBTA International Convention & Expo, Aug 4-7, San Diegonovember Sept 26 Oct 1
TRAVEL PROCuREMENT RECuRRING DEPARTMENTSIndicators • Leading Practices • Case Studies • Procurement Profiles • Supply Chain • Technology • Meetings Management • Payment • Perspective • News
SPORTS AUTHORITY
AUGUST 2012
Capturing Bookings In Nonpreferred Channels
University of Texas travel manager Kevin Maguire’s solutions apply far beyond the football fi eld
Goodman Networks’ Rapid Program Rollout
Entertainment Companies Fight For Respect
24 | Travel ProcuremenT | august 2012 www.businesstravelnews.com/procurement
Cover story
www.businesstravelnews.com/procurement august 2012 | Travel ProcuremenT | 25
ports travel carries its own sets of challenges and needs not seen in most corporate travel pro-grams. Former corporate travel buyer Kevin Maguire has spent the past few years clearing those hurdles as travel manager for intercolle-
giate athletics at the University of Texas at Austin—man-aging ground transportation and charter air travel, han-dling group airport check-ins and contending with inflated hotel rates due to citywide events.
Maguire joined UT’s travel team in late 2007 and since has created “a very consolidated program, very succinct in procedure and widely accepted by coaches and travelers,” he said. The university had a travel program when Maguire took the position, but athlet-ics was not included in that, and the department largely acted on its own when it came to travel. Maguire esti-mated that cost avoidance is 30 per-cent to 40 percent higher than when he first began to roll out the program.
Travel management at UT supports between 600 and 700 travelers spend-
ing $10 million to $20 million per year, depending on how well various teams perform during the respective seasons. Many standard solutions in-cluding online booking tools do not make sense for athletic travel pro-grams, but the department does use an agency—Anthony Travel, which specializes in university and sports travel management—for hotel and chauffeured car bookings.
Prior to taking his position at the university, Maguire had racked up a few decades in the travel industry, in-cluding travel manager or consultant
roles at Waste Management, Applied Materials and Tokyo Electron. He also has served as the Global Busi-ness Travel Association’s president (followed by his current term as its vice president) and led the develop-ment of GBTA’s sports committee. These experiences have helped Ma-guire inject procurement acumen into his university’s program, which has become something of a bench-mark not just among college athletics travel programs, but also college and professional sports programs across the country.
Consolidating Ground, Charter AirOne of Maguire’s recent initiatives was consolidating to a single sourc-ing company his department’s ground transportation program. He partnered with technology supplier Go Ground to develop that program from the ground up, as he found much of the existing technology for managing >
University of Texas at Austin travel manager for intercollegiate athletics Kevin Maguire
PH
OTO
GR
AP
H B
Y M
ICH
AE
L S
EX
TON
How American Airlines’ Bankruptcy Affects You
Rockwell Automation Behaves And Saves
The industry debates the true value of negotiated corporate airline deals
Inside The New Industry Certifi cations
CONTRACTING AT A CROSSROADS
FEBRUARY 2012
Revised June 13, 2013
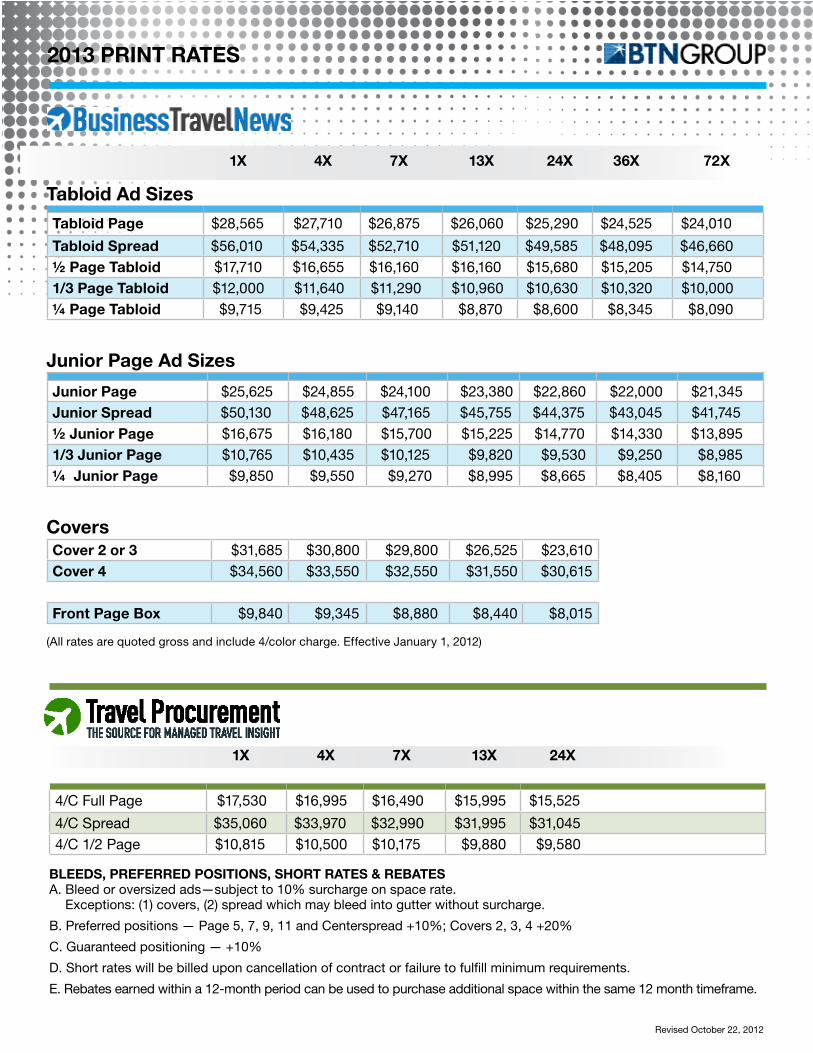
(All rates are quoted gross and include 4/color charge. Effective January 1, 2012)
1x 4x 7x 13x 24x 36x 72x tabloid ad sizes
tabloid page $28,565 $27,710 $26,875 $26,060 $25,290 $24,525 $24,010
tabloid spread $56,010 $54,335 $52,710 $51,120 $49,585 $48,095 $46,660½ page tabloid $17,710 $16,655 $16,160 $16,160 $15,680 $15,205 $14,7501/3 page tabloid $12,000 $11,640 $11,290 $10,960 $10,630 $10,320 $10,000¼ page tabloid $9,715 $9,425 $9,140 $8,870 $8,600 $8,345 $8,090
Junior page ad sizes
Junior page $25,625 $24,855 $24,100 $23,380 $22,860 $22,000 $21,345Junior spread $50,130 $48,625 $47,165 $45,755 $44,375 $43,045 $41,745½ Junior page $16,675 $16,180 $15,700 $15,225 $14,770 $14,330 $13,8951/3 Junior page $10,765 $10,435 $10,125 $9,820 $9,530 $9,250 $8,985¼ Junior page $9,850 $9,550 $9,270 $8,995 $8,665 $8,405 $8,160
Covers Cover 2 or 3 $31,685 $30,800 $29,800 $26,525 $23,610Cover 4 $34,560 $33,550 $32,550 $31,550 $30,615
Front page box $9,840 $9,345 $8,880 $8,440 $8,015
1x 4x 7x 13x 24x
4/C Full Page $17,530 $16,995 $16,490 $15,995 $15,525
4/C Spread $35,060 $33,970 $32,990 $31,995 $31,0454/C 1/2 Page $10,815 $10,500 $10,175 $9,880 $9,580
bleeDs, preFerreD posItIons, short rates & rebates A. Bleed or oversized ads—subject to 10% surcharge on space rate.
Exceptions: (1) covers, (2) spread which may bleed into gutter without surcharge.
B. Preferred positions — Page 5, 7, 9, 11 and Centerspread +10%; Covers 2, 3, 4 +20%
C. Guaranteed positioning — +10%
D. Short rates will be billed upon cancellation of contract or failure to fulfill minimum requirements.
E. Rebates earned within a 12-month period can be used to purchase additional space within the same 12 month timeframe.
2013 prInt rates
Revised October 22, 2012
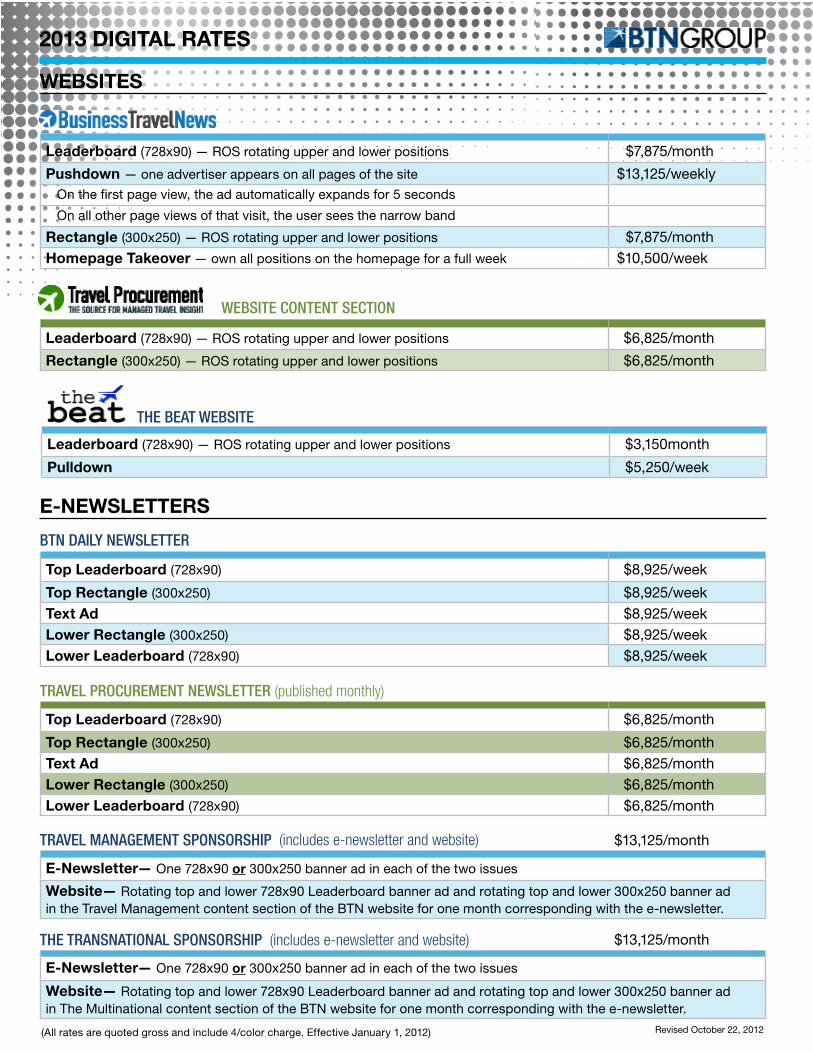
websItes
e-newsletters
(All rates are quoted gross and include 4/color charge. Effective January 1, 2012)
BTN Daily NewsleTTer
top leaderboard (728x90) $8,925/week
top rectangle (300x250) $8,925/weektext ad $8,925/weeklower rectangle (300x250) $8,925/weeklower leaderboard (728x90) $8,925/week
leaderboard (728x90) — ROS rotating upper and lower positions $3,150month
pulldown $5,250/week
Travel procuremeNT NewsleTTer (published monthly)
top leaderboard (728x90) $6,825/month
top rectangle (300x250) $6,825/monthtext ad $6,825/monthlower rectangle (300x250) $6,825/monthlower leaderboard (728x90) $6,825/month
Travel maNagemeNT spoNsorship (includes e-newsletter and website) $13,125/month
e-newsletter — One 728x90 or 300x250 banner ad in each of the two issues
website— Rotating top and lower 728x90 Leaderboard banner ad and rotating top and lower 300x250 banner ad in the Travel Management content section of the BTN website for one month corresponding with the e-newsletter.
The TraNsNaTioNal spoNsorship (includes e-newsletter and website) $13,125/month
e-newsletter— One 728x90 or 300x250 banner ad in each of the two issues
website— Rotating top and lower 728x90 Leaderboard banner ad and rotating top and lower 300x250 banner ad in The Multinational content section of the BTN website for one month corresponding with the e-newsletter.
leaderboard (728x90) — ROS rotating upper and lower positions $7,875/month
pushdown — one advertiser appears on all pages of the site $13,125/weekly On the first page view, the ad automatically expands for 5 seconds
On all other page views of that visit, the user sees the narrow band
rectangle (300x250) — ROS rotating upper and lower positions $7,875/monthhomepage takeover — own all positions on the homepage for a full week $10,500/week
weBsiTe coNTeNT secTioN
leaderboard (728x90) — ROS rotating upper and lower positions $6,825/month
rectangle (300x250) — ROS rotating upper and lower positions $6,825/month
The BeaT weBsiTe
Revised October 22, 2012
2013 DIgItal rates