Embed Size (px)
Citation preview

Cover Photographs (from top to bottom) San Francisco International Airport – 1.8 million square foot international terminal opened December 2000 George Bush Intercontinental Airport (Houston, TX) – Runway 8L-26R opened on October 31, 2003
Photo by Justin Jones of PBS&J for the Houston Airport System AirTrain JFK light rail system – opened December 2003 by Port Authority of New York and New Jersey Steamboat Springs/Bob Adams Field (Steamboat Springs, CO) – general aviation airport
U.S. Department of Transportation Federal Aviation Administration
National Plan of Integrated Airport Systems (NPIAS) (2005-2009)
Report of the Secretary of Transportation to the United States Congress Pursuant to Section 47103 of Title 49, United States Code The NPIAS 2005-2009 report is available online at: http://www.faa.gov/arp/planning/npias/


Table of Contents
Executive Summary.............................................................................................................................v
Chapter 1: System Composition........................................................................................................1 Overview ...................................................................................................................................1 U.S. Department of Transportation ...........................................................................................2 Federal Aviation Administration...............................................................................................2 FAA’S Office of Airports..........................................................................................................3 Guiding Principles for the National Airport System .................................................................4 Airports Included in NPIAS ......................................................................................................5 Commercial Service Airports ....................................................................................................5
Large Hubs ....................................................................................................................7 Medium Hubs ................................................................................................................7 Small Hubs ....................................................................................................................7 Non-Hub Primary ..........................................................................................................7 Non-Primary Commercial Service ................................................................................8
Reliever Airports .......................................................................................................................8 General Aviation Airports .........................................................................................................8 New Airports .............................................................................................................................8 Airports Not Included in NPIAS ...............................................................................................9 State Plans Include More Airports ............................................................................................9
Chapter 2: System Performance .....................................................................................................11 Overview .................................................................................................................................11 Applying the Six Key Factors .................................................................................................11 Capacity...................................................................................................................................11
Alternative Capacity Enhancement Measures.............................................................20 Safety.......................................................................................................................................22 Aircraft Noise ..........................................................................................................................25 Runway Pavement Condition ..................................................................................................27 Surface Accessibility ...............................................................................................................28 Financial Performance.............................................................................................................31
Chapter 3: Activity Forecasts..........................................................................................................35 Overview .................................................................................................................................35 Activity Forecasts....................................................................................................................35 Implications of Forecasts.........................................................................................................36 Other Factors ...........................................................................................................................37
Cargo ...........................................................................................................................38 Innovations ..................................................................................................................38 New Large Aircraft......................................................................................................38 Commercial Spaceports...............................................................................................39 Conversion of Military Surplus Airfields....................................................................39 Air Quality...................................................................................................................39
National Plan of Integrated Airport Systems (2005-2009) i
Chapter 4: Development Requirements......................................................................................... 41 Overview ................................................................................................................................. 41 Process..................................................................................................................................... 42 Development Categories ......................................................................................................... 43
Safety and Security...................................................................................................... 44 Reconstruction............................................................................................................. 44 Standards ..................................................................................................................... 45 Environment ................................................................................................................ 45 Terminal Building ....................................................................................................... 45 Surface Access ............................................................................................................ 45 Airfield Capacity ......................................................................................................... 46 New Airports ............................................................................................................... 46 Anticipated Sources of Funding.................................................................................. 46 Additional Costs Not Included in the NPIAS ............................................................. 47
Appendix A: List of NPIAS Airports with 5-Year Forecast Activity and Development Cost ............................................................................................A-1
Explanation of Terms and Abbreviations Used in the Appendix A......................................A-1
Appendix B: State Maps ................................................................................................................ B-1 Explanation of Maps in Appendix B..................................................................................... B-1
Appendix C: Regional Offices' Addresses and Telephone Numbers ........................................C-1
ii National Plan of Integrated Airport Systems (2005-2009)
List of Figures and Tables FIGURES
Figure 1: NPIAS Cost by Airport Type..............................................................................................vii Figure 2: NPIAS Cost by Type of Development...............................................................................viii Figure 3: Number of Airports by Ownership and Use (January 2004) ...............................................1 Figure 4: Geographic Coverage of NPIAS Airports1 ...........................................................................6 Figure 5: Percentage of Commuter and Air Carrier Operations at 35 OEP Airports in 2002............16Figure 6: Percentage of Connecting Passengers (at 35 OEP Airports in 2002) .................................17 Figure 7: Airports with 10 Percent or More International Enplanements ..........................................18 Figure 8: Accident Rates ....................................................................................................................23 Figure 9: Number of Runway Incursions by Fiscal Year...................................................................25 Figure 10: Residential Population Expected to Benefit from Noise Funding
Fiscal Year 2003 through 2008......................................................................................27 Figure 11: Runway Pavement Condition (2003)................................................................................28 Figure 12: Public Transportation Market Share at Select U.S. Airports ............................................30 Figure 13: Total Revenue and Total Expenses by Airport Type........................................................34 Figure 14: 5-Year Development Estimates from Published NPIAS Reports to Congress................42Figure 15: Comparison of 5-Year Development Costs by Airport Type 2001 and 2005 ..................43 Figure 16: Comparison of 5-Year Development Costs by Category 2001 and 2005.........................43 TABLES
Table 1: Distribution of Activity (2002) ..............................................................................................5 Table 2: New Runways Opened in Prior Five Years at OEP Airports..............................................13 Table 3: OEP Runways and Runway Extensions Under Construction (as of May 2003) .................14 Table 4: Selected Demand and Capacity Measures for 35 OEP Airports
(2002 Data Ranked by Enplanements) ..........................................................................15 Table 5: Airports and Metropolitan Areas Identified as Needing Capacity Today,
By 2013, and By 2020 ...................................................................................................19 Table 6: Population Within 20 Miles of a NPIAS Airport .................................................................29 Table 7: Airport Operating and Financial Summary 2002 ($ millions) .............................................33 Table 8: U.S. Aviation Activity Forecasts..........................................................................................36 Table 9: 2005 – 2009 NPIAS Cost by Airport and Development Category
($ millions 2004)............................................................................................................41 Table 10: 2001 – 2005 NPIAS Cost by Airport and Development Category
($ millions current) ........................................................................................................47
National Plan of Integrated Airport Systems (2005-2009) iii

This page intentionally left blank.
iv National Plan of Integrated Airport Systems (2005-2009)
Executive Summary The National Plan of Integrated Airport Systems (NPIAS) for 2005 to 2009 is submitted to Congress in accordance with Section 47103 of Title 49 of the United States Code. The plan identifies 3,344 existing airports that are significant to national air transportation and, therefore, eligible to receive grants under the Federal Aviation Administration (FAA) Airport Improvement Program (AIP). The report estimates that over the next five years $39.5 billion of AIP eligible infrastructure development will be needed to meet the needs of all segments of civil aviation. The NPIAS is used by FAA management in administering the AIP. It supports the FAA’s goals identified in the Flight Plan (2004-2008) for safety and capacity by identifying the specific airport improvements that will contribute to achievement of those goals. The NPIAS includes a section on the condition and performance of the airport system, highlighting six topics: safety, capacity, pavement condition, financial performance, surface accessibility, and noise. The findings at this time are generally favorable, indicating that the system is safe, convenient, well maintained, and largely supported by rents, fees, and taxes paid by users. At the beginning of 2000, air travel in the United States was at an all-time high leading to the highest number of flight delays and cancellations ever reported by the major airlines. This began to change in late 2000/early 2001 with an economic slowdown, sharpened by the terrorist attacks of September 11, 2001. The slide continued into 2003 with the war in Iraq and the Severe Acute Respiratory Syndrome (SARS) epidemic. In 2004, traffic at many of the largest airports remains lower than it was in 2001. Delays and cancellations are generally less than they were in 2001. But several airports are experiencing higher delays than they had in 2002. This increase is due in part to airline scheduling, increased use of regional jets, and growth in low-fare service. Since the events of September 11, 2001, a major restructuring and downsizing has occurred among the legacy network air carriers1 associated with a tremendous growth in regional/commuter carriers. Low-cost carriers2 have experienced rapid growth particularly in nontraditional long-distance markets. The demand for air travel is showing improvement with passenger levels predicted to return to pre-September 2001 levels by 2005. As demand recovers, passengers are benefiting by the growth in competitive air service offerings. Major airfield improvements are being planned together with enhanced technology help mitigate those delays. The noise situation is improving because of industry and Government efforts to replace noisy aircraft and obtain a quieter aircraft fleet. Over the past 20 years, considerable effort has been expended to provide relief to noise impacted areas by funding noise compatibility projects under the AIP. Noise compatibility projects funded under AIP in the last four years are expected to benefit approximately 62,000 people in residential communities upon completion of the projects. In addition, over 20,000 students are expected to benefit from school insulation and relocation projects funded in the last two years. 1 Alaska, American, Continental, Delta, Northwest, United, and US Airways 2 American Trans Air, America West, AirTran, Frontier, Independence Air, JetBlue, Southwest Airlines, and Spirit
National Plan of Integrated Airport Systems (2005-2009) v
Most U.S. residents have excellent access to air transportation, with 98 percent of the population living within 20 miles of a NPIAS airport. The primary mode of ground access is by private automobile, but congestion and concerns about air quality are stimulating interest in improved public transportation to airports in urban areas. The cost estimates of future airport development included in this report are almost 15 percent ($6.6 billion) lower than the preceding report, issued in 2002. Costs for hub airports (large, medium, small, and non-hubs) decreased while commercial service, reliever, and general aviation costs increased. In response to decreases in airline revenue and passenger activity and the funding of large development programs through passenger facility charges (PFCs), AIP-eligible capital project estimates for large hub airports decreased by roughly one-third ($7.3 billion). The typical projects deferred beyond the 5-year period covered by this report are new and major terminal expansions, ground access, and major airfield reconfiguration, which account for approximately 50 percent of the decrease in development. When the FAA approves collection of PFCs for airport development, the project is considered funded and therefore is no longer included in the NPIAS. Since the preceding report, the FAA has approved PFC collections for two significant projects, $2.4 billion for the north and south terminals at Miami and $1.5 billion for construction of the automated people mover at Dallas-Ft. Worth, both of which were included in the last report as unfunded development. Non-primary commercial service, reliever, and general aviation airports show higher development needs, with the largest increases at general aviation airports (17 percent). This increase reflects a continued focus, largely as a result of the non-primary entitlement funding which began in FY 2001,3 on identifying development (rehabilitating airfield pavement, removing obstructions, installing perimeter fencing, etc.) at these airports, some of which have undertaken Airport Layout Plans (ALPs) and master plans for the first time. The cost estimates in the NPIAS are obtained primarily from airport master and system plans that were prepared by planning and engineering firms for state and local agencies. These plans are usually funded in part by the FAA, are consistent with FAA forecasts of aeronautical activity, follow FAA guidelines, and have been reviewed and accepted by FAA planners who are familiar with local conditions. Efforts have been made to obtain a realistic estimate of development needs that coincides with local and state capital improvement plans. The NPIAS includes only development to be undertaken by airport sponsors and does not include improvements to air traffic control and navigation aids that are funded by the FAA’s Facilities and Equipment program. Because it is an aggregation of airport capital projects identified through the local planning process rather than a spending plan, no attempt is made to prioritize the development projects that comprise the current NPIAS or evaluate whether the benefits of specific development projects would exceed costs.
3 Beginning in FY 2001, with the enactment of Wendell H. Ford Aviation Investment and Reform Act for the
21st Century (AIR21), a total of 20 percent of the annual amount made available for obligation was apportioned for the use at non-primary commercial service, general aviation, and reliever airports within the States and insular areas. These airports are collectively referred to as “non-primary” airports. Non-primary airports are entitled to an individual apportionment based on the lesser of 1/5 of the airport’s five-year capital needs as identified in the NPIAS Report or $150,000.
vi National Plan of Integrated Airport Systems (2005-2009)

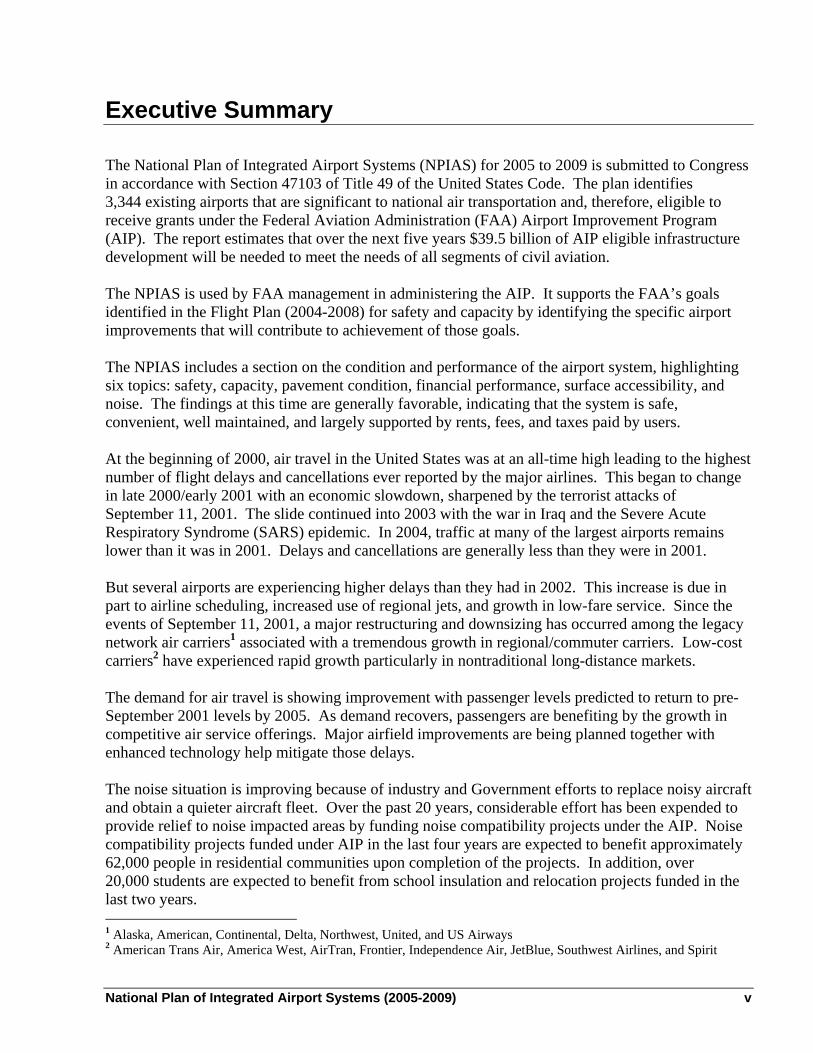
Airports with scheduled service (large, medium, small, non-hubs and commercial service) account for 76 percent ($29.7 billion) of the $39 billion total development; reliever airports serving general aviation in metropolitan areas account for seven percent ($2.7 billion); and general aviation (GA) airports account for 17 percent ($6.9 billion) (as shown in Figure 1). Figure 1: NPIAS Cost by Airport Type
G.A.17%
Large 43%
Medium14%
Small7%
Non-Hub10%
Reliever7%
Comm Svc2%
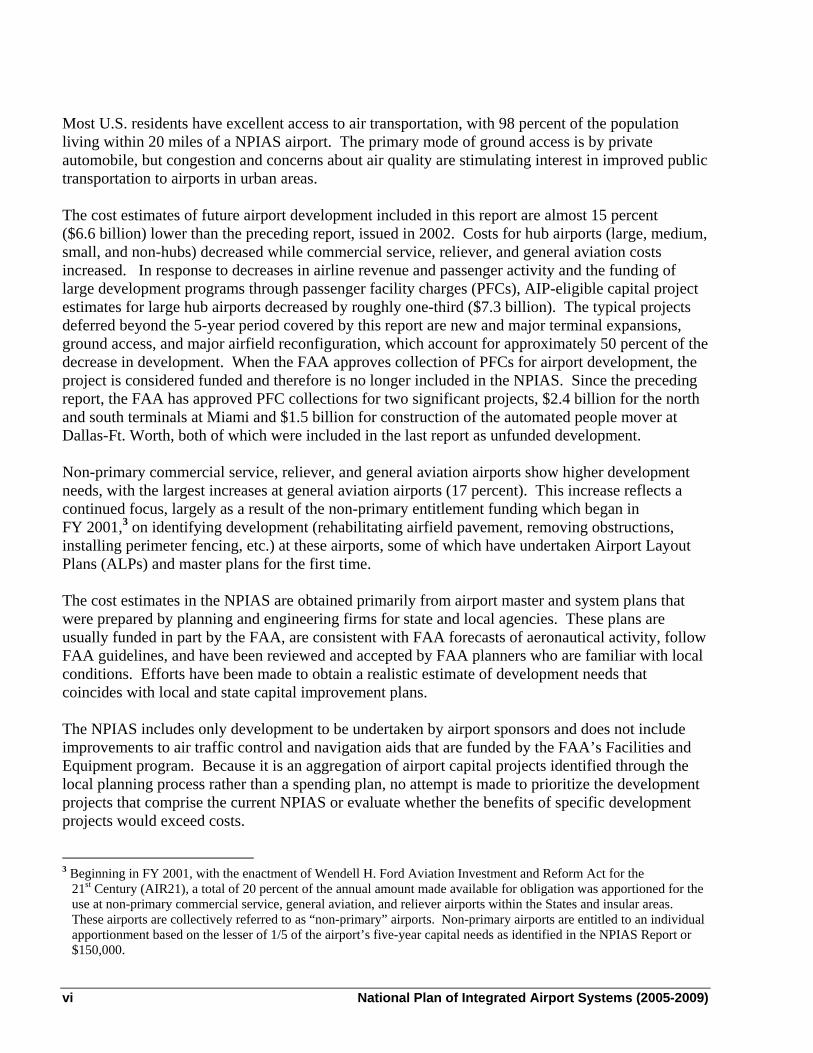
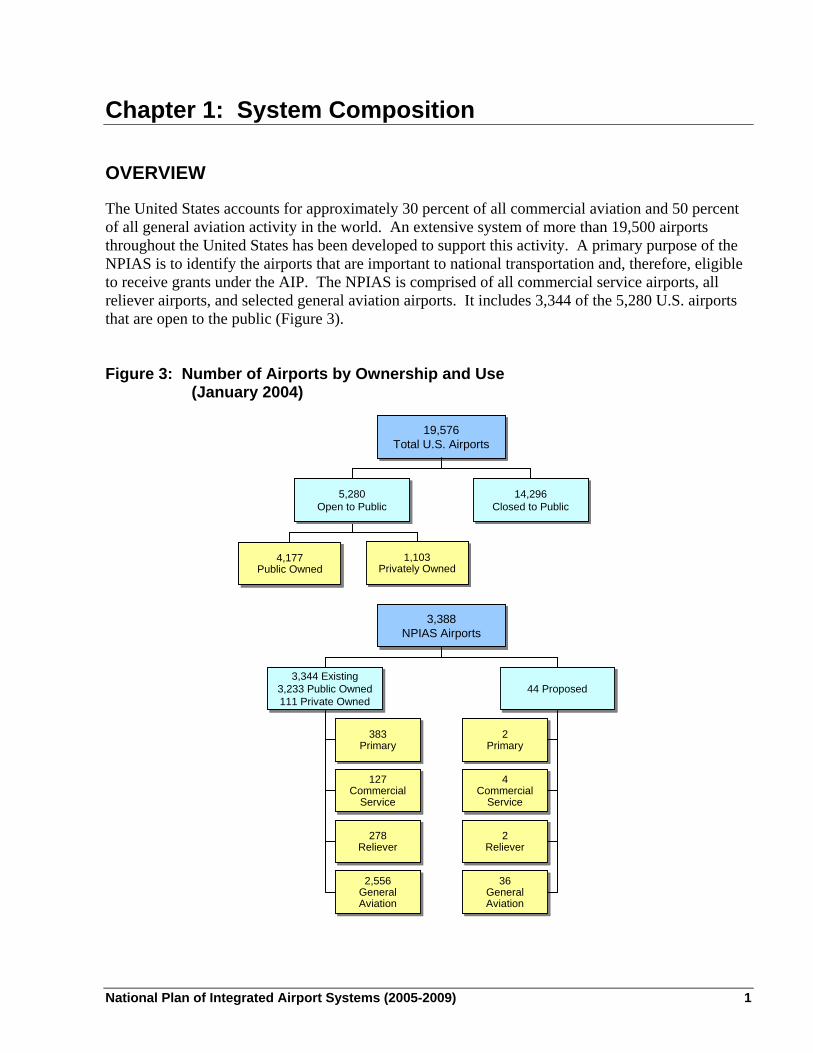
The purpose of planned development contained in the NPIAS primarily is to bring existing airports up to current design standards (36 percent) and to add capacity at congested airports (19 percent). Figure 2 identifies the cost by type of development. Safety development increased 23 percent (increase of $246 million) from the last report while security costs increased 69 percent (increase of $424 million). These increases reflect the costs associated with improving runway safety areas as well as the costs associated with modifying terminals to accommodate explosive detection systems and other security enhancements. A significant amount of the identified funds (16 percent) is for the modification, replacement, and development of passenger terminal buildings to accommodate more passengers, larger aircraft, new security requirements, and increased competition among airlines. To accomplish this development, airports are directing the majority of their PFC revenues to landside projects such as terminals, ground access systems, noise mitigation, and the financing costs of these projects. Funds for airport development are derived from a variety of sources, including airport cash flow, bonds, Federal/state/local grants, and PFCs. The combination of funding sources and their adequacy varies with type of airport and level of activity. The NPIAS includes only planned development that is eligible to receive Federal grants under the AIP.
National Plan of Integrated Airport Systems (2005-2009) vii
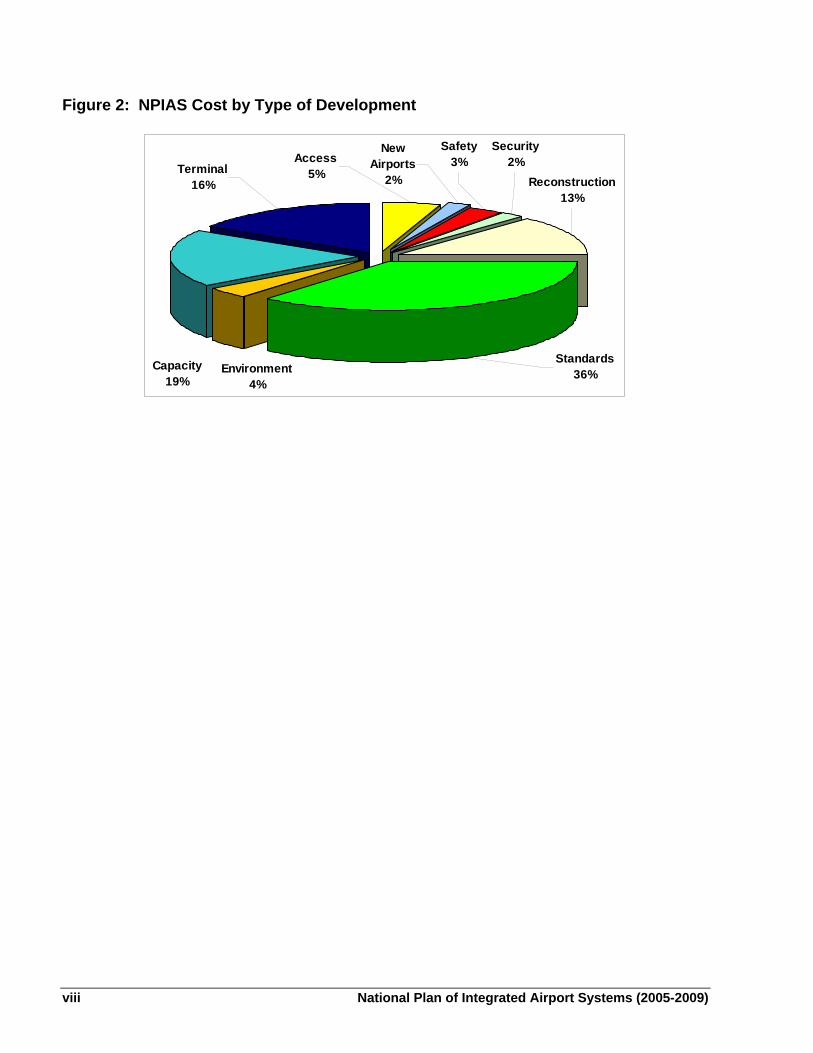
Figure 2: NPIAS Cost by Type of Development
Environment4%
Standards36%
Terminal16%
Capacity 19%
Reconstruction13%
Access5%
New Airports
2%
Safety3%
Security2%
viii National Plan of Integrated Airport Systems (2005-2009)
Chapter 1: System Composition OVERVIEW
The United States accounts for approximately 30 percent of all commercial aviation and 50 percent of all general aviation activity in the world. An extensive system of more than 19,500 airports throughout the United States has been developed to support this activity. A primary purpose of the NPIAS is to identify the airports that are important to national transportation and, therefore, eligible to receive grants under the AIP. The NPIAS is comprised of all commercial service airports, all reliever airports, and selected general aviation airports. It includes 3,344 of the 5,280 U.S. airports that are open to the public (Figure 3). Figure 3: Number of Airports by Ownership and Use
(January 2004)
19,576Total U.S. Airports
19,576Total U.S. Airports
5,280Open to Public
5,280Open to Public
14,296Closed to Public
14,296Closed to Public
4,177Public Owned
4,177Public Owned
3,388NPIAS Airports
3,388NPIAS Airports
3,344 Existing3,233 Public Owned111 Private Owned
3,344 Existing3,233 Public Owned111 Private Owned
44 Proposed44 Proposed
383Primary
383Primary
127Commercial
Service
127Commercial
Service
278Reliever
278Reliever
2,556GeneralAviation
2,556GeneralAviation
2 Primary
2 Primary
4 Commercial
Service
4 Commercial
Service
2 Reliever
2 Reliever
36General Aviation
36General Aviation
1,103Privately Owned
1,103Privately Owned
19,576Total U.S. Airports
19,576Total U.S. Airports
5,280Open to Public
5,280Open to Public
14,296Closed to Public
14,296Closed to Public
4,177Public Owned
4,177Public Owned
3,388NPIAS Airports
3,388NPIAS Airports
3,344 Existing3,233 Public Owned111 Private Owned
3,344 Existing3,233 Public Owned111 Private Owned
44 Proposed44 Proposed
383Primary
383Primary
127Commercial
Service
127Commercial
Service
278Reliever
278Reliever
2,556GeneralAviation
2,556GeneralAviation
2 Primary
2 Primary
4 Commercial
Service
4 Commercial
Service
2 Reliever
2 Reliever
36General Aviation
36General Aviation
1,103Privately Owned
1,103Privately Owned
National Plan of Integrated Airport Systems (2005-2009) 1
There are almost 2,000 public use airports that are not included in the NPIAS because they do not meet the minimum criteria, are located at inadequate sites, or cannot be expanded and improved to provide a safe and efficient airport. The word “airport” includes landing areas developed for conventional fixed wing aircraft, helicopters, and seaplanes. The NPIAS supports FAA and Department of Transportation (DOT) objectives for the air transportation system. U.S. DEPARTMENT OF TRANSPORTATION
The mission of the DOT is to ensure that the United States has a fast, safe, efficient, accessible, and convenient transportation system that meets our vital national interests and enhances the quality of life of the American people, today and into the future. Toward this end, the Department has five strategic goals:4
1. Safety: Promote the public health and safety by working toward the elimination of
transportation-related deaths, injuries, and property damage. 2. Mobility: Shape America’s future by ensuring a transportation system that is accessible,
integrated and efficient, and offers flexibility of choices. 3. Global Connectivity: Advance America’s economic growth and competitiveness
domestically and internationally through efficient and flexible transportation. 4. Environmental Stewardship: Protect and enhance communities and the natural environment
affected by transportation. 5. Organizational Excellence: Advance the Department’s ability to manage for results and
innovation.
FEDERAL AVIATION ADMINISTRATION
FAA supports the DOT strategic goals with four mission-based strategic goals:5
1. Safety: To achieve the lowest possible accident rate and constantly improve safety. There
are eight specific objectives within the safety goal. 2. Capacity: Work with local governments and airspace users to provide capacity in the
U.S. airspace system that meets projected demand in an environmentally sound manner. There are five specific objectives within the capacity goal.
4 U.S. Department of Transportation Strategic Plan 2003-2008 available online at:
http://www.dot.gov/stratplan2008/strategic_plan.htm 5 Federal Aviation Administration Flight Plan 2004-2008 available online at: http://www.faa.gov/aboutfaa/flightplan.cfm
2 National Plan of Integrated Airport Systems (2005-2009)
3. International Leadership: Increase the safety and capacity of the global civil aerospace system in an environmentally sound manner. There are two specific objectives within the international leadership goal.
4. Organizational Excellence: Ensure the success of the FAA’s mission through stronger
leadership, a better trained workforce, enhanced cost-control measures, and improved decision-making based on reliable data. There are three specific objectives within the organizational excellence goal.
FAA’S OFFICE OF AIRPORTS
Each organization within the FAA sets annual performance goals in support of the FAA and DOT strategic goals. The NPIAS and the AIP, by improving the safety, capacity, and condition of the airport system, contribute substantially to achieving the strategic goals as described in the FAA Flight Plan. Listed below are a few of the major goals that the Airports organization has set for FY 2004 and beyond:
Where practical, upgrade runway safety areas (RSA) to meet standards. Initiate 65 RSA
improvements in FY 2004 and the long-term goal is to have work initiated on improvements to all RSAs at Part 139 certificated airports where practicable by the end of FY 2007. (See Chapter 2 Safety section.)
Open up to nine new runways while increasing the annual service volume (ASV) of the
35 Operational Evaluation Plan (OEP) airports by at least one percent annually measured as a five year moving average through FY 2008. (See Chapter 2 Capacity section.)
Ensure that 93 percent of runways at airports in the NPIAS are maintained at good or fair
condition. (See Chapter 2 Runway Pavement Condition section.) Monitor, manage, and maintain milestones and completion dates to support efforts by large
primary airports to update master plans and complete environmental studies for major airport development at large primary airports including major new and regional airports (Ft. Lauderdale, Washington Dulles, Los Angeles, Philadelphia, Chicago O’Hare and South Suburban). Monthly reviews will be conducted to monitor the work. (See Chapter 2 Capacity section.)
Benefit an expected 75,000 people that live in residential communities in the DNL 65 dbA
or greater noise contour through AIP funding of noise compatibility projects in the six-year period of FY 2003 to FY 2008. (See Chapter 2 Aircraft Noise section.)
Reduce the number of runway incursions resulting from pedestrian and vehicle driver actions
from a FY 2000 to FY 2003 baseline of 65 to 62 or less in FY 2004. (See Chapter 2 Safety section.)
National Plan of Integrated Airport Systems (2005-2009) 3
GUIDING PRINCIPLES FOR THE NATIONAL AIRPORT SYSTEM
The airport system envisioned in the first National Airport Plan issued in 1946, when civil aviation was in its infancy, has been developed and nurtured by close cooperation between Federal, state, and local agencies. The general principles guiding Federal involvement have remained largely unchanged; the airport system should have the following attributes to meet the demand for air transportation:
Airports should be safe and efficient, located at optimum sites, and developed and maintained to appropriate standards.
Airports should be operated efficiently for both users and Government, relying primarily on
user fees and placing minimal burden on the general revenues of the local, state, and Federal governments.
Airports should be flexible and expandable, able to meet increased demand and to
accommodate new aircraft types, and to provide opportunities for competitive service.
Airports should be permanent, with assurance that they will remain open for aeronautical use over the long term.
Airports should be compatible with surrounding communities, maintaining a balance
between the needs of aviation and the requirements of residents in neighboring areas.
Airports should be developed in concert with improvements to the air traffic control system.
The airport system should support national objectives for defense, emergency readiness, and postal delivery.
The airport system should be extensive, providing as many people as possible with
convenient access to air transportation, typically not more than 20 miles of travel to the nearest NPIAS airport.
The airport system should help air transportation contribute to a productive national economy
and international competitiveness. In addition to these principles specific to airport development, a guiding principle for Federal infrastructure investment, as stated in Executive Order 12893, is that such investments must be cost beneficial. The FAA implements these principles by using program guidance to ensure the effective use of Federal aid. A national priority system guides the distribution of funds, supplemented when necessary by specific requirements for additional analysis or justification. For example, airport capacity development projects must be shown to be cost beneficial in order to receive high levels of support under the AIP.
4 National Plan of Integrated Airport Systems (2005-2009)
AIRPORTS INCLUDED IN NPIAS
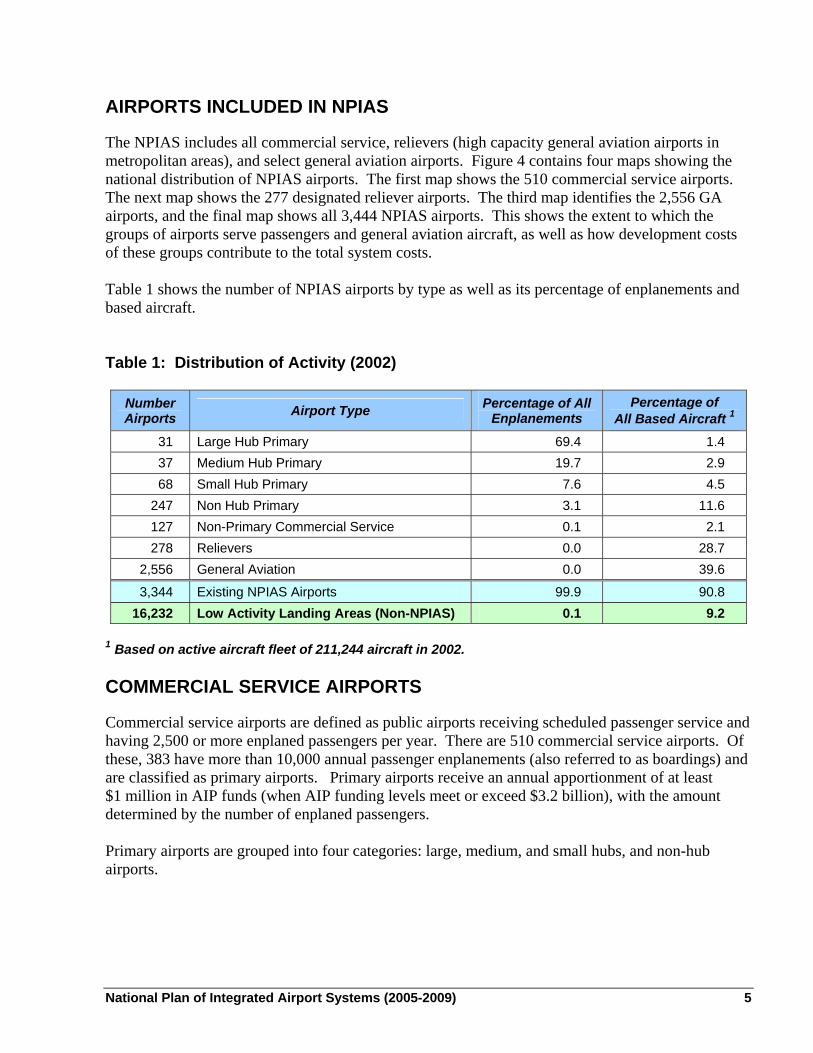
The NPIAS includes all commercial service, relievers (high capacity general aviation airports in metropolitan areas), and select general aviation airports. Figure 4 contains four maps showing the national distribution of NPIAS airports. The first map shows the 510 commercial service airports. The next map shows the 277 designated reliever airports. The third map identifies the 2,556 GA airports, and the final map shows all 3,444 NPIAS airports. This shows the extent to which the groups of airports serve passengers and general aviation aircraft, as well as how development costs of these groups contribute to the total system costs. Table 1 shows the number of NPIAS airports by type as well as its percentage of enplanements and based aircraft. Table 1: Distribution of Activity (2002)
Number Airports Airport Type Percentage of All
Enplanements Percentage of
All Based Aircraft 1
31 Large Hub Primary 69.4 1.4 37 Medium Hub Primary 19.7 2.9 68 Small Hub Primary 7.6 4.5
247 Non Hub Primary 3.1 11.6 127 Non-Primary Commercial Service 0.1 2.1 278 Relievers 0.0 28.7
2,556 General Aviation 0.0 39.6
3,344 Existing NPIAS Airports 99.9 90.8 16,232 Low Activity Landing Areas (Non-NPIAS) 0.1 9.2
1 Based on active aircraft fleet of 211,244 aircraft in 2002. COMMERCIAL SERVICE AIRPORTS
Commercial service airports are defined as public airports receiving scheduled passenger service and having 2,500 or more enplaned passengers per year. There are 510 commercial service airports. Of these, 383 have more than 10,000 annual passenger enplanements (also referred to as boardings) and are classified as primary airports. Primary airports receive an annual apportionment of at least $1 million in AIP funds (when AIP funding levels meet or exceed $3.2 billion), with the amount determined by the number of enplaned passengers. Primary airports are grouped into four categories: large, medium, and small hubs, and non-hub airports.
National Plan of Integrated Airport Systems (2005-2009) 5
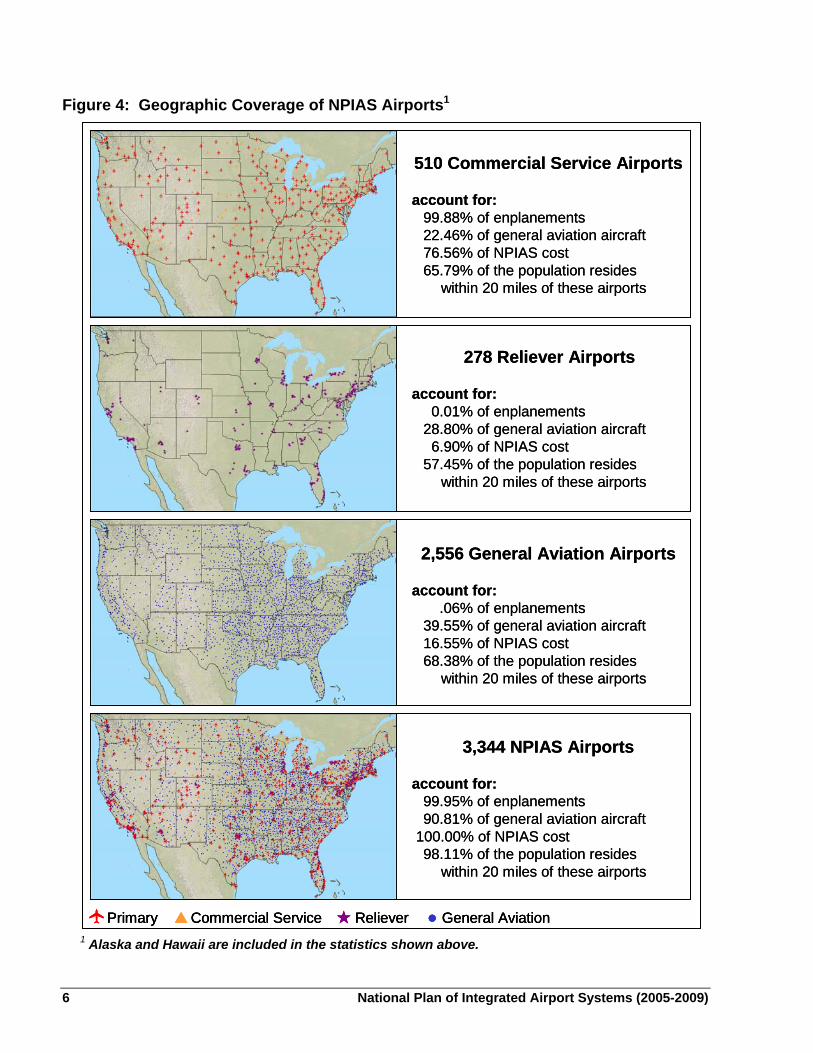
Figure 4: Geographic Coverage of NPIAS Airports1
Primary Commercial Service Reliever General Aviation
510 Commercial Service Airports
account for:99.88% of enplanements22.46% of general aviation aircraft76.56% of NPIAS cost65.79% of the population resides
within 20 miles of these airports
278 Reliever Airports
account for:0.01% of enplanements
28.80% of general aviation aircraft6.90% of NPIAS cost
57.45% of the population resides within 20 miles of these airports
2,556 General Aviation Airports
account for:.06% of enplanements
39.55% of general aviation aircraft16.55% of NPIAS cost68.38% of the population resides
within 20 miles of these airports
3,344 NPIAS Airports
account for:99.95% of enplanements90.81% of general aviation aircraft
100.00% of NPIAS cost98.11% of the population resides
within 20 miles of these airports
PriPrimary Commercial Service Reliever General Aviationmary Commercial Service Reliever General Aviation
510 Commercial Service Airports
account for:99.88% of enplanements22.46% of general aviation aircraft76.56% of NPIAS cost65.79% of the population resides
within 20 miles of these airports
278 Reliever Airports
account for:0.01% of enplanements
28.80% of general aviation aircraft6.90% of NPIAS cost
57.45% of the population resides within 20 miles of these airports
2,556 General Aviation Airports
account for:.06% of enplanements
39.55% of general aviation aircraft16.55% of NPIAS cost68.38% of the population resides
within 20 miles of these airports
3,344 NPIAS Airports
account for:99.95% of enplanements90.81% of general aviation aircraft
100.00% of NPIAS cost98.11% of the population resides
within 20 miles of these airports
1 Alaska and Hawaii are included in the statistics shown above.
6 National Plan of Integrated Airport Systems (2005-2009)
Large Hubs
The term “hub” is used by the FAA to identify very busy commercial service airports. For instance, large hubs are those airports that each account for at least one percent of total U.S. passenger enplanements.6 Some enplanements originate in the local community and some consist of connecting passengers transferring from one flight to another. Several large hub airports have little passenger transfer activity (Fort Lauderdale, Tampa, Boston, LaGuardia, Orlando International, and San Diego International, for example), while transfers account for more than half of the traffic at others (Cincinnati, Charlotte, Atlanta, Houston, Pittsburgh and Dallas-Ft. Worth, for example). Together the 31 large hub airports account for 70 percent of all passenger enplanements. Large hub airports tend to concentrate on airline passenger and freight operations and have limited general aviation activity. Five large hub airports (Salt Lake City, Honolulu, Las Vegas, Miami, and Phoenix) have an average of 340 general aviation based aircraft, but the other 26 large hubs average only 47 based aircraft each. Thus, locally based general aviation plays a relatively small role at most large hubs. The Nation’s air traffic delay problems are concentrated at 31 large hub airports where the average delay per aircraft operation was 6.3 minutes in 2002. Delays occur primarily during instrument weather conditions when runway capacity is reduced below that needed to accommodate airline traffic levels. Medium Hubs
Medium hubs are defined as airports that each account for between 0.25 percent and one percent of the total passenger enplanements. There are 37 medium hub airports, and together they account for 20 percent of all enplanements. Medium hub airports usually have sufficient capacity to accommodate air carrier operations and a substantial amount of general aviation activity. Medium hub airports have an average of 166 general aviation based aircraft. The delay per operation averaged four minutes at medium hub airports in 2002. Small Hubs
Small hubs are defined as airports that enplane 0.05 percent to 0.25 percent of the total passenger enplanements. There are 68 small hub airports that together account for eight percent of all enplanements. Less than 25 percent of the runway capacity at small hub airports is used by airline operations, so these airports can accommodate a great deal of general aviation activity, with an average of 138 based aircraft at each airport. These airports are typically uncongested and do not have significant air traffic delays. Non-Hub Primary
Commercial service airports that enplane less than 0.05 percent of all commercial passenger enplanements but more than 10,000 annual enplanements are categorized as non-hub primary
6 FAA’s use of the term hub airport is somewhat different than that of airlines, which use it to denote an airport with
significant connecting traffic by one or more carriers. The hub categories are defined in Section 40102 of Title 49 of the United States Code (2004).
National Plan of Integrated Airport Systems (2005-2009) 7
airports. There are 247 non-hub primary airports that together account for three percent of all enplanements. These airports are heavily used by general aviation aircraft, with an average of 99-based aircraft. Non-Primary Commercial Service
Commercial service airports that have from 2,500 to 10,000 annual passenger enplanements are categorized as non-primary commercial service airports. There are 127 of these airports in the NPIAS, and they account for 0.1 percent of all enplanements. These airports are used mainly by general aviation and have an average of 35-based aircraft. RELIEVER AIRPORTS
General aviation pilots often find it difficult and expensive to gain access to congested airports, particularly large and medium hub airports. In recognition of this, the FAA has encouraged the development of high capacity general aviation airports in major metropolitan areas. These specialized airports, called relievers, provide pilots with attractive alternatives to using congested hub airports. They also provide general aviation access to the surrounding area and must have 100 or more based aircraft or 25,000 annual itinerant operations. The 278-reliever airports have an average of 219-based aircraft, which is 29 percent of the Nation’s general aviation fleet. All airports that are designated as relievers by the FAA are included in the NPIAS. GENERAL AVIATION AIRPORTS
Communities that do not receive scheduled commercial service or that do not meet the criteria for classification as a commercial service airport may be included in the NPIAS as sites for general aviation airports if they account for enough activity (usually at least 10 locally based aircraft) and are at least 20 miles from the nearest NPIAS airport. The activity criterion may be relaxed for remote locations or other mitigating circumstances. The 2,556 general aviation airports in the NPIAS tend to be distributed on a one-per-county basis in rural areas and are often located near the county seat. These airports, with an average of 33-based aircraft, account for 40 percent of the Nation’s general aviation fleet. They are the most convenient source of air transportation for about 19 percent of the population and are particularly important to rural areas. NEW AIRPORTS
The NPIAS identifies 44 planned new airports over the next five years. There are 36 new general aviation airports (81 percent), 2 relievers (five percent), 4 commercial service airports (nine percent) that will replace existing commercial service airports (with 3 of the 4 planned airports in Alaska), and 2 primary airports (five percent). The two new primary airports are both in Utah and are replacing existing airports. Two communities are evaluating the need for an additional commercial service airport to serve the community (Peotone, IL and Las Vegas, NV). In addition, there are
8 National Plan of Integrated Airport Systems (2005-2009)
several studies underway by airport sponsors to examine the feasibility of replacing their existing airports (Panama City, FL; Bowling Green, KY; San Diego, CA; and Hazleton, PA). AIRPORTS NOT INCLUDED IN NPIAS
The NPIAS includes 3,344 of the 5,280 U.S. airports that are open to the public. There are 1,936 airports open to the public that are not included in the NPIAS. There are 944 publicly owned, public use airports that are not included because they do not meet the minimum criteria for the NPIAS of 10 based aircraft, are within 20 miles of a NPIAS airport, or are located at inadequate sites or cannot be expanded and improved to provide safe and efficient airport facilities. The FAA usually recommends replacement of inadequate airports. The remaining 992 airports are privately owned, public use airports that are not included because they are located at inadequate sites, are redundant to publicly owned airports, or have too little activity to qualify for inclusion. In addition, 14,296 civil landing areas that are not open to the general public are not included in the NPIAS. The airports that are not included in the NPIAS have an average of one based aircraft, compared to 33-based aircraft at the average NPIAS general aviation airport. STATE PLANS INCLUDE MORE AIRPORTS
Each state has an aviation system plan that determines the development needed to establish a viable system of airports. The effort involves examining the interaction of the airports with the aviation service requirements, economy, population, and surface transportation of a state’s geographic area. State plans are cost-effective and define an airport system that is consistent with established state goals and objectives regarding economic development, transportation, land use, and environmental matters. State plans contain over 6,000 airports, about 45 percent more than the NPIAS. Airports included in the state plans, but not in the NPIAS, are usually smaller airports that have state or regional significance, but are not considered to be of national interest.
National Plan of Integrated Airport Systems (2005-2009) 9

This page intentionally left blank.
10 National Plan of Integrated Airport Systems (2005-2009)
Chapter 2: System Performance OVERVIEW
The Federal role in airport development is largely concerned with optimizing system performance. The primary purpose of this chapter is to describe how well the airport system is operating and to highlight any trends that are apparent. Six key factors have been selected to gauge the level of system performance: capacity, safety, noise, pavement condition, surface accessibility, and financial performance. APPLYING THE SIX KEY FACTORS
Each of the six factors is relevant to the quality of air transportation and, taken together, they provide a good indication of system performance. The six factors are not equally sensitive to capital improvements, and increased investment is not necessarily the most effective way to improve performance. For instance, airport investment is only one of several measures that must be combined to reduce the already low rate of accidents. Communications, navigation, and surveillance systems, airport inspection, pilot training, avionics, human factors, and aircraft and engine technology also contribute to the gradual improvement of aviation safety. Federal aid to airports can be particularly useful in focusing on specific issues, such as the provision for aircraft rescue and fire fighting equipment, development of safety areas around runways, and removal of obstructions in runway approach zones. Noise problems can inhibit the ability to expand some capacity constrained airports. The principal factor in reducing the number of people exposed to high noise levels is the expanded use of quieter aircraft, and the Federal Government has actively encouraged new technology in this area. However, Federal aid is very useful in addressing problems that would otherwise persist despite the use of quieter aircraft. Federal aid for planning and implementing noise compatibility measures has fostered a more cooperative relationship between airports and surrounding communities, helping to relieve a serious and complex societal issue. A section on monitoring the performance of terminal buildings will be added to future reports, when a suitable monitoring technique is developed. The FAA is working with industry to develop suitable guidelines to assist in planning airport terminal buildings. However, a report is not possible at this time because there is no consensus about which aspects to measure and how to measure them. CAPACITY
The capacity of the airport system is affected by many factors, including the layout of individual airports, the manner in which airspace is organized and used, operating procedures, and application of technology.
National Plan of Integrated Airport Systems (2005-2009) 11
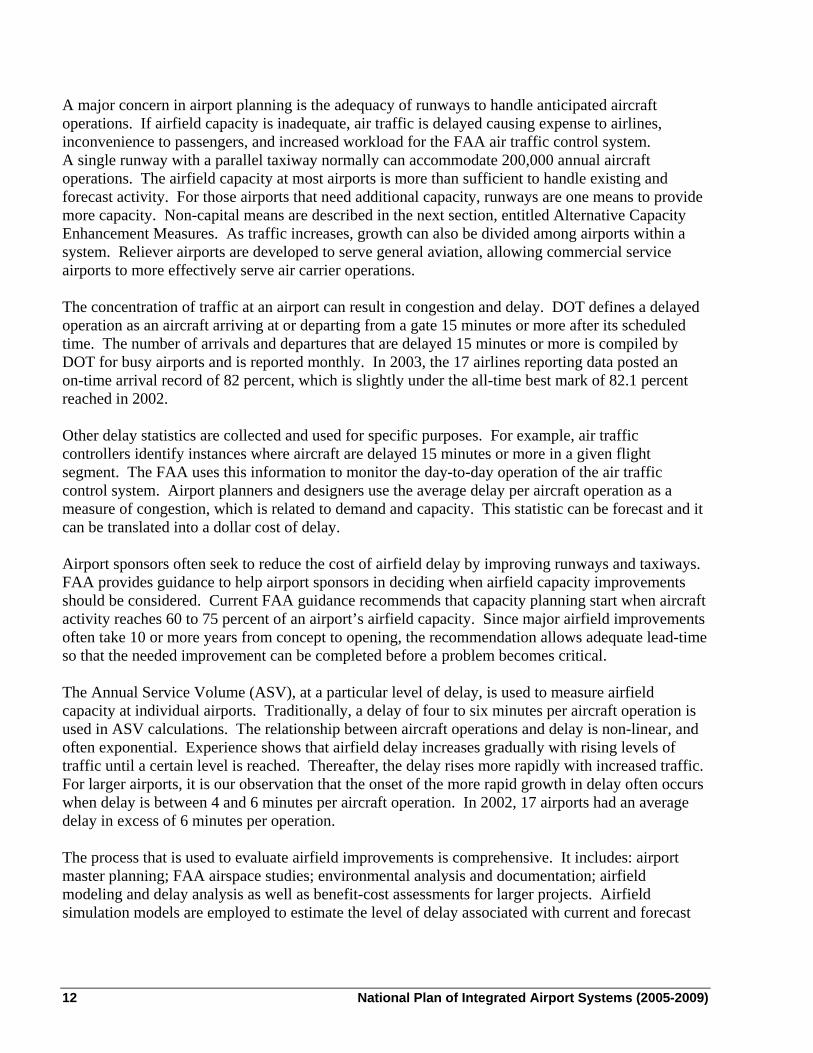
A major concern in airport planning is the adequacy of runways to handle anticipated aircraft operations. If airfield capacity is inadequate, air traffic is delayed causing expense to airlines, inconvenience to passengers, and increased workload for the FAA air traffic control system. A single runway with a parallel taxiway normally can accommodate 200,000 annual aircraft operations. The airfield capacity at most airports is more than sufficient to handle existing and forecast activity. For those airports that need additional capacity, runways are one means to provide more capacity. Non-capital means are described in the next section, entitled Alternative Capacity Enhancement Measures. As traffic increases, growth can also be divided among airports within a system. Reliever airports are developed to serve general aviation, allowing commercial service airports to more effectively serve air carrier operations. The concentration of traffic at an airport can result in congestion and delay. DOT defines a delayed operation as an aircraft arriving at or departing from a gate 15 minutes or more after its scheduled time. The number of arrivals and departures that are delayed 15 minutes or more is compiled by DOT for busy airports and is reported monthly. In 2003, the 17 airlines reporting data posted an on-time arrival record of 82 percent, which is slightly under the all-time best mark of 82.1 percent reached in 2002. Other delay statistics are collected and used for specific purposes. For example, air traffic controllers identify instances where aircraft are delayed 15 minutes or more in a given flight segment. The FAA uses this information to monitor the day-to-day operation of the air traffic control system. Airport planners and designers use the average delay per aircraft operation as a measure of congestion, which is related to demand and capacity. This statistic can be forecast and it can be translated into a dollar cost of delay. Airport sponsors often seek to reduce the cost of airfield delay by improving runways and taxiways. FAA provides guidance to help airport sponsors in deciding when airfield capacity improvements should be considered. Current FAA guidance recommends that capacity planning start when aircraft activity reaches 60 to 75 percent of an airport’s airfield capacity. Since major airfield improvements often take 10 or more years from concept to opening, the recommendation allows adequate lead-time so that the needed improvement can be completed before a problem becomes critical. The Annual Service Volume (ASV), at a particular level of delay, is used to measure airfield capacity at individual airports. Traditionally, a delay of four to six minutes per aircraft operation is used in ASV calculations. The relationship between aircraft operations and delay is non-linear, and often exponential. Experience shows that airfield delay increases gradually with rising levels of traffic until a certain level is reached. Thereafter, the delay rises more rapidly with increased traffic. For larger airports, it is our observation that the onset of the more rapid growth in delay often occurs when delay is between 4 and 6 minutes per aircraft operation. In 2002, 17 airports had an average delay in excess of 6 minutes per operation. The process that is used to evaluate airfield improvements is comprehensive. It includes: airport master planning; FAA airspace studies; environmental analysis and documentation; airfield modeling and delay analysis as well as benefit-cost assessments for larger projects. Airfield simulation models are employed to estimate the level of delay associated with current and forecast
12 National Plan of Integrated Airport Systems (2005-2009)
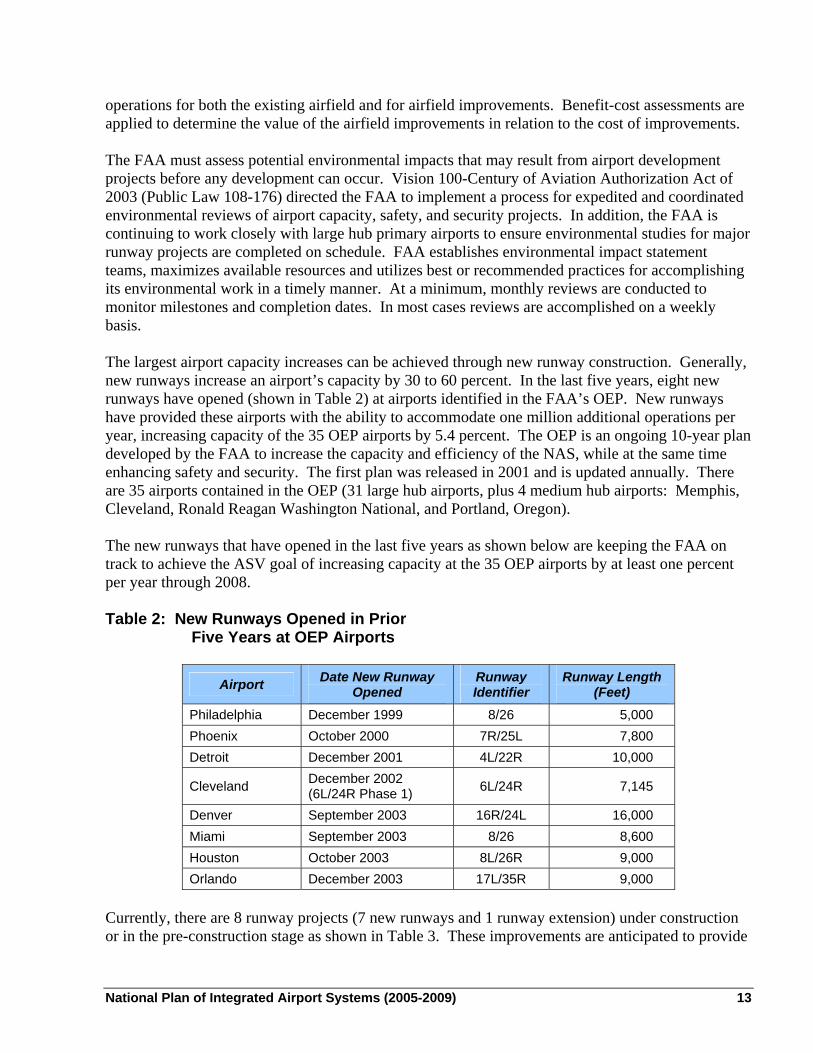
operations for both the existing airfield and for airfield improvements. Benefit-cost assessments are applied to determine the value of the airfield improvements in relation to the cost of improvements. The FAA must assess potential environmental impacts that may result from airport development projects before any development can occur. Vision 100-Century of Aviation Authorization Act of 2003 (Public Law 108-176) directed the FAA to implement a process for expedited and coordinated environmental reviews of airport capacity, safety, and security projects. In addition, the FAA is continuing to work closely with large hub primary airports to ensure environmental studies for major runway projects are completed on schedule. FAA establishes environmental impact statement teams, maximizes available resources and utilizes best or recommended practices for accomplishing its environmental work in a timely manner. At a minimum, monthly reviews are conducted to monitor milestones and completion dates. In most cases reviews are accomplished on a weekly basis. The largest airport capacity increases can be achieved through new runway construction. Generally, new runways increase an airport’s capacity by 30 to 60 percent. In the last five years, eight new runways have opened (shown in Table 2) at airports identified in the FAA’s OEP. New runways have provided these airports with the ability to accommodate one million additional operations per year, increasing capacity of the 35 OEP airports by 5.4 percent. The OEP is an ongoing 10-year plan developed by the FAA to increase the capacity and efficiency of the NAS, while at the same time enhancing safety and security. The first plan was released in 2001 and is updated annually. There are 35 airports contained in the OEP (31 large hub airports, plus 4 medium hub airports: Memphis, Cleveland, Ronald Reagan Washington National, and Portland, Oregon). The new runways that have opened in the last five years as shown below are keeping the FAA on track to achieve the ASV goal of increasing capacity at the 35 OEP airports by at least one percent per year through 2008. Table 2: New Runways Opened in Prior
Five Years at OEP Airports
Airport Date New Runway Opened
Runway Identifier
Runway Length (Feet)
Philadelphia December 1999 8/26 5,000 Phoenix October 2000 7R/25L 7,800 Detroit December 2001 4L/22R 10,000
Cleveland December 2002 (6L/24R Phase 1) 6L/24R 7,145
Denver September 2003 16R/24L 16,000 Miami September 2003 8/26 8,600 Houston October 2003 8L/26R 9,000 Orlando December 2003 17L/35R 9,000
Currently, there are 8 runway projects (7 new runways and 1 runway extension) under construction or in the pre-construction stage as shown in Table 3. These improvements are anticipated to provide
National Plan of Integrated Airport Systems (2005-2009) 13
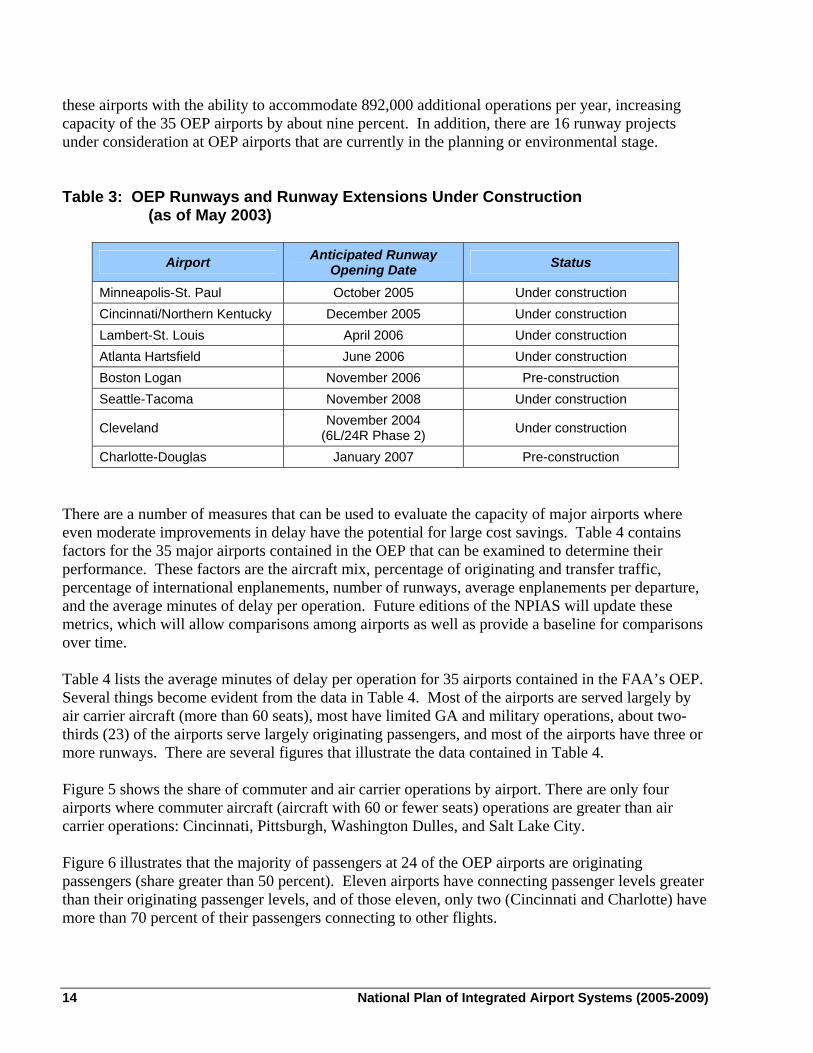
these airports with the ability to accommodate 892,000 additional operations per year, increasing capacity of the 35 OEP airports by about nine percent. In addition, there are 16 runway projects under consideration at OEP airports that are currently in the planning or environmental stage. Table 3: OEP Runways and Runway Extensions Under Construction
(as of May 2003)
Airport Anticipated Runway Opening Date Status
Minneapolis-St. Paul October 2005 Under construction Cincinnati/Northern Kentucky December 2005 Under construction Lambert-St. Louis April 2006 Under construction Atlanta Hartsfield June 2006 Under construction Boston Logan November 2006 Pre-construction Seattle-Tacoma November 2008 Under construction
Cleveland November 2004 (6L/24R Phase 2) Under construction
Charlotte-Douglas January 2007 Pre-construction There are a number of measures that can be used to evaluate the capacity of major airports where even moderate improvements in delay have the potential for large cost savings. Table 4 contains factors for the 35 major airports contained in the OEP that can be examined to determine their performance. These factors are the aircraft mix, percentage of originating and transfer traffic, percentage of international enplanements, number of runways, average enplanements per departure, and the average minutes of delay per operation. Future editions of the NPIAS will update these metrics, which will allow comparisons among airports as well as provide a baseline for comparisons over time. Table 4 lists the average minutes of delay per operation for 35 airports contained in the FAA’s OEP. Several things become evident from the data in Table 4. Most of the airports are served largely by air carrier aircraft (more than 60 seats), most have limited GA and military operations, about two-thirds (23) of the airports serve largely originating passengers, and most of the airports have three or more runways. There are several figures that illustrate the data contained in Table 4. Figure 5 shows the share of commuter and air carrier operations by airport. There are only four airports where commuter aircraft (aircraft with 60 or fewer seats) operations are greater than air carrier operations: Cincinnati, Pittsburgh, Washington Dulles, and Salt Lake City. Figure 6 illustrates that the majority of passengers at 24 of the OEP airports are originating passengers (share greater than 50 percent). Eleven airports have connecting passenger levels greater than their originating passenger levels, and of those eleven, only two (Cincinnati and Charlotte) have more than 70 percent of their passengers connecting to other flights.
14 National Plan of Integrated Airport Systems (2005-2009)
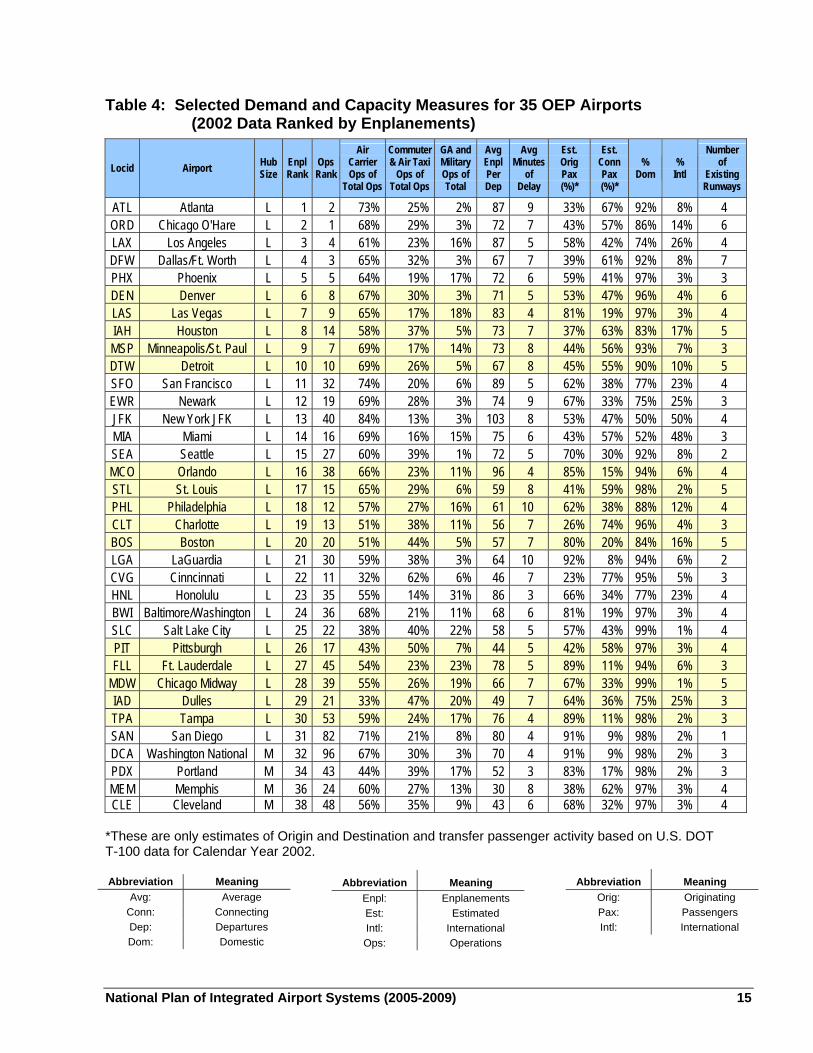
Table 4: Selected Demand and Capacity Measures for 35 OEP Airports (2002 Data Ranked by Enplanements)
*These are only estimates of Origin and Destination and transfer passenger activity based on U.S. DOT T-100 data for Calendar Year 2002. Abbreviation Meaning
Avg: Average Conn: Connecting Dep: Departures Dom: Domestic
Locid Airport Hub Size
Enpl Rank
Ops Rank
Air Carrier Ops of
Total Ops
Commuter & Air Taxi
Ops of Total Ops
GA and Military Ops of Total
Avg Enpl Per Dep
Avg Minutes
of Delay
Est. Orig Pax (%)*
Est. Conn Pax (%)*
% Dom
% Intl
Number of
Existing Runways
ATL Atlanta L 1 2 73% 25% 2% 87 9 33% 67% 92% 8% 4 ORD Chicago O'Hare L 2 1 68% 29% 3% 72 7 43% 57% 86% 14% 6 LAX Los Angeles L 3 4 61% 23% 16% 87 5 58% 42% 74% 26% 4 DFW Dallas/Ft. Worth L 4 3 65% 32% 3% 67 7 39% 61% 92% 8% 7 PHX Phoenix L 5 5 64% 19% 17% 72 6 59% 41% 97% 3% 3 DEN Denver L 6 8 67% 30% 3% 71 5 53% 47% 96% 4% 6 LAS Las Vegas L 7 9 65% 17% 18% 83 4 81% 19% 97% 3% 4 IAH Houston L 8 14 58% 37% 5% 73 7 37% 63% 83% 17% 5 MSP Minneapolis/St. Paul L 9 7 69% 17% 14% 73 8 44% 56% 93% 7% 3 DTW Detroit L 10 10 69% 26% 5% 67 8 45% 55% 90% 10% 5 SFO San Francisco L 11 32 74% 20% 6% 89 5 62% 38% 77% 23% 4 EWR Newark L 12 19 69% 28% 3% 74 9 67% 33% 75% 25% 3 JFK New York JFK L 13 40 84% 13% 3% 103 8 53% 47% 50% 50% 4 MIA Miami L 14 16 69% 16% 15% 75 6 43% 57% 52% 48% 3 SEA Seattle L 15 27 60% 39% 1% 72 5 70% 30% 92% 8% 2 MCO Orlando L 16 38 66% 23% 11% 96 4 85% 15% 94% 6% 4 STL St. Louis L 17 15 65% 29% 6% 59 8 41% 59% 98% 2% 5 PHL Philadelphia L 18 12 57% 27% 16% 61 10 62% 38% 88% 12% 4 CLT Charlotte L 19 13 51% 38% 11% 56 7 26% 74% 96% 4% 3 BOS Boston L 20 20 51% 44% 5% 57 7 80% 20% 84% 16% 5 LGA LaGuardia L 21 30 59% 38% 3% 64 10 92% 8% 94% 6% 2 CVG Cinncinnati L 22 11 32% 62% 6% 46 7 23% 77% 95% 5% 3 HNL Honolulu L 23 35 55% 14% 31% 86 3 66% 34% 77% 23% 4 BWI Baltimore/Washington L 24 36 68% 21% 11% 68 6 81% 19% 97% 3% 4 SLC Salt Lake City L 25 22 38% 40% 22% 58 5 57% 43% 99% 1% 4 PIT Pittsburgh L 26 17 43% 50% 7% 44 5 42% 58% 97% 3% 4 FLL Ft. Lauderdale L 27 45 54% 23% 23% 78 5 89% 11% 94% 6% 3
MDW Chicago Midway L 28 39 55% 26% 19% 66 7 67% 33% 99% 1% 5 IAD Dulles L 29 21 33% 47% 20% 49 7 64% 36% 75% 25% 3 TPA Tampa L 30 53 59% 24% 17% 76 4 89% 11% 98% 2% 3 SAN San Diego L 31 82 71% 21% 8% 80 4 91% 9% 98% 2% 1 DCA Washington National M 32 96 67% 30% 3% 70 4 91% 9% 98% 2% 3 PDX Portland M 34 43 44% 39% 17% 52 3 83% 17% 98% 2% 3 MEM Memphis M 36 24 60% 27% 13% 30 8 38% 62% 97% 3% 4 CLE Cleveland M 38 48 56% 35% 9% 43 6 68% 32% 97% 3% 4
Abbreviation Meaning Enpl: Enplanements Est: Estimated Intl: International Ops: Operations
Abbreviation Meaning Orig: Originating Pax: Passengers Intl: International
National Plan of Integrated Airport Systems (2005-2009) 15
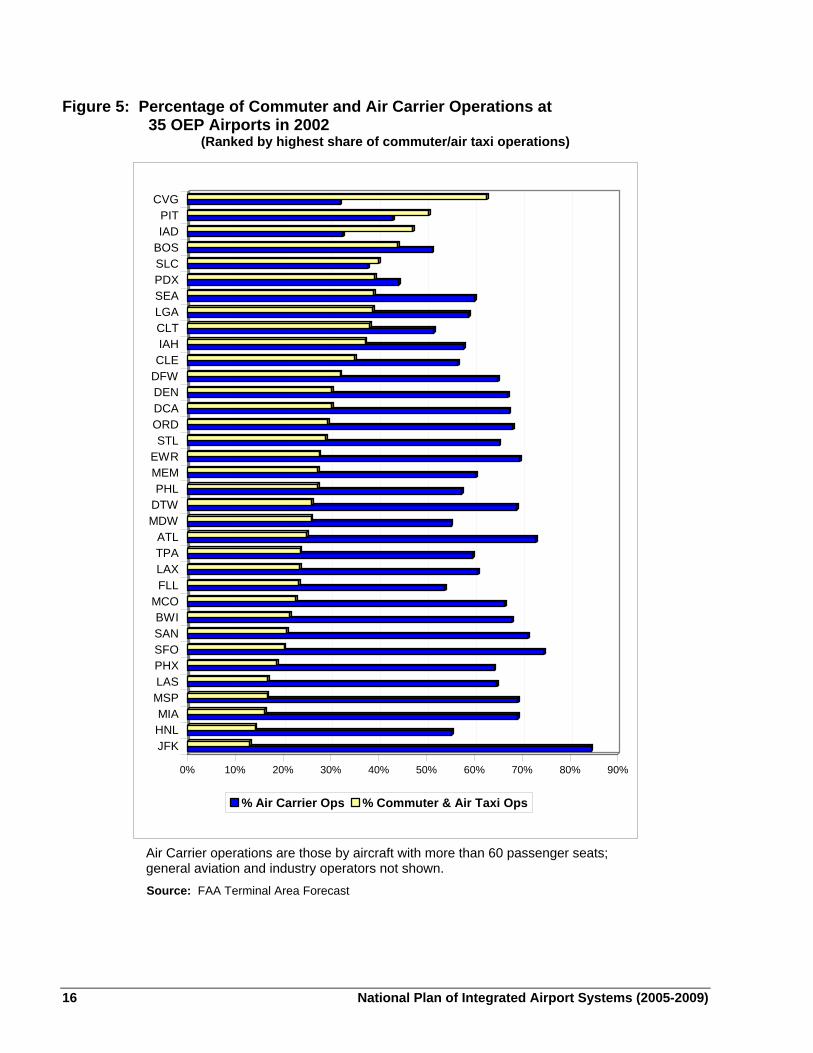
Figure 5: Percentage of Commuter and Air Carrier Operations at 35 OEP Airports in 2002
(Ranked by highest share of commuter/air taxi operations)
0% 10% 20% 30% 40% 50% 60% 70% 80% 90%
JFKHNLMIA
MSPLASPHXSFOSANBWI
MCOFLLLAXTPAATL
MDWDTWPHL
MEMEWR
STLORDDCADENDFWCLEIAHCLTLGASEAPDXSLCBOSIADPIT
CVG
% Air Carrier Ops % Commuter & Air Taxi Ops
Air Carrier operations are those by aircraft with more than 60 passenger seats; general aviation and industry operators not shown. Source: FAA Terminal Area Forecast
16 National Plan of Integrated Airport Systems (2005-2009)
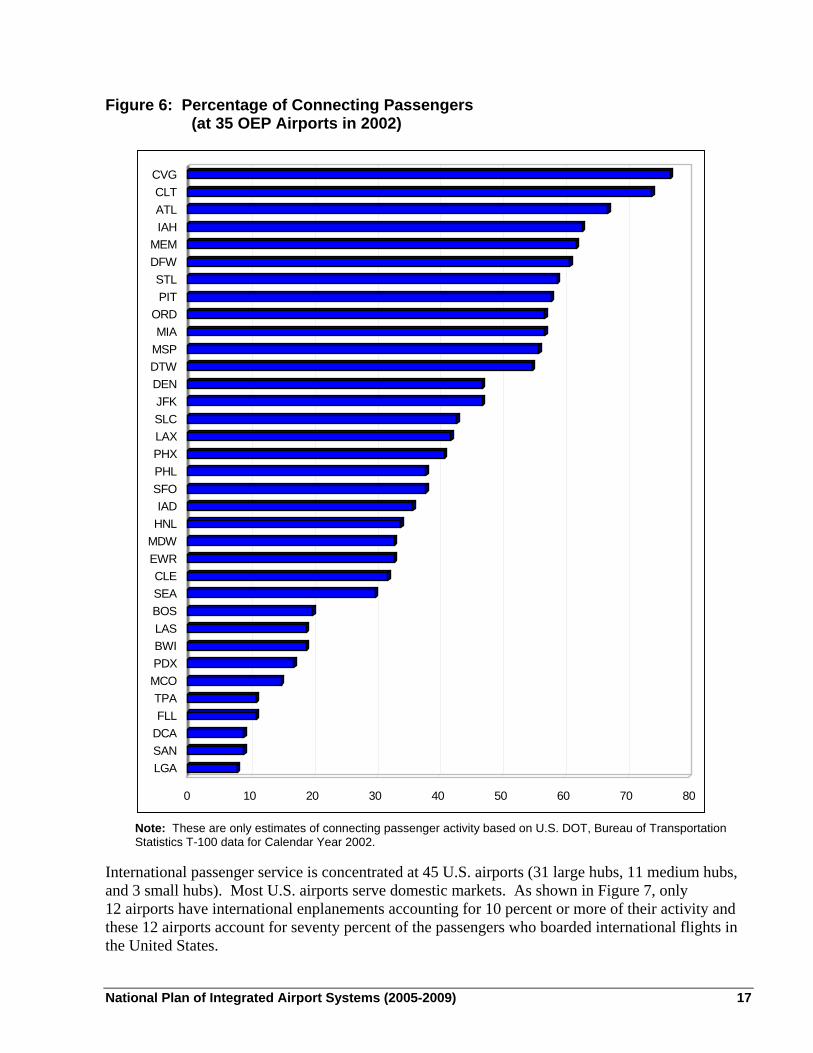
Figure 6: Percentage of Connecting Passengers (at 35 OEP Airports in 2002)
Note: These are only estimates of connecting passenger activity based on U.S. DOT, Bureau of Transportation Statistics T-100 data for Calendar Year 2002.
0 10 20 30 40 50 60 70 8
LGASANDCAFLLTPA
MCOPDXBWILASBOSSEACLE
EWRMDWHNLIAD
SFOPHLPHXLAXSLCJFK
DENDTWMSPMIA
ORDPITSTL
DFWMEM
IAHATLCLTCVG
0
International passenger service is concentrated at 45 U.S. airports (31 large hubs, 11 medium hubs, and 3 small hubs). Most U.S. airports serve domestic markets. As shown in Figure 7, only 12 airports have international enplanements accounting for 10 percent or more of their activity and these 12 airports account for seventy percent of the passengers who boarded international flights in the United States.
National Plan of Integrated Airport Systems (2005-2009) 17
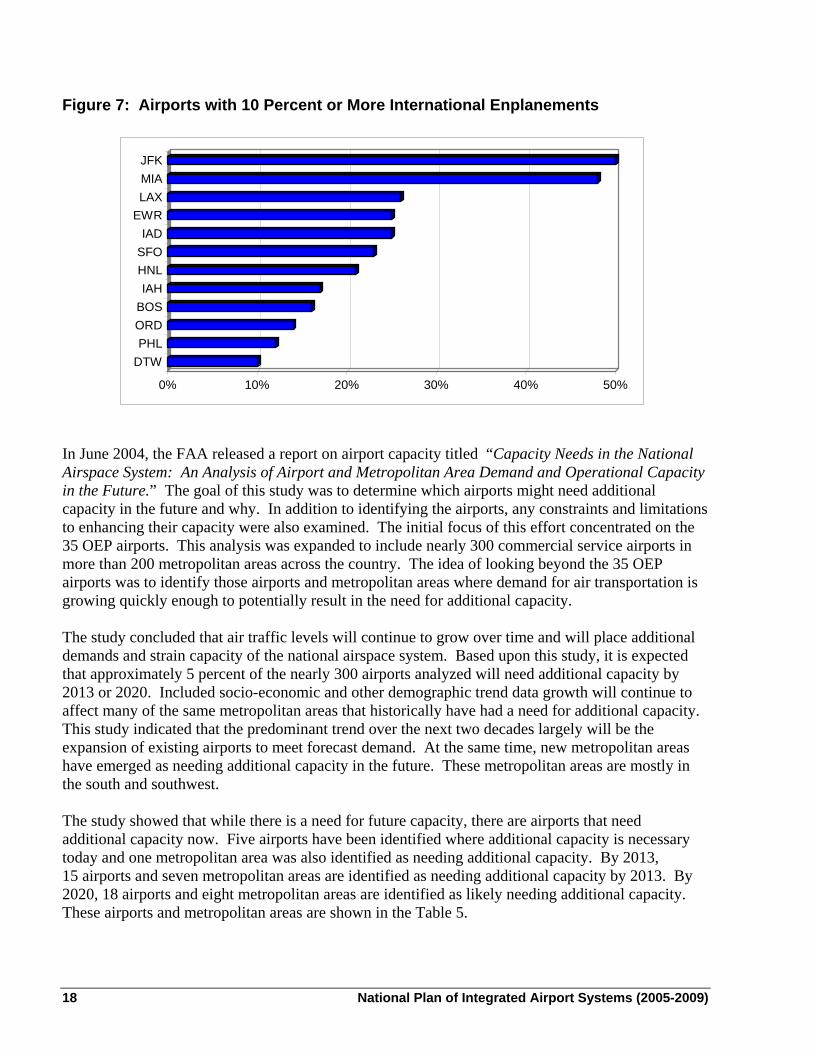
Figure 7: Airports with 10 Percent or More International Enplanements
0% 10% 20% 30% 40% 50%
DTWPHL
ORDBOSIAH
HNLSFOIAD
EWRLAXMIAJFK
In June 2004, the FAA released a report on airport capacity titled “Capacity Needs in the National Airspace System: An Analysis of Airport and Metropolitan Area Demand and Operational Capacity in the Future.” The goal of this study was to determine which airports might need additional capacity in the future and why. In addition to identifying the airports, any constraints and limitations to enhancing their capacity were also examined. The initial focus of this effort concentrated on the 35 OEP airports. This analysis was expanded to include nearly 300 commercial service airports in more than 200 metropolitan areas across the country. The idea of looking beyond the 35 OEP airports was to identify those airports and metropolitan areas where demand for air transportation is growing quickly enough to potentially result in the need for additional capacity. The study concluded that air traffic levels will continue to grow over time and will place additional demands and strain capacity of the national airspace system. Based upon this study, it is expected that approximately 5 percent of the nearly 300 airports analyzed will need additional capacity by 2013 or 2020. Included socio-economic and other demographic trend data growth will continue to affect many of the same metropolitan areas that historically have had a need for additional capacity. This study indicated that the predominant trend over the next two decades largely will be the expansion of existing airports to meet forecast demand. At the same time, new metropolitan areas have emerged as needing additional capacity in the future. These metropolitan areas are mostly in the south and southwest. The study showed that while there is a need for future capacity, there are airports that need additional capacity now. Five airports have been identified where additional capacity is necessary today and one metropolitan area was also identified as needing additional capacity. By 2013, 15 airports and seven metropolitan areas are identified as needing additional capacity by 2013. By 2020, 18 airports and eight metropolitan areas are identified as likely needing additional capacity. These airports and metropolitan areas are shown in the Table 5.
18 National Plan of Integrated Airport Systems (2005-2009)
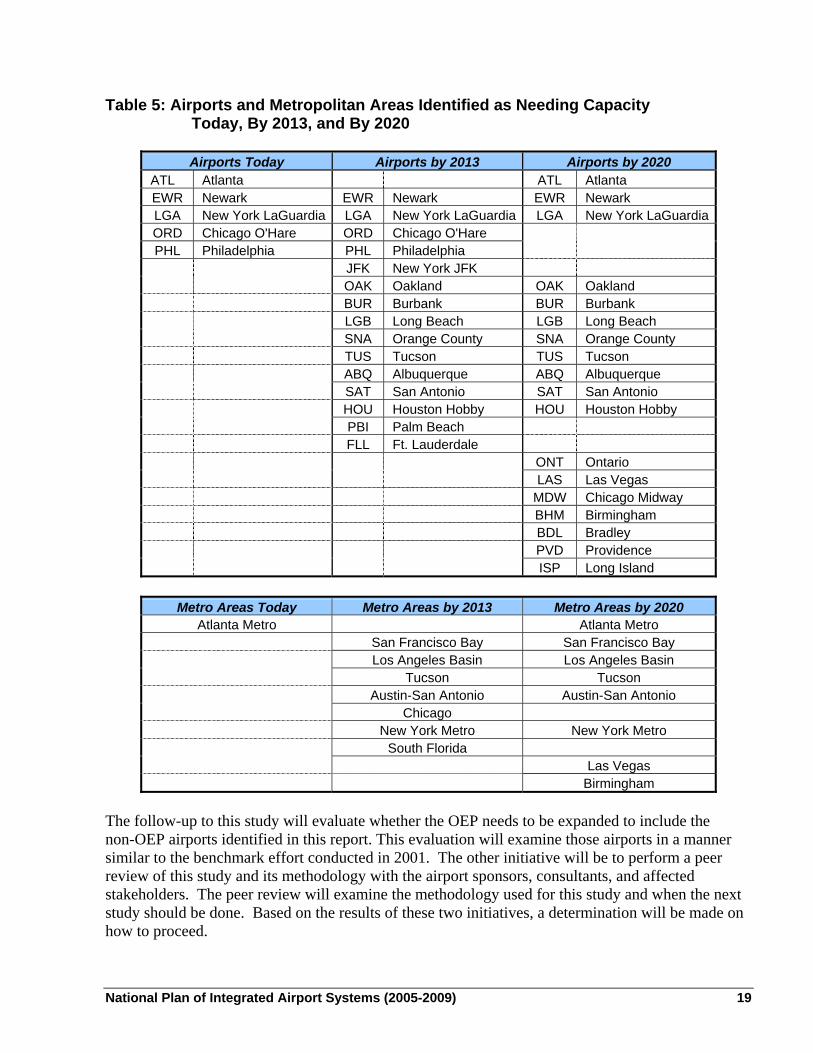
Table 5: Airports and Metropolitan Areas Identified as Needing Capacity Today, By 2013, and By 2020
Airports Today Airports by 2013 Airports by 2020
ATL Atlanta ATL Atlanta EWR Newark EWR Newark EWR Newark LGA New York LaGuardia LGA New York LaGuardia LGA New York LaGuardiaORD Chicago O'Hare ORD Chicago O'Hare PHL Philadelphia PHL Philadelphia
JFK New York JFK OAK Oakland OAK Oakland BUR Burbank BUR Burbank LGB Long Beach LGB Long Beach SNA Orange County SNA Orange County TUS Tucson TUS Tucson ABQ Albuquerque ABQ Albuquerque SAT San Antonio SAT San Antonio HOU Houston Hobby HOU Houston Hobby PBI Palm Beach FLL Ft. Lauderdale ONT Ontario LAS Las Vegas MDW Chicago Midway BHM Birmingham BDL Bradley PVD Providence ISP Long Island
Metro Areas Today Metro Areas by 2013 Metro Areas by 2020
Atlanta Metro Atlanta Metro San Francisco Bay San Francisco Bay Los Angeles Basin Los Angeles Basin Tucson Tucson Austin-San Antonio Austin-San Antonio Chicago New York Metro New York Metro South Florida Las Vegas Birmingham
The follow-up to this study will evaluate whether the OEP needs to be expanded to include the non-OEP airports identified in this report. This evaluation will examine those airports in a manner similar to the benchmark effort conducted in 2001. The other initiative will be to perform a peer review of this study and its methodology with the airport sponsors, consultants, and affected stakeholders. The peer review will examine the methodology used for this study and when the next study should be done. Based on the results of these two initiatives, a determination will be made on how to proceed.
National Plan of Integrated Airport Systems (2005-2009) 19
Alternative Capacity Enhancement Measures
The construction of new runways is not the only response to airfield congestion. The continued application of certain measures, termed Alternative Capacity Enhancement Measures, can help to limit delay without substantial investment. A combination of air traffic procedures, new technologies, improved airspace design, surface traffic management, and decision support tools are proposed to make better use of existing runways. Procedures will be evaluated for crossing runway configurations at a number of the busiest airports. Terminal airspace redesigns, planned for many of the busiest airports and metropolitan areas are aimed at improving the transition of arrivals and departures. Traffic management advisory tools, which help in managing the arrival stream, will become operational at four sites. Surface management systems are being explored for operational use later in the decade. Delays can be reduced, in part, by modifying air traffic control procedures to improve the flow of aircraft en route and in the terminal area. Airspace design changes are being made to fit sectors to the traffic demand, and to establish more effective airspace structures in the long run. Long-term goals for operational procedures focus on free flight, in which air traffic controllers will intervene only to prevent conflicts. The FAA is developing new instrument approach procedures that will enhance runway capacity during adverse weather. A new safety and capacity program is expected to facilitate aircraft taxiing in very low visibility weather conditions. Over the next two decades, the FAA expects additional enhancements due to advances in technology related to automation information systems, communications, navigation, surveillance, and weather. In January 2004, to alleviate the growing delay problems at Chicago O’Hare, the FAA and DOT secured an agreement between United and American, the two largest airlines serving O’Hare, to cut their operations during peak hours at O’Hare by five percent (62 scheduled flights) for six months. In August 2004, after holding a newly-authorized schedule reduction meeting, agreements for six months, effective November 1, 2004, limiting scheduled operations at Chicago O’Hare were reached by FAA and DOT with the 12 scheduled airlines serving O’Hare. This agreement requires United and American to reschedule and reduce flight arrivals by 5 percent (37 scheduled arrivals during peak hours), freezes the level of arrivals operated by other large incumbents, and permits a small number of additional flights by limited incumbents and new unscheduled arrivals to accommodate military, GA, cargo, and charter operations. In announcing these agreements, both DOT and FAA emphasized that the restriction of services is not an acceptable long-term solution to congestion. The City of Chicago currently has planning and environmental studies underway to examine the reconfiguration of the airfield at O’Hare to increase capacity and reduce delay. As a result of the congestion and delay that occurred in 2000, some airlines began to de-peak flight operations at their hub airports to reduce costs and increase efficiency. De-peaking smoothes out arrival and departure banks that concentrate airport operations into short time periods, increasing costs and leaving airlines susceptible to flight delays. The drop in demand for air travel over the last two years, higher fuel prices, and increased availability of lower fares on other airlines has impacted legacy network air carriers particularly hard. Legacy carriers are now seeking to restructure by reducing operating costs, grounding some
20 National Plan of Integrated Airport Systems (2005-2009)
larger aircraft, and deploying more regional jets in order to compete profitably with the low cost carriers. In fact, some airlines (United with Ted and Delta with Song) have established a low-cost airline within their legacy airline. They have also reduced seating capacity by changing the mix of aircraft types, reducing flights by mainline jets and turboprop aircraft, and increasing flights by regional jet aircraft. Some airlines have also downsized or closed hubs, redirecting capacity to their core or primary hubs. Redistribution of traffic among airports to make more efficient use of facilities is another measure that can be used to reduce delays. Reliever airports have been developed in metropolitan areas to provide general aviation pilots an attractive alternative to congested commercial service airports. Large metropolitan areas usually have a system of reliever airports, one or more of which can accommodate corporate jet aircraft and others designed for use by smaller, propeller-driven aircraft. Relievers have been very successful at relocating general aviation activity from congested airports. As a result, general aviation activity at congested airports is a small and decreasing percentage of total operations (two percent of operations at Atlanta Hartsfield, three percent at LaGuardia Airport, three percent of operations at John F. Kennedy Airport, and three percent at Chicago O’Hare Airport). Another factor that helps to limit delay is the ability of carriers to introduce service to outlying, suburban airports, using them to relieve congestion at the principal airport. This regional approach is particularly effective in very large cities that are the origin or destination point for many trips by air, such as Boston, Washington, San Francisco, Los Angeles, and New York. Also, low cost carriers have begun serving alternative airports in metropolitan areas and providing competition to carriers at the principal airport. Traffic has increased significantly at the alternative airports that attracted low cost carriers. Examples include Boston (Manchester and Providence); Washington (Baltimore-Washington); San Francisco (Oakland, San Jose, and Sacramento); Miami (Ft. Lauderdale); Chicago (Midway); and Los Angeles (Long Beach, Burbank, Ontario, and Orange County). Demand management is a broad term that includes a number of policies that are designed to reduce congestion and delay. One demand management policy is the imposition of peak/off-peak period landing fees. Such fees may encourage air carriers to use larger aircraft in peak periods or to shift flights to off-peak hours, both of which would reduce congestion. At many airports, especially those located in major urban areas, adding substantial amounts of new capacity is not possible. Properly structured landing/takeoff fees may encourage the more efficient use of scarce airport capacity. As one of several ways of alleviating airport congestion, the FAA and DOT are exploring the potential role of this and other demand management policies. In the past, the use of larger aircraft, particularly at congested airports, in order to move more passengers per operation, increased runway efficiency. However, recent trends suggest that traditional large carriers are using regional jets (RJs) to replace or supplement mainline routes served by narrow body aircraft. These aircraft are being used to improve the airline profitability in thin to medium density markets while maintaining frequency of service but reducing seat capacity. As a result, regional airlines have increased their share of passengers from 5.5 percent in 2000 to more than seven percent in 2003. This increase in RJ activity has the potential to aggravate airspace and airfield congestion. RJs use the same runways as larger jets however, they climb and descend more
National Plan of Integrated Airport Systems (2005-2009) 21
slowly than large jets and carry fewer passengers. Also, RJs have an impact on airport terminal facilities. They have a lower sill height than larger aircraft so loading bridges will have to be modified or retrofitted, which generally requires an extension of the bridge into the apron area. SAFETY
The United States has the largest, most complex, and safest aviation system in the world. The fatal accident rate for commercial airlines, on average, for the last three years is .022 per 100,000 departures. This is the lowest this three-year average rate has ever been. Figure 8 shows the trend in air carrier and general aviation accident rates. The operators of public airports maintain a high level of safety by selecting the best available sites, designing airfields to meet standards, and applying appropriate operating and maintenance procedures. Most accidents on or near airports are attributable to pilot error, such as failure to perform adequate preflight preparation and inspection of aircraft, or failure to achieve and maintain adequate airspeed. Airports, occasionally, are cited as a contributing factor in accidents. When they are, it is often in conjunction with weather conditions, such as when snow, ice, or water is on the runway. These factors are being alleviated by pavement surface treatments to enhance friction and improve aircraft braking performance, by the use of improved snow removal equipment, and by emphasis on measures to detect and correct slippery runway conditions. Because so few accidents are attributable to airport deficiencies, it has not been possible to develop a statistically significant relationship between improved safety and capital investment in airports. However, the success of airports in not becoming a link in the chain of events or circumstances that lead to an accident or contribute to its severity can be attributed to their adherence to Federal standards for design and operation. These standards, which have been developed over time, provide the necessary dimensions or procedures to accommodate aircraft operations along with an extra margin of safety to accommodate deviations from the norm. For example, the standards for runway safety areas are designed to minimize damage to aircraft and injuries to occupants when an aircraft unintentionally leaves the runway. The standards provide for graded areas contiguous to the runway edges that are free of ruts, humps, and other surface irregularities. Only objects required to be there because of their function, such as runway lights or signs, should be in the runway safety area. These objects should be mounted so that they break away if struck by an aircraft. The consequences of incidents are less likely to be severe because of the adherence to design standards.
22 National Plan of Integrated Airport Systems (2005-2009)
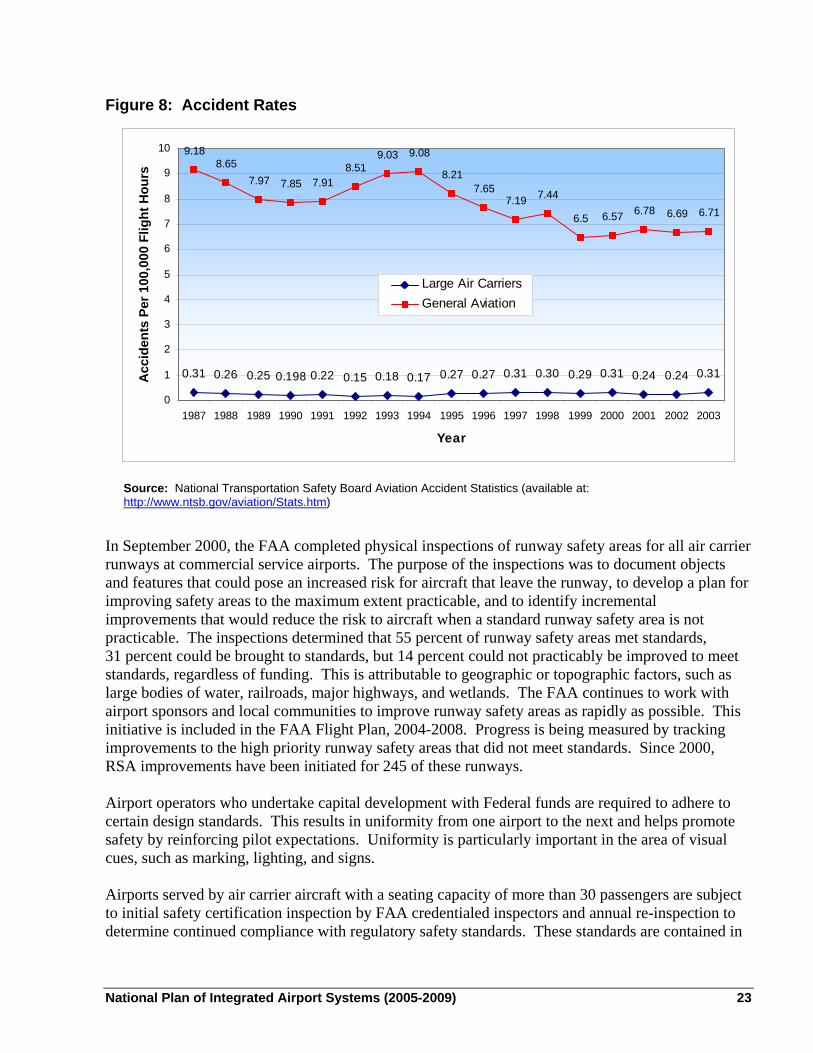
Figure 8: Accident Rates
0.31 0.26 0.25 0.198 0.22 0.15 0.18 0.17 0.27 0.27 0.31 0.30 0.29 0.31 0.24 0.24 0.31
9.188.65
7.97 7.85 7.918.51
9.03 9.08
8.217.65
7.19 7.44
6.5 6.57 6.78 6.69 6.71
0
1
2
3
4
5
6
7
8
9
10
1987 1988 1989 1990 1991 1992 1993 1994 1995 1996 1997 1998 1999 2000 2001 2002 2003
Year
Acc
iden
ts P
er 1
00,0
00 F
light
Hou
rs
Large Air CarriersGeneral Aviation
Source: National Transportation Safety Board Aviation Accident Statistics (available at: http://www.ntsb.gov/aviation/Stats.htm)
In September 2000, the FAA completed physical inspections of runway safety areas for all air carrier runways at commercial service airports. The purpose of the inspections was to document objects and features that could pose an increased risk for aircraft that leave the runway, to develop a plan for improving safety areas to the maximum extent practicable, and to identify incremental improvements that would reduce the risk to aircraft when a standard runway safety area is not practicable. The inspections determined that 55 percent of runway safety areas met standards, 31 percent could be brought to standards, but 14 percent could not practicably be improved to meet standards, regardless of funding. This is attributable to geographic or topographic factors, such as large bodies of water, railroads, major highways, and wetlands. The FAA continues to work with airport sponsors and local communities to improve runway safety areas as rapidly as possible. This initiative is included in the FAA Flight Plan, 2004-2008. Progress is being measured by tracking improvements to the high priority runway safety areas that did not meet standards. Since 2000, RSA improvements have been initiated for 245 of these runways. Airport operators who undertake capital development with Federal funds are required to adhere to certain design standards. This results in uniformity from one airport to the next and helps promote safety by reinforcing pilot expectations. Uniformity is particularly important in the area of visual cues, such as marking, lighting, and signs. Airports served by air carrier aircraft with a seating capacity of more than 30 passengers are subject to initial safety certification inspection by FAA credentialed inspectors and annual re-inspection to determine continued compliance with regulatory safety standards. These standards are contained in
National Plan of Integrated Airport Systems (2005-2009) 23
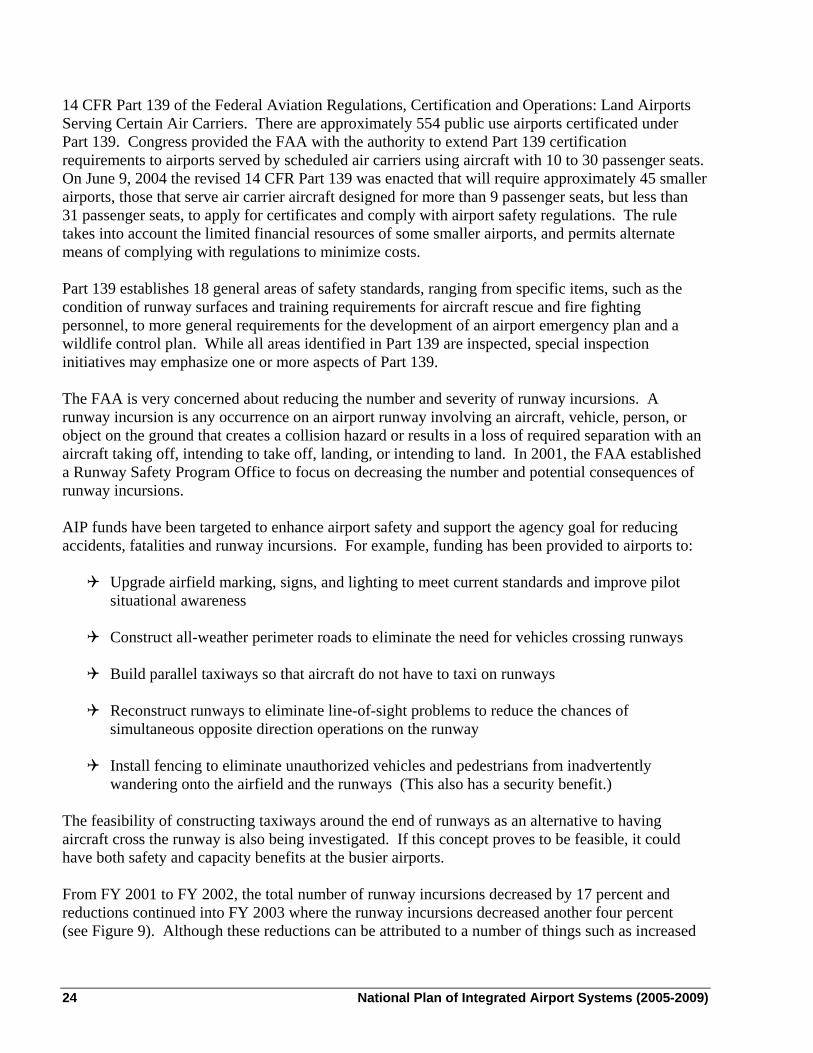
14 CFR Part 139 of the Federal Aviation Regulations, Certification and Operations: Land Airports Serving Certain Air Carriers. There are approximately 554 public use airports certificated under Part 139. Congress provided the FAA with the authority to extend Part 139 certification requirements to airports served by scheduled air carriers using aircraft with 10 to 30 passenger seats. On June 9, 2004 the revised 14 CFR Part 139 was enacted that will require approximately 45 smaller airports, those that serve air carrier aircraft designed for more than 9 passenger seats, but less than 31 passenger seats, to apply for certificates and comply with airport safety regulations. The rule takes into account the limited financial resources of some smaller airports, and permits alternate means of complying with regulations to minimize costs. Part 139 establishes 18 general areas of safety standards, ranging from specific items, such as the condition of runway surfaces and training requirements for aircraft rescue and fire fighting personnel, to more general requirements for the development of an airport emergency plan and a wildlife control plan. While all areas identified in Part 139 are inspected, special inspection initiatives may emphasize one or more aspects of Part 139. The FAA is very concerned about reducing the number and severity of runway incursions. A runway incursion is any occurrence on an airport runway involving an aircraft, vehicle, person, or object on the ground that creates a collision hazard or results in a loss of required separation with an aircraft taking off, intending to take off, landing, or intending to land. In 2001, the FAA established a Runway Safety Program Office to focus on decreasing the number and potential consequences of runway incursions. AIP funds have been targeted to enhance airport safety and support the agency goal for reducing accidents, fatalities and runway incursions. For example, funding has been provided to airports to:
Upgrade airfield marking, signs, and lighting to meet current standards and improve pilot situational awareness
Construct all-weather perimeter roads to eliminate the need for vehicles crossing runways
Build parallel taxiways so that aircraft do not have to taxi on runways
Reconstruct runways to eliminate line-of-sight problems to reduce the chances of
simultaneous opposite direction operations on the runway Install fencing to eliminate unauthorized vehicles and pedestrians from inadvertently
wandering onto the airfield and the runways (This also has a security benefit.) The feasibility of constructing taxiways around the end of runways as an alternative to having aircraft cross the runway is also being investigated. If this concept proves to be feasible, it could have both safety and capacity benefits at the busier airports. From FY 2001 to FY 2002, the total number of runway incursions decreased by 17 percent and reductions continued into FY 2003 where the runway incursions decreased another four percent (see Figure 9). Although these reductions can be attributed to a number of things such as increased
24 National Plan of Integrated Airport Systems (2005-2009)
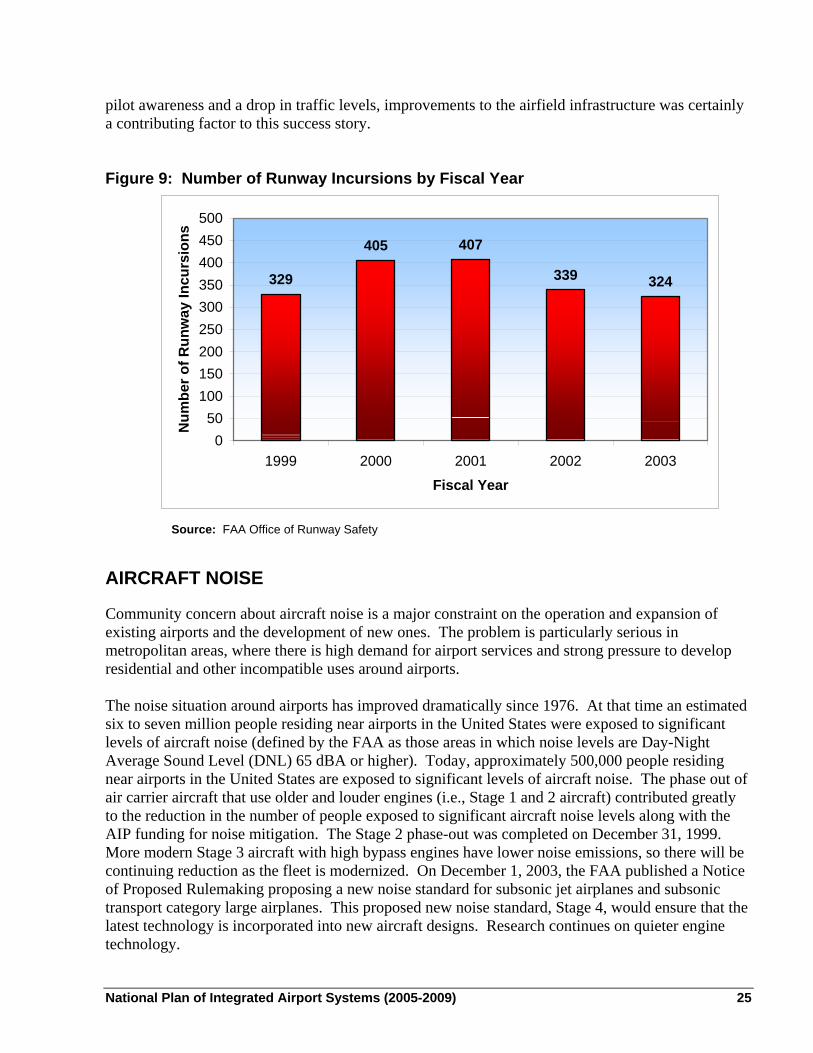
pilot awareness and a drop in traffic levels, improvements to the airfield infrastructure was certainly a contributing factor to this success story. Figure 9: Number of Runway Incursions by Fiscal Year
329
405 407
339 324
050
100150200250300350400450500
1999 2000 2001 2002 2003
Fiscal Year
Num
ber o
f Run
way
Incu
rsio
ns
Source: FAA Office of Runway Safety AIRCRAFT NOISE
Community concern about aircraft noise is a major constraint on the operation and expansion of existing airports and the development of new ones. The problem is particularly serious in metropolitan areas, where there is high demand for airport services and strong pressure to develop residential and other incompatible uses around airports. The noise situation around airports has improved dramatically since 1976. At that time an estimated six to seven million people residing near airports in the United States were exposed to significant levels of aircraft noise (defined by the FAA as those areas in which noise levels are Day-Night Average Sound Level (DNL) 65 dBA or higher). Today, approximately 500,000 people residing near airports in the United States are exposed to significant levels of aircraft noise. The phase out of air carrier aircraft that use older and louder engines (i.e., Stage 1 and 2 aircraft) contributed greatly to the reduction in the number of people exposed to significant aircraft noise levels along with the AIP funding for noise mitigation. The Stage 2 phase-out was completed on December 31, 1999. More modern Stage 3 aircraft with high bypass engines have lower noise emissions, so there will be continuing reduction as the fleet is modernized. On December 1, 2003, the FAA published a Notice of Proposed Rulemaking proposing a new noise standard for subsonic jet airplanes and subsonic transport category large airplanes. This proposed new noise standard, Stage 4, would ensure that the latest technology is incorporated into new aircraft designs. Research continues on quieter engine technology.
National Plan of Integrated Airport Systems (2005-2009) 25
The FAA’s Part 150 program, established under the Aviation Safety and Noise Abatement Act of 1979, assists airport operators to develop comprehensive programs to reduce aviation noise in the community and achieve compatible land uses in areas surrounding the airport. Part 150, which is a voluntary program, encourages airport operators to develop Noise Exposure Maps and Noise Compatibility Programs (NCP). Noise Exposure Maps identify noise contours and land use incompatibilities and are useful in evaluating noise impacts and discouraging incompatible development. Once the FAA determines that Noise Exposure Maps have been prepared in accordance with Part 150, the airport operator may submit a NCP, coordinated with affected parties, outlining measures to improve noise and land use compatibility. Through fiscal year 2003, 256 airports are participating in the Part 150 program and 214 had NCPs approved by FAA. An FAA-approved NCP clears the way for an airport to obtain Federal aid for noise mitigation projects.7 Two hundred and thirty-six airports have received a grant for Part 150 studies and approximately $3.6 billion has been granted for airport noise compatibility projects since 1982. Over the past twenty years, considerable effort has been expended to provide relief to noise impacted areas by funding noise compatibility projects under the AIP. Noise compatibility projects include: residential and public building sound insulation; land acquisition and associated noise sensitive residential and public building relocation; acquisition of noise monitoring equipment; installation of noise barriers; taxiway and runway construction primarily for the purpose of noise relief; and noise planning. FAA completed an evaluation of the AIP set-aside program in October 2002. The evaluation established a performance goal of reducing the residential population exposed to high levels (DNL 65 dBA or greater) of aircraft noise by 62,500 (expected population) for the five-year period FY 2003 to FY 2007. Coverage through FY 2008 and a corresponding increase in the cumulative goal to 75,000 people were added subsequent to the study to make the performance measures consistent with the FAA Flight Plan. Figure 10 shows the number of people in residential areas that are expected to benefit as a result of the FY 2003 AIP noise set-aside program, and the cumulative goals for each fiscal year from FY 2004 to FY 2008. People benefit either by having their homes insulated or by being relocated from the areas of significant airport noise. In addition, over 20,000 students are expected to benefit when school insulation and relocation projects funded under the FY 2002 and FY 2003 AIP are completed. Despite the reduction in aircraft noise emissions, public concern and sensitivity is still high. In recent years, complaints and organized opposition have come from populations exposed to relatively low levels of noise, sometimes at locations miles from the nearest airport. This will be a factor in future planning for the airport and airspace system and will provide an impetus for further reductions in engine noise emissions.
7 Certain noise projects to benefit schools and medical facilities can be federally funded without an approved NCP.
26 National Plan of Integrated Airport Systems (2005-2009)
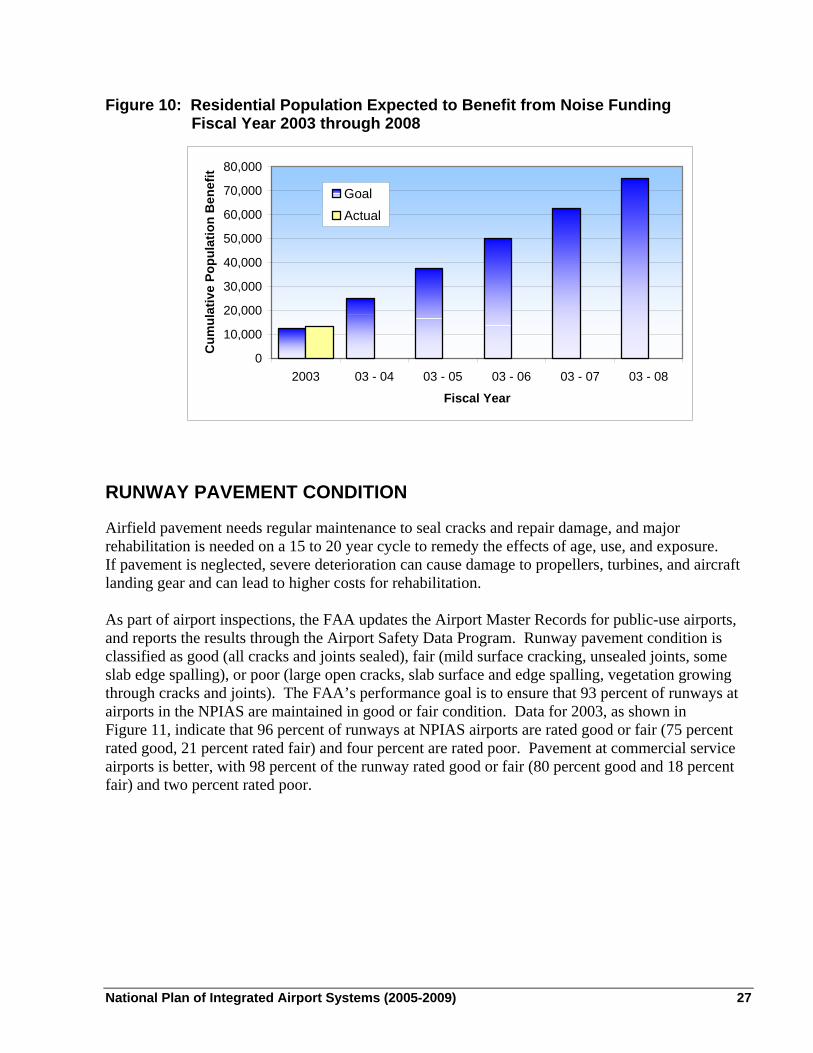
Figure 10: Residential Population Expected to Benefit from Noise Funding Fiscal Year 2003 through 2008
0
10,000
20,000
30,000
40,000
50,000
60,000
70,000
80,000
2003 03 - 04 03 - 05 03 - 06 03 - 07 03 - 08
Fiscal Year
Cum
ulat
ive
Popu
latio
n B
enef
itGoalActual
RUNWAY PAVEMENT CONDITION
Airfield pavement needs regular maintenance to seal cracks and repair damage, and major rehabilitation is needed on a 15 to 20 year cycle to remedy the effects of age, use, and exposure. If pavement is neglected, severe deterioration can cause damage to propellers, turbines, and aircraft landing gear and can lead to higher costs for rehabilitation. As part of airport inspections, the FAA updates the Airport Master Records for public-use airports, and reports the results through the Airport Safety Data Program. Runway pavement condition is classified as good (all cracks and joints sealed), fair (mild surface cracking, unsealed joints, some slab edge spalling), or poor (large open cracks, slab surface and edge spalling, vegetation growing through cracks and joints). The FAA’s performance goal is to ensure that 93 percent of runways at airports in the NPIAS are maintained in good or fair condition. Data for 2003, as shown in Figure 11, indicate that 96 percent of runways at NPIAS airports are rated good or fair (75 percent rated good, 21 percent rated fair) and four percent are rated poor. Pavement at commercial service airports is better, with 98 percent of the runway rated good or fair (80 percent good and 18 percent fair) and two percent rated poor.
National Plan of Integrated Airport Systems (2005-2009) 27
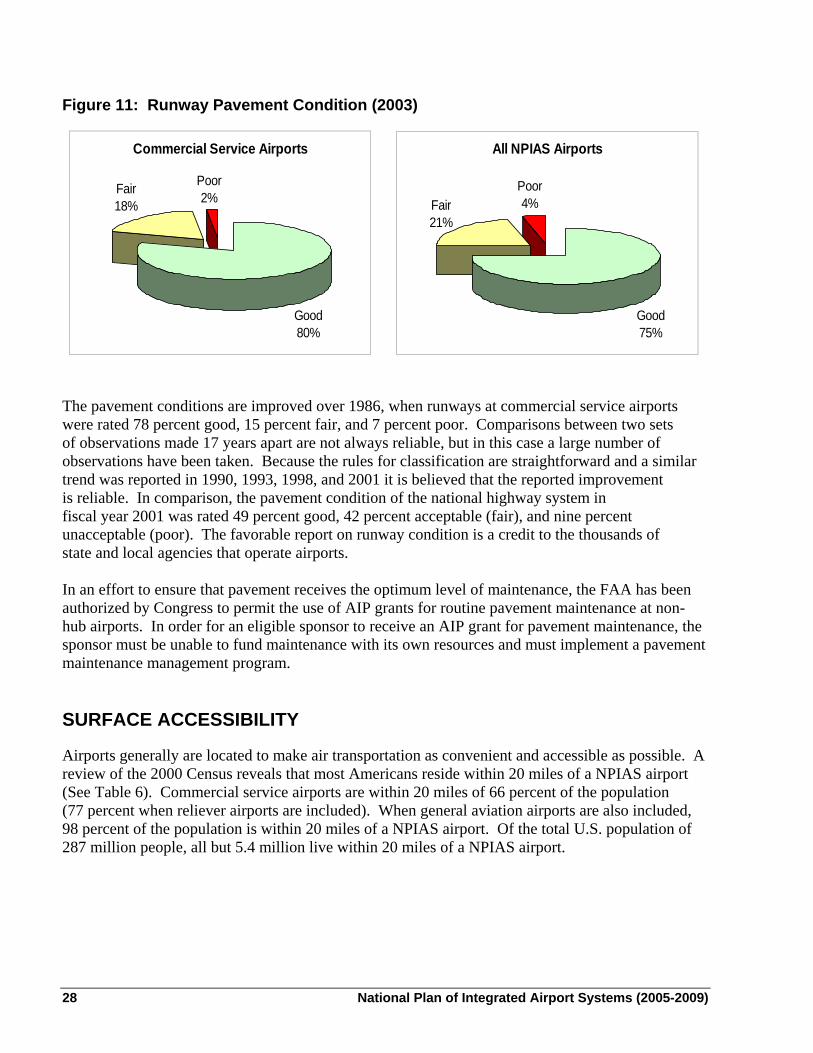
Figure 11: Runway Pavement Condition (2003)
Commercial Service Airports
Good80%
Fair18%
Poor2%
All NPIAS Airports
Good75%
Fair 21%
Poor4%
The pavement conditions are improved over 1986, when runways at commercial service airports were rated 78 percent good, 15 percent fair, and 7 percent poor. Comparisons between two sets of observations made 17 years apart are not always reliable, but in this case a large number of observations have been taken. Because the rules for classification are straightforward and a similar trend was reported in 1990, 1993, 1998, and 2001 it is believed that the reported improvement is reliable. In comparison, the pavement condition of the national highway system in fiscal year 2001 was rated 49 percent good, 42 percent acceptable (fair), and nine percent unacceptable (poor). The favorable report on runway condition is a credit to the thousands of state and local agencies that operate airports. In an effort to ensure that pavement receives the optimum level of maintenance, the FAA has been authorized by Congress to permit the use of AIP grants for routine pavement maintenance at non-hub airports. In order for an eligible sponsor to receive an AIP grant for pavement maintenance, the sponsor must be unable to fund maintenance with its own resources and must implement a pavement maintenance management program. SURFACE ACCESSIBILITY
Airports generally are located to make air transportation as convenient and accessible as possible. A review of the 2000 Census reveals that most Americans reside within 20 miles of a NPIAS airport (See Table 6). Commercial service airports are within 20 miles of 66 percent of the population (77 percent when reliever airports are included). When general aviation airports are also included, 98 percent of the population is within 20 miles of a NPIAS airport. Of the total U.S. population of 287 million people, all but 5.4 million live within 20 miles of a NPIAS airport.
28 National Plan of Integrated Airport Systems (2005-2009)

Table 6: Population Within 20 Miles of a NPIAS Airport
Airport Categories Percentage of U.S. Population Commercial Service Airports 66% Commercial Service and Relievers 77% All NPIAS Airports 98%
Geographic proximity alone does not ensure that airports are easily accessible. Highway congestion in metropolitan areas can seriously impede ground access. Many cities are considering expanded use of public transportation to improve the convenience and reliability of airport surface access and to enhance air quality. Statistics for major airports indicate an important, but limited, role of public transportation in airport access. Figure 12 shows public transportation market share for access at some of the nation’s large hub airports. The figure identifies the percent of passengers that access the airport via rail, bus, or shared-ride vans. San Francisco International has the highest percent of passengers using public transportation at slightly more than 20 percent (the majority using shared-ride vans); however, these data were collected before the extension of the BART system to the airport opened in June 2003. The new station provides direct service from the airport to downtown San Francisco and the East Bay with connections to stations throughout the BART system; thus, the public transportation market share will likely be higher in the future. Boston Logan International has the second highest percent of passengers using public transportation at about 19 percent, with the majority using buses. Twelve U.S. airports currently have direct rail service at the airport terminal. Four of the 12 airports opened airport rail links in the last several years. Two airport rail links opened in 2001 (MAX light rail system extension from the Gateway Transit Center to Portland International Airport opened in September and in October Newark Liberty International Airport Station opened, which connected the airport, NJ TRANSIT, and Amtrak). Two airport rail links opened in 2003 (BART system extension from downtown San Francisco to the airport opened in June and a light rail line connecting New York’s JFK Airport to Manhattan opened in December). Ridership statistics were not available when this was written on the four airports with recently opened rail service. Of the eight airports with data available8, the most successful rail linkage is to Ronald Reagan Washington National Airport (DCA) where rail accounts for almost 15 percent of trips to DCA. The next best performers are Atlanta’s MARTA rail link to Hartsfield Airport and Chicago Transit Authority (subway link to Midway Airport), each with a 7.5 percent market share, and Boston’s MBTA rail link to Logan Airport, with a 6 percent market share. Transit links to Chicago O’Hare, Philadelphia International, Metropolitan Oakland, Lambert St. Louis, and Cleveland Hopkins Airports each account for between 2.5 percent to 4 percent of airport access trips.
8 Source: Leigh Fisher Associates, based on information provided by airport management, December 1999.
National Plan of Integrated Airport Systems (2005-2009) 29
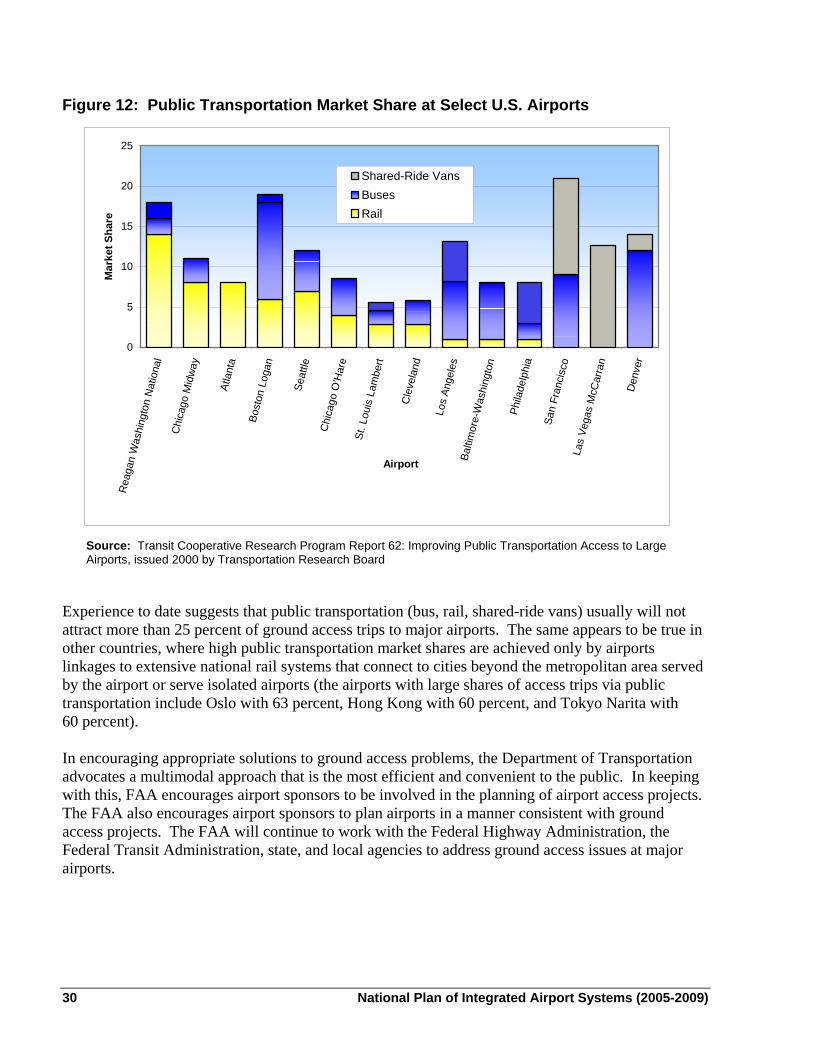
Figure 12: Public Transportation Market Share at Select U.S. Airports
0
5
10
15
20
25
Rea
gan
Was
hing
ton
Nat
iona
lC
hica
go M
idw
ay
Atla
nta
Bost
on L
ogan
Seat
tle
Chi
cago
O'H
are
St. L
ouis
Lam
bert
Cle
vela
nd
Los
Ange
les
Balti
mor
e-W
ashi
ngto
n
Phila
delp
hia
San
Fran
cisc
oLa
s Ve
gas
McC
arra
n
Den
ver
Airport
Mar
ket S
hare
Shared-Ride VansBusesRail
Source: Transit Cooperative Research Program Report 62: Improving Public Transportation Access to Large Airports, issued 2000 by Transportation Research Board
Experience to date suggests that public transportation (bus, rail, shared-ride vans) usually will not attract more than 25 percent of ground access trips to major airports. The same appears to be true in other countries, where high public transportation market shares are achieved only by airports linkages to extensive national rail systems that connect to cities beyond the metropolitan area served by the airport or serve isolated airports (the airports with large shares of access trips via public transportation include Oslo with 63 percent, Hong Kong with 60 percent, and Tokyo Narita with 60 percent). In encouraging appropriate solutions to ground access problems, the Department of Transportation advocates a multimodal approach that is the most efficient and convenient to the public. In keeping with this, FAA encourages airport sponsors to be involved in the planning of airport access projects. The FAA also encourages airport sponsors to plan airports in a manner consistent with ground access projects. The FAA will continue to work with the Federal Highway Administration, the Federal Transit Administration, state, and local agencies to address ground access issues at major airports.
30 National Plan of Integrated Airport Systems (2005-2009)
In 2003, the DOT undertook a Department-wide cross modal initiative to enhance the Nation’s transportation capacity by identifying projects that involve the movement of freight and goods. As part of this initiative the FAA has agreed to identify intermodal access projects for airports with high priority funding and coordinate this with DOT. Also, a provision in Vision 100 – Century of Flight Authorization Act of 2003 (Public Law 108-176) requires that large and medium hub airports provide metropolitan planning organizations, upon request, copies of Airport Layout Plans or master plans showing certain projects.9 The FAA is notifying the large and medium hubs of this new provision. FINANCIAL PERFORMANCE
An understanding of airport finance is essential in the formulation of a national aviation funding policy. Since NPIAS airports are owned and operated by thousands of state and local agencies it is difficult to compile comprehensive data on the financial operations of all 3,344 airports. It is also difficult to state the precise amount of public spending on development, operations, or maintenance for the airport system because the sources of information on airport income and expenses are limited. However in 1996 commercial service airports were required to begin reporting financial data to the FAA, including revenue and expense information in a common format. Data reported by 529 commercial service airports to the FAA on Form 127 for fiscal years ending in 2002 (based on 2001 airport classification) are used to evaluate the financial performance of the airports. The statistics presented in Table 7 were derived from these data, which capture some of the financial impact on airports after September 11, 2001 terrorist attacks. Following September 11, 2001, airports incurred additional safety and security costs while experiencing a decline in revenue because of the decline in air travel. Airports have fixed costs (including debt issued through general airport revenue bonds). The majority of airports have seen a decline in operating revenue since most of an airport’s revenues are generated from airline landing fees and terminal rents and from the fees paid by concessionaires. In response, airports took action to reduce operating and capital costs, many of which were one-time cost reductions. Examples of their actions were to reduce staff; review operating budgets and reduce non-essential spending; defer airport capital plans and major maintenance projects and suspend or reduce airline fees for a period of time. Longer-term actions have been to refinance debt at lower interest rates when possible, restructure debt to take advantage of lower interest rates, and redirect PFC revenue to pay for debt service to reduce airline charges. To date, no major airport has defaulted on its general airport revenue bonds or bonds financed with passenger facility fees. For the most part, large hub airports continue to run profitably. Total airport revenues for 529 commercial service airports were reported to be $16.9 billion in 2002, with $11.1 billion in operating revenues and $5.7 billion in non-operating revenues. Revenue from aeronautical fees was about $6.2 billion, non-aeronautical fees were about $4.9 billion and revenues not derived from operations (interest, grants, passenger facility charges) were about $5.8 billion. The highest aeronautical fees were for landing fees and terminal rents, at $5.0 billion 9 Section 47106 (c)(1)(A)(iii) of Title 49 of United States Code as amended.
National Plan of Integrated Airport Systems (2005-2009) 31
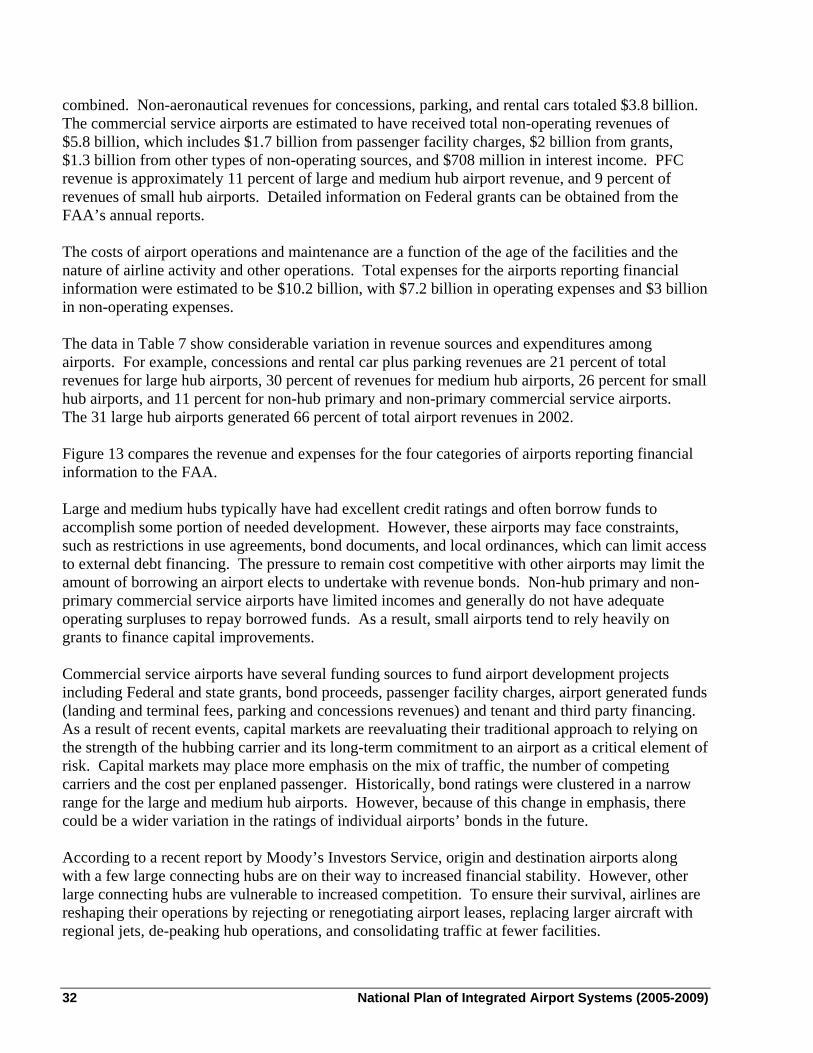
combined. Non-aeronautical revenues for concessions, parking, and rental cars totaled $3.8 billion. The commercial service airports are estimated to have received total non-operating revenues of $5.8 billion, which includes $1.7 billion from passenger facility charges, $2 billion from grants, $1.3 billion from other types of non-operating sources, and $708 million in interest income. PFC revenue is approximately 11 percent of large and medium hub airport revenue, and 9 percent of revenues of small hub airports. Detailed information on Federal grants can be obtained from the FAA’s annual reports. The costs of airport operations and maintenance are a function of the age of the facilities and the nature of airline activity and other operations. Total expenses for the airports reporting financial information were estimated to be $10.2 billion, with $7.2 billion in operating expenses and $3 billion in non-operating expenses. The data in Table 7 show considerable variation in revenue sources and expenditures among airports. For example, concessions and rental car plus parking revenues are 21 percent of total revenues for large hub airports, 30 percent of revenues for medium hub airports, 26 percent for small hub airports, and 11 percent for non-hub primary and non-primary commercial service airports. The 31 large hub airports generated 66 percent of total airport revenues in 2002. Figure 13 compares the revenue and expenses for the four categories of airports reporting financial information to the FAA. Large and medium hubs typically have had excellent credit ratings and often borrow funds to accomplish some portion of needed development. However, these airports may face constraints, such as restrictions in use agreements, bond documents, and local ordinances, which can limit access to external debt financing. The pressure to remain cost competitive with other airports may limit the amount of borrowing an airport elects to undertake with revenue bonds. Non-hub primary and non-primary commercial service airports have limited incomes and generally do not have adequate operating surpluses to repay borrowed funds. As a result, small airports tend to rely heavily on grants to finance capital improvements. Commercial service airports have several funding sources to fund airport development projects including Federal and state grants, bond proceeds, passenger facility charges, airport generated funds (landing and terminal fees, parking and concessions revenues) and tenant and third party financing. As a result of recent events, capital markets are reevaluating their traditional approach to relying on the strength of the hubbing carrier and its long-term commitment to an airport as a critical element of risk. Capital markets may place more emphasis on the mix of traffic, the number of competing carriers and the cost per enplaned passenger. Historically, bond ratings were clustered in a narrow range for the large and medium hub airports. However, because of this change in emphasis, there could be a wider variation in the ratings of individual airports’ bonds in the future. According to a recent report by Moody’s Investors Service, origin and destination airports along with a few large connecting hubs are on their way to increased financial stability. However, other large connecting hubs are vulnerable to increased competition. To ensure their survival, airlines are reshaping their operations by rejecting or renegotiating airport leases, replacing larger aircraft with regional jets, de-peaking hub operations, and consolidating traffic at fewer facilities.
32 National Plan of Integrated Airport Systems (2005-2009)
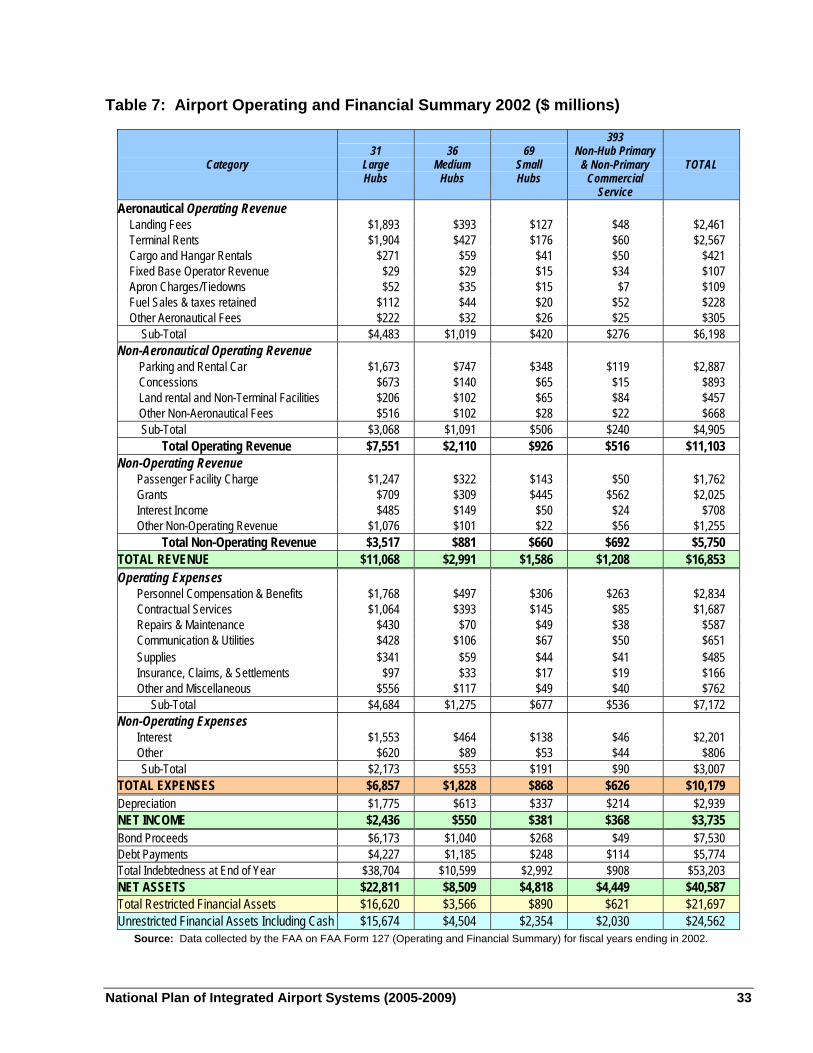
Table 7: Airport Operating and Financial Summary 2002 ($ millions)
Category 31
Large Hubs
36 Medium
Hubs
69 Small Hubs
393 Non-Hub Primary
& Non-Primary Commercial
Service
TOTAL
Aeronautical Operating Revenue Landing Fees $1,893 $393 $127 $48 $2,461 Terminal Rents $1,904 $427 $176 $60 $2,567 Cargo and Hangar Rentals $271 $59 $41 $50 $421 Fixed Base Operator Revenue $29 $29 $15 $34 $107 Apron Charges/Tiedowns $52 $35 $15 $7 $109 Fuel Sales & taxes retained $112 $44 $20 $52 $228 Other Aeronautical Fees $222 $32 $26 $25 $305
Sub-Total $4,483 $1,019 $420 $276 $6,198 Non-Aeronautical Operating Revenue
Parking and Rental Car $1,673 $747 $348 $119 $2,887 Concessions $673 $140 $65 $15 $893 Land rental and Non-Terminal Facilities $206 $102 $65 $84 $457 Other Non-Aeronautical Fees $516 $102 $28 $22 $668 Sub-Total $3,068 $1,091 $506 $240 $4,905
Total Operating Revenue $7,551 $2,110 $926 $516 $11,103 Non-Operating Revenue
Passenger Facility Charge $1,247 $322 $143 $50 $1,762 Grants $709 $309 $445 $562 $2,025 Interest Income $485 $149 $50 $24 $708 Other Non-Operating Revenue $1,076 $101 $22 $56 $1,255
Total Non-Operating Revenue $3,517 $881 $660 $692 $5,750 TOTAL REVENUE $11,068 $2,991 $1,586 $1,208 $16,853 Operating Expenses
Personnel Compensation & Benefits $1,768 $497 $306 $263 $2,834 Contractual Services $1,064 $393 $145 $85 $1,687 Repairs & Maintenance $430 $70 $49 $38 $587 Communication & Utilities $428 $106 $67 $50 $651 Supplies $341 $59 $44 $41 $485 Insurance, Claims, & Settlements $97 $33 $17 $19 $166 Other and Miscellaneous $556 $117 $49 $40 $762
Sub-Total $4,684 $1,275 $677 $536 $7,172 Non-Operating Expenses
Interest $1,553 $464 $138 $46 $2,201 Other $620 $89 $53 $44 $806 Sub-Total $2,173 $553 $191 $90 $3,007
TOTAL EXPENSES $6,857 $1,828 $868 $626 $10,179 Depreciation $1,775 $613 $337 $214 $2,939 NET INCOME $2,436 $550 $381 $368 $3,735 Bond Proceeds $6,173 $1,040 $268 $49 $7,530 Debt Payments $4,227 $1,185 $248 $114 $5,774 Total Indebtedness at End of Year $38,704 $10,599 $2,992 $908 $53,203 NET ASSETS $22,811 $8,509 $4,818 $4,449 $40,587 Total Restricted Financial Assets $16,620 $3,566 $890 $621 $21,697 Unrestricted Financial Assets Including Cash $15,674 $4,504 $2,354 $2,030 $24,562
Source: Data collected by the FAA on FAA Form 127 (Operating and Financial Summary) for fiscal years ending in 2002.
National Plan of Integrated Airport Systems (2005-2009) 33
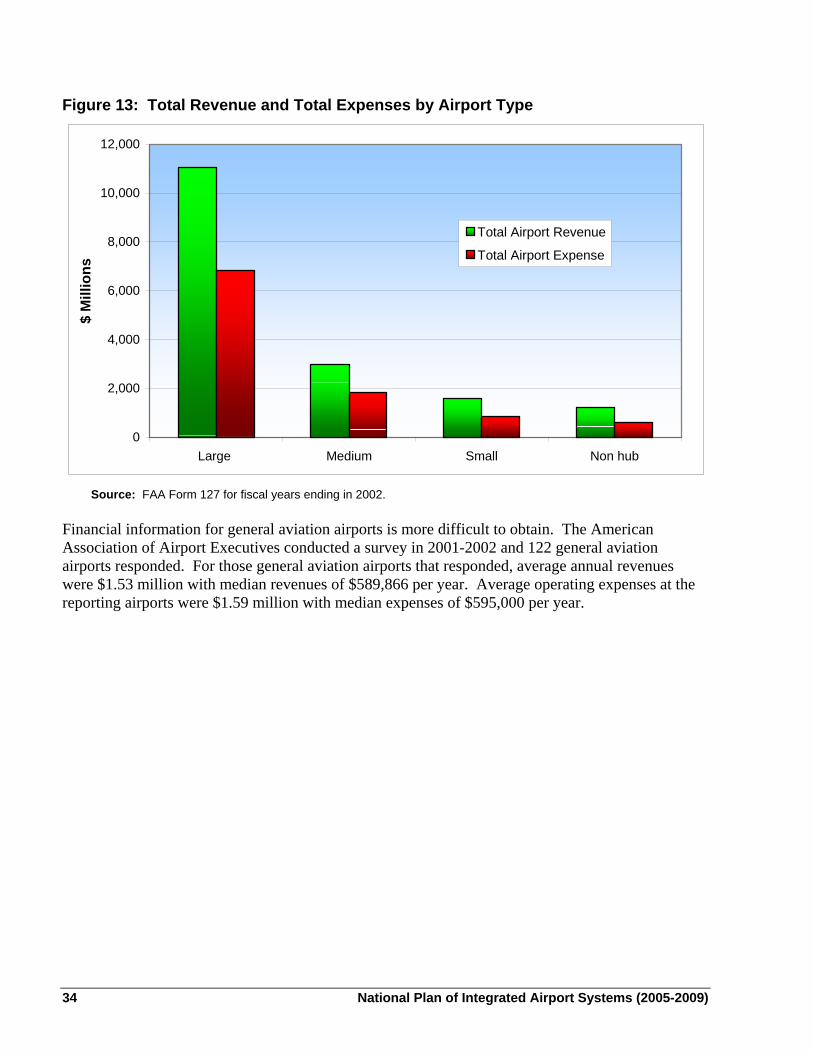
Figure 13: Total Revenue and Total Expenses by Airport Type
0
2,000
4,000
6,000
8,000
10,000
12,000
Large Medium Small Non hub
$ M
illio
ns
Total Airport Revenue
Total Airport Expense
Source: FAA Form 127 for fiscal years ending in 2002. Financial information for general aviation airports is more difficult to obtain. The American Association of Airport Executives conducted a survey in 2001-2002 and 122 general aviation airports responded. For those general aviation airports that responded, average annual revenues were $1.53 million with median revenues of $589,866 per year. Average operating expenses at the reporting airports were $1.59 million with median expenses of $595,000 per year.
34 National Plan of Integrated Airport Systems (2005-2009)
Chapter 3: Activity Forecasts OVERVIEW
Increased demand for air transportation will affect the future pattern of capital investment in airports. Recovery and gradual growth will lead to projects to expand passenger facilities. ACTIVITY FORECASTS10
The terrorist attacks in 2001 ended a seven-year period of unprecedented growth in commercial and civil aviation demand and profitability. The attacks, combined with a worldwide slowdown in economic activity, resulted in record operating losses totaling $19.1 billion in 2001 and 2002 for world air carriers. While the impact of the terrorist attacks on airlines, travel markets, and economic growth was immediate, significant, and worldwide, the greatest impact occurred in the United States. The United States and the world aviation industries have both begun to recover, with passenger levels expected to return to pre-September 11, 2001 levels by 2005. In 2003, the domestic load factor for the large air carriers reached an all-time high of 72.7 percent; it is projected to increase to 74.8 percent in 2015. In 2003, the load factor for the regional/commuters was 64.7 percent, an increase of 3.4 percent from 2002, and it is projected to reach 67.1 percent in 2015. Large air carriers and regionals/commuters are projected to grow at an average rate of 4.3 percent per year through 2015. By 2014, the number of enplaned passengers in the United States will exceed 1 billion. Over the next two years, international and domestic airline markets are expected to show a strong recovery. Regional/commuter passenger traffic will continue to grow at a faster rate than for the large U.S. air carriers —6.4 percent compared to 3.6 percent annually. The active general aviation fleet declined 0.1 percent in 2002 and is projected to remain static in 2003. However, the business and corporate segments, through fractional ownership companies and corporate flying, provide the greatest potential for future growth. The number of student pilots increased by 1.5 percent in 2003 following three consecutive years of decline. The FAA’s forecasts through 2015 are based on assumptions of continued economic growth, with the U.S. economy expected to grow at an annual rate of 3.3 percent, while the worldwide economy is projected to grow at a 3.2 percent annually. The Latin American economy is expected to grow at 3.9 percent per year and the Asia/Pacific region is projected to expand at 3.6 percent annually. The combination of increased unit revenues, and reduced unit costs hinges on business travel returning sufficiently to improve the profit and loss of large air carriers. Domestic U.S. commercial enplanements (sum of air carriers and regionals/commuters) are forecast to increase 4.2 percent annually through 2015 and international enplanements to increase by 5.2 percent, for a system average annual growth rate of 4.3 percent. Air carrier aircraft operations will grow 2.8 percent annually, while regional /commuter operations are forecast to grow 2.9 percent annually (see Table 8). Large air carrier operations are expected to return to pre-September 11th
10 Source: FAA Aerospace Forecasts FY 2004-2015 issued in March 2004.
National Plan of Integrated Airport Systems (2005-2009) 35
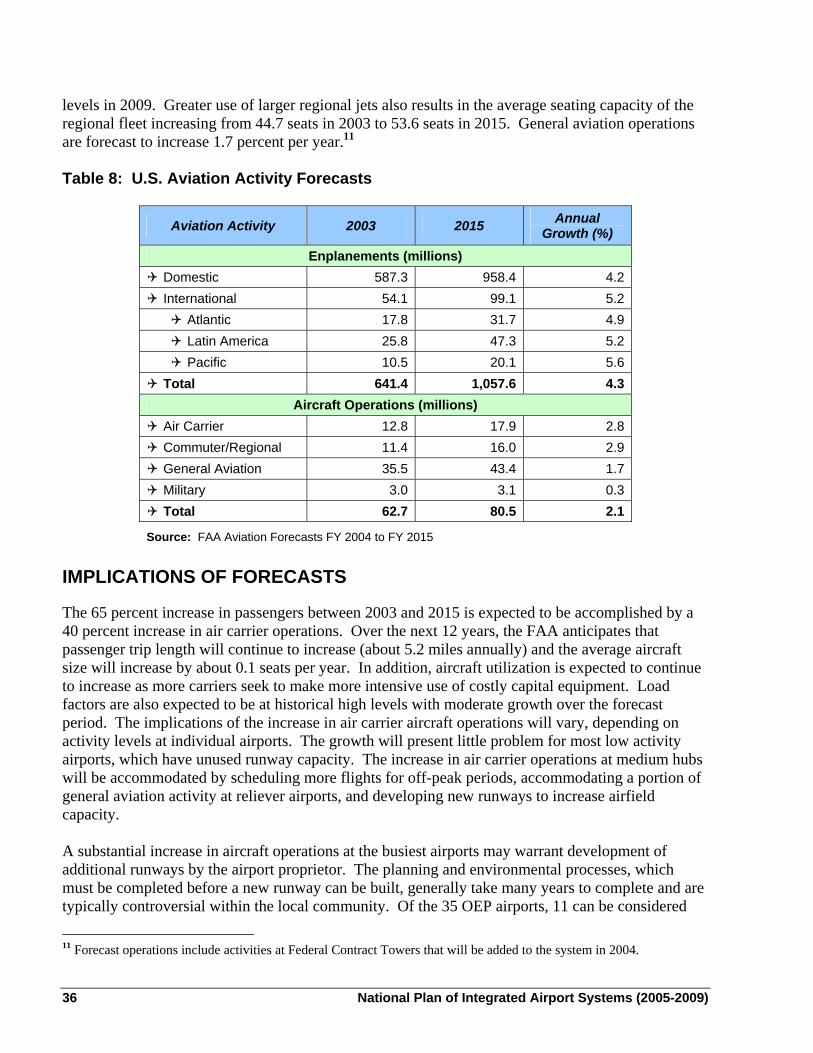
levels in 2009. Greater use of larger regional jets also results in the average seating capacity of the regional fleet increasing from 44.7 seats in 2003 to 53.6 seats in 2015. General aviation operations are forecast to increase 1.7 percent per year.11
Table 8: U.S. Aviation Activity Forecasts
Aviation Activity 2003 2015 Annual Growth (%)
Enplanements (millions) Domestic 587.3 958.4 4.2 International 54.1 99.1 5.2 Atlantic 17.8 31.7 4.9 Latin America 25.8 47.3 5.2 Pacific 10.5 20.1 5.6
Total 641.4 1,057.6 4.3 Aircraft Operations (millions)
Air Carrier 12.8 17.9 2.8 Commuter/Regional 11.4 16.0 2.9 General Aviation 35.5 43.4 1.7 Military 3.0 3.1 0.3 Total 62.7 80.5 2.1
Source: FAA Aviation Forecasts FY 2004 to FY 2015
IMPLICATIONS OF FORECASTS
The 65 percent increase in passengers between 2003 and 2015 is expected to be accomplished by a 40 percent increase in air carrier operations. Over the next 12 years, the FAA anticipates that passenger trip length will continue to increase (about 5.2 miles annually) and the average aircraft size will increase by about 0.1 seats per year. In addition, aircraft utilization is expected to continue to increase as more carriers seek to make more intensive use of costly capital equipment. Load factors are also expected to be at historical high levels with moderate growth over the forecast period. The implications of the increase in air carrier aircraft operations will vary, depending on activity levels at individual airports. The growth will present little problem for most low activity airports, which have unused runway capacity. The increase in air carrier operations at medium hubs will be accommodated by scheduling more flights for off-peak periods, accommodating a portion of general aviation activity at reliever airports, and developing new runways to increase airfield capacity. A substantial increase in aircraft operations at the busiest airports may warrant development of additional runways by the airport proprietor. The planning and environmental processes, which must be completed before a new runway can be built, generally take many years to complete and are typically controversial within the local community. Of the 35 OEP airports, 11 can be considered
11 Forecast operations include activities at Federal Contract Towers that will be added to the system in 2004.
36 National Plan of Integrated Airport Systems (2005-2009)
transfer airports (with more than 50 percent of their passengers connecting to another flight) and 24 can be considered origin airports (with more than 50 percent of their passengers originating at the airport). Eighty-two percent of the transfer airports are considering plans to build a new runway while 63 percent of the origin airports are considering plans to build a new runway. Airlines selected transfer airports as hubs in part because of their potential for expansion, and airport management is eager to provide adequate runway capacity in order to ensure that the airlines continue to operate there, rather than switching hub operations to a competing airport. Much of the additional capacity at transfer hubs is intended for use by commuter and regional airline aircraft, which transport passengers from smaller cities within several hundred miles of the hub. This traffic is expected to grow as regional carriers continue to acquire jet aircraft. Capacity-enhancing efforts are also underway at many of the airports that primarily serve origin and destination traffic. However, in some cases new runways are not feasible and the alternative of demand management is being explored. For example, the FAA is exploring alternatives for managing demand in relation to capacity at LaGuardia Airport, which prior to the events of September 11, 2001, accounted for as much as 25 percent of flight delays nationwide. In 2001, FAA instituted a lottery to allocate new takeoff and landing slots and is seeking to extend the existing allocation of AIR-21 slot exemptions and would hold a new lottery to allocate limited available capacity. In the longer term, the FAA is examining implementing a demand management approach to allocate limited runway capacity among aircraft operators. OTHER FACTORS
Capacity is affected not only by the volume of air transportation but also by the way in which it is provided. Airlines are expected to continue to concentrate their schedules at their primary hubs, where large numbers of flights converge in short periods of time to maximize the opportunity for passenger transfers. No additional hubs are expected within the next five years. Increased point-to-point service, bypassing hubs, is likely when warranted by market considerations. New parallel runways are planned at some transfer hubs to accommodate operations by regional airlines, which are being used to connect to smaller cities. Lower-cost carriers also are serving major metropolitan areas, both at uncongested, secondary commercial service airports where existing facilities are underutilized and at major airports. For example, low-cost carriers presently operate a significant number of flights at the major airports in Las Vegas, Phoenix, Los Angeles, and St. Louis. Southwest has introduced service at Philadelphia and Independence Air at Washington Dulles. The globalization of the airline industry, the rapid growth of air transportation in other parts of the world, and the increased range and reduced size of aircraft will combine to bring international passengers to more U.S. airports. The effects will vary but may include requirements for longer runways, terminal building expansion, and provision of Federal inspection facilities for immigration, customs, and agriculture at airports where international traffic is increasing. The increased number of jet aircraft in the general aviation fleet will result in a demand for longer runways at certain reliever and general aviation airports, particularly those used by business and corporate aircraft.
National Plan of Integrated Airport Systems (2005-2009) 37
Cargo
Air cargo is very important to the U.S. economy, as illustrated by U.S. Department of Commerce statistics that 36 percent of exports measured by value in 2000 were shipped by air. Air transportation is the preferred mode for the shipment of high-value, lightweight, and perishable goods. Between 1997 and 2002, the value of shipments by air increased 22 percent, reflecting the increased emphasis on reduced in-transit time for goods. Lower shipping costs and more frequent service have made air cargo a major factor in the way global business is conducted. Air cargo is expected to grow at an annual rate of 4.5 percent through 2015. Air cargo is concentrated at busy commercial service airports. All-cargo carriers conduct approximately two-thirds of cargo activity and passenger carriers conduct the remainder. Air-cargo flights usually occur during off-peak periods and do not substantially contribute to airport congestion and delay problems. The principal need for airport development to support cargo operations is related to the cargo sorting and transfer facilities developed by the package express carriers. Many of the busiest facilities are concentrated in a geographic area in and around the Ohio River Valley where flights can be brought together efficiently to transfer cargo. These airports must have high-capacity, all-weather runway systems to support reliable operations. Improvements may also be warranted at selected airports, such as JFK, O’Hare, Miami, Anchorage, and Los Angeles International, to keep pace with rapid growth in international air cargo. Innovations
Efforts are underway to develop transportation and communication technology that may eventually affect the demand for conventional air transportation. Prototypes of tiltrotor aircraft may evolve into effective vehicles for air travel between city centers or suburban areas, bypassing congested airports. High-speed trains are being demonstrated that could attract more passengers to rail in specific markets, and research is underway into magnetic levitation (maglev) vehicles. Teleconferencing and other electronic communication techniques could affect the demand for business air travel. These innovations may eventually have a significant effect on airport development needs, but this is not expected to occur during the next five years. Smaller affordable business jets are being developed that would be able to operate at smaller airports with shorter runways, thereby improving access to the national airspace system for rural areas and less populated urban areas. A longer-term innovation that is being examined by the National Aeronautics and Space Administration and FAA is the concept of small aircraft and airports for business and personal transportation operating on virtual highways in the sky. New Large Aircraft
The first new large aircraft is expected to enter service in 2006. Airport terminals in the United States and around the world will have trouble accommodating the new aircraft because of the 262-foot wingspan that is 50 feet wider and the larger cabin that will seat between 150 and 400 more passengers than the largest aircraft in regular commercial service today. The distance between adjacent taxiways and runways and the layout of terminal buildings can limit wingspans and
38 National Plan of Integrated Airport Systems (2005-2009)
fuselage lengths, and the strength of pavement and underlying structures, such as bridges and culverts, may limit aircraft weight. Because of these factors, the number of airports that will be able to accommodate these aircraft may be limited. It is anticipated to initially serve four airports in the United States (JFK, LAX, SFO, and MIA) with two cargo-oriented airports (ANC and MEM) in 2008, followed possibly with three additional airports by 2010. Several organizations have released estimates on the cost of infrastructure changes to accommodate new aircraft. A report released by the General Accounting Office in February 2002 estimated the cost of infrastructure changes to accommodate new large aircraft at 14 airports to be between $500 million and $2 billion, depending on a number of unresolved issues. A recent survey of 30 international hubs by Airports Council International revealed that the average additional cost to upgrade an airport to accommodate an Airbus 380 would be about $100 million to $500 million per airport. Commercial Spaceports
Commercial spaceports are currently in operation at various coastal locations. None of the current locations involve public use airports contained in the NPIAS. However, the potential exists for future joint-use facilities that would accommodate both aviation and space operations at NPIAS airports, particularly space operations involving horizontally launched reusable vehicles. It is expected that initial demand will be at lower activity airports that are in more remote locations. The facilities required for commercial space operations are currently ineligible for Airport Improvement Program funds. However, FAA will continue to work with the space and aviation industries in identifying potential locations and in developing standards to ensure that the joint operations can be conducted in a safe, efficient and environmentally responsible manner. Conversion of Military Surplus Airfields
About 28 surplus military airfields are expected to be converted to civil use. Most of these military airfields have long runways and associated facilities that can accommodate large civil aircraft. Eight of the surplus military airfields have become commercial service airports (England AFB, LA; Myrtle Beach AFB, SC; Agana Guam NAS, GU; Pease AFB, NH; Scott AFB, IL; George AFB, CA; Bergstrom AFB, TX; and K.I. Sawyer AFB, MI) with Bergstrom and K.I. Sawyer replacing constrained civil airports. Two other surplus airfields have attracted significant cargo service (Mather AFB, CA and Rickenbacker AFB, OH). The remaining surplus airfields are located in areas where general aviation and reliever airports are needed. Air Quality
Improved air quality is an increasingly important consideration in transportation plans for urban areas. Many large cities must reduce vehicle emissions substantially in order to meet the requirements of the Clean Air Act Amendments of 1990. The FAA must determine that projects receiving Federal aid under the AIP conform to applicable State Implementation Plans, which often call for large reductions in emissions. The FAA is currently funding low emission vehicle projects at 10 public-use airports as part of the Inherently Low-Emission Airport Vehicle Pilot Program. In 2004, this effort will be expanded nationally under the Vision-100 reauthorization to help commercial service airports comply with Federal and state air quality requirements.12
12 Vision 100, op cit, Section 159.
National Plan of Integrated Airport Systems (2005-2009) 39

This page intentionally left blank.
40 National Plan of Integrated Airport Systems (2005-2009)
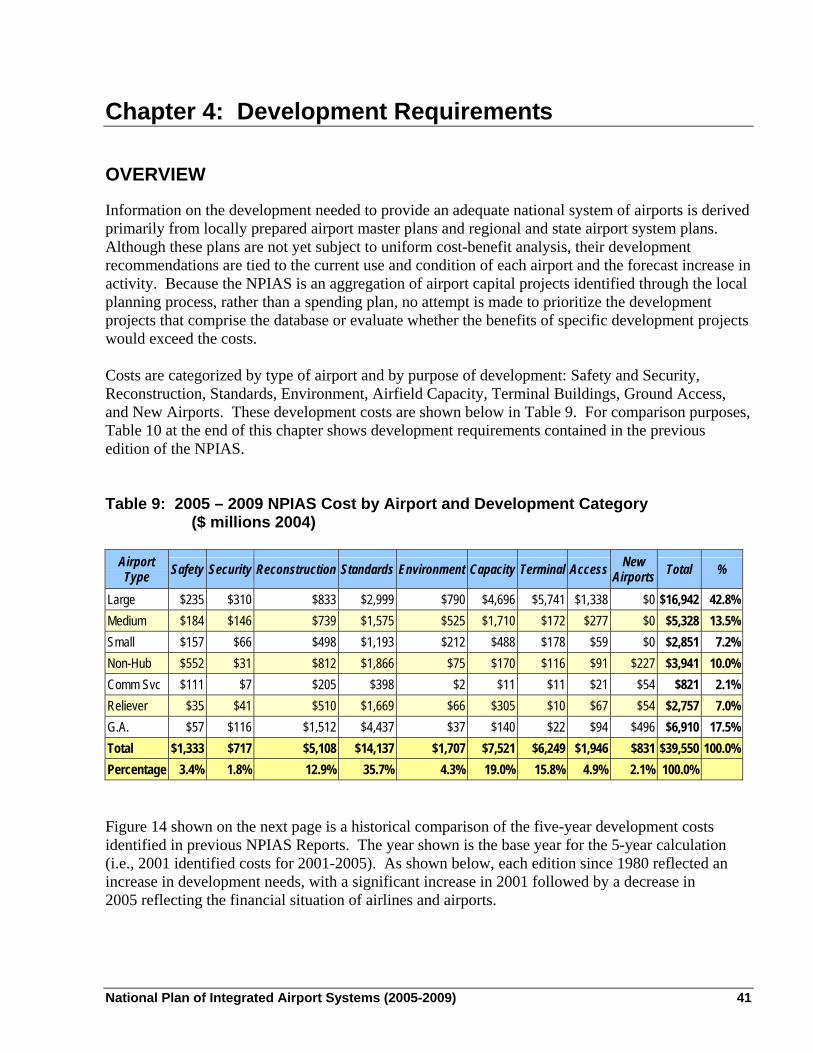
Chapter 4: Development Requirements OVERVIEW
Information on the development needed to provide an adequate national system of airports is derived primarily from locally prepared airport master plans and regional and state airport system plans. Although these plans are not yet subject to uniform cost-benefit analysis, their development recommendations are tied to the current use and condition of each airport and the forecast increase in activity. Because the NPIAS is an aggregation of airport capital projects identified through the local planning process, rather than a spending plan, no attempt is made to prioritize the development projects that comprise the database or evaluate whether the benefits of specific development projects would exceed the costs. Costs are categorized by type of airport and by purpose of development: Safety and Security, Reconstruction, Standards, Environment, Airfield Capacity, Terminal Buildings, Ground Access, and New Airports. These development costs are shown below in Table 9. For comparison purposes, Table 10 at the end of this chapter shows development requirements contained in the previous edition of the NPIAS. Table 9: 2005 – 2009 NPIAS Cost by Airport and Development Category
($ millions 2004)
Airport Type Safety Security Reconstruction Standards Environment Capacity Terminal Access New
Airports Total %
Large $235 $310 $833 $2,999 $790 $4,696 $5,741 $1,338 $0 $16,942 42.8% Medium $184 $146 $739 $1,575 $525 $1,710 $172 $277 $0 $5,328 13.5% Small $157 $66 $498 $1,193 $212 $488 $178 $59 $0 $2,851 7.2% Non-Hub $552 $31 $812 $1,866 $75 $170 $116 $91 $227 $3,941 10.0% Comm Svc $111 $7 $205 $398 $2 $11 $11 $21 $54 $821 2.1% Reliever $35 $41 $510 $1,669 $66 $305 $10 $67 $54 $2,757 7.0% G.A. $57 $116 $1,512 $4,437 $37 $140 $22 $94 $496 $6,910 17.5% Total $1,333 $717 $5,108 $14,137 $1,707 $7,521 $6,249 $1,946 $831 $39,550 100.0% Percentage 3.4% 1.8% 12.9% 35.7% 4.3% 19.0% 15.8% 4.9% 2.1% 100.0% Figure 14 shown on the next page is a historical comparison of the five-year development costs identified in previous NPIAS Reports. The year shown is the base year for the 5-year calculation (i.e., 2001 identified costs for 2001-2005). As shown below, each edition since 1980 reflected an increase in development needs, with a significant increase in 2001 followed by a decrease in 2005 reflecting the financial situation of airlines and airports.
National Plan of Integrated Airport Systems (2005-2009) 41

Figure 14: 5-Year Development Estimates from Published NPIAS Reports to Congress
8.7
24.0
29.7
35.1
46.2
39.5
0 5 10 15 20 25 30 35 40 45 50
1980
1990
1993
1998
2001
2005
Bas
e Ye
ar o
f Pub
lishe
d R
epor
t
Development Cost ($ billions current)
PROCESS
There are two sources of data for the NPIAS, airport master plans and state system plans. Airport master plans are the principal source. FAA field offices review these plans. They follow a standard outline contained in an FAA advisory circular that links development to current and forecast activity. The plans include consideration of all significant aviation requirements, including the needs of national defense and the postal service. Plans for major development, such as new runways or runway extensions, tend to be controversial and the planning process provides interested parties with the opportunity to request a public hearing. Proposed development items that are either not justified by the forecast of aviation activity, such as additional runways, or ineligible for Federal funding, such as hangars13, are screened by FAA planners and are not entered into the NPIAS database. The combination of a planning process that links development to activity, an FAA review that culls out unnecessary and ineligible development, and the discussion of controversial proposals at public hearings results in reasonable and well-documented estimates of future airport project requirements. However, the actual timing and cost of development may vary from airport master plans. For instance, projects may be deferred or developed in stages in order to reduce immediate costs, or conversely, an unexpected rapid increase in activity may justify accelerating certain development.
State system plans are also used as a data source for the NPIAS. The state system plan includes airport locations considered important to state air transportation objectives, as well as those that are 13 Vision 100 legislation changed eligibility for non-primary airports and allows non-primary entitlement funds to be
used for hangars, provided the FAA believes that the airport has an adequate plan for financing all airside needs.
42 National Plan of Integrated Airport Systems (2005-2009)
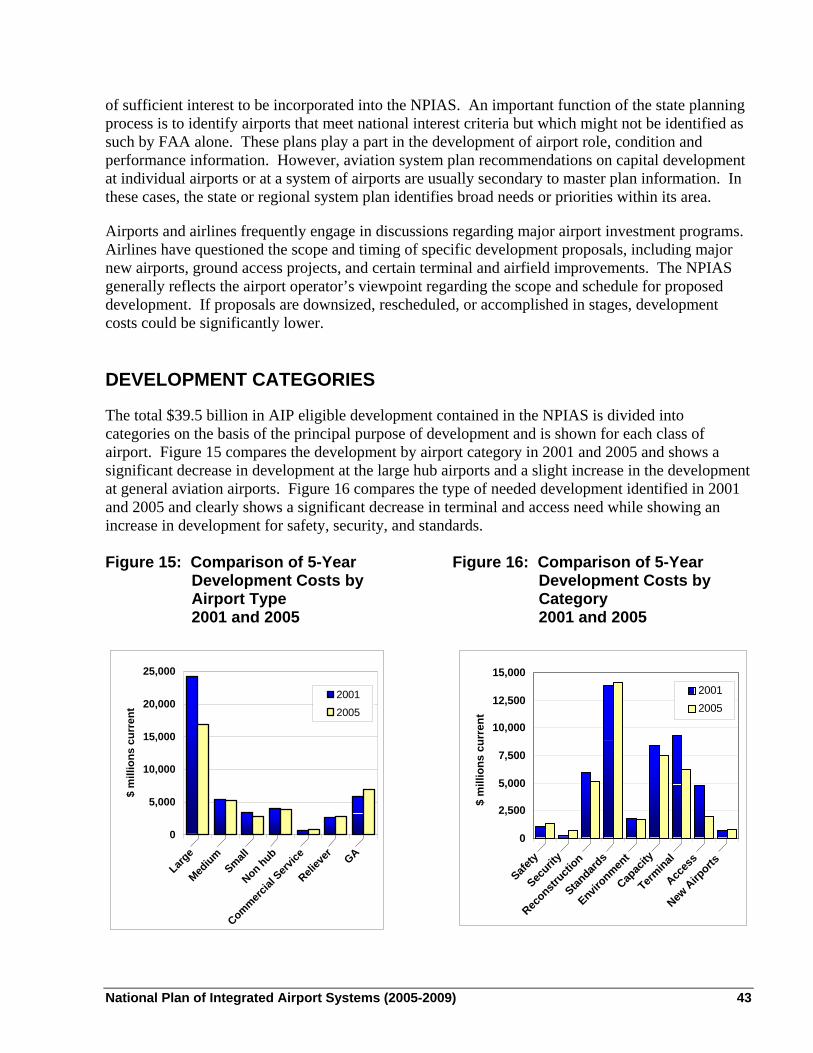
of sufficient interest to be incorporated into the NPIAS. An important function of the state planning process is to identify airports that meet national interest criteria but which might not be identified as such by FAA alone. These plans play a part in the development of airport role, condition and performance information. However, aviation system plan recommendations on capital development at individual airports or at a system of airports are usually secondary to master plan information. In these cases, the state or regional system plan identifies broad needs or priorities within its area.
Airports and airlines frequently engage in discussions regarding major airport investment programs. Airlines have questioned the scope and timing of specific development proposals, including major new airports, ground access projects, and certain terminal and airfield improvements. The NPIAS generally reflects the airport operator’s viewpoint regarding the scope and schedule for proposed development. If proposals are downsized, rescheduled, or accomplished in stages, development costs could be significantly lower. DEVELOPMENT CATEGORIES
The total $39.5 billion in AIP eligible development contained in the NPIAS is divided into categories on the basis of the principal purpose of development and is shown for each class of airport. Figure 15 compares the development by airport category in 2001 and 2005 and shows a significant decrease in development at the large hub airports and a slight increase in the development at general aviation airports. Figure 16 compares the type of needed development identified in 2001 and 2005 and clearly shows a significant decrease in terminal and access need while showing an increase in development for safety, security, and standards. Figure 15: Comparison of 5-Year
Development Costs by Airport Type 2001 and 2005
Figure 16: Comparison of 5-Year Development Costs by Category 2001 and 2005
0
5,000
10,000
15,000
20,000
25,000
Large
Medium
Small
Non hub
Commercial
Service
Reliev
er GA
$ m
illio
ns c
urre
nt
2001
2005
0
2,500
5,000
7,500
10,000
12,500
15,000
Safety
Securit
y
Reconstr
uction
Standard
s
Environmen
t
Capac
ity
Terminal
Acces
s
New A
irports
$ m
illio
ns c
urre
nt
20012005
National Plan of Integrated Airport Systems (2005-2009) 43
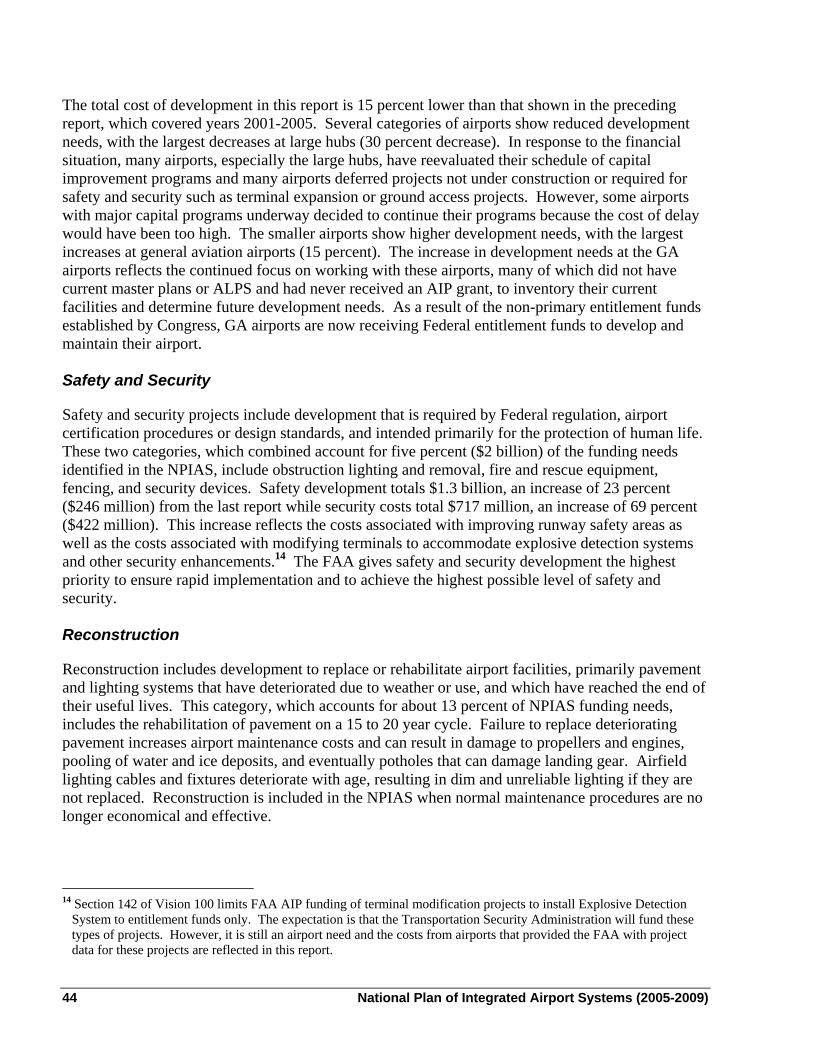
The total cost of development in this report is 15 percent lower than that shown in the preceding report, which covered years 2001-2005. Several categories of airports show reduced development needs, with the largest decreases at large hubs (30 percent decrease). In response to the financial situation, many airports, especially the large hubs, have reevaluated their schedule of capital improvement programs and many airports deferred projects not under construction or required for safety and security such as terminal expansion or ground access projects. However, some airports with major capital programs underway decided to continue their programs because the cost of delay would have been too high. The smaller airports show higher development needs, with the largest increases at general aviation airports (15 percent). The increase in development needs at the GA airports reflects the continued focus on working with these airports, many of which did not have current master plans or ALPS and had never received an AIP grant, to inventory their current facilities and determine future development needs. As a result of the non-primary entitlement funds established by Congress, GA airports are now receiving Federal entitlement funds to develop and maintain their airport. Safety and Security
Safety and security projects include development that is required by Federal regulation, airport certification procedures or design standards, and intended primarily for the protection of human life. These two categories, which combined account for five percent ($2 billion) of the funding needs identified in the NPIAS, include obstruction lighting and removal, fire and rescue equipment, fencing, and security devices. Safety development totals $1.3 billion, an increase of 23 percent ($246 million) from the last report while security costs total $717 million, an increase of 69 percent ($422 million). This increase reflects the costs associated with improving runway safety areas as well as the costs associated with modifying terminals to accommodate explosive detection systems and other security enhancements.14 The FAA gives safety and security development the highest priority to ensure rapid implementation and to achieve the highest possible level of safety and security. Reconstruction
Reconstruction includes development to replace or rehabilitate airport facilities, primarily pavement and lighting systems that have deteriorated due to weather or use, and which have reached the end of their useful lives. This category, which accounts for about 13 percent of NPIAS funding needs, includes the rehabilitation of pavement on a 15 to 20 year cycle. Failure to replace deteriorating pavement increases airport maintenance costs and can result in damage to propellers and engines, pooling of water and ice deposits, and eventually potholes that can damage landing gear. Airfield lighting cables and fixtures deteriorate with age, resulting in dim and unreliable lighting if they are not replaced. Reconstruction is included in the NPIAS when normal maintenance procedures are no longer economical and effective.
14 Section 142 of Vision 100 limits FAA AIP funding of terminal modification projects to install Explosive Detection
System to entitlement funds only. The expectation is that the Transportation Security Administration will fund these types of projects. However, it is still an airport need and the costs from airports that provided the FAA with project data for these projects are reflected in this report.
44 National Plan of Integrated Airport Systems (2005-2009)
Standards
Standards projects include development to bring existing airports up to design criteria recommended by the FAA. This is the largest development category, accounting for 36 percent of the NPIAS. Many commercial service airports were designed more than 50 years ago to serve relatively small and slow aircraft, but are now being used by larger and faster turboprop and jet aircraft. As a result, runways and taxiways must be relocated to provide greater clearance for aircraft with larger wingspans, and aircraft parking areas must be adapted to accommodate larger aircraft. Standards development at general aviation and reliever airports is generally justified to accommodate a substantial number of operations by “critical” aircraft with sizes and operating characteristics that were not foreseen at the time of original construction. If this work is not undertaken, aircraft may be required to limit fuel or passenger loads because of inadequate runway length. The FAA usually requires an indication that an aircraft type will account for at least 500 annual itinerant operations at an airport before development is included in the NPIAS to accommodate it. Environment
Environment includes development to achieve an acceptable balance between airport operational requirements and the expectations of residents of the surrounding area for a quiet and wholesome environment. This development supplements the large noise reductions that are being achieved by quieter aircraft and the use of noise abatement procedures. It accounts for four percent of NPIAS costs and includes the relocation of households and soundproofing of residences and public buildings in areas underlying aircraft approach and departure paths. Most of the cost is for land acquisition in fee simple (complete ownership) or easements (partial ownership) to compensate property owners for overflights. Environmental costs are concentrated at airports with frequent flights by jet aircraft (46 percent large hubs, 31 percent medium hubs, 12 percent small hubs, 4 percent non-hubs, and 4 percent reliever airports). This development is part of an extensive Federal and industry program, involving land use planning, quieter aircraft, and noise abatement procedures, that has reduced the estimated number of people exposed to significant noise. Terminal Building
Terminal building costs are incurred for development to accommodate more passengers and more or larger aircraft. This category accounts for 16 percent of the NPIAS, down from 20 percent, with many large hubs deferring terminal development. The NPIAS only includes the portion of terminals that is eligible for Federal aid (about 50 to 60 percent) and excludes revenue-generating areas15 used exclusively by a single tenant or concessions, such as gift shops and restaurants. The development is concentrated at the busiest commercial service airports (92 percent large hubs, three percent medium hubs, and three percent small hubs). Surface Access
Access includes the portion of airport ground access (highways and transit) that is within the airport property line and eligible for grants under the AIP. The large hubs account for 69 percent of the access development. It currently accounts for five percent of the NPIAS down from ten percent in
15 Non-hub primary airports and smaller public use airports can use AIP for revenue generating areas.
National Plan of Integrated Airport Systems (2005-2009) 45
the last report. This reflects the deferral of capital projects that resulted from the deteriorated financial situation at some airports. Airfield Capacity
Airfield capacity is development that will improve an airport for the primary purpose of reducing delay and/or accommodating more passengers, cargo, aircraft operations, or based aircraft. This is the second largest development category accounting for 19 percent of the NPIAS. Runway development that is warranted to relieve congestion but precluded because of political and environmental considerations is not included. The airfield capacity development included in this five-year plan will help to reduce congestion. However, problems will remain in certain large metropolitan areas such as New York and Chicago, and the FAA will continue to focus on the need for additional capacity at those locations. New Airports
New airports are recommended in the NPIAS for communities that generate a substantial demand for air transportation and either do not have an airport or have an airport that cannot be improved to meet minimum standards of safety and efficiency. This accounts for two percent of all NPIAS development. In addition, new commercial service and reliever airports are recommended for communities where existing airports are congested and cannot be expanded to meet the forecast demand for air transportation. No major new airports are foreseen during the next five years but a number of new reliever and general aviation airports along with a few small commercial service airports are proposed. Anticipated Sources of Funding
There are generally five sources of the funds used to finance airport development: airport cash flow, revenue and general obligation bonds, AIP grants, passenger facility charges, and state and local grants. Access to these sources of financing varies widely among airports, with some large airports maintaining substantial cash reserves while the small commercial service and general aviation airports often require subsidies from local and state governments to fund operating expenses and finance modest improvements. For the last three years funds available for AIP grants have exceeded $3.2 billion annually and PFC collections are exceeding $2 billion annually. Together, AIP grants and PFC collections account for about 40 percent of annual U.S. airport capital spending needs. Historically the combined resources have been adequate to achieve needed development. Since 1990, annual funding for airport development has been in the range of $5.5 billion to $7.3 billion. However, in 2002 the commercial service airports reported expenditures of $9.4 billion in airport development projects representing the total public spending, including projects eligible for AIP grants (NPIAS) and projects ineligible for AIP grants like automobile parking garages and hangars.16
16 Source: Airport Operating and Financial Summary FY 2002 (FAA Form 127).
46 National Plan of Integrated Airport Systems (2005-2009)
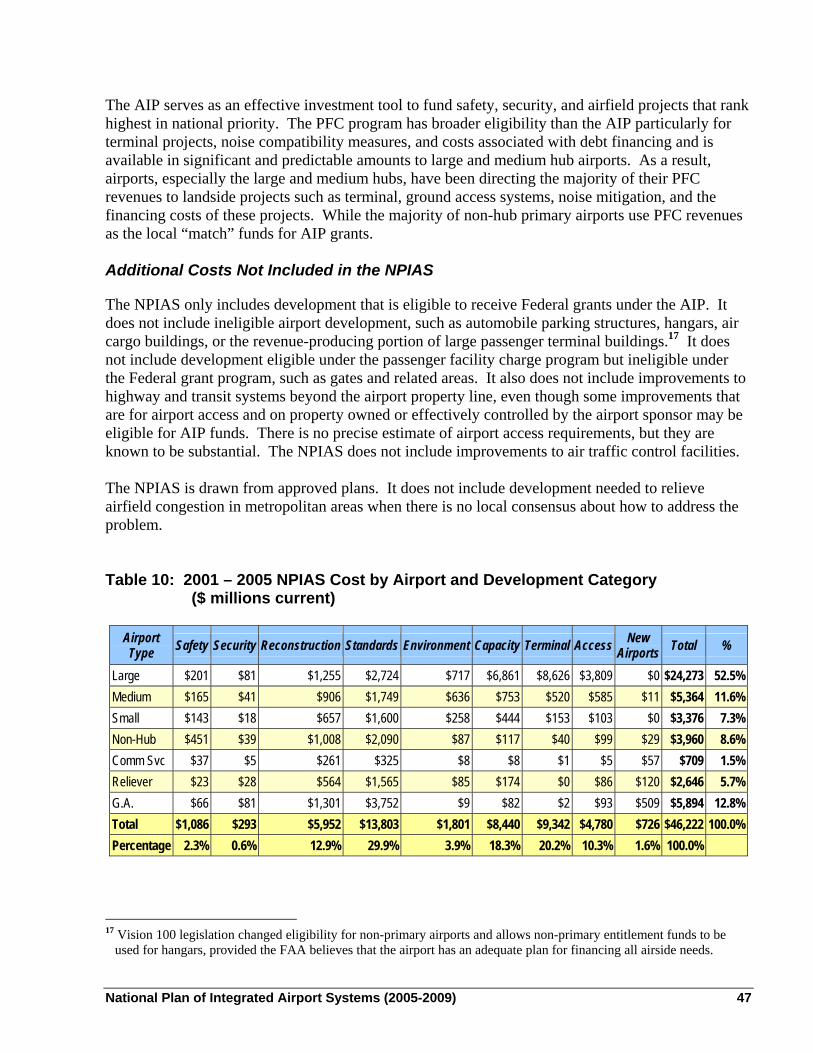
The AIP serves as an effective investment tool to fund safety, security, and airfield projects that rank highest in national priority. The PFC program has broader eligibility than the AIP particularly for terminal projects, noise compatibility measures, and costs associated with debt financing and is available in significant and predictable amounts to large and medium hub airports. As a result, airports, especially the large and medium hubs, have been directing the majority of their PFC revenues to landside projects such as terminal, ground access systems, noise mitigation, and the financing costs of these projects. While the majority of non-hub primary airports use PFC revenues as the local “match” funds for AIP grants. Additional Costs Not Included in the NPIAS
The NPIAS only includes development that is eligible to receive Federal grants under the AIP. It does not include ineligible airport development, such as automobile parking structures, hangars, air cargo buildings, or the revenue-producing portion of large passenger terminal buildings.17 It does not include development eligible under the passenger facility charge program but ineligible under the Federal grant program, such as gates and related areas. It also does not include improvements to highway and transit systems beyond the airport property line, even though some improvements that are for airport access and on property owned or effectively controlled by the airport sponsor may be eligible for AIP funds. There is no precise estimate of airport access requirements, but they are known to be substantial. The NPIAS does not include improvements to air traffic control facilities. The NPIAS is drawn from approved plans. It does not include development needed to relieve airfield congestion in metropolitan areas when there is no local consensus about how to address the problem. Table 10: 2001 – 2005 NPIAS Cost by Airport and Development Category
($ millions current)
Airport Type Safety Security Reconstruction Standards Environment Capacity Terminal Access New
Airports Total %
Large $201 $81 $1,255 $2,724 $717 $6,861 $8,626 $3,809 $0 $24,273 52.5% Medium $165 $41 $906 $1,749 $636 $753 $520 $585 $11 $5,364 11.6% Small $143 $18 $657 $1,600 $258 $444 $153 $103 $0 $3,376 7.3% Non-Hub $451 $39 $1,008 $2,090 $87 $117 $40 $99 $29 $3,960 8.6% Comm Svc $37 $5 $261 $325 $8 $8 $1 $5 $57 $709 1.5% Reliever $23 $28 $564 $1,565 $85 $174 $0 $86 $120 $2,646 5.7% G.A. $66 $81 $1,301 $3,752 $9 $82 $2 $93 $509 $5,894 12.8% Total $1,086 $293 $5,952 $13,803 $1,801 $8,440 $9,342 $4,780 $726 $46,222 100.0% Percentage 2.3% 0.6% 12.9% 29.9% 3.9% 18.3% 20.2% 10.3% 1.6% 100.0%
17 Vision 100 legislation changed eligibility for non-primary airports and allows non-primary entitlement funds to be
used for hangars, provided the FAA believes that the airport has an adequate plan for financing all airside needs.
National Plan of Integrated Airport Systems (2005-2009) 47

This page intentionally left blank.
48 National Plan of Integrated Airport Systems (2005-2009)
Appendix A: List of NPIAS Airports with 5-Year Forecast Activity and Development Cost
EXPLANATION OF TERMS AND ABBREVIATIONS USED IN THE APPENDIX A
City The city generally associated with the airport. Airport The official name of the airport or designated abbreviation. LOCID The unique airport location identifier for an airport. Role One of four basic airport service levels which describe the type of service that the
airport currently provides to the community and is anticipated to provide the community at the end of the five-year planning period. The service levels also represent funding categories for the distribution of Federal aid. New airports opening beyond the five-year period are not shown in Appendix A; however, any five-year costs associated with the development of these airports are included in Table 6.
PR Commercial Service – Primary CM Commercial Service – Non-Primary RL Reliever Airport GA General Aviation Airport Enpl The number of revenue passengers expected to be boarded at the airport during the
fifth year of the five-year planning period. Based Acft The number of locally owned aircraft expected to be hangared or based at the airport
at the end of the five-year planning period. Cost The estimated five-year costs for airport improvements that are eligible for Federal
development grants under the Airport Improvement Program. The costs identified are for development only; approximately $177 million in planning costs are excluded from the development estimates.
Note: The data presented in these tables were compiled as of November 2003. Current data for specific airports can be obtained from the appropriate FAA regional airports office, as listed in Appendix C.
National Plan of Integrated Airport Systems (2005-2009) A-1

This Page Intentionally Left Blank
A-2 National Plan of Integrated Airport Systems (2005-2009)
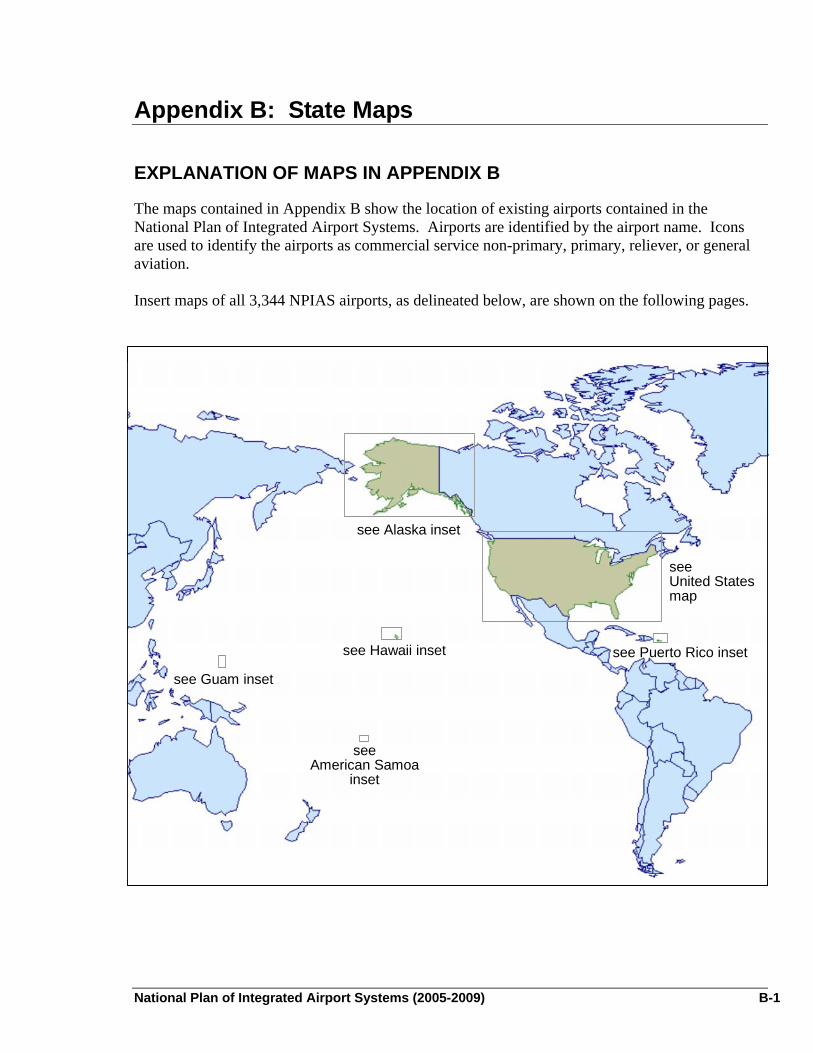
Appendix B: State Maps EXPLANATION OF MAPS IN APPENDIX B
The maps contained in Appendix B show the location of existing airports contained in the National Plan of Integrated Airport Systems. Airports are identified by the airport name. Icons are used to identify the airports as commercial service non-primary, primary, reliever, or general aviation. Insert maps of all 3,344 NPIAS airports, as delineated below, are shown on the following pages.
see Hawaii inset
see Alaska inset
see Guam inset
see United States map
see Puerto Rico inset
see American Samoa
inset
see Hawaii inset
see Alaska inset
see Guam inset
see United States map
see Puerto Rico inset
see American Samoa
inset
National Plan of Integrated Airport Systems (2005-2009) B-1
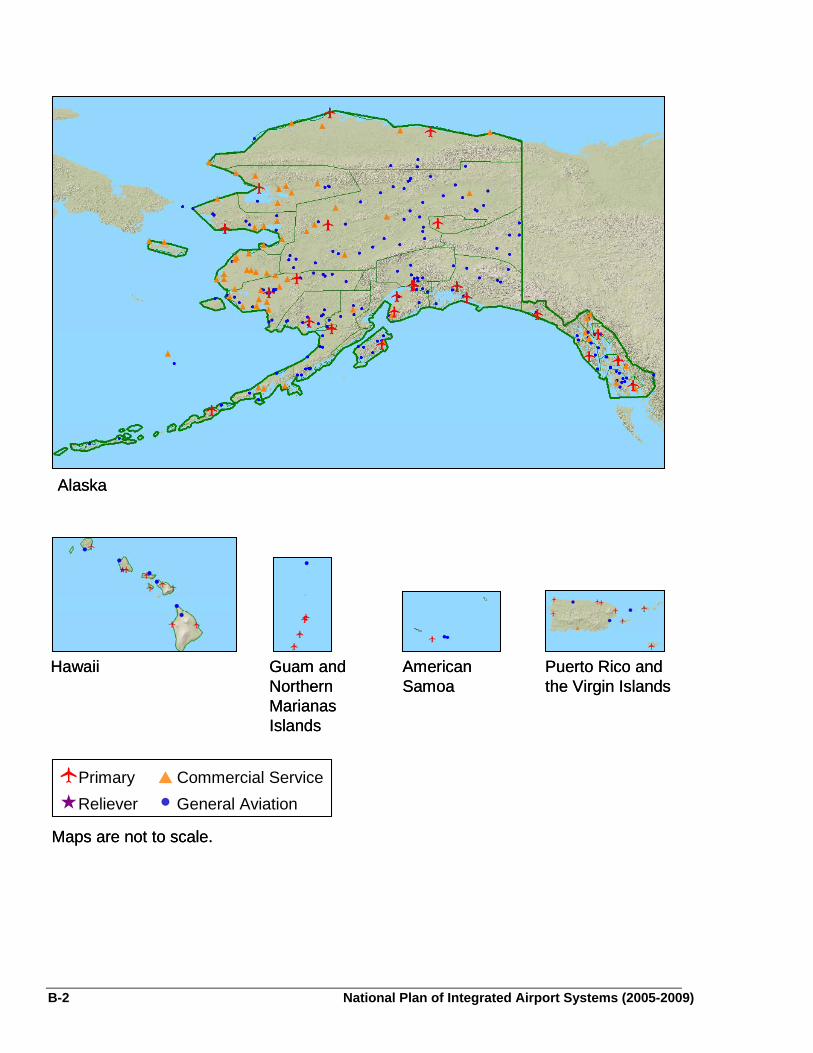
Primary Commercial ServiceReliever General Aviation
Hawaii Puerto Rico and the Virgin Islands
Guam and Northern MarianasIslands
Alaska
Maps are not to scale.
American Samoa
Primary Commercial ServiceReliever General AviationPrimary Commercial ServiceReliever General Aviation
Hawaii Puerto Rico and the Virgin Islands
Guam and Northern MarianasIslands
Alaska
Maps are not to scale.
American Samoa
B-2 National Plan of Integrated Airport Systems (2005-2009)
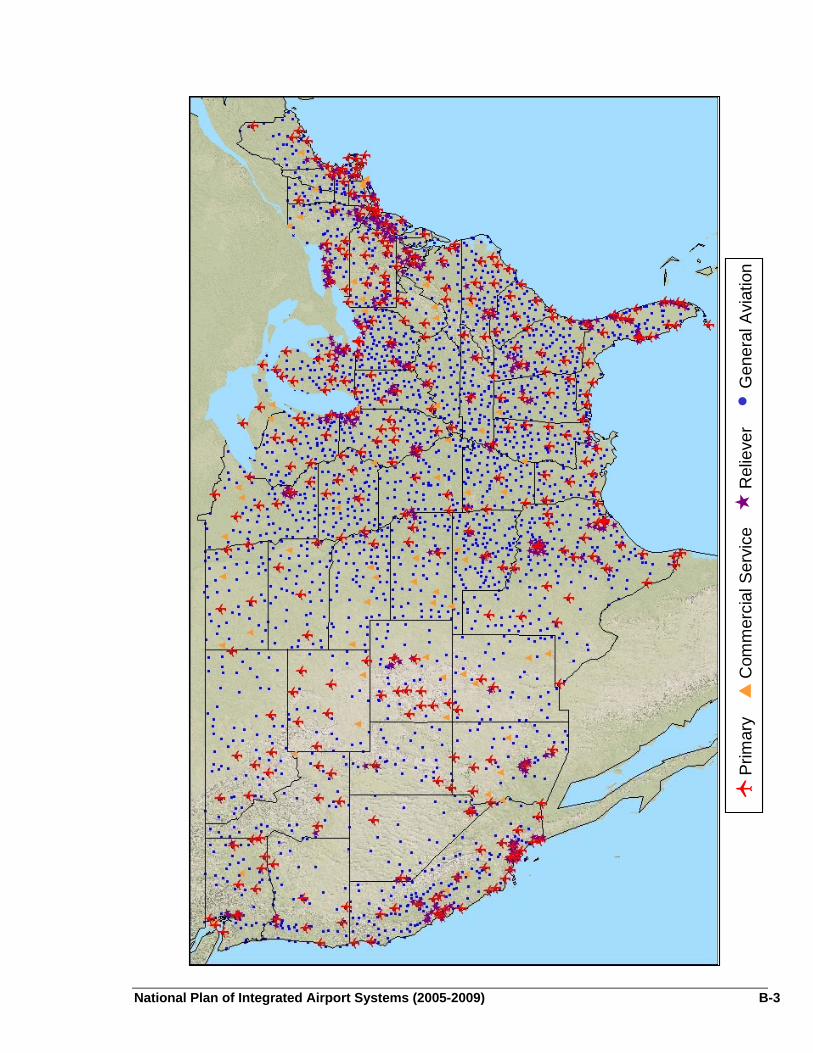
Prim
ary
Com
mer
cial
Ser
vice
Rel
ieve
r
G
ener
alA
viat
ion
Prim
ary
Com
mer
cial
Ser
vice
Rel
ieve
r
G
ener
alA
viat
ion
Prim
ary
Com
mer
cial
Ser
vice
Rel
ieve
r
G
ener
alA
viat
ion
National Plan of Integrated Airport Systems (2005-2009) B-3

B-4 National Plan of Integrated Airport Systems (2005-2009)
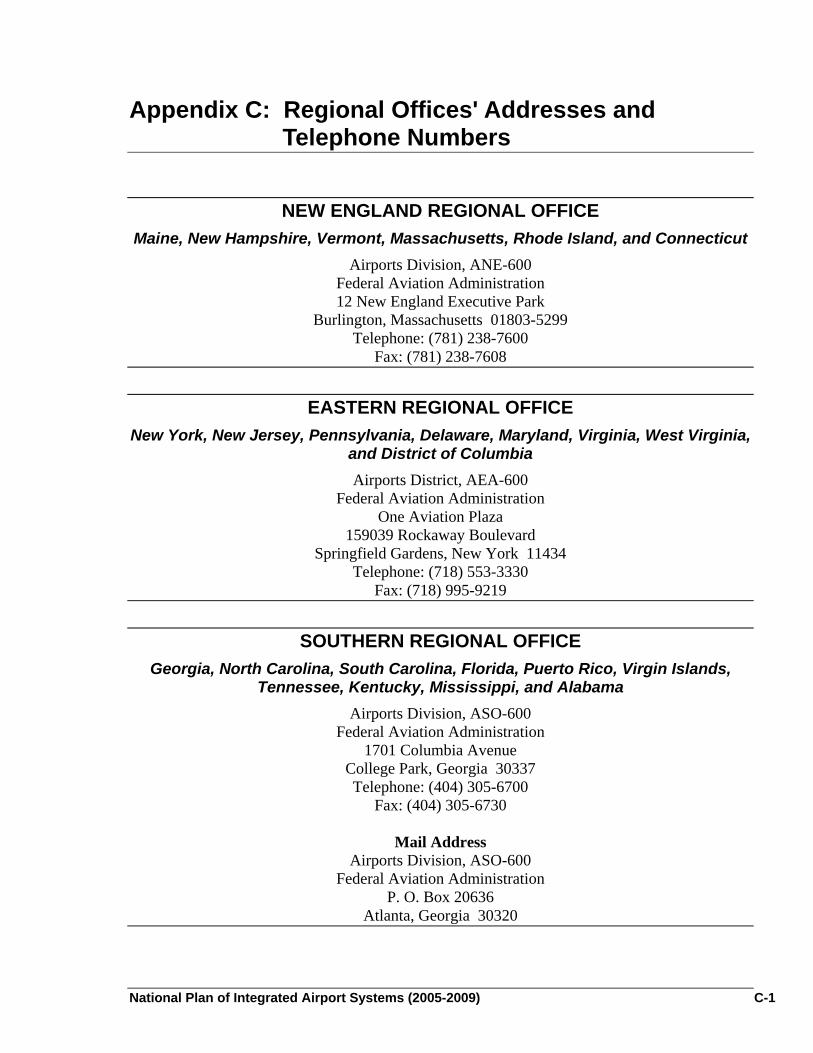
Appendix C: Regional Offices' Addresses and Telephone Numbers
NEW ENGLAND REGIONAL OFFICE Maine, New Hampshire, Vermont, Massachusetts, Rhode Island, and Connecticut
Airports Division, ANE-600 Federal Aviation Administration 12 New England Executive Park
Burlington, Massachusetts 01803-5299 Telephone: (781) 238-7600
Fax: (781) 238-7608
EASTERN REGIONAL OFFICE New York, New Jersey, Pennsylvania, Delaware, Maryland, Virginia, West Virginia,
and District of Columbia Airports District, AEA-600
Federal Aviation Administration One Aviation Plaza
159039 Rockaway Boulevard Springfield Gardens, New York 11434
Telephone: (718) 553-3330 Fax: (718) 995-9219
SOUTHERN REGIONAL OFFICE Georgia, North Carolina, South Carolina, Florida, Puerto Rico, Virgin Islands,
Tennessee, Kentucky, Mississippi, and Alabama Airports Division, ASO-600
Federal Aviation Administration 1701 Columbia Avenue
College Park, Georgia 30337 Telephone: (404) 305-6700
Fax: (404) 305-6730
Mail Address Airports Division, ASO-600
Federal Aviation Administration P. O. Box 20636
Atlanta, Georgia 30320
National Plan of Integrated Airport Systems (2005-2009) C-1
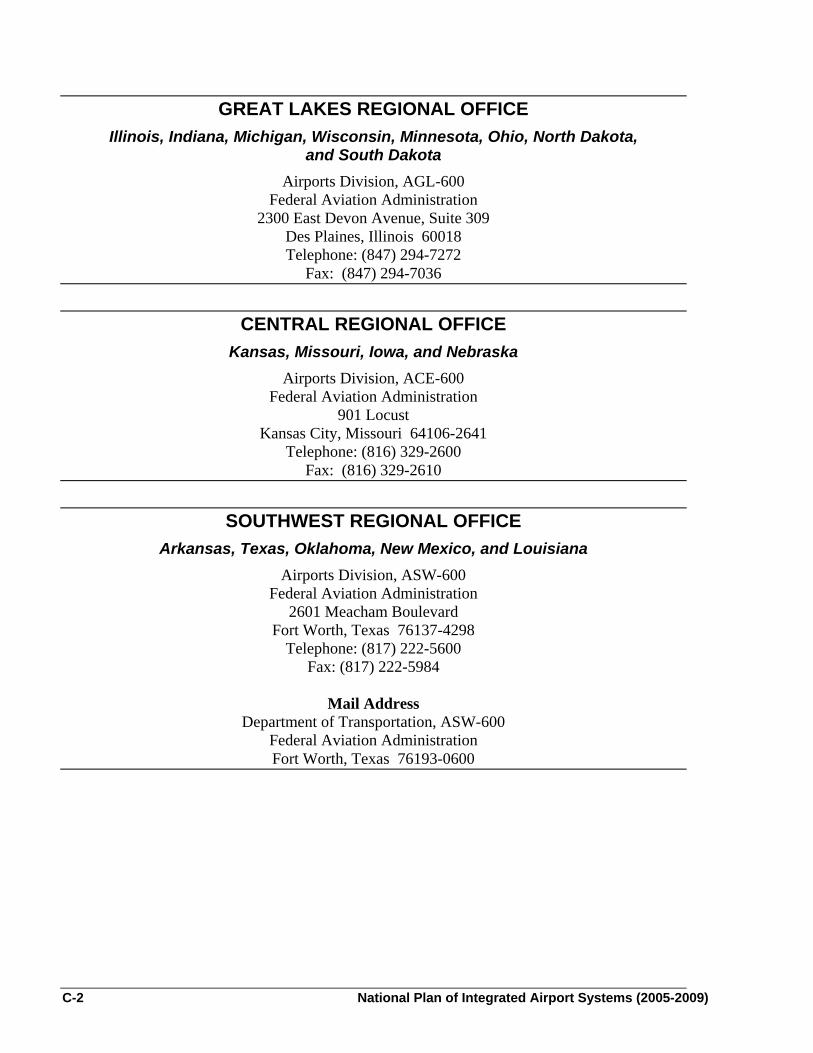
GREAT LAKES REGIONAL OFFICE Illinois, Indiana, Michigan, Wisconsin, Minnesota, Ohio, North Dakota,
and South Dakota Airports Division, AGL-600
Federal Aviation Administration 2300 East Devon Avenue, Suite 309
Des Plaines, Illinois 60018 Telephone: (847) 294-7272
Fax: (847) 294-7036
CENTRAL REGIONAL OFFICE Kansas, Missouri, Iowa, and Nebraska
Airports Division, ACE-600 Federal Aviation Administration
901 Locust Kansas City, Missouri 64106-2641
Telephone: (816) 329-2600 Fax: (816) 329-2610
SOUTHWEST REGIONAL OFFICE Arkansas, Texas, Oklahoma, New Mexico, and Louisiana
Airports Division, ASW-600 Federal Aviation Administration
2601 Meacham Boulevard Fort Worth, Texas 76137-4298
Telephone: (817) 222-5600 Fax: (817) 222-5984
Mail Address
Department of Transportation, ASW-600 Federal Aviation Administration Fort Worth, Texas 76193-0600
C-2 National Plan of Integrated Airport Systems (2005-2009)
WESTERN-PACIFIC REGIONAL OFFICE California, Arizona, Nevada, Hawaii, American Samoa, Guam, and
Commonwealth of Northern Marianas Islands Airports Division, AWP-600
Federal Aviation Administration 15000 Aviation Boulevard, Room 3012
Hawthorne, California 90261 Telephone: (310) 725-3600
Fax: (310) 725-6847
NORTHWEST MOUNTAIN REGIONAL OFFICE Washington, Idaho, Oregon, Colorado, Wyoming, Utah, and Montana
Airports Division, ANM-600 Federal Aviation Administration
1601 Lind Avenue, S.W., Suite 315 Renton, Washington 98055-4056
Telephone: (425) 227-2600 Fax: (425) 227-1600
ALASKAN REGIONAL OFFICE Alaska
Airports Division, AAL-600 Federal Aviation Administration
Anchorage Federal Office Building 222 West 7th Avenue, Box 14
Anchorage, Alaska 99513 Telephone: (907) 271-5438
Fax: (907) 271-2851
National Plan of Integrated Airport Systems (2005-2009) C-3