Embed Size (px)
Citation preview
Reforming Home Care Provision in Germany.
Evidence from a Social Experiment∗
Melanie Arntz†
ZEW Mannheim
Stephan L. Thomsen‡
OvG-University Magdeburg & ZEW Mannheim
This version: December 16, 2008
Abstract
In a long-run social experiment, personal budgets have been tested as an alternative tothe home care programs of the German long-term care insurance (LTCI). Due to extendingthe coverage beyond LTCI approved services and agencies, personal budgets may improvecare outcomes compared to the provision of in-kind services at a constant benefit level.This is a highly desirable result in light of the ongoing demographic challenge. However,personal budgets also compete with the less generous cash option of the LTCI. Any transitionfrom cash recipients to personal budgets increases LTCI spending, while care outcomesmay remain unchanged if informal caregivers are crowded out by formal care. This papercompares care outcomes of the different home care programs and provides a rough costanalysis from the perspective of the LTCI. While personal budgets improve care outcomescompared to in-kind services, the nationwide introduction of personal budgets increasesLTCI spending for former cash recipients without any traceable effect on care outcomes.
Keywords: consumer directed long-term care; long-term care insurance; crowding out; formal
and informal care
JEL Classification: I38, I12, C93
∗Financial support from the project “Evaluating the use of direct payments in the long term care of the elderly.A social experiment in the context of advancing the compulsory long term care insurance according to §8 IIISGB XI” is gratefully acknowledged. The usual disclaimer applies.†Melanie Arntz is Senior Research Fellow at Centre for European Economic Research (ZEW) Mannheim, L7,
1 D-68161 Mannheim, e-mail: [email protected], phone: +49 621 1235159, fax: +49 621 1235225.‡Stephan L. Thomsen is Assistant Professor of Labor Economics at Otto-von-Guericke-University Magde-
burg and Research Professor at ZEW, Mannheim. Address: Otto-von-Guericke-University, Department of Eco-nomics and Management, PO Box 4120, D-39016 Magdeburg, e-mail: [email protected], phone: +49 3916718431, fax: +49 391 6711700. Stephan L. Thomsen thanks the Stifterverband fur die Deutsche Wissenschaft(Claussen-Simon-Stiftung) for financial support.

1 Introduction
Recent projections of future long-term care expenditures demonstrate that the proportion of
GDP required to fund long-term care needs to rise substantially over the next decades in many
countries including Germany (Comas-Herrera, Wittenberg, Gori, Costa-Font, di Maio, Paxtot,
Pickard, Pozzi, and Rothgang, 2006).1 The driving forces behind that development are a strong
rise in the number of frail elderly and simultaneously shrinking numbers of informal carers due
to reduced and delayed childbearing, but also higher migration rates and increasingly fractured
social networks (see, for example, Pezzin and Schone, 1999, and Kotlikoff, 1989). Given that
most long-term care is currently provided by informal carers, this poses a challenge to maintain
a sufficient level of long-term care in the future since the number of persons demanding formal
home care or institutional care will rise.
In Germany, a non-means tested, mandatory social long-term care insurance provides supple-
mentary coverage for either home care or institutionalized care and for three levels of disability.
Home care recipients can choose between services in kind (agency services) and services in cash
that amount to half the benefit level of agency services, and a combination of the two. While
cash payments can be used at the full discretion of the person in need of care, agency services
are limited to an approved catalogue of services and a limited number of providers that have
been authorized by the LTCI. Currently, the majority of frail elderly in home care receive ben-
efits in cash (about 71% in 2006, German Federal Ministry of Health, 2007), while only about
14% and 15% of households receive agency services and mixed benefits, respectively. However,
a proceeding retreat of informal care is likely to rise the demand for agency services or institu-
tional care. Moreover, agency services are unlikely to fully meet care needs due to its limited
set of services and providers. This generates a further push factor towards costly institutional
care.1The expenditure of the universal, non-means tested long-term care insurance in Germany is projected to
increase from 1.24% of GDP in 2000 to 3.32% in 2050.
1
With the aim of reforming professional home care to better address care needs, the German
legislator therefore passed an amendment to test personal budgets (Pflegebudget) as an alterna-
tive to agency services. A personal budgets is a professionally assisted consumer-directed home
care program that grants the monetary value of agency services in cash for the purchase of any
care-related services, thus expanding the restricted catalogue of services and providers in case
of agency care. In addition, a personal care manager supports and monitors the decisions of the
care households. Consumer-directed home care programs similar to personal budgets can be
found in a number of countries including Austria, France, Netherlands, Norway, Sweden, United
Kingdom and the US, see Kodner (2003), Wiener, Tilly, and Cuellar (2003), Tilly and Wiener
(2001), or Lundsgaard (2005) for overviews. Compared to agency-directed care, evaluations of
similar consumer-directed programs in the US and the Netherlands as well as evaluations of the
consumer-directed cash option in the Austrian and German long-term care insurance suggest
that clients who self-direct their home care arrangement gain control and express a higher level
of satisfaction (Benjamin, Matthias, and Franke, 2000 and Foster, Brown, Phillips, Schore, and
Carlson, 2003, Miltenburg and Ramakers, 1999). Personal budgets may thus yield better care
outcomes for a given benefit level and may therefore help to postpone transitions from home
care to nursing homes.
From the perspective of the LTCI, personal budgets are thus considered as a potential cost
containment device. For this reason, personal budgets were tested in a long-run social experi-
ment in seven German counties between 2004 and 2008. However, personal budgets are a close
substitute for the cash payment that already provides the care household with a maximum of
discretion. If LTCI home care programs were supplemented by personal budgets, the LTCI
would face a situation of two competing consumer-directed home care programs one of which is
less generous, but somewhat less restrictive in coverage than the other. For recipients of cash
benefits, the more generous personal budget enables care households to potentially increase to-
tal service hours. Whether this happens, however, is an empirical question because a number of
2
empirical studies show that subsidized formal home care may crowd out informal care (Greene,
1983; Hanley, Wiener, and Harris, 1991; Ettner, 1994, Pezzin, Kemper, and Rechovsky, 1996,
Arntz and Thomsen, 2008). As a consequence, public spending on long-term care may rise while
total care provided remains constant (Grabowski, 2006).
The main purpose of this paper therefore is to assess the feasibility of extending the existing
LTCI home care programs by personal budgets. For this purpose, we first analyze the causal
effect of personal budgets on care outcomes for both agency care and cash payment recipients.
By exploiting the random assignment into a treatment group of personal budget recipients and
a control group of standard home care recipients, we estimate the effect on total care hours
as a proxy of the attained care level, and the contribution of formal and informal carers.2
Moreover, we identify the short-run effect of an introduction of personal budgets on LTCI
spending based on a number of scenarios concerning the prospective participation rates of
eligible LTCI recipients in personal budgets. In addition to this static analysis, we further
discuss potentially counteracting forces that could be effective in the long-run such as the
demographic transition, reduced administrative overhead and an increased stability of home
care. We examine the latter based on the self-assessed likelihood of moving to a nursing home.
The results indicate that personal budgets may improve care outcomes for former agency care
recipients. Moreover, we find a relevant shift of cash recipients to the personal budget for whom
a strong substitution of informal care by formal care increases LTCI spending, but does not
have any traceable effects on care outcomes. Personal budgets thus crowd out informal care
compared to a agency care, a result that is also relevant for international policy advisors in the
field of long-term care. We also find that despite a significant increase in the stability of home
care for personal budget recipients, LTCI spending rises in the short-run if the LTCI scheme
is extended by personal budgets. In the long-run, however, the demographic change towards2Formal and informal carers may be further distinguished. Informal carers, for example, comprise relatives
but also volunteers and friends, while formal cares consist of both approved agencies and independent providers.A detailed analysis of the effects of personal budgets can be found in Arntz and Thomsen (2008).
3
increasing numbers of agency care recipients works to the advantage of the personal budget.
The remainder is organized as follows: In the next section we provide some details on the home
care programs in comparison to the personal budget and introduce the design and data collection
of the Personal Budgets demonstration. Section 4 compares care outcomes of personal budgets
to the existing home care programs whereas section 5 presents the cost analysis of extending
the current LTCI scheme by a personal budget. The final section provides the conclusions.
2 German Long-Term Care Insurance (LTCI) and Personal Bud-
gets
The German social insurance scheme for long-term care (Social Long-Term Care Insurance,
LTCI) was introduced in 1995 to provide a supplementary coverage of care costs for persons in
need of long-term care. It is a mandatory and non means-tested insurance that covers about
90% of Germany’s population. Financing is arranged on a pay-as-you go system by social
security contributions of 1.95% to 2.15% of employee’s gross earnings. Persons in jobs not
subject to social security need to have coverage by a private long-term care insurance.3 Persons
are eligible for LTCI benefits if they are impaired in two or more activities of daily live (ADL)
and require help several times per week. With regard to the need of support, three levels of
disability are distinguished. Beneficiaries can choose between a nursing home and three home
care programs. The latter comprise the provision of services in cash (cash benefits) or services
in kind (agency services) that are only provided by agencies that have been authorized by the
LTCI. In addition, if the monthly claim for agency services is not exhausted the remaining
percentage can be granted as a cash benefit (mixed benefits). The amount of benefits granted
depends on the level of disability and the type of program chosen, since cash benefits are only
about half the level on cash benefits. In 2006, around a third of beneficiaries received nursing
home care, while the remaining 70% received one of the three home care programs.3For further information on German LTCI see, e.g., Wasem (1997) or Schulz, Leidl, and Konig (2004).
4
Due to the ageing of society doubts on the fiscal sustainability of German LTCI have been raised
since its introduction. On the one hand, the growing share of elderly persons in the population
leads to a growing share of frail persons with care needs. On the other hand, as home care
is mainly provided as family care, demographic change may reduce the number of informal
caregivers (for a corresponding projection see Schulz, Leidl, and Konig, 2004). Both reasons
may lead to a higher level of institutionalization even for persons with low levels of disability.
Since costs for institutionalized care exceed costs of home care for the highest disability level by
a factor of two, increasing the duration of care at home provides an important cost containment
device. According to forecasts of Kronberger Kreis (2005), Hacker and Raffelhuschen (2004)
and Herzog Commission (2003), contribution rates to LTCI of gross earnings would have to
triple in the next decades to maintain, ceteris paribus, the current level of support. With the
dual purpose of sustaining independent living of older persons and mitigating the impact of
the demographic transition on public expenditures for long-term care, the legislator therefore
passed an amendment of the LTCI law in 2002 as the legal basis for testing alternative benefit
schemes including personal budgets.
Personal budgets differ from current home care programs in a number of respects. First of all,
a personal care manager is employed who assists the client in organizing an adequate care plan,
monitors the adequacy of care provision and the compliance with the regulations. In addition,
compared to agency services that cover only a limited list of approved services and have to
be provided by an agency that is authorized by the LTCI4, personal budgets grant recipients
the monetary value of agency services as a cash payment and expand its use to any type
of care-related and legal services including the hiring of non-authorized, independent workers.
Compared to the cash option, personal budgets grant about twice the benefit level of the existing
cash option, but restrict its coverage. In particular, cash benefits can be considered as an income
supplement that can be used for any goods and services, while personal budgets can only be4These agencies have to fulfill certain criteria concerning the organization and quality of care.
5
used for care-related goods and services and also preclude the hiring of first-degree relatives, i.e.
spouses and children. Hence, personal budgets are a professionally-assisted consumer-directed
program, whereas cash benefits are a non-assisted consumer-directed program with a maximum
of discretion left to the client.
Depending on the former receipt of home care, we thus have different expectations regarding
the likely impact of personal budgets on care outcomes. In particular, results of an empirical
evaluation by Benjamin, Matthias, and Franke (2000) indicate that clients experience a higher
level of satisfaction due to self-directing the home care arrangement. In addition, consumer
directed-care tends to increase total service hours due to a missing overhead and lower fringe
benefits the hiring of independent workers is less costly than the hiring of agency workers. Since
in Germany prices for agency services are negotiated with the LTCI, independent providers may
also offer services at lower prices because of operating on a more competitive market for long-
term care services. Given the existing empirical evidence, personal budgets could therefore be
expected to yield better care outcomes per Euro of benefits granted by the German LTCI than
agency services. In particular, we expect cheaper independent providers to partially crowd out
authorized agencies in which case total hours of formal care would rise for a given constant
level of benefits. If we assume the quality of care provision to be comparable for agency and
independent workers, this could be interpreted as a rising level of care for a given level of
benefits.5
The monetary advantage of personal budgets compared to cash payments is likely to make
personal budgets an attractive alternative for at least some share of cash recipients. Moreover,
there likely is a substitution of informal by formal care. To illustrate this point it is useful to refer
to the model suggested by Stabile, Laporte, and Coyte (2006) whereby a household consisting of
a care recipient and a caregiver first decides on the optimal care level and subsequently decides5This may be a reasonable assumption since concerns regarding a lower quality of care provision in the case of
consumer-directed programs could not be confirmed in a number of studies (Badelt, Holzmann-Jenkins, Matul,and Osterle, 1997, Nemeth and Pochobradsky, 2004, and Schneekloth and Muller, 2000, Foster, Brown, Phillips,Schore, and Carlson, 2003).
6
on the optimal choice of informal care by family and friends, and privately and publicly funded
formal home care. If people exhaust the publicly available home care, but do not complement
home care by privately funding services, further subsidizing public home care should crowd out
informal care and increase the use of formal home care. In Germany, exhaustion of cash benefits
is guaranteed by design as recipients do not have to give any account on its usage. In addition,
care households heavily rely on informal care and the majority does not spend private funds on
formal home care (see e.g. Klie, 1999). By reducing the effective unit cost of public home care,
the personal budget is thus likely to crowd out informal care.6
3 The Personal Budget Demonstrations
The Personal Budgets demonstrations were conducted as a social experiment in seven German
counties between 2004 and 2008, launched on behalf of the association of compulsory health
insurers (Verband der deutschen Angestelltenkassen, VdAK).7 As a minimum requirement, in-
dividuals eligible to participate in personal budgets had to be eligible for LTCI benefits. In
addition, at five of the sites, access to personal budgets was granted only to home care recip-
ients with a share of agency services of at least 50%. Only at two sites, Neuwied and Erfurt,
individuals irrespective of the current choice of home care program were eligible to participate
in personal budgets. Participants of the social experiment were then randomly assigned to a
treatment group that received personal budgets with additional support from a care manager
and a control group that continued to receive agency care, cash benefits, or a combination of
both. Due to random assignment, characteristics that have an effect on care outcomes should
be balanced and observed differences in the outcome of interest between both groups reflect the6This result only holds if private and public home care are perfect substitutes. While this may not be true
for agency services, this assumption should hold for the personal budget.7Sites were chosen to include both rural and urban regions as well as regions in eastern and western Germany,
but cannot be considered to be representative for Germany as a whole. Still, the counties cover a wide range ofregions, from the rural and unemployment-struck Annaberg in eastern Germany to urban and prospering regionsin western Germany. The sites chosen for the experiment were: Annaberg, Erfurt, Kassel, Marburg-Biedenkopf,Munich, Neuwied, and Unna.
7
causal effect of the personal budget.8 The subsequent analyses are based on two data sets that
were collected among the participants of the demonstration project.
The participants’ panel. All participants have been interviewed semiannually over the en-
tire time period of the demonstration. Base interviews were conducted by local care managers
to collect information on the demographic and socioeconomic background of the elderly person
and his/her household as well as the current organisation of care. In addition, information was
collected on the care recipient’s abilities to accomplish basic activities of daily life (ADL) such
as dressing, preparation of food, housekeeping, being mobile, shopping etc., and the instrumen-
tal activities of daily life as well (IADL). In cases in which the care recipient was not able to
answer the survey on his own, the main carer, mostly a close relative, was asked to answer the
questionnaire instead.9 In the follow-up interviews repeated information was collected on all
time-varying characteristics.
Table 1 contains the number of available treatment and control group interviews by the type
of former benefit receipt. First of all, note that there are more than 300 base interviews in
the treatment group and only 150 in the control group. This excessive assignment into the
treatment group is due to the fact that random assignment had been suspended during the
early in-take period. As this may have introduced selection, we take account of the suspension
in the estimations below. Second, despite the fact that the intake of former cash recipients was
restricted to two sites, Table 1 demonstrates that a high number of participants formerly re-
ceived cash payments. As previously hypothesized, personal budgets thus seem to be attractive
to at least some share of former cash recipients. In fact, in the two counties where program eli-
gibility was not restricted to recipients of agency services, the share of home care recipients who
participated in the demonstration was 5.5% among recipients of agency services, 3.5% among8See Arntz and Thomsen (2008) for a further discussion of the social experiment of personal budgets.9Around 30 % of the interviews could be conducted with the care recipient only. In 50% of the cases, the
interview was conducted with both the care recipient and the main carer, while 20% of the interviews were pureproxy interviews with the main carer.
8
mixed benefit recipients and 3.4% among cash benefit recipients. Among those who contacted
local program organizers for further information on personal budgets, 40% of all agency care
recipients, 44% of all mixed benefit recipients, and 32% of all cash benefit recipients decided
to participate in the program. On the one hand, these figures suggest that personal budgets
are not equally attractive to all home care recipients. On the other hand, the participation
rates imply that the share of former cash recipients opting for program participation in order
to receive the personal budget is not negligible and only somewhat lower than the participation
rate for recipients of agency services.
Table 1: Number of Treatment and Control Group Interviews by FormerBenefit Receipta
Former benefit receipt Treatment group Control groupbase fup6 fup12 fup18 base fup6 fup12 fup18
Agency care 122 99 79 59 39 25 17 10Cash payment 94 73 56 45 66 43 22 13Mixed benefits 58 44 32 18 25 14 8 4Initial claim 36 28 18 10 19 12 4 3Total 310 244 185 132 149 94 51 30a fupx = follow up interview after x months.
Sample descriptives for the base interview can be found in Table A.1 in the Appendix. At least
for some characteristics – e.g., the county of residence, age, pre-treatment care arrangement
– we do find some imbalances between both sub-groups that suggest that randomization was
incomplete. Moreover, binary probit models of the probability of assignment to the treatment
group confirm that randomization may have been incomplete as some socio-demographic vari-
ables and an individual’s care needs significantly affect the probability of being in the treatment
group.10
The supplementary survey in Neuwied. To complement the participant’s panel with
further evidence on aspects not covered in the panel data set, a supplementary survey was
conducted in Neuwied in 2007. Neuwied was chosen because of the unrestricted eligibility10See Arntz and Thomsen (2008) for a detailed analysis of randomization and a discussion of possible solutions.
9
of program participation among home care recipients. Among the 109 individuals who were
actively participating in the program during summer 2007, 89 agreed to be interviewed. The
sample is thus small. As interviews have been conducted by independent interviewers in both
groups, the survey opened up the chance of asking participants for their opinion on the personal
budget, the relief or burden it meant to them and their families, and the relevance of care
managers.
Furthermore, the participant’s panel had proved to be an infeasible tool for analyzing the sta-
bility of home care arrangements, as the state of transition (e.g. nursing home, death) was
unknown for many attrited individuals. We could thus not establish whether personal bud-
gets prolonged the time that an individual can be cared for at home. For this reason, the
supplementary survey included a number of questions on the subjective assessment of partici-
pants concerning inevitable movement to a nursing home in a number of hypothetical situations
(e.g. loss of main caregiver).
Sample descriptives for the Neuwied survey can be found in Table A.2 in the Appendix. Com-
pared to the sample of all participants, the Neuwied sample includes a higher share of former
cash recipients due to the fact that eligibility was not restricted to recipients of agency care.
Thus, the sample is more likely to reflect the future composition of personal budget recipients
than the participant’s panel as eligibility would not be restricted in case of extending the LTCI
scheme by personal budgets. Moreover, we do not find any evidence for significant differences
in observable characteristics between the program and control group as shown in Table A.2.
Hence, differences in the outcomes of interest between both groups can be interpreted as causal
effects of personal budgets.
10
4 Effects on home care arrangements
4.1 Some methodological notes
As discussed in section 2, personal budgets correspond to very different treatments depending
on the benchmark home care program and thus motivate different hypotheses with regard to
the effects they exert on care arrangements and care outcomes. Therefore, evaluation of the
effects has to take account of the different effects with regard to the benefit type of the control
group. As mentioned above, there may be some self-selection due to the suspension of the
randomization in the early intake period in the participants’ panel. A detailed analysis and
discussion of methodological issues is provided in Arntz and Thomsen (2008). While selection
on observables can be taken care of by including relevant characteristics as covariates, there
is also some evidence for selection on unobservables because pre-program care arrangements
significantly affect the probability of being treated despite controlling for observable individual
and household characteristics. Moreover, asymmetric non-random panel attrition between both
groups should be considered. The control group does not directly benefit from participating in
personal budgets group and is therefore more likely to leave the experiment. A probit model
of the probability of participation in the follow-up interviews revealed that panel attrition is
indeed systematically related to a number of individual and household-related characteristics.
Therefore, it does not suffice to evaluate the impacts of the personal budget by comparing
average care outcomes between the treatment and control group based on the participants’
panel. The fundamental assumption that randomization of participants into treatment and
control group identifies the causal effect of treatment may be not completely satisfied.11 The
subsequent analysis thus takes account of both a selection into the treatment group as well
as non-random panel attrition by applying a difference-in-differences approach (DiD, see e.g.
Ashenfelter and Card, 1985) that disentangles the causal impact of the personal budget from the11See Orr (1999) and Smith (2000) for a comprehensive discussion of social experiments and Bijwaard and
Ridder (2005) and Heckman and Smith (1995) for a discussion of possible sources for biases.
11
pre-program differences in outcomes for the treatment and the control group and the changes in
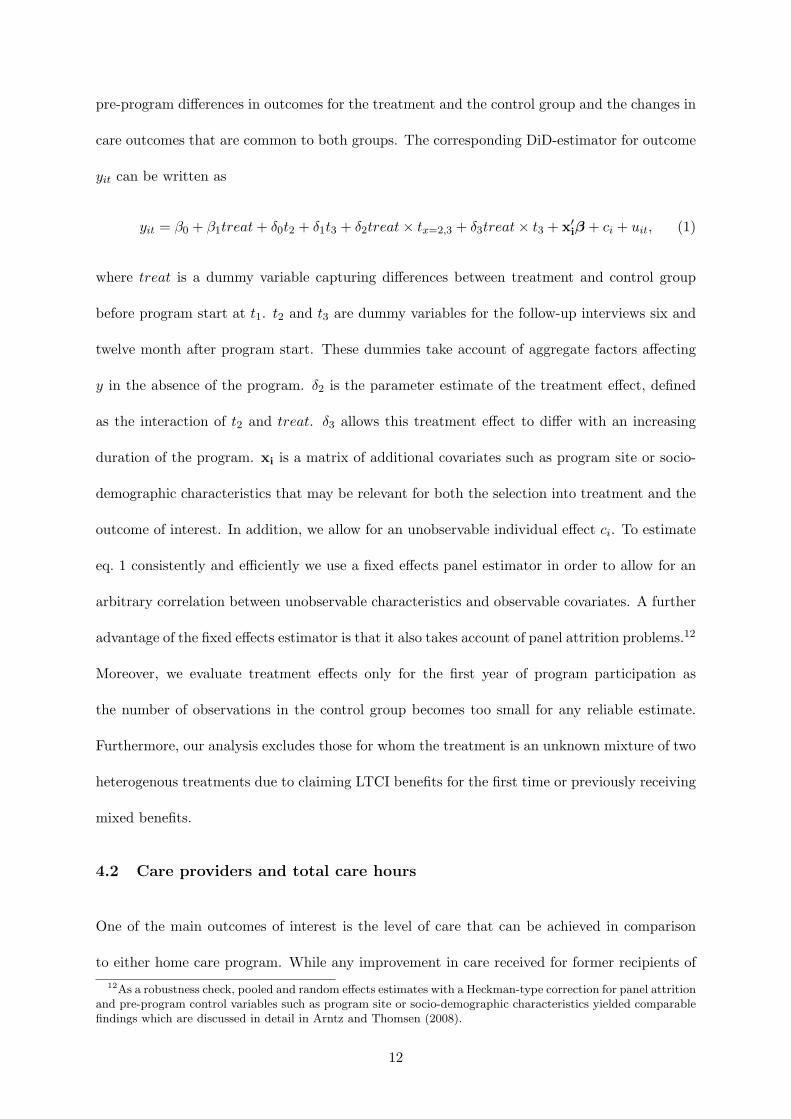
care outcomes that are common to both groups. The corresponding DiD-estimator for outcome
yit can be written as
yit = β0 + β1treat+ δ0t2 + δ1t3 + δ2treat× tx=2,3 + δ3treat× t3 + x′iβ + ci + uit, (1)
where treat is a dummy variable capturing differences between treatment and control group
before program start at t1. t2 and t3 are dummy variables for the follow-up interviews six and
twelve month after program start. These dummies take account of aggregate factors affecting
y in the absence of the program. δ2 is the parameter estimate of the treatment effect, defined
as the interaction of t2 and treat. δ3 allows this treatment effect to differ with an increasing
duration of the program. xi is a matrix of additional covariates such as program site or socio-
demographic characteristics that may be relevant for both the selection into treatment and the
outcome of interest. In addition, we allow for an unobservable individual effect ci. To estimate
eq. 1 consistently and efficiently we use a fixed effects panel estimator in order to allow for an
arbitrary correlation between unobservable characteristics and observable covariates. A further
advantage of the fixed effects estimator is that it also takes account of panel attrition problems.12
Moreover, we evaluate treatment effects only for the first year of program participation as
the number of observations in the control group becomes too small for any reliable estimate.
Furthermore, our analysis excludes those for whom the treatment is an unknown mixture of two
heterogenous treatments due to claiming LTCI benefits for the first time or previously receiving
mixed benefits.
4.2 Care providers and total care hours
One of the main outcomes of interest is the level of care that can be achieved in comparison
to either home care program. While any improvement in care received for former recipients of12As a robustness check, pooled and random effects estimates with a Heckman-type correction for panel attrition
and pre-program control variables such as program site or socio-demographic characteristics yielded comparablefindings which are discussed in detail in Arntz and Thomsen (2008).
12
agency services can be traced back to a combination of extending the allowed range of services
and providers and the assistance of the care managers, any changes in care outcomes for former
recipients of cash benefits are due to a combination of the doubling of expenditures, the exemp-
tion of reimbursing close relatives and the assistance of a care manager. As a result, personal
budgets are likely to affect the composition of caregivers involved in the care arrangement.
In particular, we expect a partial substitution of agency by independent care providers for
previous recipients of agency services so that total hours of care provided per week may increase.
For former cash recipients, independent workers are likely to substitute for informal support and
the expected effect on total hours of care is unclear. For former cash and agency care recipients,
we therefore examine the extent of support by informal and formal caregivers measured in log
care hours per week as well as the log total care hours provided per week. For lack of a better
measure, the latter proxies for the achieved level of health and care. We thus implicitly assume
one hour of care to be comparably effective for all types of carers. A similar assumption is used
by other studies as well, see, e.g., van Houtven and Norton (2008). However, it should be noted
that this is a quite strong assumption. Hours do not capture the quality of caregiving, and
there may be productivity differences between formal and informal carers. In the ideal case,
one would like to estimate effects in terms of standardized care hours. Unfortunately, there is
no information in the data allowing to define an adequate weighting scheme.
Based on the participant’s panel and the previously described difference-in-differences approach,
Table 2 presents the corresponding estimates for former cash and agency care recipients. As
expected, the effect of personal budgets tend to differ depending on the respective counterfactual
situation. Compared to agency services, personal budgets imply an increase in the number of
formal care hours provided by about 37 percent. This increase is possible because budget
recipients can also engage independent formal providers that may be cheaper compared to
authorized agencies. If we assume that independent providers fulfill care tasks with a similar
level of quality to agency workers, this indicates that personal budgets enable a significant
13
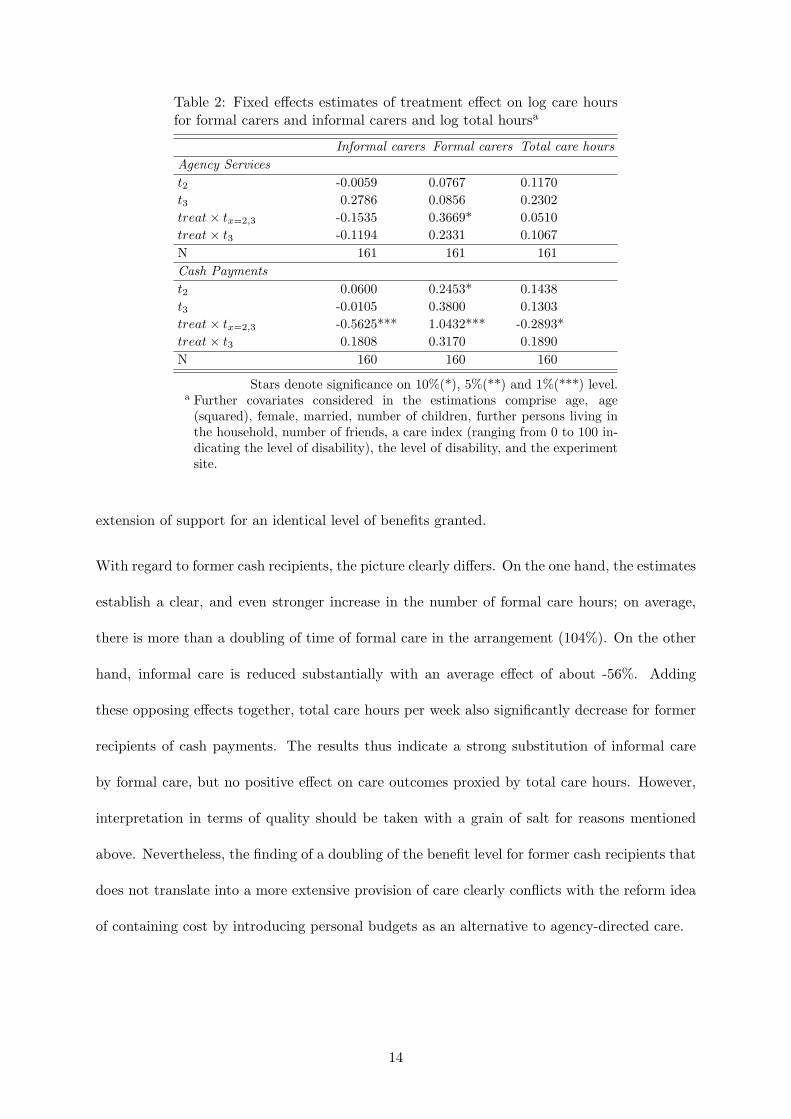
Table 2: Fixed effects estimates of treatment effect on log care hoursfor formal carers and informal carers and log total hoursa
Informal carers Formal carers Total care hoursAgency Servicest2 -0.0059 0.0767 0.1170t3 0.2786 0.0856 0.2302treat× tx=2,3 -0.1535 0.3669* 0.0510treat× t3 -0.1194 0.2331 0.1067N 161 161 161Cash Paymentst2 0.0600 0.2453* 0.1438t3 -0.0105 0.3800 0.1303treat× tx=2,3 -0.5625*** 1.0432*** -0.2893*treat× t3 0.1808 0.3170 0.1890N 160 160 160
Stars denote significance on 10%(*), 5%(**) and 1%(***) level.a Further covariates considered in the estimations comprise age, age
(squared), female, married, number of children, further persons living inthe household, number of friends, a care index (ranging from 0 to 100 in-dicating the level of disability), the level of disability, and the experimentsite.
extension of support for an identical level of benefits granted.
With regard to former cash recipients, the picture clearly differs. On the one hand, the estimates
establish a clear, and even stronger increase in the number of formal care hours; on average,
there is more than a doubling of time of formal care in the arrangement (104%). On the other
hand, informal care is reduced substantially with an average effect of about -56%. Adding
these opposing effects together, total care hours per week also significantly decrease for former
recipients of cash payments. The results thus indicate a strong substitution of informal care
by formal care, but no positive effect on care outcomes proxied by total care hours. However,
interpretation in terms of quality should be taken with a grain of salt for reasons mentioned
above. Nevertheless, the finding of a doubling of the benefit level for former cash recipients that
does not translate into a more extensive provision of care clearly conflicts with the reform idea
of containing cost by introducing personal budgets as an alternative to agency-directed care.
14

4.3 Stabilization of home care arrangements
Besides the short-term effects of personal budgets on the structure and extent of care provision,
there may be long-run effects on the stability of home care arrangements. To the extent that
improving care outcomes and/or the relief of relatives make a care arrangement more robust
to shocks such as a deteriorating health status of the frail elderly, the observed changes in the
previous section may help contain costs in the medium to long-run by avoiding or postponing
transitions from home to institutionalized care.
In order to assess the effect of personal budgets on the duration of home care provision until
a transition to a nursing home occurs, we use information from the supplementary survey in
Neuwied on the subjective perception of frail elderly and their households regarding the stability
of their home care arrangements. In order to assess the risk of institutionalization, respondents
were asked whether they thought that continued home care was possible in case their health
status would deteriorate. In addition, they had to name all care providers involved in their care
arrangement and to separately assess the likelihood of moving to a nursing home in case any of
these had to stop caring.
Table 3: Share of home care recipients in the program and control group whoreport a likely transition to a nursing home in case of deteriorating health orthe loss of caregivers
Number of casesa Share of positive answers χ2 − Test
Treaties Controls Treaties Controls p-value
SociodemographicsDeteriorating health status 58 27 73.8% 26.9% 0.15Loss of main caregiver 59 29 57.6% 55.2% 0.83Loss of further caregiver 61 28 11.5% 28.6% 0.05a Number of observations for the loss of caregivers may depart from sample size
because of reflecting answers for each caregiver involved in the care arrangements.
Table 3 presents the responses of individuals in the treatment and control group and tests for
equal responses. Since there is no evidence for a selection into the treatment group in our
Neuwied sample, differences between both groups can be interpreted as the causal effect of the
15
personal budget. Hence, personal budgets seem to make home care arrangements more robust,
but there also seem to be limits to this stabilizing effect. In particular, if the main caregiver
who is mostly a close relative is no longer able to care for the frail elderly, almost 60% of
the respondents irrespective of their current home care program indicate that staying at home
would be infeasible. Thus, the main caregiver plays a central role in enabling the frail elderly to
receive home care and the personal budget does not seem to affect this perception significantly.
In contrast, caregivers who are not considered to be main caregivers and who often are formal
caregivers seem to be substitutable to a higher degree. Only 12% among those receiving the
personal budget, but 29% among those receiving standard home care programs consider it
necessary to move to a nursing home if these additional caregivers could no longer provide any
care services. This significant difference indicates that personal budget recipients are better
prepared to maintain their home care arrangement at least in case of minor shocks such as the
loss of a less important caregiver. In addition, only 14% of those receiving personal budgets, but
27% of those receiving standard home care programs report that a deteriorating health would
necessitate a move to a nursing home. The corresponding difference between both groups misses
significance though and may at most be considered as a weak evidence in favour of an increasing
robustness of home care arrangements in case of personal budgets.
Tentatively, we can thus conclude that there is some evidence that suggests a higher degree
of robustness of home care arrangements among recipients of personal budgets compared to
recipients of standard home care programs. Unfortunately, the small sample size precludes any
decomposition of these results by the type of former home care program received. Moreover,
note that the sample is dominated by former cash recipients and may thus mainly reflect the
effect of personal budgets as compared to the receipt of cash benefits. Whether personal budgets
sufficiently postpone transitions to nursing homes to carry the additional LTCI spending on the
higher benefit levels in the long run cannot be derived from this descriptive finding. In the
subsequent cost analysis, however, we will return to this question.
16
5 Short-term effects of introducing personal budgets on LTCI
spending
From the perspective of the LTCI, the feasibility of introducing personal budgets as an addi-
tional home care program strongly hinges on its cost effects both in a short- and in a long-run
perspective. In the short run, cost differences between the current and the counterfactual home
care provision mainly arise from former cash recipients who opt for personal budgets in case
of an extended LTCI system. Additional costs stem from the mandatory care management for
each personal budget recipient. In order to identify a lower bound and an upper bound of the
short-term effect on LTCI spending for home care grants, we use a number of plausible sce-
narios for the prospective numbers and composition of personal budget recipients with regard
to the counterfactual program receipt and the level of disability that is granted. In addition,
several scenarios bound the likely costs that arise from care management. We then compare
the resulting costs of this counterfactual LTCI system to the LTCI spending on standard home
care provision of the reference year, 2007.
After presenting the estimated short-term costs, we further discuss the likely long-run effects
as well as the likely impact of administrative cost factors. In particular, we discuss two main
factors that may reduce additional cost that stem from an introduction of personal budgets
in the long-run: the stabilization of home care arrangements and the long-term transition to
decreasing numbers of cash recipients.
5.1 Definition of scenarios
The starting point of the short-run cost analysis is the status quo of the current LTCI system
for home care provision. As the benchmark, we choose the number and composition of home
care recipients as reported by the Federal Statistical Office for 2007 as shown in Table 4.
17

Table 4: German home care recipients by type of program and levelof dependency in 2007
Level of care needsb Agency services Mixed benefitsc Cash benefitsLevel I 144,162 95,924 597,751Level II 83,916 89,021 301,605Level III 18,142 34,827 81,069a Source: Federal Statistical Office, 2007.b As a simplification, care level III+ is not taken into account.c Mixed benefits refer to a 75% receipt of agency services.
The figures show that most recipients are eligible for the lowest care level. Irrespective of the
level of care, frail elderly are much more likely to receive cash benefits compared to agency
services or mixed benefits. Moreover, a higher level of care coincides with an increasing share
of mixed benefit recipients as the reverted relation between agency services and mixed benefits
indicates. Assessing the costs for the standard home care programs is straightforward based
on the known and fixed benefit levels. For estimating the counterfactual costs of an extended
LTCI system, we need to predict the transition probability to personal budgets for each of the
nine cells of the reference situation in Table 4. Moreover, we need to take account of additional
care management cost. We now discuss these aspects successively.
Transition probability to personal budgets. Observed participation rates in the demon-
stration provide an empirical starting point for predicting transition probabilities from standard
home care programs to personal budgets. Of course, any prediction based on a demonstration
at a limited number of sites and a relatively small sample comes with some degree of uncer-
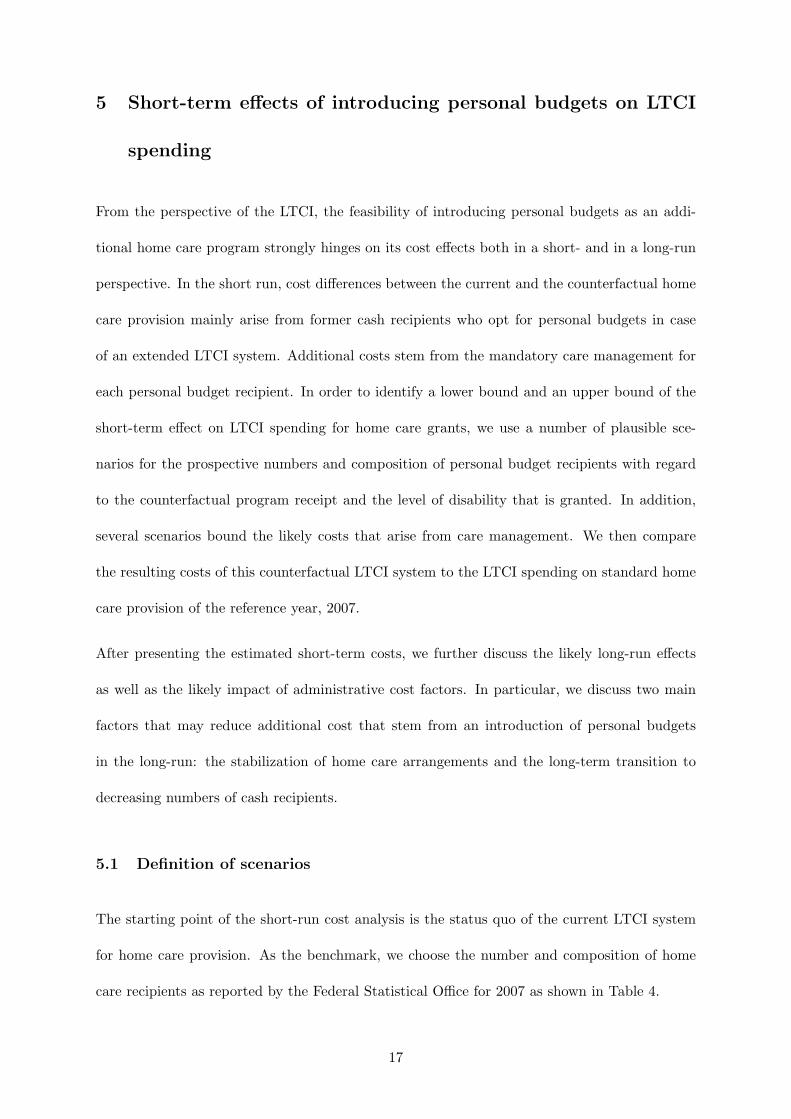
tainty. We therefore use three alternative scenarios as shown in Table 5 to bound the transition
probabilities for home care recipients between a likely lower and upper bound.
Observed participation rates among local home care recipients at the two sites with no re-
strictions to program eligibility form the basis for the first two scenarios. However, observed
participation rates in relation to all potentially eligible local home care recipients are likely to
be an underestimation of the true participation rate. Although major LTCI providers contacted
18
eligible recipients via an information letter and there have been public meetings to inform local
home care recipients about the program, not all eligible persons are likely to have known or
perceived the program as an option that they seriously considered as an alternative to their
current home care provision.
Table 5: Predicted transition rate to personal budgets by the type of home careprogram and level of dependency, three scenariosa
Level of care needsb Agency services Mixed benefitsc Cash benefits TotalScenario I: Participation rate among local home care recipients, program known to 50%Level I 13.3% 7.1% 6.6% 7.7%Level II 7.7% 8.2% 6.9% 7.3%Level III 8.4% 4.7% 8.3% 7.3%Total 11.3% 7.1% 6.9% 7.5%Scenario B: Participation rate among local home care recipients, program known to 25%Level I 26.6% 14.1% 13.3% 15.4%Level II 15.4% 16.3% 13.9% 14.5%Level III 16.8% 9.3% 16.6% 14.6%Total 22.5% 14.2% 13.7% 15.0%Scenario C: Participation rate among those contacting local care managers for informationLevel I 52.4% 47.8% 31.1% 36.7%Level II 30.4% 55.3% 32.5% 36.4%Level III 33.2% 31.4% 38.8% 36.1%Total 44.4% 48.1% 32.1% 36.5%a All scenarios are based on observed participation rates at the two site with an unrestricted
program eligibility among local home care recipients (Neuwied and Erfurt). See text forfurther details.
As a minimum scenario, we thus relate the number of participants to only half the local home
care recipients. In other words, we consider every second individual to have enough information
to seriously consider participating in the program. This doubles predicted participation rates
compared to the observed ones (see above) to a range of 7% for cash and mixed benefit recipients
and 11% for recipients of agency-directed care. As a medium scenario, we instead assume
only every fourth home care recipient to have sufficient knowledge of the program, thus again
doubling the predicted participation rates to 14 to 22%. While these choices may seem to be
quite arbitrary, we have some evidence that observed participation rates among local home
care recipients are far too small because participation rates among individuals who contacted
program organizers for further information turned out to be much higher. As mentioned above,
19
conditional participation rates with regard to the type of benefits amounted to 40% of all agency
care recipients, 44% of all mixed benefit recipients, and 32% of all cash benefit recipients. Of
course, the sub-sample of individuals who contacted the program need not be representative for
local home care recipients. On the other hand, a comparison of the composition of local home
care recipients and the sub-group of individuals seeking further information did not reveal any
significant selection with regard to the type of program or the level of disability that is granted
by the LTCI. We therefore consider participation rates among informed individuals as a relevant
maximum benchmark for our cost analysis. In the medium and long-run, however, transition
rates to personal budgets may further increase if program participation rates also hinge on a
growing familiarity with this new type of program.
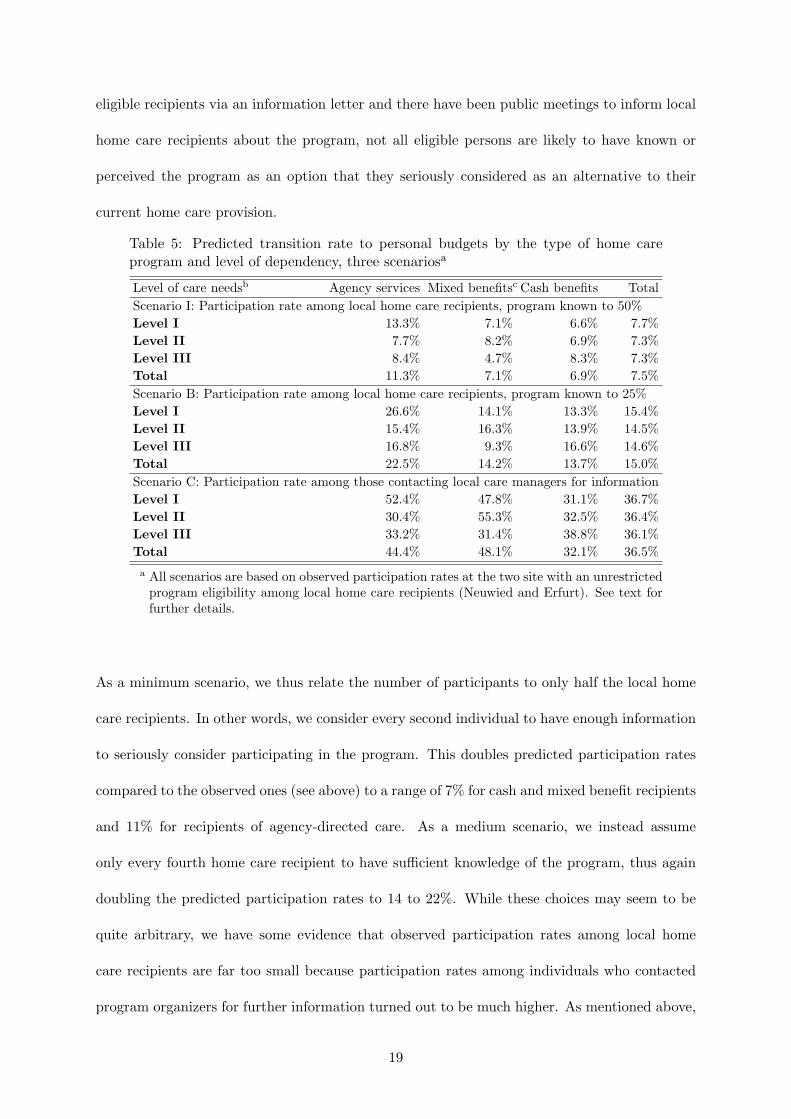
Caremanagement costs. The cost differential for each personal budget recipient depends
on its counterfactual standard home care program and the additional care management cost.
While the former can be calculated based on the known and fixed benefit level, the latter can
only be approximated because care management cost depend, among others, on the number of
recipients that is assisted by one care manager. For this reason, we derive three scenarios as
shown in Table 6 concerning the cost of care management and the resulting cost differential of
personal budgets compared to standard home care programs.
In a lower bound scenario, we take account of the recent reform of the German LTCI in April
2008 that introduced a nationwide care management financed by a higher contribution rate.
In this case, the introduction of personal budgets would not lead to additional costs for care
management. However, it is rather unclear to what extent this care management is comparable
in intensity to the care management applied in the demonstration. In order to ensure a similarly
intensive assistance, it may be necessary to finance additional care managers. Hence, we apply
two additional scenarios regarding care management costs. As a maximum cost scenario, we
consider each care manager to assist 50 personal budget recipients. In the demonstration, each
20
care manager was responsible for somewhat less than thirty personal budget recipients, but care
managers were also involved in substantial research tasks so that we assume a recipient/care
manager ratio of fifty instead. As a medium cost scenario, we assume this ratio to further
increase to 100.
Table 6: Monthly cost differential (Euro) between a personal budget andcurrent home care program by care management scenarioa
Level of care needsb Agency services Mixed benefitsc Cash benefitsScenario A: No additional care management costLevel I 0 45 179Level II 0 128 511Level III 0 192 767Scenario B: 100 care recipients per managerLevel I 53 98 232Level II 53 181 564Level III 53 245 820Scenario C: 50 care recipients per managerLevel I 106 151 285Level II 106 234 617Level III 106 298 873a Total labour cost per care manager are based on TVOD, job grading 10, expe-
rience level 3, and an overhead of 40% for extensive travel costs etc.b As a simplification, care level III+ is not taken into account.c Mixed benefits refer to a 75% receipt of agency services.
As shown in Table 6, the cost differential between personal budgets with a mandatory care
management compared to standard home care programs is highest for recipients of cash benefits
and increases with the level of disability and care management cost. While for the scenario with
no additional care management cost, agency-directed care and personal budgets result in equal
LTCI spending, the largest cost differential of monthly 873 Euro can be found for scenario C for
individuals with disability level three having received care cash benefits that switch to personal
budgets.
5.2 Calculated effects on LTCI spending
With the participation rates from Table 5, we can calculate the number of recipients for each
of the cells in Table 6 and compare the resulting monthly cost to the cost calculation for the
21

benchmark in 2007. Table 7 shows the additional monthly LTCI expenditures for home care
grants in case personal budgets were introduced as a standard home care program for the
various scenarios. As a first estimate, the table displays the predicted total number of personal
budget recipients. The corresponding cost depend on the care management scenario and on
the composition of these recipients with regard to their counterfactual home care program and
their level of disability. If all personal budget recipients had previously received agency-directed
care and we would assume a zero care management cost scenario, the additional LTCI spending
compared to the current LTCI scheme would be nil. Due to non-zero participation rates among
mixed benefits and cash benefit recipients, short-term cost under this counterfactual LTCI
scheme will exceed the cost for the benchmark year 2007. For these additional monthly LTCI
spending on home care recipients, we calculate a number of interesting indicators: the additional
monthly cost per personal budget recipient and the necessary increase of the contribution rate
to finance these extra cost by higher LTCI revenues.
Table 7: Excess LTCI spending on home care provision in case of intro-ducing personal budgets as an additional home care program comparedto standard home care provision in the benchmark year 2007
Personalbudget re-cipients
Monthly excesscost
Necessarychange of con-tribution rate
Excess costper recipient
Scenarioa Mio. Euro in % in % in pp Euro/monthI - A 108,724 24.5 4.1% 1.8% 0.03 225.4I - B 108,724 30.3 5.0% 2.2% 0.04 279.3I - C 108,724 36.2 6.0% 2.6% 0.04 333.2II - A 217,448 49.0 8.1% 3.5% 0.06 225.4II - B 217,448 60.7 10.0% 4.4% 0.07 279.3II - C 217,448 72.4 12.0& 5.2% 0.09 333.2III - A 528,250 117.8 19.5% 8.5% 0.14 223.1III - B 528,250 145.9 24.1% 10.5% 0.18 276.2III - C 528,250 174.0 28.8% 12.5% 0.21 329.4a Scenarios I-III refer to the predicted transition probabilities in Table 5. Sub-
scenarios A-C reflect the different cost assumption with regard to care man-agement.
Depending on the scenario, the predicted number of personal budget recipients lies between
110,000 and 530,000. The corresponding total additional cost from the perspective of the LTCI
22
amount to 25 to close to 120 Mio. Euro per month in case of zero additional care management
cost. If we are willing to assume that the current reform introduces a sufficient level of care
management, this would be the likely range for the short-term cost effects of introducing personal
budgets as a standard home care program. In case of assuming the maximum scenario for
additional care management cost, the corresponding total additional cost from the perspective
of the LTCI range from 36 to 175 Mio. Euro per month. In order to finance these additional
expenditures, the LTCI contribution rate for childless individuals of 1.7% in the benchmark
year 2007 would have had to increase by 0.03 to 0.2 percentage points.
Compared to the latest reform (in 2008) that increased contribution rates by 0.25 percentage
points in order to finance, among others, more generous benefit levels and a nationwide care
management, we can thus conclude that extending LTCI home care programs by personal
budgets is likely to raise cost to a limited but non-negligible extent. Moreover, the comparison
of care outcomes suggests that most of the money is used to crowd out informal by formal
carers, while care outcomes for frail elderly with a previous receipt of cash payments remain
rather unchanged. These findings clearly challenge the view of personal budgets as a feasible
reform option that helps in containing long term LTCI spending.
5.3 Possibly counteracting forces
So far we have bounded the static and partial effect of introducing personal budgets on short-
term LTCI spending. Thus, we do not take account of the possible long-run effects on the
stability of home care arrangements, nor do we consider the long-term effects of the demo-
graphic transition on the counterfactual number and composition of future home care recipients.
Moreover, data restrictions render it impossible to take account of a changing administrative
overhead in case of introducing personal budgets. Also, personal budgets may provoke general
equilibrium effects that may affect LTCI revenues and that we omit in our analysis. All of
these aspects tend to counteract the short-term costs as projected in the previous section which
23
therefore are likely to overestimate the costs of an extended LTCI system in the long-run. We
therefore complement our cost calculation by discussing the likely impact of these counteracting
forces on LTCI spending.
Personal budgets effects on stability of home care. As discussed above, personal budgets
may contribute to a reduced transition of home care recipients to costly nursing homes. Based
on the available information it is impossible though to evaluate by how long personal budgets
are able to postpone transitions to nursing homes. Nevertheless, it is insightful to calculate
the break-even point, i.e. the extension of home care provision by personal budgets that is
necessary to carry the cost differential between personal budgets and the counterfactual type of
home care program.13 Such a break-even point is possible because the cost differential between
institutionalized care and standard home care programs exceeds the cost differential between
personal budgets and standard home care programs for recipients of care levels one and two.
Denote the cost differential between standard home care provision and institutionalized care
averaged across all predicted personal budget recipients as shown in Table 8 as y. Further,
denote the cost differential between standard home care provision and personal budgets as
shown in Table 7 as x. The break-even point is then given as t2 = yy−x t1 with t1 as the time
spent in home care before moving to a nursing home in the current LTCI scheme and t2 as
the necessary time spent in home care before moving to a nursing home in case of alternatively
receiving a personal budget.
Table 8 thus displays t2/t1 for the various scenarios with t1 normalized to one. Compared to
receiving standard home care, a personal budget recipient, on average, has to remain 1.5 to
1.9 times longer in home care before moving to a nursing home in order to neutralize the cost
increases as shown in Table 7. While this already seems demanding, it becomes highly unlikely
that personal budgets produce no extra cost for the LTCI due to such a long-run effect if one13This break-even point only refers to the benefit levels and again does not take account of administrative cost
or investment costs for nursing homes.
24
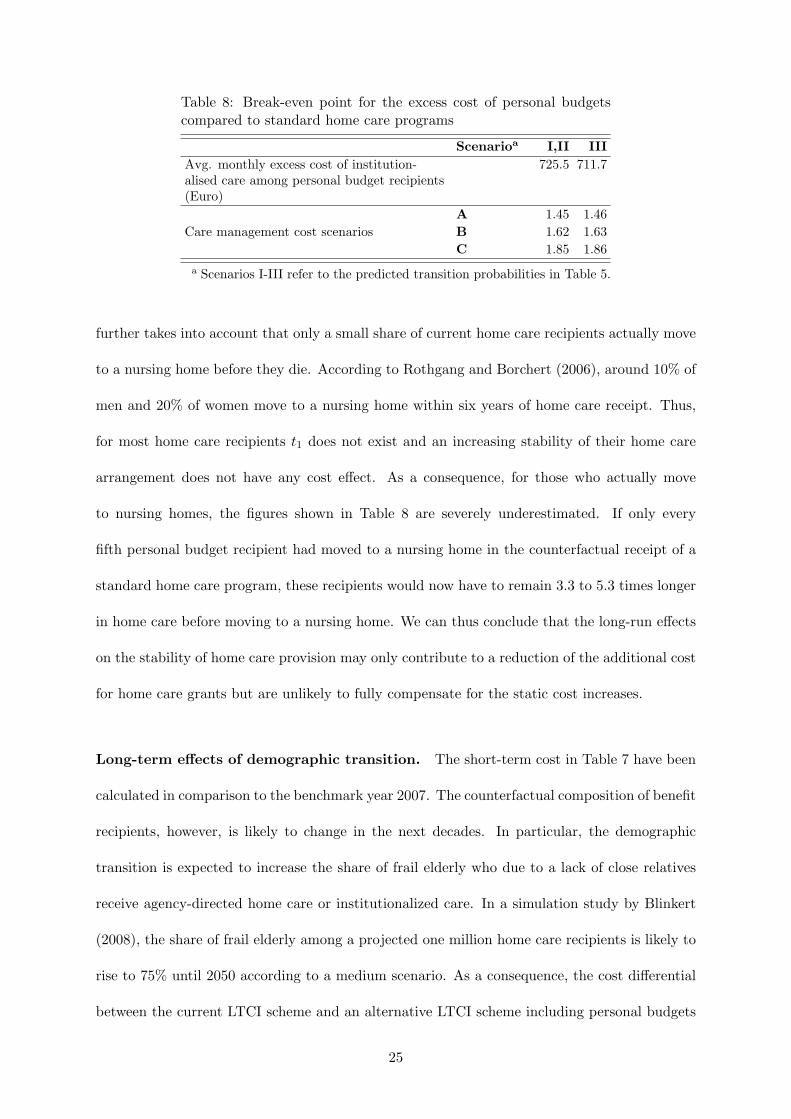
Table 8: Break-even point for the excess cost of personal budgetscompared to standard home care programs
Scenarioa I,II IIIAvg. monthly excess cost of institution-alised care among personal budget recipients(Euro)
725.5 711.7
A 1.45 1.46Care management cost scenarios B 1.62 1.63
C 1.85 1.86a Scenarios I-III refer to the predicted transition probabilities in Table 5.
further takes into account that only a small share of current home care recipients actually move
to a nursing home before they die. According to Rothgang and Borchert (2006), around 10% of
men and 20% of women move to a nursing home within six years of home care receipt. Thus,
for most home care recipients t1 does not exist and an increasing stability of their home care
arrangement does not have any cost effect. As a consequence, for those who actually move
to nursing homes, the figures shown in Table 8 are severely underestimated. If only every
fifth personal budget recipient had moved to a nursing home in the counterfactual receipt of a
standard home care program, these recipients would now have to remain 3.3 to 5.3 times longer
in home care before moving to a nursing home. We can thus conclude that the long-run effects
on the stability of home care provision may only contribute to a reduction of the additional cost
for home care grants but are unlikely to fully compensate for the static cost increases.
Long-term effects of demographic transition. The short-term cost in Table 7 have been
calculated in comparison to the benchmark year 2007. The counterfactual composition of benefit
recipients, however, is likely to change in the next decades. In particular, the demographic
transition is expected to increase the share of frail elderly who due to a lack of close relatives
receive agency-directed home care or institutionalized care. In a simulation study by Blinkert
(2008), the share of frail elderly among a projected one million home care recipients is likely to
rise to 75% until 2050 according to a medium scenario. As a consequence, the cost differential
between the current LTCI scheme and an alternative LTCI scheme including personal budgets
25
would diminish. For a scenario III from Table 5 and the expected numbers and composition
of home care recipients for 2050, the estimated cost differential between an unchanged and an
extended LTCI scheme would only range between 45 to 90 Mio. Euro per month compared to
the currently estimated 118 to 175 Mio. Euro. In the long run, the demographic transition thus
works to the advantage of the personal budget.
Administrative cost and general equilibrium effects. Due to data restrictions we do not
take account of any effects the introduction of personal budgets may have on the administra-
tive overhead of the LTCI. For the Netherlands, agency-directed programs have been shown to
increase administrative overhead by 30-40% compared to consumer-directed program (see Mil-
tenburg and Ramakers, 1999). Thus, personal budget recipients who formerly received agency
services may help contain administrative cost. On the other hand, administrative overhead
for a recipient of a personal budget is unlikely to be much lower than for a cash recipient
since unlike in the case of agency-directed care no direct accounting between LTCI and care
providers is necessary for these benefits. In order to get a rough estimate for the likely scale
of potential cost savings among former agency care recipients we assume that the results found
for the Netherlands were applicable to the German case. We further assume 15% of the 600
Mio. Euro spent on administration in 2005 (German Federal Ministry of Health, 2007) to apply
to agency-directed care. A reduction of these costs in the range of 30-40% would thus boil
down to a monthly saving of 1-1.3 Mio. Euro in the case of scenario III, i.e. with 44% of agency
care recipients switching to personal budgets. Additional savings could be possible if home
visits as a quality check of care provision among cash recipients could be discontinued due to
the assistance of a care manager. For recipients with a disability level one or two, there are
semiannual visits that cost 16 Euro averaged across the German Lander. For recipients with a
disability level three, there are quarterly visits that cost 20 Euro each. For scenario III with a
transition rate of 32% among cash recipients, this would result in additional monthly savings
26
of approximately 1 Mio. Euro. Thus, cost savings for the administrative overhead is unlikely to
compensate for the additional spending on home care grants.
Finally, we do not consider general equilibrium effects that may affect LTCI revenues. If, for
example, the relief of informal caregivers fosters higher labor force participation, this could
raise LTCI revenues from social insurance contributions. At the program sites, we do not find
any evidence for increasing working hours among main caregivers though.14 Transferability of
this finding for the case of a general introduction of personal budgets may be limited due to
the demonstrative character of the program. Nevertheless, it casts some doubts on the likely
relevance and magnitude of such labor market effects.
6 Conclusion
In this study, the effects of introducing personal budgets as a professionally-assisted consumer-
directed program in long-term care in Germany have been analyzed. Based on a long-run
social experiment heterogenous impacts of personal budgets on care provided by formal and
informal carers with regard to agency-directed care and cash benefits have been estimated. In
addition, it has been approximated whether personal budgets are able to postpone transitions
from home to institutionalized care based on a self-assessment by the care recipient. Finally,
we have identified a likely range for the short-term and static effects of implementing personal
budgets as a further benefit scheme on LTCI spending for home care grants. In addition, we
discuss the relevance and likely magnitude of a number of counteracting forces, including the
likely impact of personal budgets on the administrative overhead and the stability of home care
arrangements.
The results indicate that for former recipients of agency-directed care, personal budgets allow
for extending formal home care measured in hours per week and may thus be a means to improve14There has been a supplementary survey among main carers. A Tobit model of working hours choices did not
yield any significant differences between the control and the program group.
27
care outcomes. However, since personal budgets are not targeted to those who lack alternative
informal caregiving resources, the feasibility of personal budgets as an additional home care
program also hinges on the effects personal budgets exert on former recipients of cash payments.
The corresponding results indicate a relevant shift of cash recipients to the personal budget for
whom a strong substitution of informal care by formal care increases LTCI spending, but does
not have any traceable effects on care outcomes. From an LTCI perspective, complementing
the LTCI cash benefit by personal budgets thus crowds out informal care compared to a system
that complements cash benefits with agency-directed home care only. This is because personal
budgets are a closer substitute for privately funded home care than agency-directed care. For
international policy advisors, our findings therefore point to the need to always consider all
direct and indirect effects when designing or reforming home care programs.
The analysis of the potential stabilization effect of personal budgets on home care indicates that
the program is able to make home care arrangements more robust to deteriorating shocks such
as a decreasing health status or the loss of a formal caregiver. With respect to the loss of the
main (informal) caregiver, no stabilizing effect can be found. Even when taking into account
reduced transitions to institutionalized care as well as a reduction in administrative overhead,
an extended LTCI scheme that includes personal budgets as an additional home care program is
likely to raise LTCI spending in the short run. In the long-run, the demographic change works
to the advantage of the personal budget. The financial feasibility of extending the LTCI scheme
by personal budgets may thus be enhanced in the long-run. However, as long as LTCI home
care programs are neither means-tested nor try to explicitly target those who otherwise would
be dependent on agency-directed care, personal budgets always partially crowd out informal
care. From the perspective of the LTCI, this even puts doubts on the feasibility of extending
its schemes by personal budgets in a longer time frame. From a broader economic perspective,
some crowding out may be desirable if the corresponding relief of informal carers has positive
effects on health outcomes and labor force participation that we cannot take into account but
28

should be considered in future research.
References
Arntz, M., and S. L. Thomsen (2008): “Crowding out informal caregivers. Evidence from a
social experiment in Germany,” Discussion paper, ZEW Mannheim, mimeo.
Ashenfelter, O., and D. Card (1985): “Using the Longitudinal Structure of Earnings to
Estimate the Effect of Training Programs,” The Review of Economics and Statistics, 67(4),
648–660.
Badelt, C., A. Holzmann-Jenkins, C. Matul, and A. Osterle (1997): “Analyse der
Auswirkungen des Pflegevorsorgesystems (Analysis of the care system),” Report, Bundesmin-
isterium fur Arbeit, Gesundheit und Soziales, Wien.
Benjamin, A. E., R. E. Matthias, and T. M. Franke (2000): “Comparing Client-Directed
and Agency Moels for Providing Supportive Services at Home,” Health Services Research,
35(1), 351–366.
Bijwaard, G., and G. Ridder (2005): “Correcting for Selective Compliance in a Re-
employment Bonus Experiment,” Journal of Econometrics, 125(1-2), 77–111.
Blinkert, B. (2008): “Pflegebedurftigkeit im demographischen und sozialen Wandel. Szenarien
zur Beschreibung moglicher Entwicklungen unter verschiedenen Bedingungen,” Discussion
paper, University of Freiburg, mimeo.
Comas-Herrera, A., R. Wittenberg, C. Gori, J. Costa-Font, A. di Maio, C. Pax-
tot, L. Pickard, A. Pozzi, and H. Rothgang (2006): “Future long-term care expendi-
ture in Germany, Spain, Italy and the United Kingdom,” Ageing and Society, 26, 285–302.
Ettner, S. (1994): “The Effect of the Medicaid Home Care Benefit on Long-Term Care Choices
of the Elderly,” Economic Inquiry, 32(1), 103–127.
29

Foster, L., R. Brown, B. Phillips, J. Schore, and B. L. Carlson (2003): “Improving
the Quality of Medicaid Personal Assistance through Consumer Direction,” Health Affairs,
pp. 162–175, Web Exclusive.
German Federal Ministry of Health (2007): “Vierter Bericht uber die Entwicklung der Pflegev-
ersicherung,” Berlin.
Grabowski, D. C. (2006): “The Cost-Effectiveness of Noninstitutional Long-Term Care Ser-
vices: Review and Synthesis of the Most Recent Evidence,” Medical Care Research and
Review, 63(1), 3–28.
Greene, V. L. (1983): “Substitution Between Formally and Informally Provided Care for the
Impaaired Elderly in the Community,” Medical Care, 21(6), 609–619.
Hanley, R., J. Wiener, and K. Harris (1991): “Will Paid Home Care Erode Informal Care
Support?,” Journal of Health Politics, Policy and Law, 16(3), 507–521.
Hacker, J., and B. Raffelhuschen (2004): “Denn sie wussten, was sie taten: Zur Reform
der sozialen Pflegeversicherung,” DIW Vierteljahreshefte zur Wirtschaftsforschung, 73(1),
158–174.
Heckman, J. J., and J. A. Smith (1995): “Assessing the Case for Social Experiments,”
Journal of Economic Perspectives, 9(2), 85–110.
Herzog Commission (2003): “Endbericht der Kommission zur Reform der sozialen
Sicherungssysteme,” Kommission ‘Soziale Sicherheit’ im Auftrag des CDU-Bundesvorstandes,
Berlin.
Klie, T. (1999): Pflege im sozialen Wandel - Analysen und Perspektiven sozialer Sicherung
bei Pflegebedurftigkeit Vol. 15 of Angewandte Alterskunde, pp. 187–204. Verlag Hans Huber,
Bern et al.
30

Kodner, D. (2003): “Consumer-Directed Services: Lessons and Implications for Integrated
Systems of Care,” International Journal of Integrated Care, 17, serial online.
Kotlikoff, L. (1989): How much care do the aged reveive from their children? A bimodal
picture of contact and assistance. The University of Chicago Press, Chicago.
Kronberger Kreis (2005): “Tragfahige Pflegeversicherung,” Donges, J. B. and Eekhoff, J. and
Franz, W. and Fuest, C. and Moschel, W. and Neumann, M. J., Frankfurt/Main.
Lundsgaard, J. (2005): “Consumer Direction and Choice in Long-Term Care for Older Per-
sons, Including Payments for Informal Care: How Can it Help to Improve Care Outcomes,
Employment and Fiscal Sustainability,” OECD Health Working Papers, No. 20, OECD.
Miltenburg, F. M., and C. C. Ramakers (1999): “Evaluatie-onderzoek persoonsgebonden
budget in Nederland (Evaluation of personal care budgets in the Netherlands),” Tijdschrift
voor Gezondheidswetenschappen, 77(7), 422–429.
Nemeth, C., and E. Pochobradsky (2004): “Qualitatssicherung in der hauslichen Betreu-
ung,” Report, Osterreichisches Bundesinstitut fur Gesundheitswesen, Bundesministeriums
fur soziale Sicherheit, Generationen und Konsumentenschutz.
Orr, L. (1999): Social Experiments: Evaluating Public Programs with Experimental Methods.
SAGE Publications Inc., Thousand Oaks.
Pezzin, L., and B. Schone (1999): “Parental marital disruption and intergenerational trans-
fers: ana analysis of lone elderly parents and their children,” Demography, 36(3), 287–297.
Pezzin, L. E., P. Kemper, and J. Rechovsky (1996): “Does Publicly Provided Home
Care Substitute for Family Care? Experimental Evidence with Endogeneous Living Arrange-
ments,” The Journal of Human Resources, 31(3), 650–676.
Schneekloth, U., and U. Muller (2000): Wirkungen der Pflegeversicherung, vol. 127 of
Schriftenreihe des Bundesministeriums fur Gesundheit. Nomos-Verlag, Baden-Baden.
31
Schulz, E., R. Leidl, and H. Konig (2004): “The impact of ageing on hospital care and
long-term care – the example of Germany,” Health Policy, 67, 57–74.
Smith, J. A. (2000): “A Critical Survey of Empirical Methods for Evaluating Active Labor
Market Policies,” Schweizerische Zeitschrift fur Volkswirtschaft und Statistik, 136(3), 1–22.
Stabile, M., A. Laporte, and P. Coyte (2006): “Household responses to public home care
programs,” Journal of Health Economics, 25, 674–701.
Tilly, J., and J. M. Wiener (2001): “Consumer-Directed Home and Community Services:
Policy Issues,” Occasional paper no. 44, The Urban Institute, Washington D.C.
van Houtven, C., and E. Norton (2008): “Informal care and Medicare expenditures: Test-
ing for heterogeneous treatment effects,” Journal of Health Economics, 27, 134–156.
Wasem, J. (1997): “A study on decentralizing from acute care to home care settings in Ger-
many,” Health Policy, 41 (Supplement), S109–S129.
Wiener, J. M., J. Tilly, and A. E. Cuellar (2003): “Consumer-Directed Home Care in
the Netherlands, England, and Germany,” report, AARP Public Policy Institute.
32
A Appendix
Table A.1: Selected Descriptives and t-Tests of Equality or χ2-Tests of Independence (means,wave 1)
Full Sample Cash Payments Agency Care
Treaties Controls p-value Treaties Controls p-value Treaties Controls p-value
Sociodemographics
age (years) 74.5 71.9 0.10 73.0 72.3 0.84 74.1 69.2 0.04
female 0.64 0.67 0.95 0.70 0.64 0.39 0.64 0.69 0.54
married 0.29 0.31 0.59 0.29 0.41 0.12 0.28 0.13 0.03
Number of Children
none 0.23 0.25 0.23 0.23 0.25 0.38
one 0.23 0.15 0.17 0.18 0.25 0.08
two and more 0.55 0.60 0.20 0.60 0.59 0.98 0.50 0.54 0.05
Need of care
care needs indexa(1-100) 66.2 63.9 0.29 66.1 61.0 0.13 63.7 60.5 0.39
LTCI-level 1 0.55 0.54 0.58 0.58 0.58 0.64
LTCI-level 2 0.32 0.36 0.28 0.38 0.30 0.26
LTCI-level 3 0.13 0.09 0.42 0.14 0.04 0.13 0.12 0.10 0.81
Care arrangement
total care hours/week 64.5 55.2 0.09 86.4 62.5 0.02 41.1 31.1 0.15
informal care hours/week 51.0 41.7 0.11 73.8 53.6 0.06 27.1 18.7 0.19
formal care hours/week 13.6 13.5 0.97 12.6 8.9 0.45 14.0 12.4 0.72
help from relatives 0.76 0.79 0.52 0.81 0.85 0.51 0.70 0.62 0.30
help from friends/volunteers 0.33 0.25 0.07 0.41 0.23 0.01 0.25 0.33 0.33
help from agency workers 0.62 0.54 0.09 0.16 0.26 0.13 0.88 0.87 0.93
help from independent worker 0.38 0.40 0.65 0.36 0.42 0.42 0.34 0.36 0.88
Program site
Annaberg 0.08 0.03 0.00 0.00 0.14 0.03
Erfurt 0.15 0.19 0.23 0.20 0.17 0.31
Kassel 0.13 0.08 0.00 0.00 0.20 0.21
Marburg 0.15 0.18 0.00 0.00 0.20 0.31
Neuwied 0.37 0.48 0.73 0.80 0.13 0.10
Unna 0.10 0.04 0.01 0.00 0.00 0.58 0.16 0.05 0.07
Type of benefits before program
initial claim 0.12 0.13 0.00 0.00 0.00 0.00
agency care 0.39 0.26 0.00 0.00 1.00 1.00
cash payments 0.30 0.44 1.00 1.00 0.00 0.00
mixed benefits 0.19 0.17 0.01 0.00 0.00 0.00 0.00
observations 310 149 94 66 122 39
a The care index is based on the self-assessed ability to accomplish activities of daily life. The index is constructedto be 100 in case of full dependence on care and support by others.
33
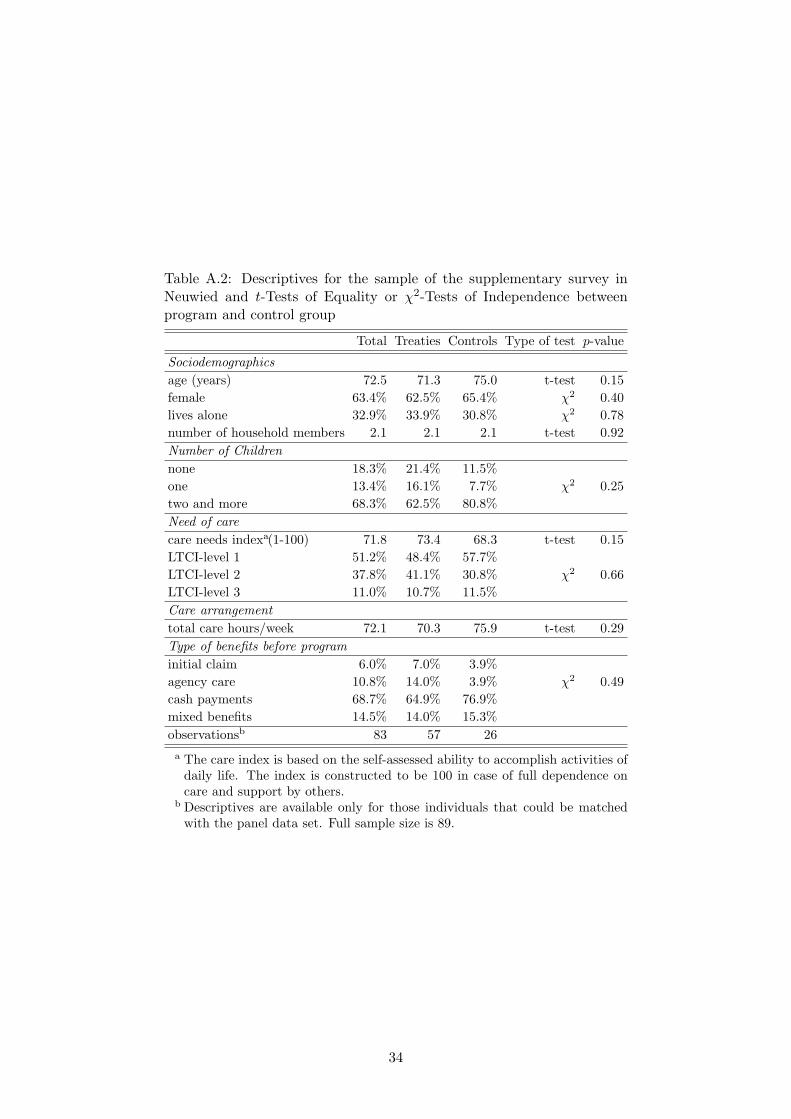
Table A.2: Descriptives for the sample of the supplementary survey inNeuwied and t-Tests of Equality or χ2-Tests of Independence betweenprogram and control group
Total Treaties Controls Type of test p-value
Sociodemographicsage (years) 72.5 71.3 75.0 t-test 0.15female 63.4% 62.5% 65.4% χ2 0.40lives alone 32.9% 33.9% 30.8% χ2 0.78number of household members 2.1 2.1 2.1 t-test 0.92Number of Childrennone 18.3% 21.4% 11.5%one 13.4% 16.1% 7.7% χ2 0.25two and more 68.3% 62.5% 80.8%Need of carecare needs indexa(1-100) 71.8 73.4 68.3 t-test 0.15LTCI-level 1 51.2% 48.4% 57.7%LTCI-level 2 37.8% 41.1% 30.8% χ2 0.66LTCI-level 3 11.0% 10.7% 11.5%Care arrangementtotal care hours/week 72.1 70.3 75.9 t-test 0.29Type of benefits before programinitial claim 6.0% 7.0% 3.9%agency care 10.8% 14.0% 3.9% χ2 0.49cash payments 68.7% 64.9% 76.9%mixed benefits 14.5% 14.0% 15.3%observationsb 83 57 26a The care index is based on the self-assessed ability to accomplish activities of
daily life. The index is constructed to be 100 in case of full dependence oncare and support by others.
b Descriptives are available only for those individuals that could be matchedwith the panel data set. Full sample size is 89.
34