Embed Size (px)
Citation preview

Reflections On The Last 25 Years
Robert Martin
Managing Director & Chief Executive Officer
Growth Frontiers Asia Pacific Conference
30th October 2018

2
Summary
Corporate Social Responsibility
The BOC Aviation Journey since November 1993
Macro Environment
Airline Market
Supply Chain
Aircraft Financing
Operating Leasing
Conclusion

Corporate Social Responsibility
3

4
7.5 Magnitude Earthquake
6 Meter High Tsunami
200,000+ Displaced
2,000+ Fatalities
Airlink Regional Response Framework: Asia Pacific Region

Airlink Regional Response Framework: Asia Pacific Region
5

• Activated Regional
Response Plan
• Engaged 20+ Nonprofit
Partners
• Mobilized Regional
Aviation Community
Airlink Regional Response Framework: Asia Pacific Region
Support Airlink responses in Southeast Asia and around the globe
Sandra Walter [email protected]
6

The BOC Aviation Journey
7

The BOC Aviation Journey
All data as at the end of the relevant period
8
2009 >5
2006
>10
2000 >1
2013
>3
1997 >0.3
2017 16
30 Jun 2018 >17
Ownership Total assets
US$ billion1993
1997
SALE established with 50:50 joint
ownership between Singapore
Airlines and Boullioun Aviation
Services
Temasek and GIC each became
14.5% shareholders
2006 Bank of China acquired 100% of
SALE on 15 Dec 2006
2016Listed on HKEx on 1 June
- 70% by Bank of China
- 30% by public float
2018 Market capitalisation of US$5bn

Core Competencies: A 25-Year Track Record
Sales
Transitions
Repossessions
Purchasing
Leasing
Financing
320 aircraft sold
More than 70 transitions
36 aircraft in 13 jurisdictions1
More than 780 aircraft purchased totalling more than US$42 billion
More than 840 leases executed with > 150 airlines in 55 countries and regions
More than US$23 billion in debt raised since 1 January 2007
All data as at 30 September 2018, since inception unless otherwise indicated
Notes:
1. Includes repossessions and consensual early returns
2. Average value over last 11 years since 1 January 2008
3. As at 30 June 2018
Since inception in 1993:
9
US$3.4 billion3 in cumulative net profit after tax generated since inception
Fleet utilization2
Cashflow collection2
Average 99.9%
Average 99.6%3

10
Macro Environment

Global GDP Growth
-1
0
1
2
3
4
5
6
%
Global GDP Growth, By Year (%)
11
Source: World Bank, IMF, Public data sources

Central Bank Intervention Comes To An End
Developed economy and emerging economy central bank net purchases of G4 financial assets,
% of world GDP, rolling 12m
Source: JP Morgan
Note: The G4 is normally comprised of the US, the Eurozone, the UK and Japan; we also include
Switzerland. In the chart, we include G4 central bank purchases by looking at changes in their own
balance sheets, and include purchases of G4 assets by emerging economy central banks and by non-G4
developed country central banks by looking at changes in their foreign exchange reserves ex-gold.
Sources include individual central bank disclosures, the IMF’s International Financial Statistics database,
a 2014 analysis from Niall Ferguson and Moritz Schularick and J.P. Morgan Asset Management. 2018.
12

Lower USD Interest Rates Environment Recently
%
Source: Bloomberg, as at 22 October 2018
13
Interest rates have trended back to the 2009 levels but are still lower than pre-GFC
0
2
4
6
8
10
12
199
0
199
1
199
2
199
3
199
4
199
5
199
6
199
7
199
8
199
9
200
0
200
1
200
2
200
3
200
4
200
5
200
6
200
7
200
8
200
9
201
0
201
1
201
2
201
3
201
4
201
5
201
6
201
7
201
8
10Y USD SWAP 6M USD LIBOR
Average US 10-Year Swap Rate
10Y USD SWAP and 6M USD LIBOR

Jet Fuel Price – Creeping Up (Again)
14
US$/BBL
Source: Bloomberg, 22 October 2018
0
20
40
60
80
100
120
140
160
199
1
199
2
199
3
199
4
199
5
199
6
199
7
199
8
199
9
200
0
200
1
200
2
200
3
200
4
200
5
200
6
200
7
200
8
200
9
201
0
201
1
201
2
201
3
201
4
201
5
201
6
201
7
201
8
Jet Fuel Price

0
0.25
0.5
0.75
1
SARS Global Financial Crisis
European RecessionGPA restructuring starts
9/11
Irish Banking Crisis
Eurozone Debt Crisis
There’s Always a Downturn Somewhere!
15
Asia
Eu
rop
eU
SC
om
mo
dity
Eco
no
mie
s
Importance of having a counter-cyclical strategy
Asian Financial Crisis
Global Financial Crisis
Global Financial CrisisDotcom bubble
1St Gulf War 2nd Gulf War
Oil price bubble
Cypriot Financial Crisis
Spanish Banking Crisis
Icelandic Financial Crisis
Russian Financial Crisis
Commodity Crisis

Airline Market
16

Global
Economic
Crisis
9/11 &
Second
Gulf
War
First
Gulf
War
0
200
400
600
800
1,000
19
90
19
92
19
94
19
96
19
98
20
00
20
02
20
04
20
06
20
08
20
10
20
12
20
14
20
16
20
18
20
20
20
22
20
24
20
26
20
28
20
30
20
32
20
34
20
36
20
38
Ind
ex
ed
(1
99
0 =
10
0)
Global Real GDP Passenger Traffic (RPK)
17
Air Traffic Demand of 5.1% Drove Fleet Growth of 3.4%
Asia: ~x2
Source: Ascend FlightGlobal Fleet Forecast 2015, Oxford Economics, Boeing Current Market
Interactive Forecast 2018-2037
Middle class households (million)
Air traffic has grown by 5.1% since 1990 Annual fleet growth (by number of aircraft)
Fleet growth, %
Source: Ascend, 30 September 2018
-4%
-2%
0%
2%
4%
6%
8%
199
0
199
1
199
2
199
3
199
4
199
5
199
6
199
7
199
8
199
9
200
0
200
1
200
2
200
3
200
4
200
5
200
6
200
7
200
8
200
9
201
0
201
1
201
2
201
3
201
4
201
5
201
6
201
7
Se
p-1
8
Average: 3.4%
1990 - 2017 2018 - 2037
Air Traffic +4.7%
Global GDP +2.6%
Air Traffic +5.1%
Global GDP +2.9%

Growing Global Connectivity and Falling Price of Airfares
18
Source: IATA Economics
Unique city pairs more than doubled over last two decades
0.0
0.5
1.0
1.5
2.0
2.5
3.0
3.5
4.0
0
2,000
4,000
6,000
8,000
10,000
12,000
14,000
16,000
18,000
20,000
22,000
24,000
1993 1995 1997 1999 2001 2003 2005 2007 2009 2011 2013 2015 2017
US
$/R
TK
Nu
mb
er
of
un
iqu
e c
ity-p
airs
Unique city pairs
(LHS)
Cost of air transport, adjusted for CPI inflation
(RHS)
Unique City Pairs and Cost of Air Transport

9/11 and
Aftermath
Global
Financial
Crisis
Airline Industry Profitability Has Significantly Improved
Over The Last Decade
19
Source: IATA, October 2018
To
tal W
orld
Ne
t P
rofits
, U
S$
B
Airline Industry Net Profit
Indiv
idua
l Re
gio
ns’ N
et P
rofits
, US
$B
(LHS) (RHS) (RHS) (RHS)
-15
-10
-5
0
5
10
15
20
25
-30
-20
-10
0
10
20
30
40
1993 1995 1997 1999 2001 2003 2005 2007 2009 2011 2013 2015 2017
Thousands
Net profits, World Total Asia Europe North America

Weaker Airlines Exited
20
0
50
100
150
200
250
300
350
400
0
10
20
30
40
50
60
2000 2002 2004 2006 2008 2010 2012 2014 2016 Oct-18*
No. of opr No. of ac
No. of airline
operatorsNo. of aircraft
Source: Ascend, Innovata, BOC Aviation Risk Management, based on 100+ seat operators, includes airline
bankruptcies and suspensions
* Info updated as at 15 October 2018
9/11 effect –
impacted US carriers
most; few airlines but
many aircraft
Weaker airlines hit by high fuel
price followed by financial crisis;
many airlines
Big airlines affected
in 2017: Alitalia, Air
Berlin, Monarch,
VIM Avia, Niki
Total Airline Bankruptcies and Total Number of Aircraft Repossessed Per Annum

21
Number of airlines
0
5
10
15
20
25
30
35
40
45
50
Airlines with fleet >20 aircraft Airlines with fleet <20 aircraft
308 airlines left the market since 2000, of which 33 (11%) had more than 20 a/c in their fleet
Source: Ascend, Innovata, BOC Aviation Risk Management, based on 100+ seat operators, includes airline
bankruptcies and suspensions
* Info updated as at 15 October 2018
Predominantly Smaller Airlines Have Exited The Market
Number of Airlines That Left the Market, By Year

22
Number of airlines
with fleet >20 aircraft
0
1
2
3
4
5
6
No more than 5 airlines (fleet >20 aircraft) per year left the market
Source: Ascend, Innovata, BOC Aviation Risk Management, based on 100+ seat operators, includes airline
bankruptcies and suspensions
* Info updated as at 15 October 2018
Larger Airlines Show Greater Resilience
Airlines (Fleet >20 Aircraft) That Left the Market, By Year

23
Leasing: Customer Segmentation
794 airlines in service today
Focus on 147 airlines or only 19% of the airlines in the market – minimum credit score, above 20
aircraft
Credit above minimum,
fleet >20 aircraft
Credit above minimum,
fleet 10-20 aircraft
Credit above minimum,
fleet < 10 aircraft
Credit below minimum,
fleet >20 aircraft
Credit below minimum,
fleet 10-20 aircraft
Credit below minimum,
fleet < 10 aircraft
Source: Ascend, as at 30 September 2018
Only commercial aircraft with 100 seats and above
147 airlines, 19%
47, 6%
57, 7%58, 7%
85, 11%
400, 50%
17,016 aircraft, 75%
702, 3%
259, 1%
2,326, 10%
1,156, 5%
1,329, 6%
c.80% of
BOC Aviation’s
portfolio
Airline segmentation by credit score and fleet
sizeOur target 147 airlines operate 75% of the
current in-service aircraft

Supply Chain
24

25
New Aircraft Introduced Since 1990
As at October 2018, by entry into service
A340-300
A340-500
A340-200
A321-100
A330-300
B777-200
A319-100
B777-200ER
A321-200
B737-700
A330-200
B737-800
B777-300
B737-600
B717-200
B737-900
A340-600
A318-100
B777-300ER
B777-200LR
B737-700ER
B737-900ER
B787-8
Superjet
B747-8
B787-9
A350-900
ARJ21
A320NEO (PW)
A320NEO (CFM)
CS100
CS300
A321NEO (CFM) A321NEO (PW)
B737 MAX 8
Irkut MC-21
A350-1000
B737 MAX 9
B787-10
E190-E2
A330-900
E195-E2
B737 MAX 7
A330-800
A319NEO
B777-9
B737 MAX 10
MRJ
E170-E2
B777-8
C919
737 MAX 8 (200 seat)
50
100
150
200
250
300
350
400
450
500
1990 1993 1995 1998 2001 2004 2006 2009 2012 2014 2017 2020 2023 2025
Num
ber
of seats
More than 50 aircraft types introduced since 1990…..
A380-800
+
26
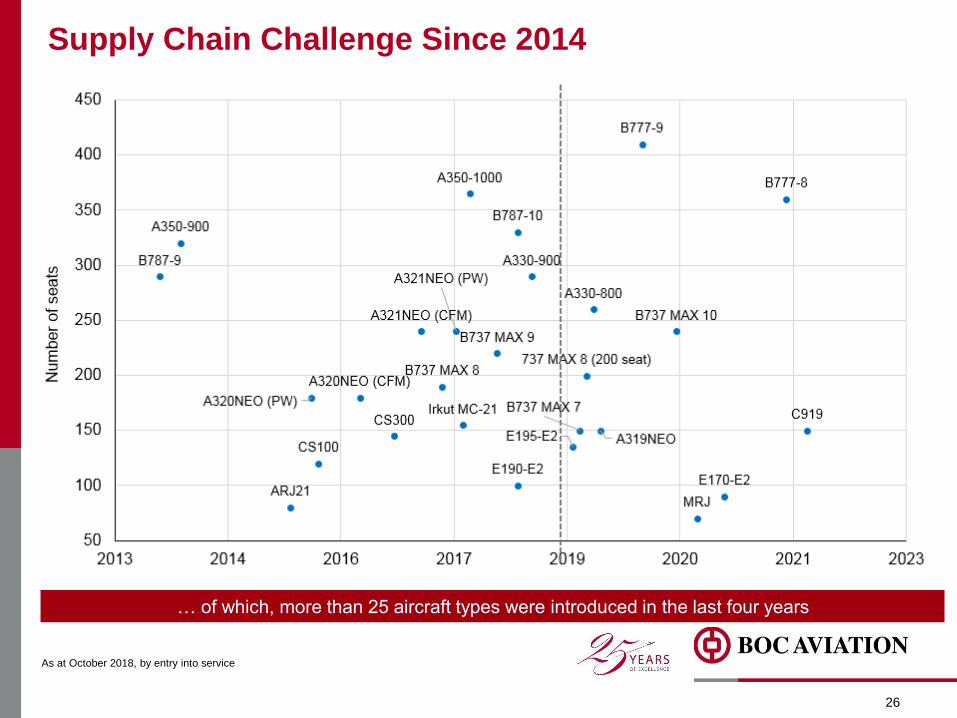
Supply Chain Challenge Since 2014
As at October 2018, by entry into service
B787-9
A350-900
ARJ21
A320NEO (PW)
A320NEO (CFM)
CS100
CS300
A321NEO (CFM)
A321NEO (PW)
B737 MAX 8
Irkut MC-21
A350-1000
B737 MAX 9
B787-10
E190-E2
A330-900
E195-E2
B737 MAX 7
A330-800
A319NEO
B777-9
B737 MAX 10
MRJ
E170-E2
B777-8
C919
737 MAX 8 (200 seat)
50
100
150
200
250
300
350
400
450
2013 2014 2016 2017 2019 2020 2021 2023
Num
be
r o
f se
ats
… of which, more than 25 aircraft types were introduced in the last four years

Aircraft Financing
27

Operating Lessors’ Share Has Doubled Since 1990
28
23%
45%
20%
25%
30%
35%
40%
45%
50%
0
5,000
10,000
15,000
20,000
25,000
1990 1995 2000 2005 2010 2015 Sep 2018
Owned Fleet Operating Lease % provided by operating lessor
Source: Ascend, 30 September 2018
Num
be
r o
f a
ircra
ft
Pro
po
rtio
n p
rovid
ed
by o
pe
ratin
g lesso
rs
x2
Global fleet has grown from 8,794 to 22,788 aircraft since 1990

29
Changes in Bank Sizes
Source: Bloomberg - ‘China’s Too-Big-to-Fail Financial Firms Keep Getting Bigger “, 11 October 2018
0
10
20
30
40
50
Dec-08 2010 2011 2012 2013 2014 2015 2016 2017 2018
China US
US$ trillion
Total assets of Chinese banks vs US banks

30
Growing Importance of Chinese Banks
Source: Bloomberg - ‘China’s Too-Big-to-Fail Financial Firms Keep Getting Bigger “, 11 October 2018
0 2 4 6 8 10 12 14
Germany
Italy
Switzerland
France
Canada
Australia
UK
Japan
US
China
China has more mega-banks than any other country in the world
Number of banks with over US$500 billion of assets

31
Growing Importance of Chinese Banks
Source: Bloomberg - ‘China’s Too-Big-to-Fail Financial Firms Keep Getting Bigger “, 11 October 2018
Biggest banks by assets
US$ trillion
0
1
2
3
4
5
ICBC CCB AGBank BOC MitsubishiUFJ
BNPParibas
HSBC JPMorgan BofA Citigroup

32
The Operating Leasing Industry

33
The Operating Leasing Industry Today
5 key airframe manufacturers
3 key engine manufacturers
10,000+ supply chain partners
c.800 airlines globally
46,950 new aircraft required over
the next 20 years1
200+ active banks
1000+ capital market investors
350+ aircraft lessors
SuppliersCustomers
Funding Investors
Aircraft
Leasing
Industry
Notes:
1. Boeing CMO 2017-2036

34
Major Changes In The Operating Leasing Industry Since 1990
3 key airframe manufacturers
disappeared as individual OEMs
(McDonnell Douglas, Canadair,
Fokker)
489 airlines in 1990
300+ airlines filed for bankruptcy
since 2000
1990s: Japanese banks
2000s: European commercial banks
2010s: Asian banks; equity & debt
capital markets; ABS market
SuppliersCustomers
Funding Investors
Aircraft
Leasing
Industry
1990s: US, Japan
2000s: Middle East
2010s: Chinese; ABS investors

No of owned aircraft Market share (%) Current Status
GPA 352 19.7
Polaris 263 14.7
ILFC 139 7.8
GE Capital 111 6.2
AWAS 84 4.7
UAS 55 3.1
Electra 51 2.8
Aeronautics Leasing 46 2.6
GATX 40 2.2
Int’l Air Leases 39 2.2
35
Top 10 Lessors in 1992
Source: Hoare Govett – ‘GPA Group Plc’, 1 June 1992

36
What Happened To Them?
Export Credit
Bank Debt
Capital Markets
Cash
Source: Hoare Govett – ‘GPA Group Plc’, 1 June 1992
No of owned aircraft Market share (%) Current Status
GPA 352 19.7Partly acquired by GE Capital &
the rest by Aercap later
Polaris 263 14.7 Acquired by GE Capital
ILFC 139 7.8 Acquired by Aercap
GE Capital 111 6.2 Owns GECAS today
AWAS 84 4.7 Acquired by DAE
UAS 55 3.1 Bankrupt
Electra 51 2.8 Bankrupt
Aeronautics Leasing 46 2.6 Bankrupt
GATX 40 2.2 Acquired by Macquarie
Int’l Air Leases 39 2.2 Bankrupt

4
33
GPA Aercap
The Scale of the Industry Is Significantly Greater Today
37
Source: FlightGlobal, Company’s filings
Notes:
1. As at 31 March 1992
2. As at 30 June 2018
US$ billion, owned fleet NBV
Today’s largest aircraft lessor is at least eight times larger than 1990’s
19921 20182
GPA
Aercap =
8 x GPA
in 1992

38
Aircraft Lessor Strategic Landscape – Now
Source: Ascend, Company filingsData as of 31 December 2017 unless indicated otherwise
Notes:
1. As at 30 June 2018
2. As at 30 September 2018
3. As at 31 March 2018
4. As at 30 September 2017
5. Including finance leases
6. Completed the acquisition of SKY Leasing’s Irish subsidiary in Sep 2018
Top lessors by owned fleet value
Fleet value, US$ billion
33.0
30.0
18.5
14.9 14.312.9
12.0 11.3
9.27.9 7.6 7.4 6.8
5.6 5.44.0 4.0
2.9
1
3
4
5
5
1
1
1
1
1,5
1
6

Source: Bloomberg, October 2018; respective Company websites
Notes:
1. As at 30 June 2018 for BOCA, ALC, Aercap, Avolon, Aircastle and Aercap; as at 31 March 2018 for
SMBC, as at 30 September 2017 for ACG.
2. Calculated as annualised interest expense for the first six months of 2018 divided by average debt.
Actual 12 months for SMBC AC as at 31 March 2018, and ACG as at 30 September 2017.
3. Avolon announced the sale of 30% stake to ORIX in August 2018
4. Excluded IFRS9 adjustments of US$82.4m (BOC Aviation’s own calculations). Including, COF would
be 3.2%.
All top 10 lessors have credit ratings
Lessor Fitch S&P Global Moody’s Average cost of
funds1,2
ICBC Leasing A A A1 N.A
GECAS A A A2 N.A
BOC Aviation A- A- NR 3.1%
SMBC Aviation Capital A- BBB+ NR 3.6%
Aviation Capital Group BBB+ A- NR 4.1%
Air Lease Corporation BBB BBB NR 3.3%
Aercap Holdings BBB- BBB- Baa3 4.1%
Avolon3 BB BB+ Ba2 3.7%4
Aircastle BBB- BBB- Baa3 5.1%
Dubai Aerospace NR BB+ Ba2 N.A
39
Lessor Financing: Shift to Use Of Credit Ratings

40
• Airline market strong but reshaping in certain parts of world
• There are always new entrants and airlines leaving the market
• Shift to Asia Pacific
• Rising fuel prices and interest rates again
• Liquidity continues to be strong driving funding costs and aircraft trading
• The use of bond markets has significantly increased for lessors
• Shift to more Asian banks
• Supply side
• Record number of new aircraft types
• Stress on supply chain
• Competition in leasing is fierce
• Recent M&A hardly changes overall market concentration
• Most lessors in 1990 don’t exist today, but talent has just moved
around
Conclusions

Disclaimer
This presentation contains general background information about the activities of BOC Aviation Limited (“BOC Aviation”), current as at the date hereof. This document does notconstitute or form part of and should not be construed as, an offer to sell or issue or the solicitation of an offer to buy or acquire securities of BOC Aviation or any of its subsidiariesor affiliates in any jurisdiction or an inducement to enter into investment activity.
The information contained in this document has not been independently verified and no representation or warranty, expressed or implied, is made as to, and no reliance should beplaced on, the information or opinions contained herein. The information set out herein may be subject to revision and may change materially. BOC Aviation is not under anyobligation to keep current the information contained in this document and any opinions expressed in it are subject to change without notice. None of BOC Aviation or any of itsaffiliates, advisers or representatives (including directors, officers and employees) shall have any liability whatsoever for any loss whatsoever arising from any use of this documentor its contents or otherwise arising in connection with this document (whether direct, indirect, consequential or other).
No part of this document, nor the fact of its distribution, should form the basis of, or be relied on in connection with, any contract or commitment or investment decision whatsoever.No representation, warranty or undertaking, express or implied, is made as to, and no reliance should be placed on, the fairness, accuracy, completeness or correctness of theinformation or the opinions contained herein. None of BOC Aviation or any of its affiliates, advisors, agents or representatives including directors, officers and employees shall haveany liability whatsoever (in negligence or otherwise) for any loss howsoever arising from any use of this document or its contents or otherwise arising in connection with thedocument. This document is highly confidential and is being given solely for your information and for your use and may not be shared, copied, reproduced or redistributed to anyother person in any manner.
This document may contain “forward-looking statements”, which include all statements other than statements of historical facts, including, without limitation, any statementspreceded by, followed by or that include the words “will”, “would”, “aim”, “aimed”, “will likely result”, “is likely”, “are likely”, “believe”, “expect”, “expected to”, “will continue”, “willachieve”, “anticipate”, “estimate”, “estimating”, “intend”, “plan”, “contemplate”, “seek to”, “seeking to”, “trying to”, “target”, “propose to”, “future”, “objective”, “goal”, “project”, “should”,“can”, “could”, “may”, “will pursue” or similar expressions or the negative thereof. Such forward-looking statements involve known and unknown risks, uncertainties and otherimportant factors beyond BOC Aviation’s control that could cause the actual results, performance or achievements of BOC Aviation to be materially different from future results,performance or achievements expressed or implied by such forward-looking statements. Neither BOC Aviation nor any of its affiliates, agents, advisors or representatives (includingdirectors, officers and employees) intends or has any duty or obligation to supplement, amend, update or revise any of the forward-looking statements contained in this document.
Any securities or strategies mentioned herein (if any) may not be suitable for all investors. Recipients of this document are required to make their own independent investigation andappraisal of the business and financial condition of BOC Aviation, and any tax, legal, accounting and economic considerations that may be relevant. This document contains datasourced from and the views of independent third parties. In replicating such data in this document, BOC Aviation does not make any representation, whether express or implied, asto the accuracy of such data. The replication of any views in this document should not be treated as an indication that BOC Aviation agrees with or concurs with such views.
The information contained in this document is provided as at the date of this document and is subject to change without notice.
41

42
www.bocaviation.com
BOC Aviation Limited 8 Shenton Way #18-01 Singapore 068811 Phone +65 6323 5559 Facsimile +65 6323 6962
Incorporated in the Republic of Singapore with limited liability
Company Registration No. 199307789K


![Index [docs.rs-online.com]](https://img.pdfslide.us/doc/110x75/62036fa806a66a2c2a386228/index-docsrs-.jpg)