Embed Size (px)
Citation preview
Reflectance and Fluorescent Spectra Recovery based on FluorescentChromaticity Invariance under Varying Illumination
Ying FuThe University of Tokyo
Antony LamNational Institute of Informatics
Yasuyuki KobashiMinistry of Internal
Affairs and [email protected]
Imari SatoNational Institute of Informatics
Takahiro OkabeKyushu Institute of Technology
Yoichi SatoThe University of [email protected]
Abstract
In recent years, fluorescence analysis of scenes has re-ceived attention. Fluorescence can provide additional in-formation about scenes, and has been used in applicationssuch as camera spectral sensitivity estimation, 3D recon-struction, and color relighting. In particular, hyperspec-tral images of reflective-fluorescent scenes provide a richamount of data. However, due to the complex nature offluorescence, hyperspectral imaging methods rely on spe-cialized equipment such as hyperspectral cameras and spe-cialized illuminants. In this paper, we propose a morepractical approach to hyperspectral imaging of reflective-fluorescent scenes using only a conventional RGB cameraand varied colored illuminants. The key idea of our ap-proach is to exploit a unique property of fluorescence: thechromaticity of fluorescence emissions are invariant underdifferent illuminants. This allows us to robustly estimatespectral reflectance and fluorescence emission chromatic-ity. We then show that given the spectral reflectance andfluorescent chromaticity, the fluorescence absorption andemission spectra can also be estimated. We demonstratein results that all scene spectra can be accurately estimatedfrom RGB images. Finally, we show that our method can beused to accurately relight scenes under novel lighting.
1. Introduction
Fluorescence analysis has received attention in recentyears. This is because fluorescence can provide additionalinformation about scenes and has been applied to problemsin camera spectral sensitivity estimation [5], 3D reconstruc-tion [16, 18], immersion range scanning [6], and color re-lighting [10, 4] to name a few. In particular, hyperspec-
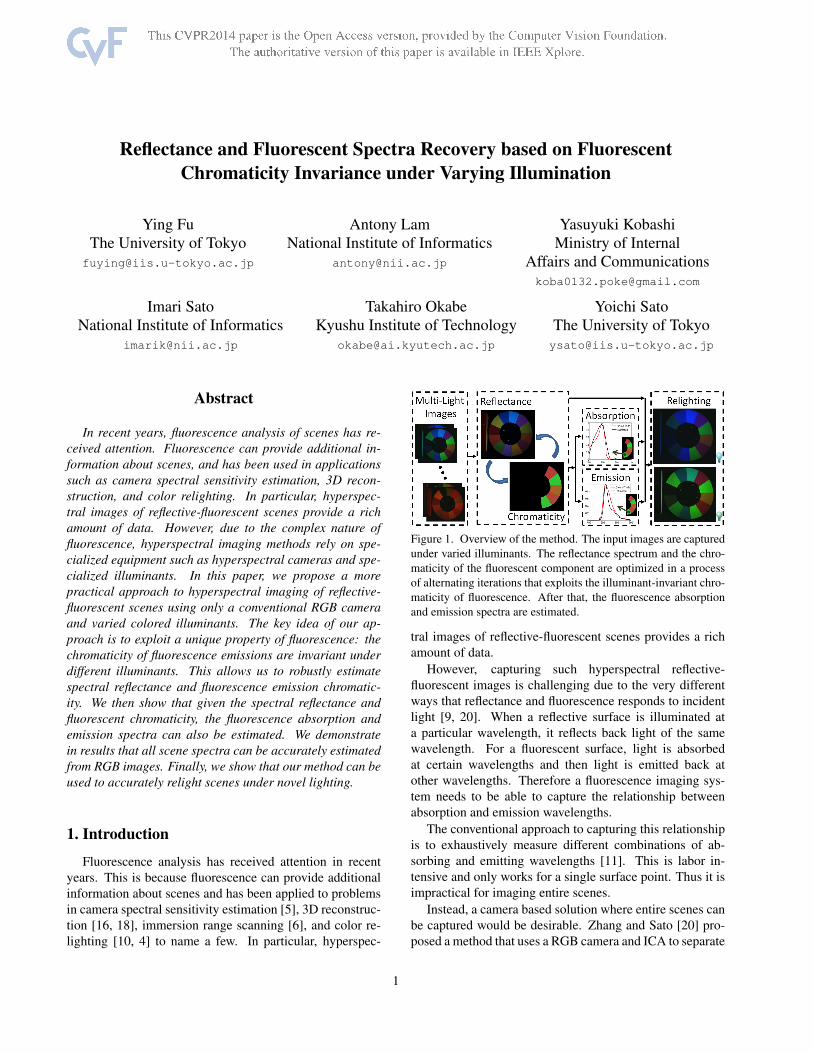
Figure 1. Overview of the method. The input images are capturedunder varied illuminants. The reflectance spectrum and the chro-maticity of the fluorescent component are optimized in a processof alternating iterations that exploits the illuminant-invariant chro-maticity of fluorescence. After that, the fluorescence absorptionand emission spectra are estimated.
tral images of reflective-fluorescent scenes provides a richamount of data.
However, capturing such hyperspectral reflective-fluorescent images is challenging due to the very differentways that reflectance and fluorescence responds to incidentlight [9, 20]. When a reflective surface is illuminated ata particular wavelength, it reflects back light of the samewavelength. For a fluorescent surface, light is absorbedat certain wavelengths and then light is emitted back atother wavelengths. Therefore a fluorescence imaging sys-tem needs to be able to capture the relationship betweenabsorption and emission wavelengths.
The conventional approach to capturing this relationshipis to exhaustively measure different combinations of ab-sorbing and emitting wavelengths [11]. This is labor in-tensive and only works for a single surface point. Thus it isimpractical for imaging entire scenes.
Instead, a camera based solution where entire scenes canbe captured would be desirable. Zhang and Sato [20] pro-posed a method that uses a RGB camera and ICA to separate
1
reflective and fluorescent components but their method doesnot capture spectral distributions. In recent work, methodsfor hyperspectral imaging of reflective-fluorescent sceneshave been proposed [10, 4]. These methods are effectivebut require specialized cameras and specialized illuminantssuch as narrowband light or high frequency light spectra.
We propose a more practical approach to hyperspectralimaging of reflective-fluorescent scenes using only a con-ventional RGB camera and varied colored illuminants. Ourmethod takes as input RGB images under different lightingand effectively separates reflectance and fluorescence in thespectral domain. These separated results can then be usedfor tasks such as accurate color relighting of scenes undernovel lighting (Figure 1).
The key idea in our approach is to exploit a unique prop-erty of fluorescence: the chromaticity of fluorescence emis-sions are invariant under different illuminants. Based onthis property, we formulate a method that takes RGB imagesand performs pixel-wise estimation of spectral reflectanceand fluorescent chromaticity. The method works by itera-tively improving estimates of the spectral reflectance andfluorescent chromaticity in turn. We show our method isrobust to initialization conditions and converges onto ac-curate spectral reflectance and fluorescent chromaticity forreal scenes. Then we propose methods for estimating thefluorescence absorption and emission spectra of the scenegiven the estimated spectral reflectance data and fluorescentchromaticities.In summary, our main contributions are that we
1. Exploit the illuminant-invariant chromaticity of fluo-rescence to estimate both spectral reflectance and fluo-rescent chromaticity from RGB images,
2. Devise a means for estimating fluorescence absorptionand emission spectra from given spectral reflectanceand fluorescent chromaticity,
3. Ultimately, presenting the first system capable ofimaging all reflective and fluorescence absorption andemission spectra of real scenes using only a conven-tional RGB camera and varied colored illuminants.
We show our method is accurate and demonstrate its effec-tiveness in predicting color relighting of real scenes.
2. Related WorkA number of methods for capturing only the spectral re-
flectance of scenes using conventional RGB cameras havebeen proposed [3, 12, 8]. These methods are practical andeffective for imaging spectral reflectance but their limitationis they cannot accurately capture scenes with fluorescentsurfaces. The reason for this loss in accuracy is because re-flective and fluorescent surfaces react to incident light verydifferently.
The detrimental effects of not considering fluorescenceis nicely illustrated in Johnson and Fairchild [9] wherethey showed that taking fluorescence into account dramati-cally improved color renderings. Furthermore, Barnard pro-posed improvements to color constancy algorithms whichincluded spectral data from several fluorescent materials[2]. Later, Wilkie et al. [19] showed accurate results byrendering fluorescence emissions using diffuse surfaces thatcan reflect light at a wavelength different from its incidentilluminant wavelength. Hullin et al. [7] also demonstratedthe importance of modeling different reflective-fluorescentmaterials by introducing the bidirectional reflectance andreradiation distribution function (BRRDF).
A conventional way to measure fluorescence in the spec-tral domain is to use Bispectral measurements [11]. How-ever, exhaustively measuring different combinations of ab-sorption and emission wavelengths is labor intensive. Inaddition, such measurements only work for a single surfacepoint. Thus they are impractical for imaging scenes.
Instead, a camera based approach is more desirable.Zhang and Sato [20] proposed an ICA based reflective-fluorescent separation method. Tominaga et al. [17] usedtwo light sources and multispectral imaging to estimate flu-orescence emission spectra. Alterman et al. separatedthe appearance of each fluorescent dye from a mixture byunmixing multiplexed images [1]. None of these methodsfully recover all reflective and fluorescent components ofscenes. In recent work, methods for hyperspectral imagingof reflective-fluorescent scenes have been proposed. Lamand Sato [10] provided a method for recovering the fullspectral reflectance and fluorescence absorption and emis-sion spectra of scenes but they require a multiband cameraand multiple narrowband illuminants. Fu et al. [4] also re-covered the full spectral reflectance and fluorescence spec-tra of scenes by using high frequency light spectra but theyrequire a hyperspectral camera and a programmable lightsource: a device that can be programmed to produce ar-bitrary light spectra. While effective, these methods requirespecialized equipment so their use in applications is limited.We propose a more practical approach to fully capturing thereflectance and fluorescence absorption and emission spec-tra of scenes using a RGB camera and varied illuminants.
3. Reflectance and Fluorescence Spectra Esti-mation
3.1. Problem Formulation
We start by describing the basic formulation of our prob-lem. When taking an image of a scene with reflective-fluorescent components using a RGB camera, the intensityof each pixel for the n-th channel under the m-th illuminantis
pmn = rmn + fmn . (1)
2
rmn is the reflective component for the n-th channel underthe m-th illuminant and can be described by
rmn =
∫cn(λ)lm(λ)s(λ)dλ, (2)
where s(λ) is the spectral reflectance of the material atwavelength λ, lm(λ) is the m-th illuminant’s intensity andcn(λ) (n = 1, 2, 3) is the corresponding camera spectralsensitivity for the R, G, and B channels.fmn is the fluorescent component [20] for the n-th chan-
nel under the m-th illuminant and
fmn =
(∫lm(λ
′)a(λ
′)dλ
′)∫
cn(λ)e(λ)dλ = kmDn
(3)where λ
′and λ are the wavelengths of the incident light and
the outgoing fluorescence emission respectively, a(λ′) and
e(λ) represent the absorption and emission spectra at theirrespective wavelengths, and km =
∫lm(λ
′)a(λ
′)dλ
′and
Dn =∫cn(λ)e(λ)dλ.
Substituting Equations (2) and (3) into Equation (1),
pmn =
∫cn(λ)lm(λ)s(λ)dλ
+
(∫lm(λ
′)a(λ
′)dλ
′)∫
cn(λ)e(λ)dλ.(4)
Equation (4) describes how the components of areflective-fluorescent surface jointly appear in a camera im-age under illuminant lm. Our task is to determine the fullspectral reflectance s and fluorescence absorption spectruma and emission spectrum e given the observed pmn underdifferent illuminants lm and camera spectral sensitivity cn,which can be estimated by
{s, a, e} = argmins,a,e
G(s,a, e), (5)
where
G(s,a, e) =∑m
∑n
‖pmn − pmn (s,a, e)‖22 (6)
and pmn (s,a, e) is the estimated parameterization of pmn .Our method for optimizing Equation (5) makes use of
the illuminant-invariant chromaticity of fluorescence. Wenow show how chromaticity value Emn of the fluorescentcomponent under the m-th illuminant for the n-th channelcan be computed. We define chromaticity as the normalizedRGB fluorescence emission,
Emn =kmDn∑3t=1 kmDt
=Dn∑3t=1Dt
= En, (7)
where En is called the reference chromaticity.Equation (7) implies chromaticity value Emn is indepen-
dent of its illuminant and is thus constant. We also note that
since∑3nEn = 1, E3 = 1 − E1 − E2, the chromaticity
can be uniquely expressed with only 2 values. However, forconvenience in our derivations, we will express chromatic-ity in terms of 3 values.
In summary, we will determine all spectral componentsin two stages. We start by using the illuminant-invariantchromaticity of fluorescence to estimate the reflectancespectrum s and the fluorescent chromaticity values En forall channels n. After that, the fluorescence absorption spec-trum a and emission spectrum e can be recovered. Figure 1shows an overview of the proposed method.
3.2. Reflectance Spectrum Recovery
In the previous sections, we described that the chro-maticity of fluorescence is invariant under different illumi-nants. We now show how to use the illuminant-invariantchromaticity of fluorescence in conjunction with basis func-tions for spectral reflectance to estimate the spectral re-flectance of the scene.
According to a previous study [15], the spectral re-flectance of various materials can be approximately repre-sented by using a small number of basis functions as
s(λ) =
J∑j=1
αjbj(λ), (8)
where bj(λ)(j = 1, 2, · · · , J) are the basis functions forspectral reflectance and αj are the corresponding coeffi-cients. From Equation (8), Equation (2) can be rewrittenas
rmn =∑j
αj
∫cn(λ)lm(λ)bj(λ)dλ =
∑j
αjqmn,j , (9)
where qmn,j =∫cn(λ)lm(λ)bj(λ)dλ.
We now show that the illuminant-invariant chromaticityof the fluorescence makes it possible to estimate the spectralreflectance s without knowing absorption spectrum a andemission spectrum e. First note that fmn = pmn −rmn = pmn −∑j αjq
mn,j . According Equation (7), the chromaticity value
Emn for channel n under illumination m can be computedby
Emn =fmn∑t f
mt
=pmn −
∑j αjq
mn,j∑
t(pmt −
∑j αjq
mt,j)
= En. (10)
By straightforward algebraic manipulation of Equation(10), we can see that
pmn = En∑t
(pmt −∑j
αjqmt,j)+
∑j
αjqmn,j = pmn (α,E).
(11)where α is the set of coefficients αj(j = 1, 2, ...J) andE is the set of chromaticity values En(n = 1, 2, 3), and
3
pmn (α,E) is the parameterization of pmn . Then instead ofminimizing Equation (6), we can minimize
G(α,E) =∑m
∑n
‖pmn − pmn (α, En)‖22, (12)
where pmn (α, En) is called the estimated parameterizationof pmn . Equation (12) shows that coefficients α and chro-maticity E can be estimated in place of s, a, and e.
The parameters α and E need to be chosen to minimizethe error function in Equation (12). Determining α wouldallow for recovering the spectral reflectance s according toEquation (8). Finding E would provide us with the flu-orescent chromaticity which will be used in later steps todetermine the fluorescence spectral components.
We propose a simple and effective method for estimatingparametersα andE using alternating iterations to convergeupon a solution. We first initializeE to an approximation ofthe true emission chromaticity by setting it to be the averageof the RGB values of the surface point imaged under the Milluminants. A more detailed discussion on the initializationof E can be found in Section 3.5. We then solve for α as
ααα = argminα
∑m
∑n
‖pmn − pmn (α,E)‖22. (13)
One way to solve Equation (13) is to find α suchthat pmn = pmn (α,E) = En
∑t(p
mt −
∑Jj=1 αjq
mt,j) +∑J
j=1 αjqmn,j . Then rearranging terms in the equation, we
can getymn =
∑j
αjwmn,j , (14)
where ymn = pmn −En∑t pmt andwmn,j = qmn,j−En
∑t qmt,j .
Equation (14) can be solved for all m and n in matrix formby finding the vector α = [α1, ..., αJ ]
T such that
y =Wα, (15)
where y = [y11 , y12 , y
13 , ..., y
M1 , yM2 , yM3 ]T , is a 3M × 1 vec-
tor andW is a 3M×J matrix whereW3(m−1)+n,j = wmn,j .In our system, we actually have 2M independent equa-
tions because chromaticity is uniquely expressed in only 2values. We choose M , such that 2M > J , so the prob-lem of estimating coefficients α is over-determined. Weadopted the constrained minimization method employed inPark et al. [14] with a non-negative constraint on the recon-structed reflectance spectrum and use the second derivativeof the reflectance spectrum with respect to λ as a smooth-ness constraint,
α =argmin
{‖y −Wα‖22 + µr
∫ (∂2s(λ)
∂λ2
)2
dλ
},
s.t. Bα ≥ 0 for all λ,(16)
where µr is a weight for the constraint term. B’s columnsare the reflectance spectral basis vectors bm.
Given the estimated α, E can be estimated by minimiz-ing the same error function in Equation (12) with the con-straint that
∑3nEn = 1. After several alternating iterations
between estimating α and E, we converge upon a solutionwhereα andE are well estimated. Withα estimated, spec-tral reflectance s can be reconstructed by Equation (8).
3.3. Fluorescence Absorption Spectrum Recovery
Using the obtained spectral reflectance s and Equation(2), the appearance of the fluorescent component under them-th illuminant is computed as fmn = pmn −rmn and we willdescribe how the fluorescence spectral components can beestimated given fmn .
Previous work has also shown that absorption spectra canbe well represented by basis functions [10]. In our inves-tigation, we have found that a large collection of absorp-tion spectra from the McNamara and Boswell FluorescenceSpectral Dataset [13] can be well represented using 9 prin-cipal components. Thus our observed absorption spectrumcan be expressed as a linear combination of basis vectors
a(λ) =
9∑i=1
βivi(λ), (17)
where vi(λ) (i = 1, · · · , 9) is the i-th basis vector at wave-length λ and βi is the corresponding coefficient. FromEquations (3) and (17) the fluorescent component fmn canbe described as
fmn = Dn
∑i
βm
∫lm(λ)vi(λ)dλ = Dn
∑i
βmhmi
= γEn∑i
βmhmi
(18)where hmi =
∫lm(λ)vi(λ)dλ and γ =
∑3t=1Dt.
En was determined from Section 3.2 so it can be used torecover the fluorescence absorption spectrum by estimatingthe coefficients βi as
βββ = argminβββ
∑m
∑n
‖fmn − γEn∑i
βihmi ‖22. (19)
Similarly to Equation (16), this is solved with a regulariza-tion term as
βββ =argmin
{‖f −Hβ‖22 + µa
∫ (∂2a(λ)
∂λ2
)2
dλ
},
s.t. V β ≥ 0 for all λ,(20)
where f = [f11 , · · · , fM3 ]T , is a 3M × 1 vector, β =γ[β1, · · · , β9]T is a 9 × 1 coefficient vector, and H is a
4
0 50 100 150 2000
0.02
0.04
0.06
0.08
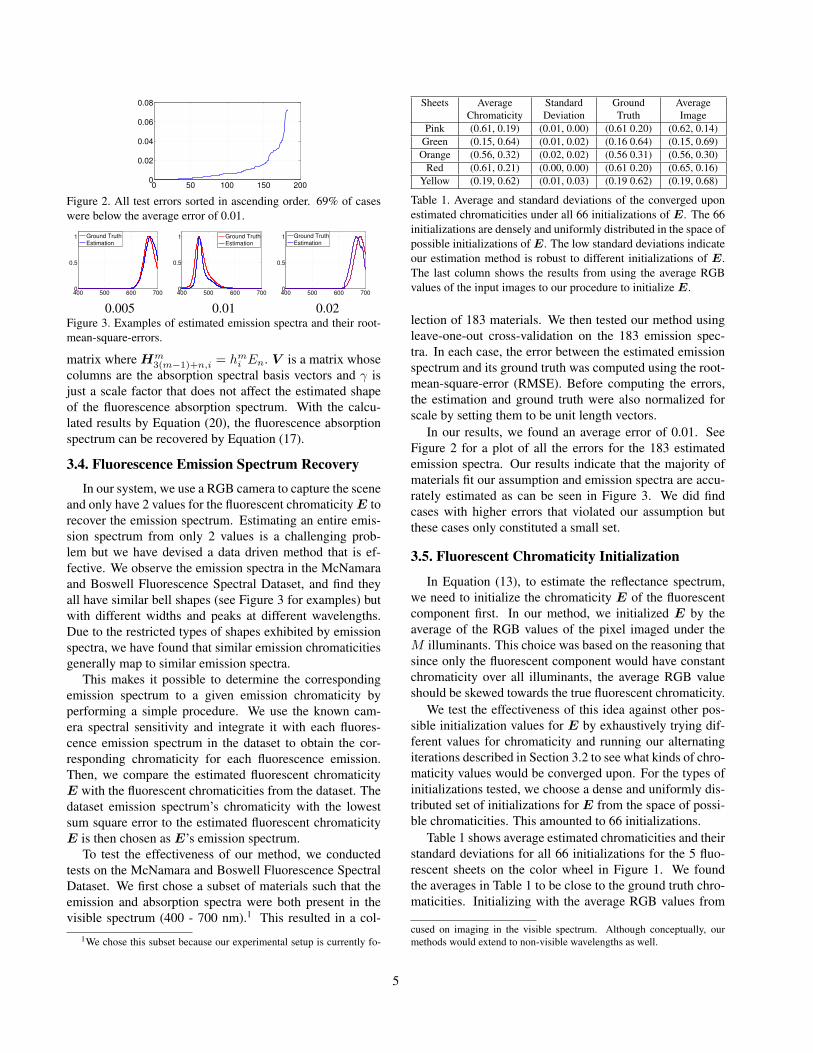
Figure 2. All test errors sorted in ascending order. 69% of caseswere below the average error of 0.01.
400 500 600 7000
0.5
1
Ground Truth
Estimation
400 500 600 7000
0.5
1
Ground Truth
Estimation
400 500 600 7000
0.5
1
Ground Truth
Estimation
0.005 0.01 0.02Figure 3. Examples of estimated emission spectra and their root-mean-square-errors.
matrix whereHm3(m−1)+n,i = hmi En. V is a matrix whose
columns are the absorption spectral basis vectors and γ isjust a scale factor that does not affect the estimated shapeof the fluorescence absorption spectrum. With the calcu-lated results by Equation (20), the fluorescence absorptionspectrum can be recovered by Equation (17).
3.4. Fluorescence Emission Spectrum Recovery
In our system, we use a RGB camera to capture the sceneand only have 2 values for the fluorescent chromaticityE torecover the emission spectrum. Estimating an entire emis-sion spectrum from only 2 values is a challenging prob-lem but we have devised a data driven method that is ef-fective. We observe the emission spectra in the McNamaraand Boswell Fluorescence Spectral Dataset, and find theyall have similar bell shapes (see Figure 3 for examples) butwith different widths and peaks at different wavelengths.Due to the restricted types of shapes exhibited by emissionspectra, we have found that similar emission chromaticitiesgenerally map to similar emission spectra.
This makes it possible to determine the correspondingemission spectrum to a given emission chromaticity byperforming a simple procedure. We use the known cam-era spectral sensitivity and integrate it with each fluores-cence emission spectrum in the dataset to obtain the cor-responding chromaticity for each fluorescence emission.Then, we compare the estimated fluorescent chromaticityE with the fluorescent chromaticities from the dataset. Thedataset emission spectrum’s chromaticity with the lowestsum square error to the estimated fluorescent chromaticityE is then chosen as E’s emission spectrum.
To test the effectiveness of our method, we conductedtests on the McNamara and Boswell Fluorescence SpectralDataset. We first chose a subset of materials such that theemission and absorption spectra were both present in thevisible spectrum (400 - 700 nm).1 This resulted in a col-
1We chose this subset because our experimental setup is currently fo-
Sheets Average Standard Ground AverageChromaticity Deviation Truth Image
Pink (0.61, 0.19) (0.01, 0.00) (0.61 0.20) (0.62, 0.14)Green (0.15, 0.64) (0.01, 0.02) (0.16 0.64) (0.15, 0.69)
Orange (0.56, 0.32) (0.02, 0.02) (0.56 0.31) (0.56, 0.30)Red (0.61, 0.21) (0.00, 0.00) (0.61 0.20) (0.65, 0.16)
Yellow (0.19, 0.62) (0.01, 0.03) (0.19 0.62) (0.19, 0.68)
Table 1. Average and standard deviations of the converged uponestimated chromaticities under all 66 initializations of E. The 66initializations are densely and uniformly distributed in the space ofpossible initializations of E. The low standard deviations indicateour estimation method is robust to different initializations of E.The last column shows the results from using the average RGBvalues of the input images to our procedure to initialize E.
lection of 183 materials. We then tested our method usingleave-one-out cross-validation on the 183 emission spec-tra. In each case, the error between the estimated emissionspectrum and its ground truth was computed using the root-mean-square-error (RMSE). Before computing the errors,the estimation and ground truth were also normalized forscale by setting them to be unit length vectors.
In our results, we found an average error of 0.01. SeeFigure 2 for a plot of all the errors for the 183 estimatedemission spectra. Our results indicate that the majority ofmaterials fit our assumption and emission spectra are accu-rately estimated as can be seen in Figure 3. We did findcases with higher errors that violated our assumption butthese cases only constituted a small set.
3.5. Fluorescent Chromaticity Initialization
In Equation (13), to estimate the reflectance spectrum,we need to initialize the chromaticity E of the fluorescentcomponent first. In our method, we initialized E by theaverage of the RGB values of the pixel imaged under theM illuminants. This choice was based on the reasoning thatsince only the fluorescent component would have constantchromaticity over all illuminants, the average RGB valueshould be skewed towards the true fluorescent chromaticity.
We test the effectiveness of this idea against other pos-sible initialization values for E by exhaustively trying dif-ferent values for chromaticity and running our alternatingiterations described in Section 3.2 to see what kinds of chro-maticity values would be converged upon. For the types ofinitializations tested, we choose a dense and uniformly dis-tributed set of initializations for E from the space of possi-ble chromaticities. This amounted to 66 initializations.
Table 1 shows average estimated chromaticities and theirstandard deviations for all 66 initializations for the 5 fluo-rescent sheets on the color wheel in Figure 1. We foundthe averages in Table 1 to be close to the ground truth chro-maticities. Initializing with the average RGB values from
cused on imaging in the visible spectrum. Although conceptually, ourmethods would extend to non-visible wavelengths as well.
5
400 450 500 550 600 650 7000
0.5
1
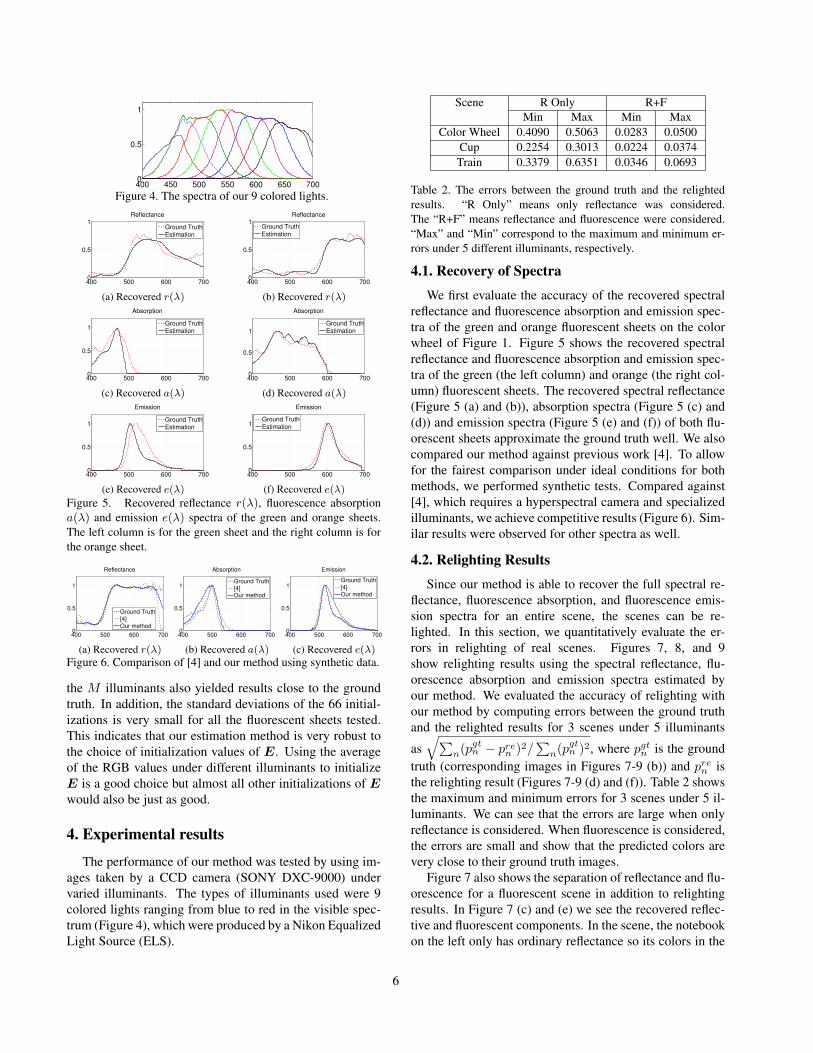
Figure 4. The spectra of our 9 colored lights.
400 500 600 7000
0.5
1
Reflectance
Ground Truth
Estimation
(a) Recovered r(λ)
400 500 600 7000
0.5
1
Reflectance
Ground Truth
Estimation
(b) Recovered r(λ)
400 500 600 7000
0.5
1
Absorption
Ground TruthEstimation
(c) Recovered a(λ)
400 500 600 7000
0.5
1
Absorption
Ground TruthEstimation
(d) Recovered a(λ)
400 500 600 7000
0.5
1
Emission
Ground Truth
Estimation
(e) Recovered e(λ)
400 500 600 7000
0.5
1
Emission
Ground Truth
Estimation
(f) Recovered e(λ)Figure 5. Recovered reflectance r(λ), fluorescence absorptiona(λ) and emission e(λ) spectra of the green and orange sheets.The left column is for the green sheet and the right column is forthe orange sheet.
400 500 600 7000
0.5
1
Reflectance
Ground Truth
[4]
Our method
(a) Recovered r(λ)
400 500 600 7000
0.5
1
Absorption
Ground Truth[4]Our method
(b) Recovered a(λ)
400 500 600 7000
0.5
1
Emission
Ground Truth
[4]
Our method
(c) Recovered e(λ)Figure 6. Comparison of [4] and our method using synthetic data.
the M illuminants also yielded results close to the groundtruth. In addition, the standard deviations of the 66 initial-izations is very small for all the fluorescent sheets tested.This indicates that our estimation method is very robust tothe choice of initialization values of E. Using the averageof the RGB values under different illuminants to initializeE is a good choice but almost all other initializations of Ewould also be just as good.
4. Experimental results
The performance of our method was tested by using im-ages taken by a CCD camera (SONY DXC-9000) undervaried illuminants. The types of illuminants used were 9colored lights ranging from blue to red in the visible spec-trum (Figure 4), which were produced by a Nikon EqualizedLight Source (ELS).
Scene R Only R+FMin Max Min Max
Color Wheel 0.4090 0.5063 0.0283 0.0500Cup 0.2254 0.3013 0.0224 0.0374Train 0.3379 0.6351 0.0346 0.0693
Table 2. The errors between the ground truth and the relightedresults. “R Only” means only reflectance was considered.The “R+F” means reflectance and fluorescence were considered.“Max” and “Min” correspond to the maximum and minimum er-rors under 5 different illuminants, respectively.
4.1. Recovery of Spectra
We first evaluate the accuracy of the recovered spectralreflectance and fluorescence absorption and emission spec-tra of the green and orange fluorescent sheets on the colorwheel of Figure 1. Figure 5 shows the recovered spectralreflectance and fluorescence absorption and emission spec-tra of the green (the left column) and orange (the right col-umn) fluorescent sheets. The recovered spectral reflectance(Figure 5 (a) and (b)), absorption spectra (Figure 5 (c) and(d)) and emission spectra (Figure 5 (e) and (f)) of both flu-orescent sheets approximate the ground truth well. We alsocompared our method against previous work [4]. To allowfor the fairest comparison under ideal conditions for bothmethods, we performed synthetic tests. Compared against[4], which requires a hyperspectral camera and specializedilluminants, we achieve competitive results (Figure 6). Sim-ilar results were observed for other spectra as well.
4.2. Relighting Results
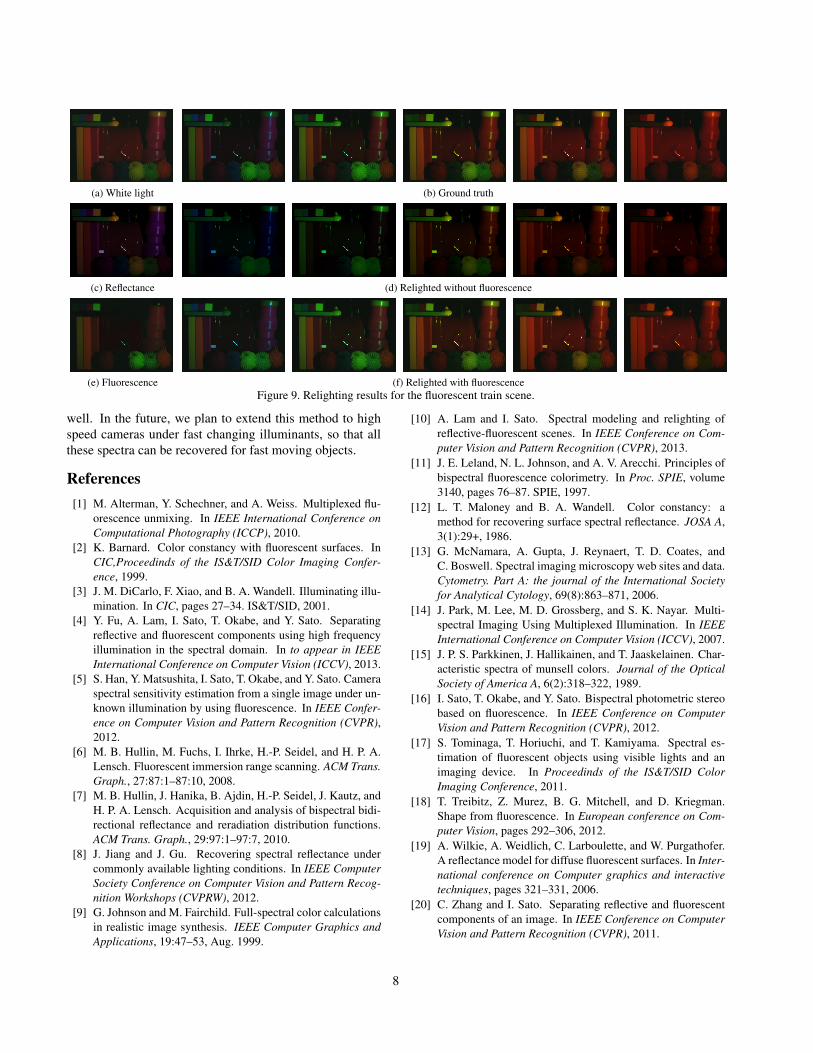
Since our method is able to recover the full spectral re-flectance, fluorescence absorption, and fluorescence emis-sion spectra for an entire scene, the scenes can be re-lighted. In this section, we quantitatively evaluate the er-rors in relighting of real scenes. Figures 7, 8, and 9show relighting results using the spectral reflectance, flu-orescence absorption and emission spectra estimated byour method. We evaluated the accuracy of relighting withour method by computing errors between the ground truthand the relighted results for 3 scenes under 5 illuminants
as√∑
n(pgtn − pren )2/
∑n(p
gtn )2, where pgtn is the ground
truth (corresponding images in Figures 7-9 (b)) and pren isthe relighting result (Figures 7-9 (d) and (f)). Table 2 showsthe maximum and minimum errors for 3 scenes under 5 il-luminants. We can see that the errors are large when onlyreflectance is considered. When fluorescence is considered,the errors are small and show that the predicted colors arevery close to their ground truth images.
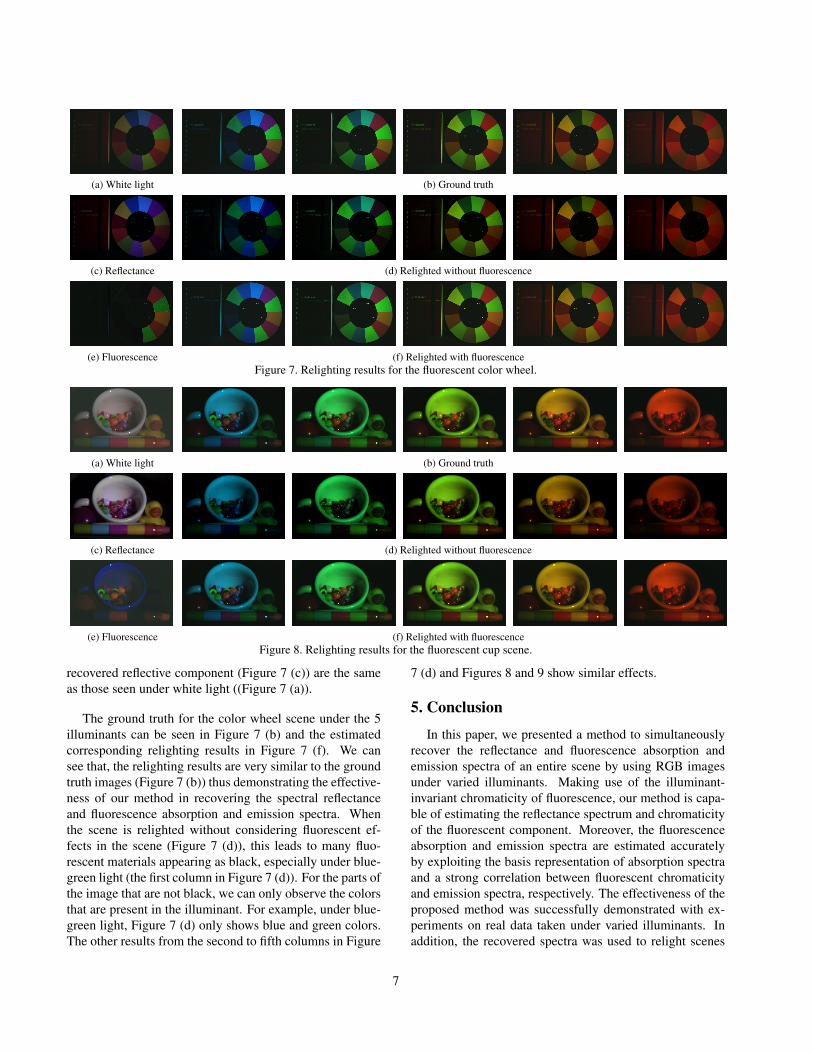
Figure 7 also shows the separation of reflectance and flu-orescence for a fluorescent scene in addition to relightingresults. In Figure 7 (c) and (e) we see the recovered reflec-tive and fluorescent components. In the scene, the notebookon the left only has ordinary reflectance so its colors in the
6
(a) White light (b) Ground truth
(c) Reflectance (d) Relighted without fluorescence
(e) Fluorescence (f) Relighted with fluorescenceFigure 7. Relighting results for the fluorescent color wheel.
(a) White light (b) Ground truth
(c) Reflectance (d) Relighted without fluorescence
(e) Fluorescence (f) Relighted with fluorescenceFigure 8. Relighting results for the fluorescent cup scene.
recovered reflective component (Figure 7 (c)) are the sameas those seen under white light ((Figure 7 (a)).
The ground truth for the color wheel scene under the 5illuminants can be seen in Figure 7 (b) and the estimatedcorresponding relighting results in Figure 7 (f). We cansee that, the relighting results are very similar to the groundtruth images (Figure 7 (b)) thus demonstrating the effective-ness of our method in recovering the spectral reflectanceand fluorescence absorption and emission spectra. Whenthe scene is relighted without considering fluorescent ef-fects in the scene (Figure 7 (d)), this leads to many fluo-rescent materials appearing as black, especially under blue-green light (the first column in Figure 7 (d)). For the parts ofthe image that are not black, we can only observe the colorsthat are present in the illuminant. For example, under blue-green light, Figure 7 (d) only shows blue and green colors.The other results from the second to fifth columns in Figure
7 (d) and Figures 8 and 9 show similar effects.
5. Conclusion
In this paper, we presented a method to simultaneouslyrecover the reflectance and fluorescence absorption andemission spectra of an entire scene by using RGB imagesunder varied illuminants. Making use of the illuminant-invariant chromaticity of fluorescence, our method is capa-ble of estimating the reflectance spectrum and chromaticityof the fluorescent component. Moreover, the fluorescenceabsorption and emission spectra are estimated accuratelyby exploiting the basis representation of absorption spectraand a strong correlation between fluorescent chromaticityand emission spectra, respectively. The effectiveness of theproposed method was successfully demonstrated with ex-periments on real data taken under varied illuminants. Inaddition, the recovered spectra was used to relight scenes
7
(a) White light (b) Ground truth
(c) Reflectance (d) Relighted without fluorescence
(e) Fluorescence (f) Relighted with fluorescenceFigure 9. Relighting results for the fluorescent train scene.
well. In the future, we plan to extend this method to highspeed cameras under fast changing illuminants, so that allthese spectra can be recovered for fast moving objects.
References[1] M. Alterman, Y. Schechner, and A. Weiss. Multiplexed flu-
orescence unmixing. In IEEE International Conference onComputational Photography (ICCP), 2010.
[2] K. Barnard. Color constancy with fluorescent surfaces. InCIC,Proceedinds of the IS&T/SID Color Imaging Confer-ence, 1999.
[3] J. M. DiCarlo, F. Xiao, and B. A. Wandell. Illuminating illu-mination. In CIC, pages 27–34. IS&T/SID, 2001.
[4] Y. Fu, A. Lam, I. Sato, T. Okabe, and Y. Sato. Separatingreflective and fluorescent components using high frequencyillumination in the spectral domain. In to appear in IEEEInternational Conference on Computer Vision (ICCV), 2013.
[5] S. Han, Y. Matsushita, I. Sato, T. Okabe, and Y. Sato. Cameraspectral sensitivity estimation from a single image under un-known illumination by using fluorescence. In IEEE Confer-ence on Computer Vision and Pattern Recognition (CVPR),2012.
[6] M. B. Hullin, M. Fuchs, I. Ihrke, H.-P. Seidel, and H. P. A.Lensch. Fluorescent immersion range scanning. ACM Trans.Graph., 27:87:1–87:10, 2008.
[7] M. B. Hullin, J. Hanika, B. Ajdin, H.-P. Seidel, J. Kautz, andH. P. A. Lensch. Acquisition and analysis of bispectral bidi-rectional reflectance and reradiation distribution functions.ACM Trans. Graph., 29:97:1–97:7, 2010.
[8] J. Jiang and J. Gu. Recovering spectral reflectance undercommonly available lighting conditions. In IEEE ComputerSociety Conference on Computer Vision and Pattern Recog-nition Workshops (CVPRW), 2012.
[9] G. Johnson and M. Fairchild. Full-spectral color calculationsin realistic image synthesis. IEEE Computer Graphics andApplications, 19:47–53, Aug. 1999.
[10] A. Lam and I. Sato. Spectral modeling and relighting ofreflective-fluorescent scenes. In IEEE Conference on Com-puter Vision and Pattern Recognition (CVPR), 2013.
[11] J. E. Leland, N. L. Johnson, and A. V. Arecchi. Principles ofbispectral fluorescence colorimetry. In Proc. SPIE, volume3140, pages 76–87. SPIE, 1997.
[12] L. T. Maloney and B. A. Wandell. Color constancy: amethod for recovering surface spectral reflectance. JOSA A,3(1):29+, 1986.
[13] G. McNamara, A. Gupta, J. Reynaert, T. D. Coates, andC. Boswell. Spectral imaging microscopy web sites and data.Cytometry. Part A: the journal of the International Societyfor Analytical Cytology, 69(8):863–871, 2006.
[14] J. Park, M. Lee, M. D. Grossberg, and S. K. Nayar. Multi-spectral Imaging Using Multiplexed Illumination. In IEEEInternational Conference on Computer Vision (ICCV), 2007.
[15] J. P. S. Parkkinen, J. Hallikainen, and T. Jaaskelainen. Char-acteristic spectra of munsell colors. Journal of the OpticalSociety of America A, 6(2):318–322, 1989.
[16] I. Sato, T. Okabe, and Y. Sato. Bispectral photometric stereobased on fluorescence. In IEEE Conference on ComputerVision and Pattern Recognition (CVPR), 2012.
[17] S. Tominaga, T. Horiuchi, and T. Kamiyama. Spectral es-timation of fluorescent objects using visible lights and animaging device. In Proceedinds of the IS&T/SID ColorImaging Conference, 2011.
[18] T. Treibitz, Z. Murez, B. G. Mitchell, and D. Kriegman.Shape from fluorescence. In European conference on Com-puter Vision, pages 292–306, 2012.
[19] A. Wilkie, A. Weidlich, C. Larboulette, and W. Purgathofer.A reflectance model for diffuse fluorescent surfaces. In Inter-national conference on Computer graphics and interactivetechniques, pages 321–331, 2006.
[20] C. Zhang and I. Sato. Separating reflective and fluorescentcomponents of an image. In IEEE Conference on ComputerVision and Pattern Recognition (CVPR), 2011.
8


![Beer-Lambert-Law Parametric Model of Reflectance Spectra ...Lambert Law for extinction [19,20], and absorption coefficients that are obtained by inversion of transmission spectra for](https://img.pdfslide.us/doc/110x75/5e66c0ddc3e51811ea7ea1be/beer-lambert-law-parametric-model-of-reflectance-spectra-lambert-law-for-extinction.jpg)