Embed Size (px)
Citation preview

Refinery Capacity Report
June 2016
With Data as of January 1, 2016
Independent Statistics & Analysis
www.eia.gov
U.S. Department of Energy
Washington, DC 20585

This report was prepared by the U.S. Energy Information Administration (EIA), the statistical and analytical agency within the U.S. Department of Energy. By law, EIA’s data, analyses, and forecasts are independent of approval by any other officer or employee of the United States Government. The views in this report therefore should not be construed as representing those of the Department of Energy or other Federal agen

Table 1. Number and Capacity of Operable Petroleum Refineries by PAD District and State as of January 1, 2016
IdleOperatingTotal
Stream Day
Barrels per
IdleOperatingTotal
Calendar Day
Barrels per
Atmospheric Crude Oil Distillation Capacity
IdleOperatingTotal
Operable Refineries
Number of
State
and
PAD District
a b b
9 9 0 1,277,500 1,245,500 32,000 1,353,000 1,318,000 35,000...............................................................................................................................................PAD District I
1 1 0 182,200 182,200 0 190,200 190,200 0........................................................................................................................................................................................................................................................................................................................................................................................................................................................................................................................................................................................................................................................................................................................................................................................................................................................................................................................................................................................................................................................................................................................................................................................................................................................................................................................................................................................................................................................................................................................................................................Delaware......................................
3 3 0 472,000 440,000 32,000 495,000 460,000 35,000........................................................................................................................................................................................................................................................................................................................................................................................................................................................................................................................................................................................................................................................................................................................................................................................................................................................................................................................................................................................................................................................................................................................................................................................................................................................................................................................................................................................................................................................................................................................................................................New Jersey......................................
4 4 0 601,000 601,000 0 644,800 644,800 0........................................................................................................................................................................................................................................................................................................................................................................................................................................................................................................................................................................................................................................................................................................................................................................................................................................................................................................................................................................................................................................................................................................................................................................................................................................................................................................................................................................................................................................................................................................................................................................Pennsylvania......................................
1 1 0 22,300 22,300 0 23,000 23,000 0........................................................................................................................................................................................................................................................................................................................................................................................................................................................................................................................................................................................................................................................................................................................................................................................................................................................................................................................................................................................................................................................................................................................................................................................................................................................................................................................................................................................................................................................................................................................................................................West Virginia......................................
27 27 0 3,922,200 3,900,200 22,000 4,220,947 4,197,947 23,000...............................................................................................................................................PAD District II
4 4 0 962,540 940,540 22,000 1,023,200 1,000,200 23,000........................................................................................................................................................................................................................................................................................................................................................................................................................................................................................................................................................................................................................................................................................................................................................................................................................................................................................................................................................................................................................................................................................................................................................................................................................................................................................................................................................................................................................................................................................................................................................................Illinois......................................
2 2 0 440,600 440,600 0 458,800 458,800 0........................................................................................................................................................................................................................................................................................................................................................................................................................................................................................................................................................................................................................................................................................................................................................................................................................................................................................................................................................................................................................................................................................................................................................................................................................................................................................................................................................................................................................................................................................................................................................................Indiana......................................
3 3 0 339,000 339,000 0 355,000 355,000 0........................................................................................................................................................................................................................................................................................................................................................................................................................................................................................................................................................................................................................................................................................................................................................................................................................................................................................................................................................................................................................................................................................................................................................................................................................................................................................................................................................................................................................................................................................................................................................................Kansas......................................
2 2 0 278,500 278,500 0 298,300 298,300 0........................................................................................................................................................................................................................................................................................................................................................................................................................................................................................................................................................................................................................................................................................................................................................................................................................................................................................................................................................................................................................................................................................................................................................................................................................................................................................................................................................................................................................................................................................................................................................................Kentucky......................................
1 1 0 132,000 132,000 0 144,000 144,000 0........................................................................................................................................................................................................................................................................................................................................................................................................................................................................................................................................................................................................................................................................................................................................................................................................................................................................................................................................................................................................................................................................................................................................................................................................................................................................................................................................................................................................................................................................................................................................................................Michigan......................................
2 2 0 378,900 378,900 0 436,800 436,800 0........................................................................................................................................................................................................................................................................................................................................................................................................................................................................................................................................................................................................................................................................................................................................................................................................................................................................................................................................................................................................................................................................................................................................................................................................................................................................................................................................................................................................................................................................................................................................................................Minnesota......................................
2 2 0 93,360 93,360 0 94,600 94,600 0........................................................................................................................................................................................................................................................................................................................................................................................................................................................................................................................................................................................................................................................................................................................................................................................................................................................................................................................................................................................................................................................................................................................................................................................................................................................................................................................................................................................................................................................................................................................................................................North Dakota......................................
4 4 0 558,000 558,000 0 618,000 618,000 0........................................................................................................................................................................................................................................................................................................................................................................................................................................................................................................................................................................................................................................................................................................................................................................................................................................................................................................................................................................................................................................................................................................................................................................................................................................................................................................................................................................................................................................................................................................................................................................Ohio......................................
5 5 0 511,300 511,300 0 547,247 547,247 0........................................................................................................................................................................................................................................................................................................................................................................................................................................................................................................................................................................................................................................................................................................................................................................................................................................................................................................................................................................................................................................................................................................................................................................................................................................................................................................................................................................................................................................................................................................................................................................Oklahoma......................................
1 1 0 190,000 190,000 0 195,000 195,000 0........................................................................................................................................................................................................................................................................................................................................................................................................................................................................................................................................................................................................................................................................................................................................................................................................................................................................................................................................................................................................................................................................................................................................................................................................................................................................................................................................................................................................................................................................................................................................................................Tennessee......................................
1 1 0 38,000 38,000 0 50,000 50,000 0........................................................................................................................................................................................................................................................................................................................................................................................................................................................................................................................................................................................................................................................................................................................................................................................................................................................................................................................................................................................................................................................................................................................................................................................................................................................................................................................................................................................................................................................................................................................................................................Wisconsin......................................
57 57 0 9,514,745 9,514,745 0 10,117,755 10,117,755 0...............................................................................................................................................PAD District III
3 3 0 131,675 131,675 0 140,500 140,500 0........................................................................................................................................................................................................................................................................................................................................................................................................................................................................................................................................................................................................................................................................................................................................................................................................................................................................................................................................................................................................................................................................................................................................................................................................................................................................................................................................................................................................................................................................................................................................................................Alabama......................................
2 2 0 90,500 90,500 0 92,700 92,700 0........................................................................................................................................................................................................................................................................................................................................................................................................................................................................................................................................................................................................................................................................................................................................................................................................................................................................................................................................................................................................................................................................................................................................................................................................................................................................................................................................................................................................................................................................................................................................................................Arkansas......................................
18 18 0 3,348,820 3,348,820 0 3,504,355 3,504,355 0........................................................................................................................................................................................................................................................................................................................................................................................................................................................................................................................................................................................................................................................................................................................................................................................................................................................................................................................................................................................................................................................................................................................................................................................................................................................................................................................................................................................................................................................................................................................................................................Louisiana......................................
3 3 0 364,000 364,000 0 397,500 397,500 0........................................................................................................................................................................................................................................................................................................................................................................................................................................................................................................................................................................................................................................................................................................................................................................................................................................................................................................................................................................................................................................................................................................................................................................................................................................................................................................................................................................................................................................................................................................................................................................Mississippi......................................
2 2 0 127,500 127,500 0 141,000 141,000 0........................................................................................................................................................................................................................................................................................................................................................................................................................................................................................................................................................................................................................................................................................................................................................................................................................................................................................................................................................................................................................................................................................................................................................................................................................................................................................................................................................................................................................................................................................................................................................................New Mexico......................................
29 29 0 5,452,250 5,452,250 0 5,841,700 5,841,700 0........................................................................................................................................................................................................................................................................................................................................................................................................................................................................................................................................................................................................................................................................................................................................................................................................................................................................................................................................................................................................................................................................................................................................................................................................................................................................................................................................................................................................................................................................................................................................................................Texas......................................
17 16 1 678,550 665,150 13,400 719,900 705,400 14,500...............................................................................................................................................PAD District IV
2 2 0 103,000 103,000 0 110,500 110,500 0........................................................................................................................................................................................................................................................................................................................................................................................................................................................................................................................................................................................................................................................................................................................................................................................................................................................................................................................................................................................................................................................................................................................................................................................................................................................................................................................................................................................................................................................................................................................................................................Colorado......................................
4 4 0 213,200 203,600 9,600 222,400 212,400 10,000........................................................................................................................................................................................................................................................................................................................................................................................................................................................................................................................................................................................................................................................................................................................................................................................................................................................................................................................................................................................................................................................................................................................................................................................................................................................................................................................................................................................................................................................................................................................................................................Montana......................................
5 5 0 181,050 181,050 0 193,100 193,100 0........................................................................................................................................................................................................................................................................................................................................................................................................................................................................................................................................................................................................................................................................................................................................................................................................................................................................................................................................................................................................................................................................................................................................................................................................................................................................................................................................................................................................................................................................................................................................................................Utah......................................
6 5 1 181,300 177,500 3,800 193,900 189,400 4,500........................................................................................................................................................................................................................................................................................................................................................................................................................................................................................................................................................................................................................................................................................................................................................................................................................................................................................................................................................................................................................................................................................................................................................................................................................................................................................................................................................................................................................................................................................................................................................................Wyoming......................................
31 30 1 2,924,041 2,839,541 84,500 3,096,000 3,006,000 90,000...............................................................................................................................................PAD District V
5 5 0 158,700 158,700 0 183,500 183,500 0........................................................................................................................................................................................................................................................................................................................................................................................................................................................................................................................................................................................................................................................................................................................................................................................................................................................................................................................................................................................................................................................................................................................................................................................................................................................................................................................................................................................................................................................................................................................................................................Alaska......................................
18 17 1 1,982,141 1,897,641 84,500 2,096,000 2,006,000 90,000........................................................................................................................................................................................................................................................................................................................................................................................................................................................................................................................................................................................................................................................................................................................................................................................................................................................................................................................................................................................................................................................................................................................................................................................................................................................................................................................................................................................................................................................................................................................................................................California......................................
2 2 0 147,500 147,500 0 152,000 152,000 0........................................................................................................................................................................................................................................................................................................................................................................................................................................................................................................................................................................................................................................................................................................................................................................................................................................................................................................................................................................................................................................................................................................................................................................................................................................................................................................................................................................................................................................................................................................................................................................Hawaii......................................
1 1 0 2,000 2,000 0 5,000 5,000 0........................................................................................................................................................................................................................................................................................................................................................................................................................................................................................................................................................................................................................................................................................................................................................................................................................................................................................................................................................................................................................................................................................................................................................................................................................................................................................................................................................................................................................................................................................................................................................................Nevada......................................
5 5 0 633,700 633,700 0 659,500 659,500 0........................................................................................................................................................................................................................................................................................................................................................................................................................................................................................................................................................................................................................................................................................................................................................................................................................................................................................................................................................................................................................................................................................................................................................................................................................................................................................................................................................................................................................................................................................................................................................................Washington......................................
141 139 2 18,317,036 18,165,136 151,900 19,507,602 19,345,102 162,500...............................................................................................................................................U.S. Total
Energy Information Administration, Refinery Capacity 20161

Table 1. Number and Capacity of Operable Petroleum Refineries by PAD District and State as of January 1, 2016
Deasphalting
Solvent
Fuels
Desulfurization
Hydrotreating/
Reforming
Catalytic
Cracking
Hydro-
Catalytic
RecycledFresh
Catalytic Cracking
Downstream Charge Capacity (Barrels per Stream Day)
Cracking
Thermal
Distillation
Vacuum
State
and
PAD District
........................................ 586,400 81,500 498,500 5,000 45,300 263,950 1,029,500 22,000PAD District I
104,600 54,500 82,000 4,000 22,300 43,800 150,500 0 ...............................................................................................................................Delaware
197,000 27,000 200,000 0 0 64,000 335,100 22,000 ...............................................................................................................................New Jersey
276,200 0 216,500 1,000 23,000 152,200 524,300 0 ...............................................................................................................................Pennsylvania
8,600 0 0 0 0 3,950 19,600 0 ...............................................................................................................................West Virginia
........................................ 1,774,854 577,185 1,339,113 15,800 322,200 892,693 3,866,599 17,850PAD District II
471,900 212,800 324,300 0 92,000 247,700 936,650 0 ...............................................................................................................................Illinois
277,900 102,000 183,200 7,200 0 71,500 469,000 0 ...............................................................................................................................Indiana
148,000 69,000 104,000 500 38,500 81,000 369,700 0 ...............................................................................................................................Kansas
122,000 0 104,000 0 0 53,800 271,150 13,000 ...............................................................................................................................Kentucky
77,500 30,000 40,000 0 0 21,500 130,000 0 ...............................................................................................................................Michigan
278,000 67,000 115,500 2,500 50,000 75,300 425,100 0 ...............................................................................................................................Minnesota
0 0 27,000 3,600 0 12,500 51,100 0 ...............................................................................................................................North Dakota
159,500 58,000 208,300 0 83,000 170,300 515,400 0 ...............................................................................................................................Ohio
219,554 38,385 151,813 2,000 32,200 115,093 536,799 4,850 ...............................................................................................................................Oklahoma
0 0 70,000 0 26,500 36,000 129,000 0 ...............................................................................................................................Tennessee
20,500 0 11,000 0 0 8,000 32,700 0 ...............................................................................................................................Wisconsin
........................................ 4,830,325 1,636,180 3,117,850 33,500 1,309,400 1,864,470 9,319,445 244,400PAD District III
47,000 32,000 0 0 18,500 37,300 109,000 0 ...............................................................................................................................Alabama
48,850 0 21,000 0 0 15,300 98,250 7,400 ...............................................................................................................................Arkansas
1,761,000 564,100 1,130,900 5,500 477,100 607,490 2,977,940 71,000 ...............................................................................................................................Louisiana
338,875 105,000 88,000 0 117,500 95,600 299,300 0 ...............................................................................................................................Mississippi
29,600 0 35,500 3,000 0 31,300 152,100 0 ...............................................................................................................................New Mexico
2,605,000 935,080 1,842,450 25,000 696,300 1,077,480 5,682,855 166,000 ...............................................................................................................................Texas
........................................ 255,500 89,800 210,020 4,990 54,800 133,850 592,060 6,000PAD District IV
33,500 0 30,000 500 0 21,900 85,000 0 ...............................................................................................................................Colorado
115,000 47,100 64,660 990 30,200 39,550 217,260 0 ...............................................................................................................................Montana
34,500 9,000 61,860 3,000 9,000 36,800 141,400 6,000 ...............................................................................................................................Utah
72,500 33,700 53,500 500 15,600 35,600 148,400 0 ...............................................................................................................................Wyoming
........................................ 1,626,206 598,600 886,700 16,400 585,900 588,100 2,675,200 80,300PAD District V
26,000 0 0 0 12,500 14,200 24,500 0 ...............................................................................................................................Alaska
1,231,756 504,800 716,300 13,400 488,400 422,500 2,166,300 56,000 ...............................................................................................................................California
71,000 11,000 22,000 0 20,000 13,500 16,500 0 ...............................................................................................................................Hawaii
2,750 0 0 0 0 0 0 0 ...............................................................................................................................Nevada
294,700 82,800 148,400 3,000 65,000 137,900 467,900 24,300 ...............................................................................................................................Washington
........................................ 9,073,285 2,983,265 6,052,183 75,690 2,317,600 3,743,063 17,482,804 370,550U.S. Total
Energy Information Administration, Refinery Capacity 2016
aRefineries where distillation units were completely idle but not permanently shutdown on January 1, 2016.
Includes capacity from refineries that are either completely or partially idle.
2
Source: Energy Information Administration (EIA), Form EIA-820, "Annual Refinery Report."
b

PAD District
and
State
Production Capacity
Alkylates Aromatics
Asphalt
and
Road Oil Isomers Lubricants
Marketable
Petroleum
Coke
Sulfur
(short
tons/day)
Hydrogen
(MMcfd)
Table 2. Production Capacity of Operable Petroleum Refineries by PAD District and State as of January 1, 2016
(Barrels per Stream Day, Except Where Noted)
a
83,429 10,111 26,500 92,765 21,045 21,120 69 1,159PAD District I
Delaware 11,729 5,191 0 6,000 0 13,620 40 596
New Jersey 29,200 0 70,000 4,000 12,000 7,500 26 280
Pennsylvania 42,500 4,920 22,065 16,500 2,945 0 0 282
West Virginia 0 0 700 0 6,100 0 3 1
280,821 113,200 167,900 267,314 10,000 172,705 582 8,352PAD District II
Illinois 84,900 17,200 38,100 16,000 0 65,995 202 2,380
Indiana 33,200 16,800 33,700 28,000 0 30,000 0 1,913
Kansas 33,500 0 4,000 32,300 0 20,060 90 712
Kentucky 21,000 3,200 35,400 18,000 0 0 0 448
Michigan 7,000 0 23,000 0 0 10,500 0 459
Minnesota 18,000 0 58,000 28,500 0 22,900 186 1,264
North Dakota 4,830 0 0 0 0 0 2 19
Ohio 28,950 20,000 23,800 31,200 0 14,200 0 683
Oklahoma 35,141 21,000 43,414 13,900 10,000 9,050 72 324
Tennessee 12,700 29,000 0 0 0 0 30 116
Wisconsin 1,600 6,000 7,900 0 0 0 0 34
632,850 198,464 324,710 201,225 202,295 501,241 910 24,820PAD District III
Alabama 0 0 15,000 5,350 0 7,120 40 228
Arkansas 5,000 0 21,500 7,500 5,500 0 13 157
Louisiana 220,000 49,900 57,000 100,220 66,000 166,057 118 6,773
Mississippi 18,600 21,000 36,125 0 48,000 35,500 243 1,355
New Mexico 10,900 0 7,000 0 0 0 38 202
Texas 378,350 127,564 64,600 211,640 82,795 292,564 458 16,105
46,250 0 16,935 82,350 0 27,775 177 1,033PAD District IV
Colorado 0 0 12,250 985 0 0 22 116
Montana 17,350 0 44,300 6,750 0 13,575 97 489
Utah 18,900 0 1,800 9,200 0 2,500 0 95
Wyoming 10,000 0 24,000 0 0 11,700 58 333
242,662 1,500 219,200 88,933 39,800 166,650 1,259 5,979PAD District V
Alaska 0 0 10,000 5,000 0 0 13 27
California 201,562 1,500 48,833 170,200 39,800 143,000 1,088 5,092
Hawaii 5,000 0 15,000 3,200 0 0 21 38
Nevada 0 0 1,600 0 0 0 0 0
Washington 36,100 0 13,500 40,800 0 23,650 137 822
1,286,012 323,275 755,245 732,587 273,140 889,491 2,997 41,343U.S. Total
Includes hydrogen production capacity of hydrogen plants on refinery grounds.
MMcfd = Million cubic feet per day.
a
Source: Energy Information Administration (EIA), Form EIA-820, "Annual Refinery Report."
Energy Information Administration, Refinery Capacity 20163

Directory of Operable Petroleum Refineries on Tables 3 and 4
Refiner State(s) Refiner State(s)
CA MS..............................................................................................................................................................................................................................................................................................................................Alon Bakersfield Operating Inc......................................................................... Hunt Southland Refining Co.........................................................................
LA CA..............................................................................................................................................................................................................................................................................................................................Alon Refining Krotz Springs Inc......................................................................... Kern Oil & Refining Co.........................................................................
TX TX..............................................................................................................................................................................................................................................................................................................................Alon USA Energy Inc......................................................................... Kinder Morgan Crude & Condensate.........................................................................
PA TX..............................................................................................................................................................................................................................................................................................................................American Refining Group Inc......................................................................... Lazarus Energy LLC.........................................................................
WY OH..............................................................................................................................................................................................................................................................................................................................Antelope Refining LLC......................................................................... Lima Refining Company.........................................................................
NJ AR..............................................................................................................................................................................................................................................................................................................................Axeon Specialty Products LLC......................................................................... Lion Oil Co.........................................................................
AK WY..............................................................................................................................................................................................................................................................................................................................BP Exploration Alaska Inc......................................................................... Little America Refining Co.........................................................................
IN CA..............................................................................................................................................................................................................................................................................................................................BP Products North America Inc......................................................................... Lunday Thagard Co.........................................................................
WA IL, KY, LA, MI, OH, TX..............................................................................................................................................................................................................................................................................................................................BP West Coast Products LLC......................................................................... Marathon Petroleum Co LP.........................................................................
OH PA..............................................................................................................................................................................................................................................................................................................................BP-Husky Refining LLC......................................................................... Monroe Energy LLC.........................................................................
UT LA, TX..............................................................................................................................................................................................................................................................................................................................Big West Oil Co......................................................................... Motiva Enterprises LLC.........................................................................
TX IL..............................................................................................................................................................................................................................................................................................................................Buckeye Texas Processing LLC......................................................................... PDV Midwest Refining LLC.........................................................................
KS CA..............................................................................................................................................................................................................................................................................................................................CHS McPherson Refinery Inc......................................................................... Paramount Petroleum Corporation.........................................................................
LA TX..............................................................................................................................................................................................................................................................................................................................Calcasieu Refining Co......................................................................... Pasadena Refining Systems Inc.........................................................................
TX NJ..............................................................................................................................................................................................................................................................................................................................Calumet Lubricants Co......................................................................... Paulsboro Refining Co LLC.........................................................................
LA, WI AK..............................................................................................................................................................................................................................................................................................................................Calumet Lubricants Co LP......................................................................... Petro Star Inc.........................................................................
MT TX..............................................................................................................................................................................................................................................................................................................................Calumet Montana Refining LLC......................................................................... Petromax Refining Co LLC.........................................................................
LA PA..............................................................................................................................................................................................................................................................................................................................Calumet Shreveport LLC......................................................................... Philadelphia Energy Solutions.........................................................................
MT CA, LA, MT, NJ, OK, TX, WA..............................................................................................................................................................................................................................................................................................................................Cenex Harvest States Coop......................................................................... Phillips 66 Company.........................................................................
LA LA..............................................................................................................................................................................................................................................................................................................................Chalmette Refining LLC......................................................................... Placid Refining Co.........................................................................
CA, HI, MS, UT TN, TX..............................................................................................................................................................................................................................................................................................................................Chevron USA Inc......................................................................... Premcor Refining Group Inc.........................................................................
LA CA..............................................................................................................................................................................................................................................................................................................................Citgo Petroleum Corp......................................................................... San Joaquin Refining Co Inc.........................................................................
TX CA..............................................................................................................................................................................................................................................................................................................................Citgo Refining & Chemical Inc......................................................................... Santa Maria Refining Company.........................................................................
KS AL..............................................................................................................................................................................................................................................................................................................................Coffeyville Resources Rfg & Mktg......................................................................... Shell Chemical LP.........................................................................
AK CA, LA, WA..............................................................................................................................................................................................................................................................................................................................ConocoPhillips Alaska Inc......................................................................... Shell Oil Products US.........................................................................
KY UT, WY..............................................................................................................................................................................................................................................................................................................................Continental Refining Company LLC......................................................................... Silver Eagle Refining.........................................................................
IN WY..............................................................................................................................................................................................................................................................................................................................Countrymark Cooperative Inc......................................................................... Sinclair Wyoming Refining Co.........................................................................
AR TX..............................................................................................................................................................................................................................................................................................................................Cross Oil Refining & Marketing Inc......................................................................... South Hampton Resources Inc.........................................................................
ND MN..............................................................................................................................................................................................................................................................................................................................Dakota Prairie Refining LLC......................................................................... St Paul Park Refining Co LLC.........................................................................
TX CO..............................................................................................................................................................................................................................................................................................................................Deer Park Refining LTD Partnership......................................................................... Suncor Energy (USA) Inc.........................................................................
DE AK..............................................................................................................................................................................................................................................................................................................................Delaware City Refining Co LLC......................................................................... Tesoro Alaska Petroleum Co.........................................................................
TX CA..............................................................................................................................................................................................................................................................................................................................Delek Refining LTD......................................................................... Tesoro Refining & Marketing Co.........................................................................
TX ND, UT, WA..............................................................................................................................................................................................................................................................................................................................Equistar Chemicals LP......................................................................... Tesoro West Coast.........................................................................
MS OH..............................................................................................................................................................................................................................................................................................................................Ergon Refining Inc......................................................................... Toledo Refining Co LLC.........................................................................
WV TX..............................................................................................................................................................................................................................................................................................................................Ergon West Virginia Inc......................................................................... Total Petrochemicals & Refining USA.........................................................................
LA WA..............................................................................................................................................................................................................................................................................................................................Excel Paralubes......................................................................... US Oil & Refining Co.........................................................................
CA, IL, LA, MT, TX PA..............................................................................................................................................................................................................................................................................................................................ExxonMobil Refining & Supply Co......................................................................... United Refining Co.........................................................................
MN, TX LA, TX..............................................................................................................................................................................................................................................................................................................................Flint Hills Resources LP......................................................................... Valero Energy Corporation.........................................................................
NV CA..............................................................................................................................................................................................................................................................................................................................Foreland Refining Corp......................................................................... Valero Refining Co California.........................................................................
AL OK..............................................................................................................................................................................................................................................................................................................................Goodway Refining LLC......................................................................... Valero Refining Co Oklahoma.........................................................................
HI TX..............................................................................................................................................................................................................................................................................................................................Hawaii Independent Energy LLC......................................................................... Valero Refining Co Texas LP.........................................................................
WY LA..............................................................................................................................................................................................................................................................................................................................HollyFrontier Cheyenne Refining LLC......................................................................... Valero Refining New Orleans LLC.........................................................................
KS IL, TX..............................................................................................................................................................................................................................................................................................................................HollyFrontier El Dorado Refining LLC......................................................................... WRB Refining LP.........................................................................
NM TX..............................................................................................................................................................................................................................................................................................................................HollyFrontier Navajo Refining LLC......................................................................... Western Refining Company LP.........................................................................
OK NM..............................................................................................................................................................................................................................................................................................................................HollyFrontier Tulsa Refining LLC......................................................................... Western Refining Southwest Inc.........................................................................
UT OK..............................................................................................................................................................................................................................................................................................................................HollyFrontier Woods Cross Refining LLC......................................................................... Wynnewood Refining Co.........................................................................
TX WY..............................................................................................................................................................................................................................................................................................................................Houston Refining LP......................................................................... Wyoming Refining Co.........................................................................
AL...............................................................................................................................................................Hunt Refining Co.........................................................................
4Energy Information Administration, Refinery Capacity 2016

Vacuum
State/Refiner/Location
Barrels per
Atmospheric Crude Oil Distillation Capacity
Barrels per
Operating Idle Operating Idle
Downstream Charge Capacity
Thermal Cracking
Delayed
Fluid Coking Visbreaking
Other/Gas Calendar Day Stream Day
Distillation Coking Oil
Table 3. Capacity of Operable Petroleum Refineries by State as of January 1, 2016
(Barrels per Stream Day, Except Where Noted)
.........................................................Alabama 131,675 0 140,500 0 47,000 32,000 0 0 0
Goodway Refining LLC
4,100 0 5,000 0 0 0 0 0 0....................................................................................................................................................................................................Atmore
Hunt Refining Co
36,000 0 40,000 0 18,000 32,000 0 0 0....................................................................................................................................................................................................Tuscaloosa
Shell Chemical LP
91,575 0 95,500 0 29,000 0 0 0 0....................................................................................................................................................................................................Saraland
.........................................................Alaska 158,700 0 183,500 0 26,000 0 0 0 0
BP Exploration Alaska Inc
10,500 0 13,000 0 0 0 0 0 0....................................................................................................................................................................................................Prudhoe Bay
ConocoPhillips Alaska Inc
15,000 0 16,000 0 0 0 0 0 0....................................................................................................................................................................................................Prudhoe Bay
Petro Star Inc
19,700 0 22,500 0 0 0 0 0 0....................................................................................................................................................................................................North Pole
55,000 0 60,000 0 0 0 0 0 0....................................................................................................................................................................................................Valdez
Tesoro Alaska Petroleum Co
58,500 0 72,000 0 26,000 0 0 0 0....................................................................................................................................................................................................Kenai
.........................................................Arkansas 90,500 0 92,700 0 48,850 0 0 0 0
Cross Oil Refining & Marketing Inc
7,500 0 7,700 0 3,850 0 0 0 0....................................................................................................................................................................................................Smackover
Lion Oil Co
83,000 0 85,000 0 45,000 0 0 0 0....................................................................................................................................................................................................El Dorado
.........................................................California 1,897,641 84,500 2,006,000 90,000 1,231,756 447,800 52,000 5,000 0
Alon Bakersfield Operating Inc
0 0 0 0 0 0 0 0 0....................................................................................................................................................................................................Bakersfield
Chevron USA Inc
269,000 0 290,500 0 169,100 74,700 0 0 0....................................................................................................................................................................................................El Segundo
245,271 0 257,200 0 123,456 0 0 0 0....................................................................................................................................................................................................Richmond
ExxonMobil Refining & Supply Co
151,300 0 157,800 0 102,300 53,000 0 0 0....................................................................................................................................................................................................Torrance
Kern Oil & Refining Co
26,000 0 27,000 0 0 0 0 0 0....................................................................................................................................................................................................Bakersfield
Lunday Thagard Co
8,500 0 10,000 0 7,000 0 0 0 0....................................................................................................................................................................................................South Gate
Paramount Petroleum Corporation
0 84,500 0 90,000 30,000 0 0 0 0....................................................................................................................................................................................................Paramount
Phillips 66 Company
120,200 0 128,000 0 93,200 51,000 0 0 0....................................................................................................................................................................................................Rodeo
139,000 0 147,000 0 82,000 53,200 0 0 0....................................................................................................................................................................................................Wilmington
San Joaquin Refining Co Inc
15,000 0 25,000 0 14,300 0 0 5,000 0....................................................................................................................................................................................................Bakersfield
Santa Maria Refining Company
9,500 0 10,000 0 10,000 0 0 0 0....................................................................................................................................................................................................Santa Maria
Energy Information Administration, Refinery Capacity 20165

Downstream Charge Capacity
Catalytic Cracking Catalytic Hydrocracking Catalytic Reforming
Fresh Recycled Distillate Gas Oil ResidualLow
Pressure
High
Pressure
Fuels Solvent
Deasphalting
Table 3. Capacity of Operable Petroleum Refineries by State as of January 1, 2016
State/Refiner/Location
(Barrels per Stream Day, Except Where Noted)
.........................................................Alabama 0 0 0 18,500 0 15,300 22,000 0
Goodway Refining LLC
....................................................................................................................................................................................................Atmore 0 0 0 0 0 0 0 0
Hunt Refining Co
....................................................................................................................................................................................................Tuscaloosa 0 0 0 18,500 0 15,300 0 0
Shell Chemical LP
....................................................................................................................................................................................................Saraland 0 0 0 0 0 0 22,000 0
.........................................................Alaska 0 0 0 12,500 0 14,200 0 0
BP Exploration Alaska Inc
....................................................................................................................................................................................................Prudhoe Bay 0 0 0 0 0 0 0 0
ConocoPhillips Alaska Inc
....................................................................................................................................................................................................Prudhoe Bay 0 0 0 0 0 0 0 0
Petro Star Inc
....................................................................................................................................................................................................North Pole 0 0 0 0 0 0 0 0
....................................................................................................................................................................................................Valdez 0 0 0 0 0 0 0 0
Tesoro Alaska Petroleum Co
....................................................................................................................................................................................................Kenai 0 0 0 12,500 0 14,200 0 0
.........................................................Arkansas 21,000 0 0 0 0 15,300 0 7,400
Cross Oil Refining & Marketing Inc
....................................................................................................................................................................................................Smackover 0 0 0 0 0 0 0 0
Lion Oil Co
....................................................................................................................................................................................................El Dorado 21,000 0 0 0 0 15,300 0 7,400
.........................................................California 716,300 13,400 191,800 296,600 0 205,800 216,700 56,000
Alon Bakersfield Operating Inc
....................................................................................................................................................................................................Bakersfield 0 0 0 15,000 0 8,000 0 0
Chevron USA Inc
....................................................................................................................................................................................................El Segundo 73,800 0 0 53,200 0 49,000 0 0
....................................................................................................................................................................................................Richmond 90,000 0 0 103,400 0 71,300 0 56,000
ExxonMobil Refining & Supply Co
....................................................................................................................................................................................................Torrance 87,800 12,400 23,000 0 0 0 18,000 0
Kern Oil & Refining Co
....................................................................................................................................................................................................Bakersfield 0 0 0 0 0 2,500 3,300 0
Lunday Thagard Co
....................................................................................................................................................................................................South Gate 0 0 0 0 0 0 0 0
Paramount Petroleum Corporation
....................................................................................................................................................................................................Paramount 0 0 0 0 0 0 12,000 0
Phillips 66 Company
....................................................................................................................................................................................................Rodeo 0 0 0 65,000 0 0 34,000 0
....................................................................................................................................................................................................Wilmington 51,600 0 27,500 0 0 0 36,200 0
San Joaquin Refining Co Inc
....................................................................................................................................................................................................Bakersfield 0 0 0 0 0 0 0 0
Santa Maria Refining Company
....................................................................................................................................................................................................Santa Maria 0 0 0 0 0 0 0 0
Energy Information Administration, Refinery Capacity 2016 6

Downstream Charge Capacity
Desulfurization (incl. Catalytic Hydrotreating)
Naphtha/
Reformer Feed Gasoline
Kerosene/
Jet Fuel Diesel Fuel
Other
Distillate Residual
Heavy
Gas Oil Other
Table 3. Capacity of Operable Petroleum Refineries by State as of January 1, 2016
State/Refiner/Location
(Barrels per Stream Day, Except Where Noted)
.........................................................Alabama 36,500 0 2,500 16,000 24,000 0 30,000 0
Goodway Refining LLC
0.................................................................................................................................................................................................... 0 0 0 0 0 0 0Atmore
Hunt Refining Co
12,100.................................................................................................................................................................................................... 0 2,500 0 24,000 0 0 0Tuscaloosa
Shell Chemical LP
24,400.................................................................................................................................................................................................... 0 0 16,000 0 0 30,000 0Saraland
.........................................................Alaska 13,000 0 0 11,500 0 0 0 0
BP Exploration Alaska Inc
0.................................................................................................................................................................................................... 0 0 0 0 0 0 0Prudhoe Bay
ConocoPhillips Alaska Inc
0.................................................................................................................................................................................................... 0 0 0 0 0 0 0Prudhoe Bay
Petro Star Inc
0.................................................................................................................................................................................................... 0 0 0 0 0 0 0North Pole
0.................................................................................................................................................................................................... 0 0 0 0 0 0 0Valdez
Tesoro Alaska Petroleum Co
13,000.................................................................................................................................................................................................... 0 0 11,500 0 0 0 0Kenai
.........................................................Arkansas 20,000 8,750 0 35,000 0 0 21,000 13,500
Cross Oil Refining & Marketing Inc
0.................................................................................................................................................................................................... 0 0 0 0 0 0 5,500Smackover
Lion Oil Co
20,000.................................................................................................................................................................................................... 8,750 0 35,000 0 0 21,000 8,000El Dorado
.........................................................California 443,100 270,500 198,100 339,300 122,100 0 723,000 70,200
Alon Bakersfield Operating Inc
8,000.................................................................................................................................................................................................... 0 0 0 0 0 21,000 0Bakersfield
Chevron USA Inc
59,000.................................................................................................................................................................................................... 0 36,300 45,500 14,000 0 73,700 0El Segundo
57,600.................................................................................................................................................................................................... 64,800 96,000 64,800 0 0 65,000 34,000Richmond
ExxonMobil Refining & Supply Co
24,700.................................................................................................................................................................................................... 0 0 18,000 0 0 106,500 0Torrance
Kern Oil & Refining Co
5,000.................................................................................................................................................................................................... 0 0 0 9,000 0 0 0Bakersfield
Lunday Thagard Co
0.................................................................................................................................................................................................... 0 0 0 0 0 0 0South Gate
Paramount Petroleum Corporation
15,000.................................................................................................................................................................................................... 0 8,500 13,000 0 0 0 0Paramount
Phillips 66 Company
27,500.................................................................................................................................................................................................... 0 0 35,000 0 0 0 0Rodeo
50,800.................................................................................................................................................................................................... 0 12,900 32,000 0 0 55,000 0Wilmington
San Joaquin Refining Co Inc
0.................................................................................................................................................................................................... 0 0 0 3,600 0 1,800 0Bakersfield
Santa Maria Refining Company
0.................................................................................................................................................................................................... 0 0 0 0 0 0 0Santa Maria
Energy Information Administration, Refinery Capacity 20167
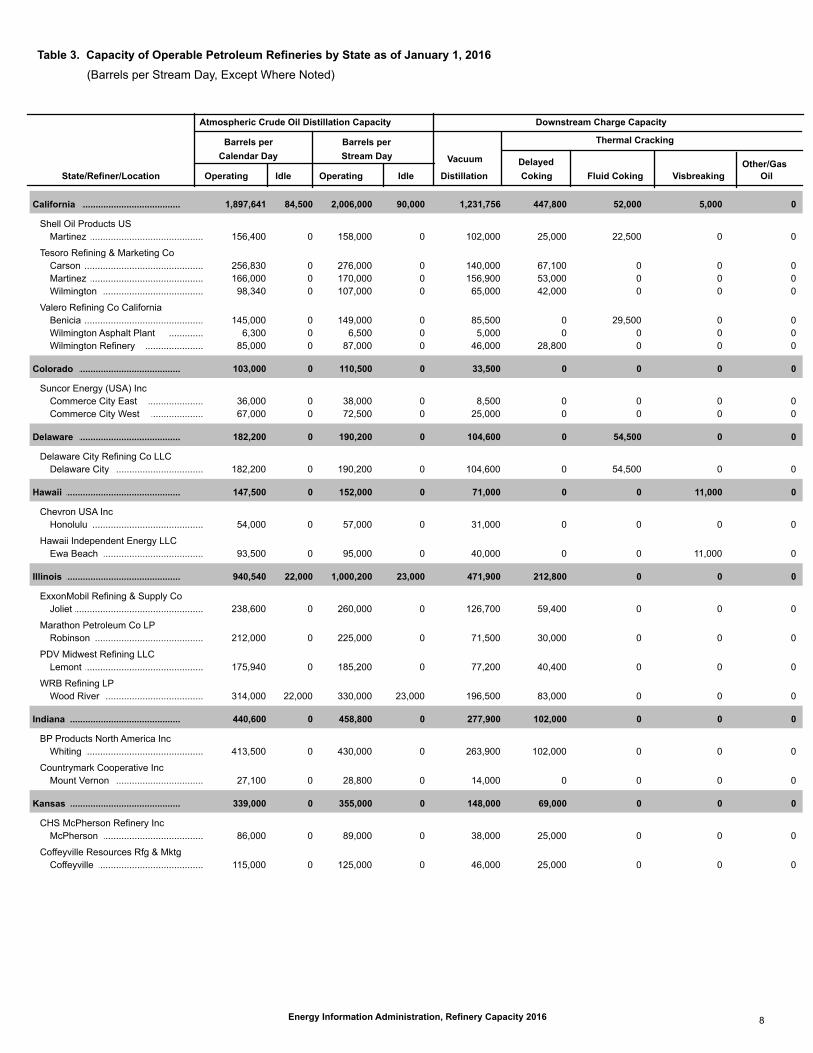
Vacuum
State/Refiner/Location
Barrels per
Atmospheric Crude Oil Distillation Capacity
Barrels per
Operating Idle Operating Idle
Downstream Charge Capacity
Thermal Cracking
Delayed
Fluid Coking Visbreaking
Other/Gas Calendar Day Stream Day
Distillation Coking Oil
Table 3. Capacity of Operable Petroleum Refineries by State as of January 1, 2016
(Barrels per Stream Day, Except Where Noted)
.........................................................California 1,897,641 84,500 2,006,000 90,000 1,231,756 447,800 52,000 5,000 0
Shell Oil Products US
156,400 0 158,000 0 102,000 25,000 22,500 0 0....................................................................................................................................................................................................Martinez
Tesoro Refining & Marketing Co
256,830 0 276,000 0 140,000 67,100 0 0 0....................................................................................................................................................................................................Carson
166,000 0 170,000 0 156,900 53,000 0 0 0....................................................................................................................................................................................................Martinez
98,340 0 107,000 0 65,000 42,000 0 0 0....................................................................................................................................................................................................Wilmington
Valero Refining Co California
145,000 0 149,000 0 85,500 0 29,500 0 0....................................................................................................................................................................................................Benicia
6,300 0 6,500 0 5,000 0 0 0 0....................................................................................................................................................................................................Wilmington Asphalt Plant
85,000 0 87,000 0 46,000 28,800 0 0 0....................................................................................................................................................................................................Wilmington Refinery
.........................................................Colorado 103,000 0 110,500 0 33,500 0 0 0 0
Suncor Energy (USA) Inc
36,000 0 38,000 0 8,500 0 0 0 0....................................................................................................................................................................................................Commerce City East
67,000 0 72,500 0 25,000 0 0 0 0....................................................................................................................................................................................................Commerce City West
.........................................................Delaware 182,200 0 190,200 0 104,600 0 54,500 0 0
Delaware City Refining Co LLC
182,200 0 190,200 0 104,600 0 54,500 0 0....................................................................................................................................................................................................Delaware City
.........................................................Hawaii 147,500 0 152,000 0 71,000 0 0 11,000 0
Chevron USA Inc
54,000 0 57,000 0 31,000 0 0 0 0....................................................................................................................................................................................................Honolulu
Hawaii Independent Energy LLC
93,500 0 95,000 0 40,000 0 0 11,000 0....................................................................................................................................................................................................Ewa Beach
.........................................................Illinois 940,540 22,000 1,000,200 23,000 471,900 212,800 0 0 0
ExxonMobil Refining & Supply Co
238,600 0 260,000 0 126,700 59,400 0 0 0....................................................................................................................................................................................................Joliet
Marathon Petroleum Co LP
212,000 0 225,000 0 71,500 30,000 0 0 0....................................................................................................................................................................................................Robinson
PDV Midwest Refining LLC
175,940 0 185,200 0 77,200 40,400 0 0 0....................................................................................................................................................................................................Lemont
WRB Refining LP
314,000 22,000 330,000 23,000 196,500 83,000 0 0 0....................................................................................................................................................................................................Wood River
.........................................................Indiana 440,600 0 458,800 0 277,900 102,000 0 0 0
BP Products North America Inc
413,500 0 430,000 0 263,900 102,000 0 0 0....................................................................................................................................................................................................Whiting
Countrymark Cooperative Inc
27,100 0 28,800 0 14,000 0 0 0 0....................................................................................................................................................................................................Mount Vernon
.........................................................Kansas 339,000 0 355,000 0 148,000 69,000 0 0 0
CHS McPherson Refinery Inc
86,000 0 89,000 0 38,000 25,000 0 0 0....................................................................................................................................................................................................McPherson
Coffeyville Resources Rfg & Mktg
115,000 0 125,000 0 46,000 25,000 0 0 0....................................................................................................................................................................................................Coffeyville
Energy Information Administration, Refinery Capacity 2016 8

Downstream Charge Capacity
Catalytic Cracking Catalytic Hydrocracking Catalytic Reforming
Fresh Recycled Distillate Gas Oil ResidualLow
Pressure
High
Pressure
Fuels Solvent
Deasphalting
Table 3. Capacity of Operable Petroleum Refineries by State as of January 1, 2016
State/Refiner/Location
(Barrels per Stream Day, Except Where Noted)
.........................................................California 716,300 13,400 191,800 296,600 0 205,800 216,700 56,000
Shell Oil Products US
....................................................................................................................................................................................................Martinez 72,000 0 42,300 0 0 31,000 0 0
Tesoro Refining & Marketing Co
....................................................................................................................................................................................................Carson 102,500 0 55,000 0 0 0 43,000 0
....................................................................................................................................................................................................Martinez 72,000 1,000 0 37,000 0 26,000 0 0
....................................................................................................................................................................................................Wilmington 35,000 0 10,000 23,000 0 0 33,000 0
Valero Refining Co California
....................................................................................................................................................................................................Benicia 75,300 0 34,000 0 0 0 37,200 0
....................................................................................................................................................................................................Wilmington Asphalt Plant 0 0 0 0 0 0 0 0
....................................................................................................................................................................................................Wilmington Refinery 56,300 0 0 0 0 18,000 0 0
.........................................................Colorado 30,000 500 0 0 0 21,900 0 0
Suncor Energy (USA) Inc
....................................................................................................................................................................................................Commerce City East 9,000 500 0 0 0 11,000 0 0
....................................................................................................................................................................................................Commerce City West 21,000 0 0 0 0 10,900 0 0
.........................................................Delaware 82,000 4,000 0 22,300 0 43,800 0 0
Delaware City Refining Co LLC
....................................................................................................................................................................................................Delaware City 82,000 4,000 0 22,300 0 43,800 0 0
.........................................................Hawaii 22,000 0 2,000 18,000 0 13,500 0 0
Chevron USA Inc
....................................................................................................................................................................................................Honolulu 22,000 0 0 0 0 0 0 0
Hawaii Independent Energy LLC
....................................................................................................................................................................................................Ewa Beach 0 0 2,000 18,000 0 13,500 0 0
.........................................................Illinois 324,300 0 0 92,000 0 212,800 34,900 0
ExxonMobil Refining & Supply Co
....................................................................................................................................................................................................Joliet 99,300 0 0 0 0 52,600 0 0
Marathon Petroleum Co LP
....................................................................................................................................................................................................Robinson 54,500 0 0 38,000 0 80,500 0 0
PDV Midwest Refining LLC
....................................................................................................................................................................................................Lemont 69,500 0 0 0 0 0 34,900 0
WRB Refining LP
....................................................................................................................................................................................................Wood River 101,000 0 0 54,000 0 79,700 0 0
.........................................................Indiana 183,200 7,200 0 0 0 6,500 65,000 0
BP Products North America Inc
....................................................................................................................................................................................................Whiting 175,000 7,000 0 0 0 0 65,000 0
Countrymark Cooperative Inc
....................................................................................................................................................................................................Mount Vernon 8,200 200 0 0 0 6,500 0 0
.........................................................Kansas 104,000 500 0 38,500 0 57,500 23,500 0
CHS McPherson Refinery Inc
....................................................................................................................................................................................................McPherson 24,000 500 0 38,500 0 24,000 0 0
Coffeyville Resources Rfg & Mktg
....................................................................................................................................................................................................Coffeyville 36,000 0 0 0 0 26,000 0 0
Energy Information Administration, Refinery Capacity 20169

Downstream Charge Capacity
Desulfurization (incl. Catalytic Hydrotreating)
Naphtha/
Reformer Feed Gasoline
Kerosene/
Jet Fuel Diesel Fuel
Other
Distillate Residual
Heavy
Gas Oil Other
Table 3. Capacity of Operable Petroleum Refineries by State as of January 1, 2016
State/Refiner/Location
(Barrels per Stream Day, Except Where Noted)
.........................................................California 443,100 270,500 198,100 339,300 122,100 0 723,000 70,200
Shell Oil Products US
27,500.................................................................................................................................................................................................... 92,500 0 0 49,000 0 84,500 14,500Martinez
Tesoro Refining & Marketing Co
45,000.................................................................................................................................................................................................... 27,000 10,000 21,000 0 0 95,000 0Carson
27,000.................................................................................................................................................................................................... 43,000 0 40,000 18,500 0 69,500 0Martinez
34,000.................................................................................................................................................................................................... 0 19,000 10,000 23,000 0 45,000 0Wilmington
Valero Refining Co California
30,000.................................................................................................................................................................................................... 43,200 15,400 15,000 5,000 0 39,000 21,700Benicia
0.................................................................................................................................................................................................... 0 0 0 0 0 0 0Wilmington Asphalt Plant
32,000.................................................................................................................................................................................................... 0 0 45,000 0 0 67,000 0Wilmington Refinery
.........................................................Colorado 21,900 0 12,100 21,000 0 0 30,000 0
Suncor Energy (USA) Inc
11,000.................................................................................................................................................................................................... 0 0 0 0 0 0 0Commerce City East
10,900.................................................................................................................................................................................................... 0 12,100 21,000 0 0 30,000 0Commerce City West
.........................................................Delaware 50,000 32,000 16,500 52,000 0 0 0 0
Delaware City Refining Co LLC
50,000.................................................................................................................................................................................................... 32,000 16,500 52,000 0 0 0 0Delaware City
.........................................................Hawaii 13,000 0 0 0 0 0 0 3,500
Chevron USA Inc
0.................................................................................................................................................................................................... 0 0 0 0 0 0 3,500Honolulu
Hawaii Independent Energy LLC
13,000.................................................................................................................................................................................................... 0 0 0 0 0 0 0Ewa Beach
.........................................................Illinois 432,000 115,500 66,950 315,400 0 0 0 6,800
ExxonMobil Refining & Supply Co
169,500.................................................................................................................................................................................................... 0 0 85,100 0 0 0 0Joliet
Marathon Petroleum Co LP
68,000.................................................................................................................................................................................................... 41,500 0 79,500 0 0 0 0Robinson
PDV Midwest Refining LLC
110,200.................................................................................................................................................................................................... 0 13,700 94,500 0 0 0 6,800Lemont
WRB Refining LP
84,300.................................................................................................................................................................................................... 74,000 53,250 56,300 0 0 0 0Wood River
.........................................................Indiana 78,000 6,500 46,000 134,500 0 0 204,000 0
BP Products North America Inc
69,000.................................................................................................................................................................................................... 0 46,000 120,800 0 0 204,000 0Whiting
Countrymark Cooperative Inc
9,000.................................................................................................................................................................................................... 6,500 0 13,700 0 0 0 0Mount Vernon
.........................................................Kansas 122,500 22,000 21,000 127,200 27,000 0 50,000 0
CHS McPherson Refinery Inc
38,000.................................................................................................................................................................................................... 0 0 43,200 0 0 0 0McPherson
Coffeyville Resources Rfg & Mktg
36,000.................................................................................................................................................................................................... 22,000 9,000 30,000 27,000 0 0 0Coffeyville
Energy Information Administration, Refinery Capacity 2016 10

Vacuum
State/Refiner/Location
Barrels per
Atmospheric Crude Oil Distillation Capacity
Barrels per
Operating Idle Operating Idle
Downstream Charge Capacity
Thermal Cracking
Delayed
Fluid Coking Visbreaking
Other/Gas Calendar Day Stream Day
Distillation Coking Oil
Table 3. Capacity of Operable Petroleum Refineries by State as of January 1, 2016
(Barrels per Stream Day, Except Where Noted)
.........................................................Kansas 339,000 0 355,000 0 148,000 69,000 0 0 0
HollyFrontier El Dorado Refining LLC
138,000 0 141,000 0 64,000 19,000 0 0 0....................................................................................................................................................................................................El Dorado
.........................................................Kentucky 278,500 0 298,300 0 122,000 0 0 0 0
Continental Refining Company LLC
5,500 0 6,300 0 0 0 0 0 0....................................................................................................................................................................................................Somerset
Marathon Petroleum Co LP
273,000 0 292,000 0 122,000 0 0 0 0....................................................................................................................................................................................................Catlettsburg
.........................................................Louisiana 3,348,820 0 3,504,355 0 1,761,000 553,500 0 0 10,600
Alon Refining Krotz Springs Inc
80,000 0 83,000 0 36,200 0 0 0 0....................................................................................................................................................................................................Krotz Springs
Calcasieu Refining Co
89,000 0 90,000 0 30,000 0 0 0 0....................................................................................................................................................................................................Lake Charles
Calumet Lubricants Co LP
13,020 0 14,000 0 0 0 0 0 0....................................................................................................................................................................................................Cotton Valley
8,300 0 8,655 0 7,000 0 0 0 0....................................................................................................................................................................................................Princeton
Calumet Shreveport LLC
57,000 0 60,000 0 28,000 0 0 0 0....................................................................................................................................................................................................Shreveport
Chalmette Refining LLC
192,500 0 197,000 0 169,000 28,000 0 0 0....................................................................................................................................................................................................Chalmette
Citgo Petroleum Corp
427,800 0 440,000 0 230,000 110,000 0 0 0....................................................................................................................................................................................................Lake Charles
Excel Paralubes
0 0 0 0 0 0 0 0 0....................................................................................................................................................................................................Westlake
ExxonMobil Refining & Supply Co
502,500 0 523,200 0 246,100 123,500 0 0 0....................................................................................................................................................................................................Baton Rouge
Marathon Petroleum Co LP
539,000 0 574,000 0 297,000 93,500 0 0 0....................................................................................................................................................................................................Garyville
Motiva Enterprises LLC
235,000 0 255,000 0 119,400 0 0 0 0....................................................................................................................................................................................................Convent
237,700 0 250,000 0 91,300 28,500 0 0 0....................................................................................................................................................................................................Norco
Phillips 66 Company
247,000 0 260,000 0 103,000 26,000 0 0 0....................................................................................................................................................................................................Belle Chasse
260,000 0 273,000 0 132,000 60,000 0 0 10,600....................................................................................................................................................................................................Westlake
Placid Refining Co
75,000 0 82,500 0 27,000 0 0 0 0....................................................................................................................................................................................................Port Allen
Shell Oil Products US
45,000 0 46,000 0 25,000 0 0 0 0....................................................................................................................................................................................................Saint Rose
Valero Energy Corporation
125,000 0 128,000 0 60,000 0 0 0 0....................................................................................................................................................................................................Meraux
Valero Refining New Orleans LLC
215,000 0 220,000 0 160,000 84,000 0 0 0....................................................................................................................................................................................................Norco
.........................................................Michigan 132,000 0 144,000 0 77,500 30,000 0 0 0
Marathon Petroleum Co LP
132,000 0 144,000 0 77,500 30,000 0 0 0....................................................................................................................................................................................................Detroit
Energy Information Administration, Refinery Capacity 201611

Downstream Charge Capacity
Catalytic Cracking Catalytic Hydrocracking Catalytic Reforming
Fresh Recycled Distillate Gas Oil ResidualLow
Pressure
High
Pressure
Fuels Solvent
Deasphalting
Table 3. Capacity of Operable Petroleum Refineries by State as of January 1, 2016
State/Refiner/Location
(Barrels per Stream Day, Except Where Noted)
.........................................................Kansas 104,000 500 0 38,500 0 57,500 23,500 0
HollyFrontier El Dorado Refining LLC
....................................................................................................................................................................................................El Dorado 44,000 0 0 0 0 7,500 23,500 0
.........................................................Kentucky 104,000 0 0 0 0 21,500 32,300 13,000
Continental Refining Company LLC
....................................................................................................................................................................................................Somerset 0 0 0 0 0 0 1,300 0
Marathon Petroleum Co LP
....................................................................................................................................................................................................Catlettsburg 104,000 0 0 0 0 21,500 31,000 13,000
.........................................................Louisiana 1,130,900 5,500 55,000 370,100 52,000 501,290 106,200 71,000
Alon Refining Krotz Springs Inc
....................................................................................................................................................................................................Krotz Springs 34,000 0 0 0 0 0 13,000 0
Calcasieu Refining Co
....................................................................................................................................................................................................Lake Charles 0 0 0 0 0 0 0 0
Calumet Lubricants Co LP
....................................................................................................................................................................................................Cotton Valley 0 0 0 0 0 0 0 0
....................................................................................................................................................................................................Princeton 0 0 0 0 0 0 0 0
Calumet Shreveport LLC
....................................................................................................................................................................................................Shreveport 0 0 0 0 0 12,000 0 0
Chalmette Refining LLC
....................................................................................................................................................................................................Chalmette 75,600 0 0 0 0 22,700 0 0
Citgo Petroleum Corp
....................................................................................................................................................................................................Lake Charles 148,000 3,000 0 47,400 0 59,600 53,200 0
Excel Paralubes
....................................................................................................................................................................................................Westlake 0 0 0 43,000 0 0 0 0
ExxonMobil Refining & Supply Co
....................................................................................................................................................................................................Baton Rouge 244,500 0 27,000 0 0 76,000 0 0
Marathon Petroleum Co LP
....................................................................................................................................................................................................Garyville 138,000 0 0 117,000 0 128,000 0 38,000
Motiva Enterprises LLC
....................................................................................................................................................................................................Convent 92,000 0 0 0 52,000 0 40,000 0
....................................................................................................................................................................................................Norco 118,800 0 0 44,000 0 40,000 0 0
Phillips 66 Company
....................................................................................................................................................................................................Belle Chasse 105,000 2,000 0 0 0 48,490 0 0
....................................................................................................................................................................................................Westlake 50,000 0 0 0 0 44,000 0 0
Placid Refining Co
....................................................................................................................................................................................................Port Allen 25,000 500 0 0 0 11,000 0 11,000
Shell Oil Products US
....................................................................................................................................................................................................Saint Rose 0 0 0 0 0 0 0 0
Valero Energy Corporation
....................................................................................................................................................................................................Meraux 0 0 0 48,700 0 32,000 0 22,000
Valero Refining New Orleans LLC
....................................................................................................................................................................................................Norco 100,000 0 28,000 70,000 0 27,500 0 0
.........................................................Michigan 40,000 0 0 0 0 21,500 0 0
Marathon Petroleum Co LP
....................................................................................................................................................................................................Detroit 40,000 0 0 0 0 21,500 0 0
Energy Information Administration, Refinery Capacity 2016 12

Downstream Charge Capacity
Desulfurization (incl. Catalytic Hydrotreating)
Naphtha/
Reformer Feed Gasoline
Kerosene/
Jet Fuel Diesel Fuel
Other
Distillate Residual
Heavy
Gas Oil Other
Table 3. Capacity of Operable Petroleum Refineries by State as of January 1, 2016
State/Refiner/Location
(Barrels per Stream Day, Except Where Noted)
.........................................................Kansas 122,500 22,000 21,000 127,200 27,000 0 50,000 0
HollyFrontier El Dorado Refining LLC
48,500.................................................................................................................................................................................................... 0 12,000 54,000 0 0 50,000 0El Dorado
.........................................................Kentucky 54,800 0 31,000 78,350 0 0 107,000 0
Continental Refining Company LLC
1,300.................................................................................................................................................................................................... 0 0 850 0 0 0 0Somerset
Marathon Petroleum Co LP
53,500.................................................................................................................................................................................................... 0 31,000 77,500 0 0 107,000 0Catlettsburg
.........................................................Louisiana 699,340 759,900 240,200 891,300 44,000 12,500 305,700 25,000
Alon Refining Krotz Springs Inc
14,000.................................................................................................................................................................................................... 18,000 0 0 0 0 0 0Krotz Springs
Calcasieu Refining Co
0.................................................................................................................................................................................................... 0 0 0 0 0 0 0Lake Charles
Calumet Lubricants Co LP
6,200.................................................................................................................................................................................................... 0 0 0 0 0 0 0Cotton Valley
0.................................................................................................................................................................................................... 0 0 0 0 0 0 0Princeton
Calumet Shreveport LLC
16,000.................................................................................................................................................................................................... 0 0 14,000 0 0 21,100 1,200Shreveport
Chalmette Refining LLC
22,400.................................................................................................................................................................................................... 44,000 0 31,000 0 0 65,600 0Chalmette
Citgo Petroleum Corp
127,000.................................................................................................................................................................................................... 85,400 68,000 100,000 0 0 0 23,800Lake Charles
Excel Paralubes
0.................................................................................................................................................................................................... 0 0 0 0 0 0 0Westlake
ExxonMobil Refining & Supply Co
76,000.................................................................................................................................................................................................... 238,000 0 202,500 0 0 0 0Baton Rouge
Marathon Petroleum Co LP
108,000.................................................................................................................................................................................................... 114,000 80,000 159,000 0 0 106,000 0Garyville
Motiva Enterprises LLC
98,000.................................................................................................................................................................................................... 0 39,800 70,000 0 0 40,000 0Convent
38,500.................................................................................................................................................................................................... 77,000 0 70,000 0 0 0 0Norco
Phillips 66 Company
50,540.................................................................................................................................................................................................... 65,000 0 74,800 0 0 0 0Belle Chasse
50,000.................................................................................................................................................................................................... 38,500 24,000 55,000 0 12,500 49,000 0Westlake
Placid Refining Co
11,000.................................................................................................................................................................................................... 20,000 0 25,000 0 0 0 0Port Allen
Shell Oil Products US
0.................................................................................................................................................................................................... 0 0 0 0 0 0 0Saint Rose
Valero Energy Corporation
37,700.................................................................................................................................................................................................... 0 16,400 40,000 0 0 0 0Meraux
Valero Refining New Orleans LLC
44,000.................................................................................................................................................................................................... 60,000 12,000 50,000 44,000 0 24,000 0Norco
.........................................................Michigan 33,500 0 7,000 46,000 0 0 43,500 0
Marathon Petroleum Co LP
33,500.................................................................................................................................................................................................... 0 7,000 46,000 0 0 43,500 0Detroit
Energy Information Administration, Refinery Capacity 201613
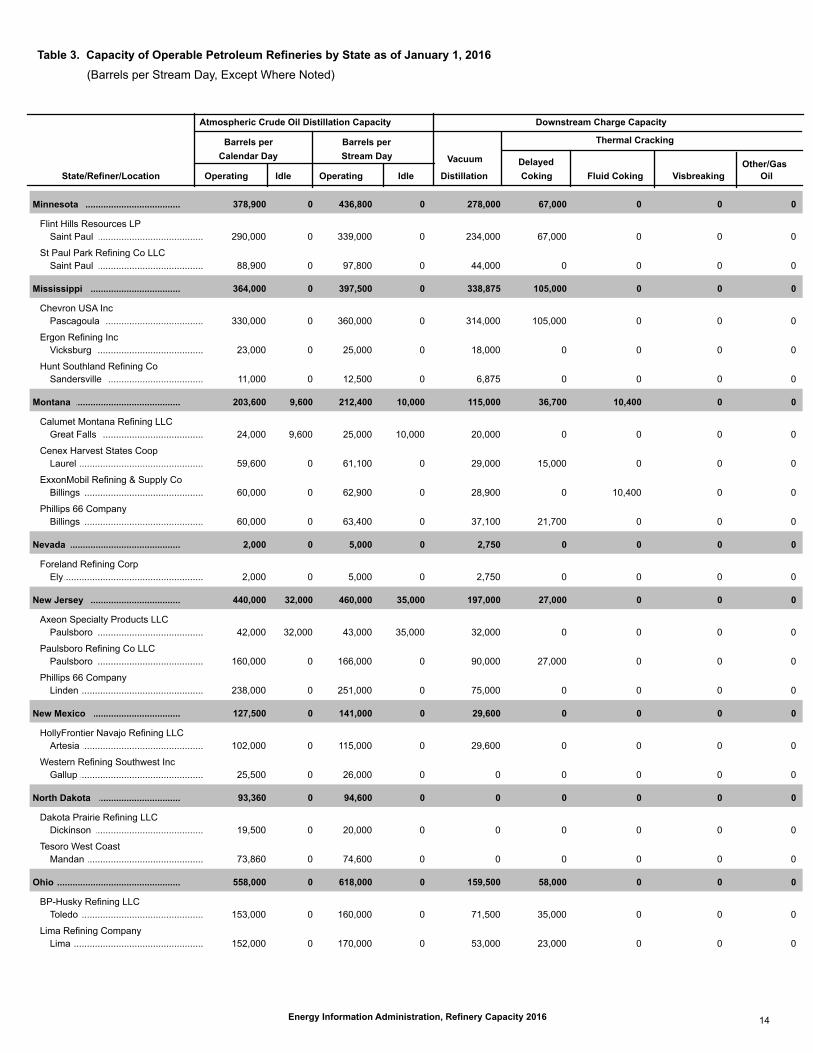
Vacuum
State/Refiner/Location
Barrels per
Atmospheric Crude Oil Distillation Capacity
Barrels per
Operating Idle Operating Idle
Downstream Charge Capacity
Thermal Cracking
Delayed
Fluid Coking Visbreaking
Other/Gas Calendar Day Stream Day
Distillation Coking Oil
Table 3. Capacity of Operable Petroleum Refineries by State as of January 1, 2016
(Barrels per Stream Day, Except Where Noted)
.........................................................Minnesota 378,900 0 436,800 0 278,000 67,000 0 0 0
Flint Hills Resources LP
290,000 0 339,000 0 234,000 67,000 0 0 0....................................................................................................................................................................................................Saint Paul
St Paul Park Refining Co LLC
88,900 0 97,800 0 44,000 0 0 0 0....................................................................................................................................................................................................Saint Paul
.........................................................Mississippi 364,000 0 397,500 0 338,875 105,000 0 0 0
Chevron USA Inc
330,000 0 360,000 0 314,000 105,000 0 0 0....................................................................................................................................................................................................Pascagoula
Ergon Refining Inc
23,000 0 25,000 0 18,000 0 0 0 0....................................................................................................................................................................................................Vicksburg
Hunt Southland Refining Co
11,000 0 12,500 0 6,875 0 0 0 0....................................................................................................................................................................................................Sandersville
.........................................................Montana 203,600 9,600 212,400 10,000 115,000 36,700 10,400 0 0
Calumet Montana Refining LLC
24,000 9,600 25,000 10,000 20,000 0 0 0 0....................................................................................................................................................................................................Great Falls
Cenex Harvest States Coop
59,600 0 61,100 0 29,000 15,000 0 0 0....................................................................................................................................................................................................Laurel
ExxonMobil Refining & Supply Co
60,000 0 62,900 0 28,900 0 10,400 0 0....................................................................................................................................................................................................Billings
Phillips 66 Company
60,000 0 63,400 0 37,100 21,700 0 0 0....................................................................................................................................................................................................Billings
.........................................................Nevada 2,000 0 5,000 0 2,750 0 0 0 0
Foreland Refining Corp
2,000 0 5,000 0 2,750 0 0 0 0....................................................................................................................................................................................................Ely
.........................................................New Jersey 440,000 32,000 460,000 35,000 197,000 27,000 0 0 0
Axeon Specialty Products LLC
42,000 32,000 43,000 35,000 32,000 0 0 0 0....................................................................................................................................................................................................Paulsboro
Paulsboro Refining Co LLC
160,000 0 166,000 0 90,000 27,000 0 0 0....................................................................................................................................................................................................Paulsboro
Phillips 66 Company
238,000 0 251,000 0 75,000 0 0 0 0....................................................................................................................................................................................................Linden
.........................................................New Mexico 127,500 0 141,000 0 29,600 0 0 0 0
HollyFrontier Navajo Refining LLC
102,000 0 115,000 0 29,600 0 0 0 0....................................................................................................................................................................................................Artesia
Western Refining Southwest Inc
25,500 0 26,000 0 0 0 0 0 0....................................................................................................................................................................................................Gallup
.........................................................North Dakota 93,360 0 94,600 0 0 0 0 0 0
Dakota Prairie Refining LLC
19,500 0 20,000 0 0 0 0 0 0....................................................................................................................................................................................................Dickinson
Tesoro West Coast
73,860 0 74,600 0 0 0 0 0 0....................................................................................................................................................................................................Mandan
.........................................................Ohio 558,000 0 618,000 0 159,500 58,000 0 0 0
BP-Husky Refining LLC
153,000 0 160,000 0 71,500 35,000 0 0 0....................................................................................................................................................................................................Toledo
Lima Refining Company
152,000 0 170,000 0 53,000 23,000 0 0 0....................................................................................................................................................................................................Lima
Energy Information Administration, Refinery Capacity 2016 14

Downstream Charge Capacity
Catalytic Cracking Catalytic Hydrocracking Catalytic Reforming
Fresh Recycled Distillate Gas Oil ResidualLow
Pressure
High
Pressure
Fuels Solvent
Deasphalting
Table 3. Capacity of Operable Petroleum Refineries by State as of January 1, 2016
State/Refiner/Location
(Barrels per Stream Day, Except Where Noted)
.........................................................Minnesota 115,500 2,500 50,000 0 0 37,000 38,300 0
Flint Hills Resources LP
....................................................................................................................................................................................................Saint Paul 87,000 0 50,000 0 0 37,000 13,800 0
St Paul Park Refining Co LLC
....................................................................................................................................................................................................Saint Paul 28,500 2,500 0 0 0 0 24,500 0
.........................................................Mississippi 88,000 0 0 117,500 0 61,600 34,000 0
Chevron USA Inc
....................................................................................................................................................................................................Pascagoula 88,000 0 0 117,500 0 61,600 34,000 0
Ergon Refining Inc
....................................................................................................................................................................................................Vicksburg 0 0 0 0 0 0 0 0
Hunt Southland Refining Co
....................................................................................................................................................................................................Sandersville 0 0 0 0 0 0 0 0
.........................................................Montana 64,660 990 6,200 24,000 0 12,500 27,050 0
Calumet Montana Refining LLC
....................................................................................................................................................................................................Great Falls 3,000 0 0 24,000 0 0 1,000 0
Cenex Harvest States Coop
....................................................................................................................................................................................................Laurel 16,500 0 0 0 0 12,500 0 0
ExxonMobil Refining & Supply Co
....................................................................................................................................................................................................Billings 23,660 0 6,200 0 0 0 12,500 0
Phillips 66 Company
....................................................................................................................................................................................................Billings 21,500 990 0 0 0 0 13,550 0
.........................................................Nevada 0 0 0 0 0 0 0 0
Foreland Refining Corp
....................................................................................................................................................................................................Ely 0 0 0 0 0 0 0 0
.........................................................New Jersey 200,000 0 0 0 0 64,000 0 22,000
Axeon Specialty Products LLC
....................................................................................................................................................................................................Paulsboro 0 0 0 0 0 0 0 0
Paulsboro Refining Co LLC
....................................................................................................................................................................................................Paulsboro 55,000 0 0 0 0 32,000 0 0
Phillips 66 Company
....................................................................................................................................................................................................Linden 145,000 0 0 0 0 32,000 0 22,000
.........................................................New Mexico 35,500 3,000 0 0 0 24,000 7,300 0
HollyFrontier Navajo Refining LLC
....................................................................................................................................................................................................Artesia 27,000 0 0 0 0 24,000 0 0
Western Refining Southwest Inc
....................................................................................................................................................................................................Gallup 8,500 3,000 0 0 0 0 7,300 0
.........................................................North Dakota 27,000 3,600 0 0 0 0 12,500 0
Dakota Prairie Refining LLC
....................................................................................................................................................................................................Dickinson 0 0 0 0 0 0 0 0
Tesoro West Coast
....................................................................................................................................................................................................Mandan 27,000 3,600 0 0 0 0 12,500 0
.........................................................Ohio 208,300 0 52,000 31,000 0 63,500 106,800 0
BP-Husky Refining LLC
....................................................................................................................................................................................................Toledo 55,000 0 0 31,000 0 42,000 0 0
Lima Refining Company
....................................................................................................................................................................................................Lima 45,300 0 0 0 0 0 55,000 0
Energy Information Administration, Refinery Capacity 201615

Downstream Charge Capacity
Desulfurization (incl. Catalytic Hydrotreating)
Naphtha/
Reformer Feed Gasoline
Kerosene/
Jet Fuel Diesel Fuel
Other
Distillate Residual
Heavy
Gas Oil Other
Table 3. Capacity of Operable Petroleum Refineries by State as of January 1, 2016
State/Refiner/Location
(Barrels per Stream Day, Except Where Noted)
.........................................................Minnesota 74,800 49,700 53,600 93,500 9,000 0 144,500 0
Flint Hills Resources LP
49,800.................................................................................................................................................................................................... 49,700 43,500 62,000 9,000 0 115,000 0Saint Paul
St Paul Park Refining Co LLC
25,000.................................................................................................................................................................................................... 0 10,100 31,500 0 0 29,500 0Saint Paul
.........................................................Mississippi 57,300 0 30,000 37,200 0 0 104,000 70,800
Chevron USA Inc
57,300.................................................................................................................................................................................................... 0 30,000 35,000 0 0 104,000 50,000Pascagoula
Ergon Refining Inc
0.................................................................................................................................................................................................... 0 0 2,200 0 0 0 20,800Vicksburg
Hunt Southland Refining Co
0.................................................................................................................................................................................................... 0 0 0 0 0 0 0Sandersville
.........................................................Montana 46,950 26,500 18,400 46,750 25,000 0 45,760 7,900
Calumet Montana Refining LLC
2,500.................................................................................................................................................................................................... 0 5,000 6,000 0 0 0 0Great Falls
Cenex Harvest States Coop
17,000.................................................................................................................................................................................................... 0 0 0 25,000 0 20,000 0Laurel
ExxonMobil Refining & Supply Co
13,900.................................................................................................................................................................................................... 20,500 7,600 11,000 0 0 0 7,900Billings
Phillips 66 Company
13,550.................................................................................................................................................................................................... 6,000 5,800 29,750 0 0 25,760 0Billings
.........................................................Nevada 0 0 0 0 0 0 0 0
Foreland Refining Corp
0.................................................................................................................................................................................................... 0 0 0 0 0 0 0Ely
.........................................................New Jersey 97,500 37,000 29,100 154,000 17,500 0 0 0
Axeon Specialty Products LLC
0.................................................................................................................................................................................................... 0 0 0 0 0 0 0Paulsboro
Paulsboro Refining Co LLC
32,000.................................................................................................................................................................................................... 37,000 29,100 46,000 0 0 0 0Paulsboro
Phillips 66 Company
65,500.................................................................................................................................................................................................... 0 0 108,000 17,500 0 0 0Linden
.........................................................New Mexico 43,600 0 12,000 45,500 0 0 51,000 0
HollyFrontier Navajo Refining LLC
36,000.................................................................................................................................................................................................... 0 12,000 41,000 0 0 51,000 0Artesia
Western Refining Southwest Inc
7,600.................................................................................................................................................................................................... 0 0 4,500 0 0 0 0Gallup
.........................................................North Dakota 13,600 0 0 31,800 5,700 0 0 0
Dakota Prairie Refining LLC
0.................................................................................................................................................................................................... 0 0 8,000 0 0 0 0Dickinson
Tesoro West Coast
13,600.................................................................................................................................................................................................... 0 0 23,800 5,700 0 0 0Mandan
.........................................................Ohio 179,400 107,000 69,500 81,500 0 0 78,000 0
BP-Husky Refining LLC
40,000.................................................................................................................................................................................................... 0 0 22,000 0 0 51,000 0Toledo
Lima Refining Company
63,000.................................................................................................................................................................................................... 35,000 24,000 36,000 0 0 0 0Lima
Energy Information Administration, Refinery Capacity 2016 16

Vacuum
State/Refiner/Location
Barrels per
Atmospheric Crude Oil Distillation Capacity
Barrels per
Operating Idle Operating Idle
Downstream Charge Capacity
Thermal Cracking
Delayed
Fluid Coking Visbreaking
Other/Gas Calendar Day Stream Day
Distillation Coking Oil
Table 3. Capacity of Operable Petroleum Refineries by State as of January 1, 2016
(Barrels per Stream Day, Except Where Noted)
.........................................................Ohio 558,000 0 618,000 0 159,500 58,000 0 0 0
Marathon Petroleum Co LP
93,000 0 100,000 0 35,000 0 0 0 0....................................................................................................................................................................................................Canton
Toledo Refining Co LLC
160,000 0 188,000 0 0 0 0 0 0....................................................................................................................................................................................................Toledo
.........................................................Oklahoma 511,300 0 547,247 0 219,554 38,385 0 0 0
HollyFrontier Tulsa Refining LLC
70,300 0 75,500 0 27,000 0 0 0 0....................................................................................................................................................................................................Tulsa East
85,000 0 90,000 0 32,000 11,000 0 0 0....................................................................................................................................................................................................Tulsa West
Phillips 66 Company
200,000 0 218,747 0 88,254 27,385 0 0 0....................................................................................................................................................................................................Ponca City
Valero Refining Co Oklahoma
86,000 0 88,000 0 32,000 0 0 0 0....................................................................................................................................................................................................Ardmore
Wynnewood Refining Co
70,000 0 75,000 0 40,300 0 0 0 0....................................................................................................................................................................................................Wynnewood
.........................................................Pennsylvania 601,000 0 644,800 0 276,200 0 0 0 0
American Refining Group Inc
11,000 0 11,800 0 0 0 0 0 0....................................................................................................................................................................................................Bradford
Monroe Energy LLC
190,000 0 208,000 0 73,000 0 0 0 0....................................................................................................................................................................................................Trainer
Philadelphia Energy Solutions
335,000 0 355,000 0 163,200 0 0 0 0....................................................................................................................................................................................................Philadelphia
United Refining Co
65,000 0 70,000 0 40,000 0 0 0 0....................................................................................................................................................................................................Warren
.........................................................Tennessee 190,000 0 195,000 0 0 0 0 0 0
Premcor Refining Group Inc
190,000 0 195,000 0 0 0 0 0 0....................................................................................................................................................................................................Memphis
.........................................................Texas 5,452,250 0 5,841,700 0 2,605,000 893,080 42,000 0 0
Alon USA Energy Inc
73,000 0 74,000 0 24,000 0 0 0 0....................................................................................................................................................................................................Big Spring
Buckeye Texas Processing LLC
46,250 0 50,000 0 0 0 0 0 0....................................................................................................................................................................................................Corpus Christi
Calumet Lubricants Co
20,000 0 21,000 0 0 0 0 0 0....................................................................................................................................................................................................San Antonio
Citgo Refining & Chemical Inc
157,500 0 163,500 0 85,300 44,900 0 0 0....................................................................................................................................................................................................Corpus Christi
Deer Park Refining LTD Partnership
285,500 0 340,000 0 180,000 90,000 0 0 0....................................................................................................................................................................................................Deer Park
Delek Refining LTD
72,000 0 75,000 0 28,000 6,500 0 0 0....................................................................................................................................................................................................Tyler
Equistar Chemicals LP
0 0 0 0 0 0 0 0 0....................................................................................................................................................................................................Channelview
ExxonMobil Refining & Supply Co
560,500 0 584,000 0 297,000 54,000 42,000 0 0....................................................................................................................................................................................................Baytown
344,600 0 359,200 0 148,800 48,000 0 0 0....................................................................................................................................................................................................Beaumont
Flint Hills Resources LP
295,630 0 304,000 0 87,500 15,500 0 0 0....................................................................................................................................................................................................Corpus Christi
Energy Information Administration, Refinery Capacity 201617

Downstream Charge Capacity
Catalytic Cracking Catalytic Hydrocracking Catalytic Reforming
Fresh Recycled Distillate Gas Oil ResidualLow
Pressure
High
Pressure
Fuels Solvent
Deasphalting
Table 3. Capacity of Operable Petroleum Refineries by State as of January 1, 2016
State/Refiner/Location
(Barrels per Stream Day, Except Where Noted)
.........................................................Ohio 208,300 0 52,000 31,000 0 63,500 106,800 0
Marathon Petroleum Co LP
....................................................................................................................................................................................................Canton 26,000 0 0 0 0 21,500 0 0
Toledo Refining Co LLC
....................................................................................................................................................................................................Toledo 82,000 0 52,000 0 0 0 51,800 0
.........................................................Oklahoma 151,813 2,000 14,000 18,200 0 61,500 53,593 4,850
HollyFrontier Tulsa Refining LLC
....................................................................................................................................................................................................Tulsa East 25,000 2,000 0 0 0 23,000 0 0
....................................................................................................................................................................................................Tulsa West 0 0 0 0 0 0 0 0
Phillips 66 Company
....................................................................................................................................................................................................Ponca City 74,613 0 0 0 0 0 53,593 0
Valero Refining Co Oklahoma
....................................................................................................................................................................................................Ardmore 30,000 0 14,000 0 0 20,500 0 0
Wynnewood Refining Co
....................................................................................................................................................................................................Wynnewood 22,200 0 0 18,200 0 18,000 0 4,850
.........................................................Pennsylvania 216,500 1,000 23,000 0 0 50,000 102,200 0
American Refining Group Inc
....................................................................................................................................................................................................Bradford 0 0 0 0 0 0 2,200 0
Monroe Energy LLC
....................................................................................................................................................................................................Trainer 53,000 0 23,000 0 0 50,000 0 0
Philadelphia Energy Solutions
....................................................................................................................................................................................................Philadelphia 138,500 0 0 0 0 0 86,000 0
United Refining Co
....................................................................................................................................................................................................Warren 25,000 1,000 0 0 0 0 14,000 0
.........................................................Tennessee 70,000 0 26,500 0 0 36,000 0 0
Premcor Refining Group Inc
....................................................................................................................................................................................................Memphis 70,000 0 26,500 0 0 36,000 0 0
.........................................................Texas 1,842,450 25,000 251,300 370,000 75,000 962,200 115,280 166,000
Alon USA Energy Inc
....................................................................................................................................................................................................Big Spring 25,000 0 0 0 0 21,000 0 10,000
Buckeye Texas Processing LLC
....................................................................................................................................................................................................Corpus Christi 0 0 0 0 0 0 0 0
Calumet Lubricants Co
....................................................................................................................................................................................................San Antonio 0 0 0 0 0 0 6,000 0
Citgo Refining & Chemical Inc
....................................................................................................................................................................................................Corpus Christi 83,800 0 0 0 0 51,500 0 0
Deer Park Refining LTD Partnership
....................................................................................................................................................................................................Deer Park 75,000 5,000 0 60,000 0 45,000 24,500 0
Delek Refining LTD
....................................................................................................................................................................................................Tyler 20,250 0 0 0 0 13,000 4,500 0
Equistar Chemicals LP
....................................................................................................................................................................................................Channelview 0 0 0 0 0 0 0 0
ExxonMobil Refining & Supply Co
....................................................................................................................................................................................................Baytown 215,000 8,000 29,900 0 0 123,500 0 47,000
....................................................................................................................................................................................................Beaumont 117,700 0 65,500 0 0 146,000 0 0
Flint Hills Resources LP
....................................................................................................................................................................................................Corpus Christi 110,000 0 15,000 0 0 0 0 0
Energy Information Administration, Refinery Capacity 2016 18
Downstream Charge Capacity
Desulfurization (incl. Catalytic Hydrotreating)
Naphtha/
Reformer Feed Gasoline
Kerosene/
Jet Fuel Diesel Fuel
Other
Distillate Residual
Heavy
Gas Oil Other
Table 3. Capacity of Operable Petroleum Refineries by State as of January 1, 2016
State/Refiner/Location
(Barrels per Stream Day, Except Where Noted)
.........................................................Ohio 179,400 107,000 69,500 81,500 0 0 78,000 0
Marathon Petroleum Co LP
30,500.................................................................................................................................................................................................... 0 13,500 23,500 0 0 27,000 0Canton
Toledo Refining Co LLC
45,900.................................................................................................................................................................................................... 72,000 32,000 0 0 0 0 0Toledo
.........................................................Oklahoma 157,493 97,984 18,500 134,581 34,355 0 58,338 35,548
HollyFrontier Tulsa Refining LLC
22,000.................................................................................................................................................................................................... 29,000 0 45,000 0 0 0 0Tulsa East
28,000.................................................................................................................................................................................................... 0 0 0 0 0 0 21,600Tulsa West
Phillips 66 Company
53,593.................................................................................................................................................................................................... 53,984 18,500 31,981 34,355 0 23,888 13,948Ponca City
Valero Refining Co Oklahoma
27,000.................................................................................................................................................................................................... 0 0 32,000 0 0 34,450 0Ardmore
Wynnewood Refining Co
26,900.................................................................................................................................................................................................... 15,000 0 25,600 0 0 0 0Wynnewood
.........................................................Pennsylvania 192,700 93,300 5,000 70,300 163,000 0 0 0
American Refining Group Inc
3,600.................................................................................................................................................................................................... 0 0 0 0 0 0 0Bradford
Monroe Energy LLC
77,100.................................................................................................................................................................................................... 23,300 0 53,300 0 0 0 0Trainer
Philadelphia Energy Solutions
88,000.................................................................................................................................................................................................... 65,000 0 0 163,000 0 0 0Philadelphia
United Refining Co
24,000.................................................................................................................................................................................................... 5,000 5,000 17,000 0 0 0 0Warren
.........................................................Tennessee 52,000 39,000 0 38,000 0 0 0 0
Premcor Refining Group Inc
52,000.................................................................................................................................................................................................... 39,000 0 38,000 0 0 0 0Memphis
.........................................................Texas 1,400,590 985,500 628,800 1,294,925 61,000 233,500 949,740 128,800
Alon USA Energy Inc
25,500.................................................................................................................................................................................................... 0 5,000 23,000 0 0 6,500 0Big Spring
Buckeye Texas Processing LLC
0.................................................................................................................................................................................................... 0 0 0 0 0 0 0Corpus Christi
Calumet Lubricants Co
6,000.................................................................................................................................................................................................... 0 0 7,000 0 0 0 0San Antonio
Citgo Refining & Chemical Inc
52,800.................................................................................................................................................................................................... 36,500 0 92,600 0 0 71,900 0Corpus Christi
Deer Park Refining LTD Partnership
75,500.................................................................................................................................................................................................... 43,000 40,000 0 45,000 49,500 80,000 43,000Deer Park
Delek Refining LTD
28,000.................................................................................................................................................................................................... 13,000 0 36,000 0 0 0 0Tyler
Equistar Chemicals LP
0.................................................................................................................................................................................................... 0 0 0 0 0 0 0Channelview
ExxonMobil Refining & Supply Co
155,500.................................................................................................................................................................................................... 196,000 132,700 146,300 0 0 117,000 46,500Baytown
159,800.................................................................................................................................................................................................... 25,000 51,000 42,000 0 0 0 23,600Beaumont
Flint Hills Resources LP
85,800.................................................................................................................................................................................................... 75,000 54,000 73,000 0 0 54,000 0Corpus Christi
Energy Information Administration, Refinery Capacity 201619

Vacuum
State/Refiner/Location
Barrels per
Atmospheric Crude Oil Distillation Capacity
Barrels per
Operating Idle Operating Idle
Downstream Charge Capacity
Thermal Cracking
Delayed
Fluid Coking Visbreaking
Other/Gas Calendar Day Stream Day
Distillation Coking Oil
Table 3. Capacity of Operable Petroleum Refineries by State as of January 1, 2016
(Barrels per Stream Day, Except Where Noted)
.........................................................Texas 5,452,250 0 5,841,700 0 2,605,000 893,080 42,000 0 0
Houston Refining LP
263,776 0 302,300 0 202,000 99,500 0 0 0....................................................................................................................................................................................................Houston
Kinder Morgan Crude & Condensate
84,000 0 100,000 0 0 0 0 0 0....................................................................................................................................................................................................Galena Park
Lazarus Energy LLC
13,765 0 15,000 0 0 0 0 0 0....................................................................................................................................................................................................Nixon
Marathon Petroleum Co LP
459,000 0 481,000 0 237,000 33,000 0 0 0....................................................................................................................................................................................................Galveston Bay
86,000 0 89,500 0 0 0 0 0 0....................................................................................................................................................................................................Texas City
Motiva Enterprises LLC
603,000 0 635,000 0 331,800 164,500 0 0 0....................................................................................................................................................................................................Port Arthur
Pasadena Refining Systems Inc
112,229 0 115,700 0 38,000 0 0 0 0....................................................................................................................................................................................................Pasadena
Petromax Refining Co LLC
25,000 0 27,500 0 0 0 0 0 0....................................................................................................................................................................................................Houston
Phillips 66 Company
247,000 0 260,000 0 132,100 78,700 0 0 0....................................................................................................................................................................................................Sweeny
Premcor Refining Group Inc
335,000 0 415,000 0 220,000 99,600 0 0 0....................................................................................................................................................................................................Port Arthur
South Hampton Resources Inc
0 0 0 0 0 0 0 0 0....................................................................................................................................................................................................Silsbee
Total Petrochemicals & Refining USA
225,500 0 245,000 0 105,300 60,000 0 0 0....................................................................................................................................................................................................Port Arthur
Valero Energy Corporation
168,000 0 172,000 0 50,000 0 0 0 0....................................................................................................................................................................................................Sunray
89,000 0 91,000 0 33,500 0 0 0 0....................................................................................................................................................................................................Three Rivers
Valero Refining Co Texas LP
293,000 0 300,000 0 97,000 17,000 0 0 0....................................................................................................................................................................................................Corpus Christi
100,000 0 103,000 0 38,000 0 0 0 0....................................................................................................................................................................................................Houston
225,000 0 231,000 0 133,500 53,500 0 0 0....................................................................................................................................................................................................Texas City
Western Refining Company LP
122,000 0 134,000 0 56,200 0 0 0 0....................................................................................................................................................................................................El Paso
WRB Refining LP
146,000 0 154,000 0 80,000 28,380 0 0 0....................................................................................................................................................................................................Borger
.........................................................Utah 181,050 0 193,100 0 34,500 9,000 0 0 0
Big West Oil Co
30,500 0 32,000 0 0 0 0 0 0....................................................................................................................................................................................................North Salt Lake
Chevron USA Inc
53,000 0 56,000 0 27,500 9,000 0 0 0....................................................................................................................................................................................................Salt Lake City
HollyFrontier Woods Cross Refining
LLC
25,050 0 26,400 0 0 0 0 0 0....................................................................................................................................................................................................Woods Cross
Silver Eagle Refining
15,000 0 15,700 0 7,000 0 0 0 0....................................................................................................................................................................................................Woods Cross
Tesoro West Coast
57,500 0 63,000 0 0 0 0 0 0....................................................................................................................................................................................................Salt Lake City
Energy Information Administration, Refinery Capacity 2016 20

Downstream Charge Capacity
Catalytic Cracking Catalytic Hydrocracking Catalytic Reforming
Fresh Recycled Distillate Gas Oil ResidualLow
Pressure
High
Pressure
Fuels Solvent
Deasphalting
Table 3. Capacity of Operable Petroleum Refineries by State as of January 1, 2016
State/Refiner/Location
(Barrels per Stream Day, Except Where Noted)
.........................................................Texas 1,842,450 25,000 251,300 370,000 75,000 962,200 115,280 166,000
Houston Refining LP
....................................................................................................................................................................................................Houston 110,000 0 0 0 0 0 0 0
Kinder Morgan Crude & Condensate
....................................................................................................................................................................................................Galena Park 0 0 0 0 0 0 0 0
Lazarus Energy LLC
....................................................................................................................................................................................................Nixon 0 0 0 0 0 0 0 0
Marathon Petroleum Co LP
....................................................................................................................................................................................................Galveston Bay 200,500 0 69,000 0 75,000 138,000 0 17,000
....................................................................................................................................................................................................Texas City 58,500 0 0 0 0 0 11,000 0
Motiva Enterprises LLC
....................................................................................................................................................................................................Port Arthur 90,000 0 0 82,000 0 129,500 0 0
Pasadena Refining Systems Inc
....................................................................................................................................................................................................Pasadena 52,000 0 0 0 0 22,000 0 0
Petromax Refining Co LLC
....................................................................................................................................................................................................Houston 0 0 0 0 0 0 0 0
Phillips 66 Company
....................................................................................................................................................................................................Sweeny 107,700 12,000 0 0 0 37,500 0 0
Premcor Refining Group Inc
....................................................................................................................................................................................................Port Arthur 75,000 0 0 123,000 0 55,000 0 0
South Hampton Resources Inc
....................................................................................................................................................................................................Silsbee 0 0 0 0 0 1,600 0 0
Total Petrochemicals & Refining USA
....................................................................................................................................................................................................Port Arthur 80,000 0 0 0 0 43,000 0 15,500
Valero Energy Corporation
....................................................................................................................................................................................................Sunray 54,500 0 0 27,000 0 29,000 18,000 14,500
....................................................................................................................................................................................................Three Rivers 23,500 0 0 28,000 0 23,500 10,000 10,500
Valero Refining Co Texas LP
....................................................................................................................................................................................................Corpus Christi 95,500 0 0 50,000 0 39,000 10,000 0
....................................................................................................................................................................................................Houston 71,500 0 71,900 0 0 0 0 18,000
....................................................................................................................................................................................................Texas City 86,000 0 0 0 0 18,100 0 33,500
Western Refining Company LP
....................................................................................................................................................................................................El Paso 35,000 0 0 0 0 26,000 0 0
WRB Refining LP
....................................................................................................................................................................................................Borger 56,000 0 0 0 0 0 31,280 0
.........................................................Utah 61,860 3,000 0 9,000 0 0 36,800 6,000
Big West Oil Co
....................................................................................................................................................................................................North Salt Lake 11,500 0 0 0 0 0 8,500 0
Chevron USA Inc
....................................................................................................................................................................................................Salt Lake City 15,000 0 0 0 0 0 8,500 0
HollyFrontier Woods Cross Refining
LLC
....................................................................................................................................................................................................Woods Cross 9,360 0 0 9,000 0 0 8,400 6,000
Silver Eagle Refining
....................................................................................................................................................................................................Woods Cross 0 0 0 0 0 0 0 0
Tesoro West Coast
....................................................................................................................................................................................................Salt Lake City 26,000 3,000 0 0 0 0 11,400 0
Energy Information Administration, Refinery Capacity 201621

Downstream Charge Capacity
Desulfurization (incl. Catalytic Hydrotreating)
Naphtha/
Reformer Feed Gasoline
Kerosene/
Jet Fuel Diesel Fuel
Other
Distillate Residual
Heavy
Gas Oil Other
Table 3. Capacity of Operable Petroleum Refineries by State as of January 1, 2016
State/Refiner/Location
(Barrels per Stream Day, Except Where Noted)
.........................................................Texas 1,400,590 985,500 628,800 1,294,925 61,000 233,500 949,740 128,800
Houston Refining LP
60,500.................................................................................................................................................................................................... 76,000 43,500 92,175 0 0 116,100 5,200Houston
Kinder Morgan Crude & Condensate
0.................................................................................................................................................................................................... 0 0 0 0 0 0 0Galena Park
Lazarus Energy LLC
0.................................................................................................................................................................................................... 0 0 0 0 0 0 0Nixon
Marathon Petroleum Co LP
121,000.................................................................................................................................................................................................... 57,000 79,000 55,000 0 0 105,000 0Galveston Bay
0.................................................................................................................................................................................................... 0 0 0 0 0 0 0Texas City
Motiva Enterprises LLC
163,150.................................................................................................................................................................................................... 55,000 78,000 153,300 0 0 50,000 0Port Arthur
Pasadena Refining Systems Inc
22,000.................................................................................................................................................................................................... 40,000 0 0 16,000 0 0 0Pasadena
Petromax Refining Co LLC
0.................................................................................................................................................................................................... 0 0 0 0 0 0 0Houston
Phillips 66 Company
67,300.................................................................................................................................................................................................... 8,700 0 123,700 0 0 107,000 0Sweeny
Premcor Refining Group Inc
48,700.................................................................................................................................................................................................... 85,000 33,000 104,600 0 0 60,000 0Port Arthur
South Hampton Resources Inc
11,000.................................................................................................................................................................................................... 0 0 0 0 0 0 4,000Silsbee
Total Petrochemicals & Refining USA
57,500.................................................................................................................................................................................................... 51,600 31,000 70,000 0 0 54,400 0Port Arthur
Valero Energy Corporation
43,000.................................................................................................................................................................................................... 39,600 0 47,500 0 0 0 0Sunray
24,000.................................................................................................................................................................................................... 0 10,000 25,000 0 0 20,000 0Three Rivers
Valero Refining Co Texas LP
64,000.................................................................................................................................................................................................... 60,000 11,000 63,250 0 74,000 30,000 0Corpus Christi
9,000.................................................................................................................................................................................................... 32,900 14,100 0 0 0 0 0Houston
25,000.................................................................................................................................................................................................... 61,500 28,000 55,000 0 110,000 0 6,500Texas City
Western Refining Company LP
30,000.................................................................................................................................................................................................... 29,700 10,000 50,000 0 0 0 0El Paso
WRB Refining LP
65,540.................................................................................................................................................................................................... 0 8,500 35,500 0 0 77,840 0Borger
.........................................................Utah 44,700 8,000 2,900 49,800 28,800 0 0 7,200
Big West Oil Co
11,500.................................................................................................................................................................................................... 0 0 11,000 0 0 0 0North Salt Lake
Chevron USA Inc
8,300.................................................................................................................................................................................................... 0 0 13,300 18,000 0 0 7,200Salt Lake City
HollyFrontier Woods Cross Refining
LLC
12,500.................................................................................................................................................................................................... 0 2,900 0 10,800 0 0 0Woods Cross
Silver Eagle Refining
1,000.................................................................................................................................................................................................... 0 0 3,000 0 0 0 0Woods Cross
Tesoro West Coast
11,400.................................................................................................................................................................................................... 8,000 0 22,500 0 0 0 0Salt Lake City
Energy Information Administration, Refinery Capacity 2016 22

Vacuum
State/Refiner/Location
Barrels per
Atmospheric Crude Oil Distillation Capacity
Barrels per
Operating Idle Operating Idle
Downstream Charge Capacity
Thermal Cracking
Delayed
Fluid Coking Visbreaking
Other/Gas Calendar Day Stream Day
Distillation Coking Oil
Table 3. Capacity of Operable Petroleum Refineries by State as of January 1, 2016
(Barrels per Stream Day, Except Where Noted)
.........................................................Washington 633,700 0 659,500 0 294,700 82,800 0 0 0
BP West Coast Products LLC
227,000 0 236,000 0 112,000 57,500 0 0 0....................................................................................................................................................................................................Ferndale
Phillips 66 Company
101,000 0 107,500 0 50,700 0 0 0 0....................................................................................................................................................................................................Ferndale
Shell Oil Products US
145,000 0 149,000 0 65,800 25,300 0 0 0....................................................................................................................................................................................................Anacortes
Tesoro West Coast
120,000 0 125,000 0 47,000 0 0 0 0....................................................................................................................................................................................................Anacortes
US Oil & Refining Co
40,700 0 42,000 0 19,200 0 0 0 0....................................................................................................................................................................................................Tacoma
.........................................................West Virginia 22,300 0 23,000 0 8,600 0 0 0 0
Ergon West Virginia Inc
22,300 0 23,000 0 8,600 0 0 0 0....................................................................................................................................................................................................Newell
.........................................................Wisconsin 38,000 0 50,000 0 20,500 0 0 0 0
Calumet Lubricants Co LP
38,000 0 50,000 0 20,500 0 0 0 0....................................................................................................................................................................................................Superior
.........................................................Wyoming 177,500 3,800 189,400 4,500 72,500 33,700 0 0 0
Antelope Refining LLC
0 3,800 0 4,500 3,500 0 0 0 0....................................................................................................................................................................................................Douglas
HollyFrontier Cheyenne Refining LLC
47,000 0 52,000 0 28,000 13,700 0 0 0....................................................................................................................................................................................................Cheyenne
Little America Refining Co
24,500 0 25,500 0 0 0 0 0 0....................................................................................................................................................................................................Evansville
Silver Eagle Refining
3,000 0 3,400 0 0 0 0 0 0....................................................................................................................................................................................................Evanston
Sinclair Wyoming Refining Co
85,000 0 90,000 0 41,000 20,000 0 0 0....................................................................................................................................................................................................Sinclair
Wyoming Refining Co
18,000 0 18,500 0 0 0 0 0 0....................................................................................................................................................................................................New Castle
.........................................................U.S. Total 18,165,136 151,900 19,345,102 162,500 9,073,285 2,797,765 158,900 16,000 10,600
Energy Information Administration, Refinery Capacity 201623

Downstream Charge Capacity
Catalytic Cracking Catalytic Hydrocracking Catalytic Reforming
Fresh Recycled Distillate Gas Oil ResidualLow
Pressure
High
Pressure
Fuels Solvent
Deasphalting
Table 3. Capacity of Operable Petroleum Refineries by State as of January 1, 2016
State/Refiner/Location
(Barrels per Stream Day, Except Where Noted)
.........................................................Washington 148,400 3,000 0 65,000 0 109,400 28,500 24,300
BP West Coast Products LLC
....................................................................................................................................................................................................Ferndale 0 0 0 65,000 0 65,000 0 0
Phillips 66 Company
....................................................................................................................................................................................................Ferndale 38,500 0 0 0 0 18,400 0 0
Shell Oil Products US
....................................................................................................................................................................................................Anacortes 57,900 0 0 0 0 0 21,700 0
Tesoro West Coast
....................................................................................................................................................................................................Anacortes 52,000 3,000 0 0 0 26,000 0 24,300
US Oil & Refining Co
....................................................................................................................................................................................................Tacoma 0 0 0 0 0 0 6,800 0
.........................................................West Virginia 0 0 0 0 0 3,950 0 0
Ergon West Virginia Inc
....................................................................................................................................................................................................Newell 0 0 0 0 0 3,950 0 0
.........................................................Wisconsin 11,000 0 0 0 0 8,000 0 0
Calumet Lubricants Co LP
....................................................................................................................................................................................................Superior 11,000 0 0 0 0 8,000 0 0
.........................................................Wyoming 53,500 500 15,600 0 0 14,200 21,400 0
Antelope Refining LLC
....................................................................................................................................................................................................Douglas 0 0 0 0 0 0 0 0
HollyFrontier Cheyenne Refining LLC
....................................................................................................................................................................................................Cheyenne 12,500 0 0 0 0 9,200 0 0
Little America Refining Co
....................................................................................................................................................................................................Evansville 11,500 500 0 0 0 5,000 0 0
Silver Eagle Refining
....................................................................................................................................................................................................Evanston 0 0 0 0 0 0 2,900 0
Sinclair Wyoming Refining Co
....................................................................................................................................................................................................Sinclair 22,000 0 15,600 0 0 0 14,500 0
Wyoming Refining Co
....................................................................................................................................................................................................New Castle 7,500 0 0 0 0 0 4,000 0
.........................................................U.S. Total 6,052,183 75,690 687,400 1,503,200 127,000 2,658,740 1,084,323 370,550
Energy Information Administration, Refinery Capacity 2016 24

Downstream Charge Capacity
Desulfurization (incl. Catalytic Hydrotreating)
Naphtha/
Reformer Feed Gasoline
Kerosene/
Jet Fuel Diesel Fuel
Other
Distillate Residual
Heavy
Gas Oil Other
Table 3. Capacity of Operable Petroleum Refineries by State as of January 1, 2016
State/Refiner/Location
(Barrels per Stream Day, Except Where Noted)
.........................................................Washington 176,100 90,300 39,000 162,500 0 0 0 0
BP West Coast Products LLC
74,000.................................................................................................................................................................................................... 0 20,000 55,000 0 0 0 0Ferndale
Phillips 66 Company
19,000.................................................................................................................................................................................................... 22,100 0 32,300 0 0 0 0Ferndale
Shell Oil Products US
33,500.................................................................................................................................................................................................... 35,700 19,000 40,700 0 0 0 0Anacortes
Tesoro West Coast
39,200.................................................................................................................................................................................................... 32,500 0 26,300 0 0 0 0Anacortes
US Oil & Refining Co
10,400.................................................................................................................................................................................................... 0 0 8,200 0 0 0 0Tacoma
.........................................................West Virginia 4,300 0 0 9,000 0 0 6,300 0
Ergon West Virginia Inc
4,300.................................................................................................................................................................................................... 0 0 9,000 0 0 6,300 0Newell
.........................................................Wisconsin 11,000 7,500 7,700 6,500 0 0 0 0
Calumet Lubricants Co LP
11,000.................................................................................................................................................................................................... 7,500 7,700 6,500 0 0 0 0Superior
.........................................................Wyoming 44,400 16,500 15,000 52,500 0 0 20,000 0
Antelope Refining LLC
0.................................................................................................................................................................................................... 0 0 0 0 0 0 0Douglas
HollyFrontier Cheyenne Refining LLC
10,000.................................................................................................................................................................................................... 10,000 0 18,000 0 0 0 0Cheyenne
Little America Refining Co
7,500.................................................................................................................................................................................................... 6,500 0 10,500 0 0 0 0Evansville
Silver Eagle Refining
3,900.................................................................................................................................................................................................... 0 0 0 0 0 0 0Evanston
Sinclair Wyoming Refining Co
19,000.................................................................................................................................................................................................... 0 15,000 18,000 0 0 20,000 0Sinclair
Wyoming Refining Co
4,000.................................................................................................................................................................................................... 0 0 6,000 0 0 0 0New Castle
.........................................................U.S. Total 4,614,073 2,773,434 1,570,850 4,375,906 561,455 246,000 2,971,838 369,248
Note: Refer to Table 5 for corporate ownership information. Some names of previously independent companies have been preserved by acquiring companies.
Source: Energy Information Administration (EIA), Form EIA-820, "Annual Refinery Report."
Energy Information Administration, Refinery Capacity 201625

Directory of Operable Petroleum Refineries on Tables 3 and 4
Refiner State(s) Refiner State(s)
CA MS..............................................................................................................................................................................................................................................................................................................................Alon Bakersfield Operating Inc.......................................................................... Hunt Southland Refining Co................................................................
LA CA..............................................................................................................................................................................................................................................................................................................................Alon Refining Krotz Springs Inc.......................................................................... Kern Oil & Refining Co................................................................
TX TX..............................................................................................................................................................................................................................................................................................................................Alon USA Energy Inc.......................................................................... Kinder Morgan Crude & Condensate................................................................
PA TX..............................................................................................................................................................................................................................................................................................................................American Refining Group Inc.......................................................................... Lazarus Energy LLC................................................................
WY OH..............................................................................................................................................................................................................................................................................................................................Antelope Refining LLC.......................................................................... Lima Refining Company................................................................
NJ AR..............................................................................................................................................................................................................................................................................................................................Axeon Specialty Products LLC.......................................................................... Lion Oil Co................................................................
AK WY..............................................................................................................................................................................................................................................................................................................................BP Exploration Alaska Inc.......................................................................... Little America Refining Co................................................................
IN CA..............................................................................................................................................................................................................................................................................................................................BP Products North America Inc.......................................................................... Lunday Thagard Co................................................................
WA IL, KY, LA, MI, OH, TX..............................................................................................................................................................................................................................................................................................................................BP West Coast Products LLC.......................................................................... Marathon Petroleum Co LP................................................................
OH PA..............................................................................................................................................................................................................................................................................................................................BP-Husky Refining LLC.......................................................................... Monroe Energy LLC................................................................
UT LA, TX..............................................................................................................................................................................................................................................................................................................................Big West Oil Co.......................................................................... Motiva Enterprises LLC................................................................
TX IL..............................................................................................................................................................................................................................................................................................................................Buckeye Texas Processing LLC.......................................................................... PDV Midwest Refining LLC................................................................
KS CA..............................................................................................................................................................................................................................................................................................................................CHS McPherson Refinery Inc.......................................................................... Paramount Petroleum Corporation................................................................
LA TX..............................................................................................................................................................................................................................................................................................................................Calcasieu Refining Co.......................................................................... Pasadena Refining Systems Inc................................................................
TX NJ..............................................................................................................................................................................................................................................................................................................................Calumet Lubricants Co.......................................................................... Paulsboro Refining Co LLC................................................................
LA, WI AK..............................................................................................................................................................................................................................................................................................................................Calumet Lubricants Co LP.......................................................................... Petro Star Inc................................................................
MT TX..............................................................................................................................................................................................................................................................................................................................Calumet Montana Refining LLC.......................................................................... Petromax Refining Co LLC................................................................
LA PA..............................................................................................................................................................................................................................................................................................................................Calumet Shreveport LLC.......................................................................... Philadelphia Energy Solutions................................................................
MT CA, LA, MT, NJ, OK, TX, WA..............................................................................................................................................................................................................................................................................................................................Cenex Harvest States Coop.......................................................................... Phillips 66 Company................................................................
LA LA..............................................................................................................................................................................................................................................................................................................................Chalmette Refining LLC.......................................................................... Placid Refining Co................................................................
CA, HI, MS, UT TN, TX..............................................................................................................................................................................................................................................................................................................................Chevron USA Inc.......................................................................... Premcor Refining Group Inc................................................................
LA CA..............................................................................................................................................................................................................................................................................................................................Citgo Petroleum Corp.......................................................................... San Joaquin Refining Co Inc................................................................
TX CA..............................................................................................................................................................................................................................................................................................................................Citgo Refining & Chemical Inc.......................................................................... Santa Maria Refining Company................................................................
KS AL..............................................................................................................................................................................................................................................................................................................................Coffeyville Resources Rfg & Mktg.......................................................................... Shell Chemical LP................................................................
AK CA, LA, WA..............................................................................................................................................................................................................................................................................................................................ConocoPhillips Alaska Inc.......................................................................... Shell Oil Products US................................................................
KY UT, WY..............................................................................................................................................................................................................................................................................................................................Continental Refining Company LLC.......................................................................... Silver Eagle Refining................................................................
IN WY..............................................................................................................................................................................................................................................................................................................................Countrymark Cooperative Inc.......................................................................... Sinclair Wyoming Refining Co................................................................
AR TX..............................................................................................................................................................................................................................................................................................................................Cross Oil Refining & Marketing Inc.......................................................................... South Hampton Resources Inc................................................................
ND MN..............................................................................................................................................................................................................................................................................................................................Dakota Prairie Refining LLC.......................................................................... St Paul Park Refining Co LLC................................................................
TX CO..............................................................................................................................................................................................................................................................................................................................Deer Park Refining LTD Partnership.......................................................................... Suncor Energy (USA) Inc................................................................
DE AK..............................................................................................................................................................................................................................................................................................................................Delaware City Refining Co LLC.......................................................................... Tesoro Alaska Petroleum Co................................................................
TX CA..............................................................................................................................................................................................................................................................................................................................Delek Refining LTD.......................................................................... Tesoro Refining & Marketing Co................................................................
TX ND, UT, WA..............................................................................................................................................................................................................................................................................................................................Equistar Chemicals LP.......................................................................... Tesoro West Coast................................................................
MS OH..............................................................................................................................................................................................................................................................................................................................Ergon Refining Inc.......................................................................... Toledo Refining Co LLC................................................................
WV TX..............................................................................................................................................................................................................................................................................................................................Ergon West Virginia Inc.......................................................................... Total Petrochemicals & Refining USA................................................................
LA WA..............................................................................................................................................................................................................................................................................................................................Excel Paralubes.......................................................................... US Oil & Refining Co................................................................
CA, IL, LA, MT, TX PA..............................................................................................................................................................................................................................................................................................................................ExxonMobil Refining & Supply Co.......................................................................... United Refining Co................................................................
MN, TX LA, TX..............................................................................................................................................................................................................................................................................................................................Flint Hills Resources LP.......................................................................... Valero Energy Corporation................................................................
NV CA..............................................................................................................................................................................................................................................................................................................................Foreland Refining Corp.......................................................................... Valero Refining Co California................................................................
AL OK..............................................................................................................................................................................................................................................................................................................................Goodway Refining LLC.......................................................................... Valero Refining Co Oklahoma................................................................
HI TX..............................................................................................................................................................................................................................................................................................................................Hawaii Independent Energy LLC.......................................................................... Valero Refining Co Texas LP................................................................
WY LA..............................................................................................................................................................................................................................................................................................................................HollyFrontier Cheyenne Refining LLC.......................................................................... Valero Refining New Orleans LLC................................................................
KS IL, TX..............................................................................................................................................................................................................................................................................................................................HollyFrontier El Dorado Refining LLC.......................................................................... WRB Refining LP................................................................
NM TX..............................................................................................................................................................................................................................................................................................................................HollyFrontier Navajo Refining LLC.......................................................................... Western Refining Company LP................................................................
OK NM..............................................................................................................................................................................................................................................................................................................................HollyFrontier Tulsa Refining LLC.......................................................................... Western Refining Southwest Inc................................................................
UT OK..............................................................................................................................................................................................................................................................................................................................HollyFrontier Woods Cross Refining LLC.......................................................................... Wynnewood Refining Co................................................................
TX WY..............................................................................................................................................................................................................................................................................................................................Houston Refining LP.......................................................................... Wyoming Refining Co................................................................
AL...............................................................................................................................................................Hunt Refining Co..........................................................................
Energy Information Administration, Refinery Capacity 2016 26

State/Refiner/Location Alkylates Aromatics Isobutane Lubricants
Isomers
Isopentane
and
Isohexane
Asphalt
and
Road Oil
Marketable
Petroleum
Coke
Hydrogen
(MMcfd)
Sulfur
(short tons
per day)
Table 4. Production Capacity of Operable Petroleum Refineries by State as of January 1, 2016
(Barrels per Stream Day, Except Where Noted)
Isooctane
a
.....................................................................Alabama 0 0 15,000 1,150 4,200 0 7,120 40 228 0
Hunt Refining Co
0 0 15,000 0 4,200 0 7,120........................................................... 40 195Tuscaloosa 0
Shell Chemical LP
0 0 0 1,150 0 0 0........................................................... 0 33Saraland 0
.....................................................................Alaska 0 0 10,000 0 5,000 0 0 13 27 0
Tesoro Alaska Petroleum Co
0 0 10,000 0 5,000 0 0........................................................... 13 27Kenai 0
.....................................................................Arkansas 5,000 0 21,500 0 7,500 5,500 0 13 157 0
Cross Oil Refining & Marketing Inc
0 0 1,000 0 0 5,500 0........................................................... 3 0Smackover 0
Lion Oil Co
5,000 0 20,500 0 7,500 0 0........................................................... 10 157El Dorado 0
.....................................................................California 201,562 1,500 48,833 40,400 129,600 39,800 143,000 1,088 5,092 200
Alon Bakersfield Operating Inc
0 0 0 300 500 0 0........................................................... 23 70Bakersfield 200
Chevron USA Inc
32,200 0 0 10,500 22,300 0 25,500........................................................... 77 894El Segundo 0
32,662 0 0 7,200 46,000 34,000 0........................................................... 181 789Richmond 0
ExxonMobil Refining & Supply Co
24,200 0 0 0 0 0 16,700........................................................... 146 400Torrance 0
Kern Oil & Refining Co
0 0 0 0 0 0 0........................................................... 0 11Bakersfield 0
Lunday Thagard Co
0 0 5,833 0 0 0 0........................................................... 0 0South Gate 0
Energy Information Administration, Refinery Capacity 201627

State/Refiner/Location Alkylates Aromatics Isobutane Lubricants
Isomers
Isopentane
and
Isohexane
Asphalt
and
Road Oil
Marketable
Petroleum
Coke
Hydrogen
(MMcfd)
Sulfur
(short tons
per day)
Table 4. Production Capacity of Operable Petroleum Refineries by State as of January 1, 2016
(Barrels per Stream Day, Except Where Noted)
Isooctane
a
Paramount Petroleum Corporation
0 0 16,500 0 0 0 0........................................................... 0 40Paramount 0
Phillips 66 Company
0 0 0 3,800 10,000 0 14,500........................................................... 22 560Rodeo 0
16,000 0 0 3,100 12,800 0 16,800........................................................... 105 370Wilmington 0
San Joaquin Refining Co Inc
0 1,500 8,000 0 0 5,800 0........................................................... 4 6Bakersfield 0
Santa Maria Refining Company
0 0 6,000 0 0 0 0........................................................... 0 0Santa Maria 0
Shell Oil Products US
12,500 0 0 0 15,000 0 9,000........................................................... 193 413Martinez 0
Tesoro Refining & Marketing Co
17,000 0 0 3,500 23,000 0 16,700........................................................... 105 476Carson 0
15,400 0 0 0 0 0 15,000........................................................... 82 200Martinez 0
12,500 0 0 7,800 0 0 12,000........................................................... 15 280Wilmington 0
Valero Refining Co California
17,100 0 9,000 4,200 0 0 6,800........................................................... 135 303Benicia 0
0 0 3,500 0 0 0 0........................................................... 0 0Wilmington Asphalt Plant 0
22,000 0 0 0 0 0 10,000........................................................... 0 280Wilmington Refinery 0
.....................................................................Colorado 0 0 12,250 985 0 0 0 22 116 0
Suncor Energy (USA) Inc
0 0 0 985 0 0 0........................................................... 0 2Commerce City East 0
0 0 12,250 0 0 0 0........................................................... 22 114Commerce City West 0
.....................................................................Delaware 11,729 5,191 0 6,000 0 0 13,620 40 596 0
Delaware City Refining Co LLC
11,729 5,191 0 6,000 0 0 13,620........................................................... 40 596Delaware City 0
.....................................................................Hawaii 5,000 0 15,000 3,200 0 0 0 21 38 0
Energy Information Administration, Refinery Capacity 2016 28

State/Refiner/Location Alkylates Aromatics Isobutane Lubricants
Isomers
Isopentane
and
Isohexane
Asphalt
and
Road Oil
Marketable
Petroleum
Coke
Hydrogen
(MMcfd)
Sulfur
(short tons
per day)
Table 4. Production Capacity of Operable Petroleum Refineries by State as of January 1, 2016
(Barrels per Stream Day, Except Where Noted)
Isooctane
a
Chevron USA Inc
5,000 0 0 3,200 0 0 0........................................................... 3 0Honolulu 0
Hawaii Independent Energy LLC
0 0 15,000 0 0 0 0........................................................... 18 38Ewa Beach 0
.....................................................................Illinois 84,900 17,200 38,100 0 16,000 0 65,995 202 2,380 0
ExxonMobil Refining & Supply Co
29,100 0 15,100 0 0 0 18,595........................................................... 0 683Joliet 0
Marathon Petroleum Co LP
13,000 3,300 0 0 16,000 0 7,500........................................................... 0 202Robinson 0
PDV Midwest Refining LLC
21,000 9,400 0 0 0 0 12,000........................................................... 12 487Lemont 0
WRB Refining LP
21,800 4,500 23,000 0 0 0 27,900........................................................... 190 1,008Wood River 0
.....................................................................Indiana 33,200 16,800 33,700 0 28,000 0 30,000 0 1,913 0
BP Products North America Inc
31,000 16,800 30,000 0 24,800 0 30,000........................................................... 0 1,904Whiting 0
Countrymark Cooperative Inc
2,200 0 3,700 0 3,200 0 0........................................................... 0 9Mount Vernon 0
.....................................................................Kansas 33,500 0 4,000 5,300 27,000 0 20,060 90 712 0
CHS McPherson Refinery Inc
9,500 0 0 3,800 12,000 0 4,360........................................................... 34 168McPherson 0
Coffeyville Resources Rfg & Mktg
10,000 0 0 0 0 0 8,700........................................................... 0 229Coffeyville 0
HollyFrontier El Dorado Refining LLC
14,000 0 4,000 1,500 15,000 0 7,000........................................................... 56 315El Dorado 0
.....................................................................Kentucky 21,000 3,200 35,400 0 18,000 0 0 0 448 0
Energy Information Administration, Refinery Capacity 201629

State/Refiner/Location Alkylates Aromatics Isobutane Lubricants
Isomers
Isopentane
and
Isohexane
Asphalt
and
Road Oil
Marketable
Petroleum
Coke
Hydrogen
(MMcfd)
Sulfur
(short tons
per day)
Table 4. Production Capacity of Operable Petroleum Refineries by State as of January 1, 2016
(Barrels per Stream Day, Except Where Noted)
Isooctane
a
Marathon Petroleum Co LP
21,000 3,200 35,400 0 18,000 0 0........................................................... 0 448Catlettsburg 0
.....................................................................Louisiana 220,000 49,900 57,000 26,500 73,720 66,000 166,057 118 6,773 0
Alon Refining Krotz Springs Inc
0 0 0 0 6,220 0 0........................................................... 0 0Krotz Springs 0
Calcasieu Refining Co
0 0 0 3,500 0 0 0........................................................... 0 0Lake Charles 0
Calumet Lubricants Co LP
0 0 0 0 500 0 0........................................................... 2 0Cotton Valley 0
0 0 2,000 0 0 7,000 0........................................................... 4 3Princeton 0
Calumet Shreveport LLC
0 0 6,500 0 0 12,500 0........................................................... 12 40Shreveport 0
Chalmette Refining LLC
16,800 10,500 0 0 0 0 9,000........................................................... 0 920Chalmette 0
Citgo Petroleum Corp
26,400 20,900 0 0 28,000 0 30,000........................................................... 0 717Lake Charles 0
Excel Paralubes
0 0 0 0 0 30,000 0........................................................... 0 185Westlake 0
ExxonMobil Refining & Supply Co
41,000 0 0 0 0 16,500 31,525........................................................... 0 800Baton Rouge 0
Marathon Petroleum Co LP
33,000 0 33,000 23,000 26,500 0 33,000........................................................... 0 1,476Garyville 0
Motiva Enterprises LLC
16,500 0 0 0 12,500 0 0........................................................... 0 728Convent 0
16,800 0 0 0 0 0 7,316........................................................... 0 180Norco 0
Phillips 66 Company
35,000 15,500 0 0 0 0 6,716........................................................... 0 125Belle Chasse 0
6,000 0 2,500 0 0 0 22,500........................................................... 0 440Westlake 0
Energy Information Administration, Refinery Capacity 2016 30

State/Refiner/Location Alkylates Aromatics Isobutane Lubricants
Isomers
Isopentane
and
Isohexane
Asphalt
and
Road Oil
Marketable
Petroleum
Coke
Hydrogen
(MMcfd)
Sulfur
(short tons
per day)
Table 4. Production Capacity of Operable Petroleum Refineries by State as of January 1, 2016
(Barrels per Stream Day, Except Where Noted)
Isooctane
a
Placid Refining Co
7,500 0 0 0 0 0 0........................................................... 0 55Port Allen 0
Shell Oil Products US
0 0 13,000 0 0 0 0........................................................... 0 0Saint Rose 0
Valero Energy Corporation
0 0 0 0 0 0 0........................................................... 0 224Meraux 0
Valero Refining New Orleans LLC
21,000 3,000 0 0 0 0 26,000........................................................... 100 880Norco 0
.....................................................................Michigan 7,000 0 23,000 0 0 0 10,500 0 459 0
Marathon Petroleum Co LP
7,000 0 23,000 0 0 0 10,500........................................................... 0 459Detroit 0
.....................................................................Minnesota 18,000 0 58,000 1,000 27,500 0 22,900 186 1,264 0
Flint Hills Resources LP
12,500 0 45,000 0 18,000 0 22,900........................................................... 176 1,142Saint Paul 0
St Paul Park Refining Co LLC
5,500 0 13,000 1,000 9,500 0 0........................................................... 10 122Saint Paul 0
.....................................................................Mississippi 18,600 21,000 36,125 0 0 48,000 35,500 243 1,355 0
Chevron USA Inc
18,600 21,000 20,000 0 0 25,000 35,500........................................................... 230 1,355Pascagoula 0
Ergon Refining Inc
0 0 10,000 0 0 23,000 0........................................................... 13 0Vicksburg 0
Hunt Southland Refining Co
0 0 6,125 0 0 0 0........................................................... 0 0Sandersville 0
.....................................................................Montana 17,350 0 44,300 5,250 1,500 0 13,575 97 489 0
Calumet Montana Refining LLC
1,000 0 10,000 0 1,500 0 0........................................................... 7 0Great Falls 0
Energy Information Administration, Refinery Capacity 201631

State/Refiner/Location Alkylates Aromatics Isobutane Lubricants
Isomers
Isopentane
and
Isohexane
Asphalt
and
Road Oil
Marketable
Petroleum
Coke
Hydrogen
(MMcfd)
Sulfur
(short tons
per day)
Table 4. Production Capacity of Operable Petroleum Refineries by State as of January 1, 2016
(Barrels per Stream Day, Except Where Noted)
Isooctane
a
Cenex Harvest States Coop
4,000 0 19,800 1,250 0 0 4,100........................................................... 33 243Laurel 0
ExxonMobil Refining & Supply Co
5,100 0 14,500 0 0 0 4,000........................................................... 23 0Billings 0
Phillips 66 Company
7,250 0 0 4,000 0 0 5,475........................................................... 34 246Billings 0
.....................................................................Nevada 0 0 1,600 0 0 0 0 0 0 0
Foreland Refining Corp
0 0 1,600 0 0 0 0........................................................... 0 0Ely 0
.....................................................................New Jersey 29,200 0 70,000 4,000 0 12,000 7,500 26 280 0
Axeon Specialty Products LLC
0 0 49,000 0 0 0 0........................................................... 0 0Paulsboro 0
Paulsboro Refining Co LLC
11,200 0 21,000 0 0 12,000 7,500........................................................... 9 280Paulsboro 0
Phillips 66 Company
18,000 0 0 4,000 0 0 0........................................................... 17 0Linden 0
.....................................................................New Mexico 10,900 0 7,000 0 0 0 0 38 202 0
HollyFrontier Navajo Refining LLC
9,100 0 7,000 0 0 0 0........................................................... 38 200Artesia 0
Western Refining Southwest Inc
1,800 0 0 0 0 0 0........................................................... 0 2Gallup 0
.....................................................................North Dakota 4,830 0 0 0 0 0 0 2 19 0
Dakota Prairie Refining LLC
0 0 0 0 0 0 0........................................................... 2 2Dickinson 0
Tesoro West Coast
4,830 0 0 0 0 0 0........................................................... 0 17Mandan 0
Energy Information Administration, Refinery Capacity 2016 32

State/Refiner/Location Alkylates Aromatics Isobutane Lubricants
Isomers
Isopentane
and
Isohexane
Asphalt
and
Road Oil
Marketable
Petroleum
Coke
Hydrogen
(MMcfd)
Sulfur
(short tons
per day)
Table 4. Production Capacity of Operable Petroleum Refineries by State as of January 1, 2016
(Barrels per Stream Day, Except Where Noted)
Isooctane
a
.....................................................................Ohio 28,950 20,000 23,800 12,500 18,700 0 14,200 0 683 0
BP-Husky Refining LLC
11,500 0 9,000 0 0 0 10,000........................................................... 0 353Toledo 0
Lima Refining Company
0 9,200 0 4,500 18,700 0 4,200........................................................... 0 110Lima 0
Marathon Petroleum Co LP
7,500 0 14,800 0 0 0 0........................................................... 0 104Canton 0
Toledo Refining Co LLC
9,950 10,800 0 8,000 0 0 0........................................................... 0 116Toledo 0
.....................................................................Oklahoma 35,141 21,000 43,414 900 13,000 10,000 9,050 72 324 0
HollyFrontier Tulsa Refining LLC
5,500 0 15,200 0 13,000 0 0........................................................... 0 75Tulsa East 0
0 0 6,500 900 0 10,000 2,750........................................................... 0 0Tulsa West 0
Phillips 66 Company
17,129 0 0 0 0 0 6,300........................................................... 35 0Ponca City 0
Valero Refining Co Oklahoma
7,012 0 14,714 0 0 0 0........................................................... 27 249Ardmore 0
Wynnewood Refining Co
5,500 21,000 7,000 0 0 0 0........................................................... 10 0Wynnewood 0
.....................................................................Pennsylvania 42,500 4,920 22,065 8,000 8,500 2,945 0 0 282 0
American Refining Group Inc
0 0 65 0 0 2,945 0........................................................... 0 0Bradford 0
Monroe Energy LLC
12,000 0 0 0 0 0 0........................................................... 0 90Trainer 0
Philadelphia Energy Solutions
26,000 4,920 0 8,000 0 0 0........................................................... 0 125Philadelphia 0
Energy Information Administration, Refinery Capacity 201633

State/Refiner/Location Alkylates Aromatics Isobutane Lubricants
Isomers
Isopentane
and
Isohexane
Asphalt
and
Road Oil
Marketable
Petroleum
Coke
Hydrogen
(MMcfd)
Sulfur
(short tons
per day)
Table 4. Production Capacity of Operable Petroleum Refineries by State as of January 1, 2016
(Barrels per Stream Day, Except Where Noted)
Isooctane
a
United Refining Co
4,500 0 22,000 0 8,500 0 0........................................................... 0 67Warren 0
.....................................................................Tennessee 12,700 29,000 0 0 0 0 0 30 116 0
Premcor Refining Group Inc
12,700 29,000 0 0 0 0 0........................................................... 30 116Memphis 0
.....................................................................Texas 378,350 127,564 64,600 61,400 150,240 82,795 292,564 458 16,105 0
Alon USA Energy Inc
5,000 1,000 7,600 0 0 0 0........................................................... 0 150Big Spring 0
Citgo Refining & Chemical Inc
24,000 16,200 0 0 0 0 17,160........................................................... 0 368Corpus Christi 0
Deer Park Refining LTD Partnership
18,500 0 0 0 0 0 35,080........................................................... 0 1,085Deer Park 0
Delek Refining LTD
4,700 0 0 0 0 0 1,500........................................................... 0 39Tyler 0
Equistar Chemicals LP
22,000 0 0 0 0 0 0........................................................... 0 0Channelview 0
ExxonMobil Refining & Supply Co
37,000 0 0 0 0 28,000 22,750........................................................... 0 1,828Baytown 0
14,900 0 0 11,200 25,800 10,000 15,039........................................................... 0 590Beaumont 0
Flint Hills Resources LP
15,500 0 0 4,900 3,500 0 3,925........................................................... 0 426Corpus Christi 0
Houston Refining LP
11,250 19,300 0 0 0 3,895 29,850........................................................... 0 1,123Houston 0
Marathon Petroleum Co LP
40,000 35,600 0 0 0 0 11,900........................................................... 0 1,452Galveston Bay 0
14,500 2,900 0 0 0 0 0........................................................... 0 40Texas City 0
Motiva Enterprises LLC
20,000 0 0 0 49,140 39,000 47,850........................................................... 52 2,912Port Arthur 0
Energy Information Administration, Refinery Capacity 2016 34

State/Refiner/Location Alkylates Aromatics Isobutane Lubricants
Isomers
Isopentane
and
Isohexane
Asphalt
and
Road Oil
Marketable
Petroleum
Coke
Hydrogen
(MMcfd)
Sulfur
(short tons
per day)
Table 4. Production Capacity of Operable Petroleum Refineries by State as of January 1, 2016
(Barrels per Stream Day, Except Where Noted)
Isooctane
a
Pasadena Refining Systems Inc
12,500 0 0 0 0 0 0........................................................... 0 28Pasadena 0
Phillips 66 Company
21,700 11,600 0 0 10,100 0 22,800........................................................... 0 915Sweeny 0
Premcor Refining Group Inc
19,500 0 0 0 0 0 32,240........................................................... 0 1,490Port Arthur 0
South Hampton Resources Inc
0 1,064 0 0 4,400 0 0........................................................... 0 0Silsbee 0
Total Petrochemicals & Refining USA
6,700 13,600 0 0 7,800 0 19,200........................................................... 0 806Port Arthur 0
Valero Energy Corporation
9,800 0 12,000 3,000 0 0 0........................................................... 30 75Sunray 0
6,500 10,800 0 3,000 0 1,900 0........................................................... 0 134Three Rivers 0
Valero Refining Co Texas LP
21,300 15,500 38,000 17,000 12,000 0 6,270........................................................... 275 1,288Corpus Christi 0
11,800 0 0 0 0 0 0........................................................... 0 336Houston 0
14,700 0 0 0 6,500 0 19,000........................................................... 0 680Texas City 0
Western Refining Company LP
12,500 0 7,000 7,300 0 0 0........................................................... 10 0El Paso 0
WRB Refining LP
14,000 0 0 15,000 31,000 0 8,000........................................................... 91 340Borger 0
.....................................................................Utah 18,900 0 1,800 3,200 6,000 0 2,500 0 95 0
Big West Oil Co
3,000 0 0 1,900 3,000 0 0........................................................... 0 4North Salt Lake 0
Chevron USA Inc
5,600 0 0 1,300 0 0 2,500........................................................... 0 63Salt Lake City 0
HollyFrontier Woods Cross Refining LLC
3,300 0 1,800 0 3,000 0 0........................................................... 0 10Woods Cross 0
Energy Information Administration, Refinery Capacity 201635

State/Refiner/Location Alkylates Aromatics Isobutane Lubricants
Isomers
Isopentane
and
Isohexane
Asphalt
and
Road Oil
Marketable
Petroleum
Coke
Hydrogen
(MMcfd)
Sulfur
(short tons
per day)
Table 4. Production Capacity of Operable Petroleum Refineries by State as of January 1, 2016
(Barrels per Stream Day, Except Where Noted)
Isooctane
a
Tesoro West Coast
7,000 0 0 0 0 0 0........................................................... 0 18Salt Lake City 0
.....................................................................Washington 36,100 0 13,500 12,300 28,500 0 23,650 137 822 0
BP West Coast Products LLC
0 0 0 6,000 24,000 0 15,250........................................................... 137 284Ferndale 0
Phillips 66 Company
10,200 0 0 2,700 0 0 0........................................................... 0 123Ferndale 0
Shell Oil Products US
12,100 0 0 0 0 0 8,400........................................................... 0 350Anacortes 0
Tesoro West Coast
13,800 0 5,500 3,600 0 0 0........................................................... 0 54Anacortes 0
US Oil & Refining Co
0 0 8,000 0 4,500 0 0........................................................... 0 11Tacoma 0
.....................................................................West Virginia 0 0 700 0 0 6,100 0 3 1 0
Ergon West Virginia Inc
0 0 700 0 0 6,100 0........................................................... 3 1Newell 0
.....................................................................Wisconsin 1,600 6,000 7,900 0 0 0 0 0 34 0
Calumet Lubricants Co LP
1,600 6,000 7,900 0 0 0 0........................................................... 0 34Superior 0
.....................................................................Wyoming 10,000 0 24,000 0 0 0 11,700 58 333 0
HollyFrontier Cheyenne Refining LLC
4,200 0 16,000 0 0 0 4,700........................................................... 6 116Cheyenne 0
Little America Refining Co
0 0 0 0 0 0 0........................................................... 0 10Evansville 0
Sinclair Wyoming Refining Co
4,500 0 8,000 0 0 0 7,000........................................................... 52 207Sinclair 0
Energy Information Administration, Refinery Capacity 2016 36

State/Refiner/Location Alkylates Aromatics Isobutane Lubricants
Isomers
Isopentane
and
Isohexane
Asphalt
and
Road Oil
Marketable
Petroleum
Coke
Hydrogen
(MMcfd)
Sulfur
(short tons
per day)
Table 4. Production Capacity of Operable Petroleum Refineries by State as of January 1, 2016
(Barrels per Stream Day, Except Where Noted)
Isooctane
a
Wyoming Refining Co
1,300 0 0 0 0 0 0........................................................... 0 0New Castle 0
.....................................................................U.S. Total 1,286,012 323,275 732,587 192,085 562,960 273,140 889,491 2,997 41,343 200
Includes hydrogen production capacity of hydrogen plants on refinery grounds.a
Note: Refer to Table 5 for corporate ownership information. Some names of previously independent companies have been preserved by acquiring companies.
Source: Energy Information Administration (EIA), Form EIA-820, "Annual Refinery Report."
Energy Information Administration, Refinery Capacity 201637

CORPORATION / Refiner / Location
Table 5. Refiners' Total Operable Atmospheric Crude Oil Distillation Capacity as of January 1, 2016
Calendar Day
Barrels per
CORPORATION / Refiner / Location Calendar Day
Barrels per
Companies with Capacity
Over 100,000 bbl/cd
..............................................................................................................................VALERO ENERGY CORP 2,062,300
Valero Refining Co Texas LP
.............................................................................................................................. Corpus Christi, Texas 293,000
.............................................................................................................................. Texas City, Texas 225,000
.............................................................................................................................. Houston, Texas 100,000
Premcor Refining Group Inc
.............................................................................................................................. Port Arthur, Texas 335,000
.............................................................................................................................. Memphis, Tennessee 190,000
Valero Energy Corporation
.............................................................................................................................. Sunray, Texas 168,000
.............................................................................................................................. Meraux, Louisiana 125,000
.............................................................................................................................. Three Rivers, Texas 89,000
Valero Refining Co California
.............................................................................................................................. Benicia, California 145,000
.............................................................................................................................. Wilmington Refinery, California 85,000
.............................................................................................................................. Wilmington Asphalt Plant, California 6,300
Valero Refining New Orleans LLC
.............................................................................................................................. Norco, Louisiana 215,000
Valero Refining Co Oklahoma
.............................................................................................................................. Ardmore, Oklahoma 86,000
..............................................................................................................................EXXON MOBIL CORP 1,857,500
ExxonMobil Refining & Supply Co
.............................................................................................................................. Baytown, Texas 560,500
.............................................................................................................................. Baton Rouge, Louisiana 502,500
.............................................................................................................................. Beaumont, Texas 344,600
.............................................................................................................................. Joliet, Illinois 238,600
.............................................................................................................................. Torrance, California 151,300
.............................................................................................................................. Billings, Montana 60,000
..............................................................................................................................MARATHON PETROLEUM CORP 1,794,000
Marathon Petroleum Co LP
.............................................................................................................................. Garyville, Louisiana 539,000
.............................................................................................................................. Galveston Bay, Texas 459,000
.............................................................................................................................. Catlettsburg, Kentucky 273,000
.............................................................................................................................. Robinson, Illinois 212,000
.............................................................................................................................. Detroit, Michigan 132,000
.............................................................................................................................. Canton, Ohio 93,000
.............................................................................................................................. Texas City, Texas 86,000
..............................................................................................................................PHILLIPS 66 COMPANY 1,612,200
Phillips 66 Company
.............................................................................................................................. Westlake, Louisiana 260,000
.............................................................................................................................. Belle Chasse, Louisiana 247,000
.............................................................................................................................. Sweeny, Texas 247,000
.............................................................................................................................. Linden, New Jersey 238,000
.............................................................................................................................. Ponca City, Oklahoma 200,000
.............................................................................................................................. Wilmington, California 139,000
.............................................................................................................................. Rodeo, California 120,200
.............................................................................................................................. Ferndale, Washington 101,000
.............................................................................................................................. Billings, Montana 60,000
..............................................................................................................................MOTIVA ENTERPRISES LLC 1,075,700 (50% Royal Dutch/Shell Group, 50% Saudi Aramco)
Motiva Enterprises LLC
.............................................................................................................................. Port Arthur, Texas 603,000
.............................................................................................................................. Norco, Louisiana 237,700
.............................................................................................................................. Convent, Louisiana 235,000
..............................................................................................................................CHEVRON CORP 951,271
Chevron USA Inc
.............................................................................................................................. Pascagoula, Mississippi 330,000
.............................................................................................................................. El Segundo, California 269,000
.............................................................................................................................. Richmond, California 245,271
.............................................................................................................................. Honolulu, Hawaii 54,000
.............................................................................................................................. Salt Lake City, Utah 53,000
Energy Information Administration, Refinery Capacity 2016 38

CORPORATION / Refiner / Location
Table 5. Refiners' Total Operable Atmospheric Crude Oil Distillation Capacity as of January 1, 2016
Calendar Day
Barrels per
CORPORATION / Refiner / Location Calendar Day
Barrels per
..............................................................................................................................TESORO CORP 831,030
Tesoro Refining & Marketing Co
.............................................................................................................................. Carson, California 256,830
.............................................................................................................................. Martinez, California 166,000
.............................................................................................................................. Wilmington, California 98,340
Tesoro West Coast
.............................................................................................................................. Anacortes, Washington 120,000
.............................................................................................................................. Mandan, North Dakota 73,860
.............................................................................................................................. Salt Lake City, Utah 57,500
Tesoro Alaska Petroleum Co
.............................................................................................................................. Kenai, Alaska 58,500
..............................................................................................................................PDV AMERICA INC 761,240
Citgo Petroleum Corp
.............................................................................................................................. Lake Charles, Louisiana 427,800
PDV Midwest Refining LLC
.............................................................................................................................. Lemont, Illinois 175,940
Citgo Refining & Chemical Inc
.............................................................................................................................. Corpus Christi, Texas 157,500
..............................................................................................................................PBF ENERGY CO LLC 694,700
Chalmette Refining LLC
.............................................................................................................................. Chalmette, Louisiana
a
192,500
Delaware City Refining Co LLC
.............................................................................................................................. Delaware City, Delaware 182,200
Paulsboro Refining Co LLC
.............................................................................................................................. Paulsboro, New Jersey 160,000
Toledo Refining Co LLC
.............................................................................................................................. Toledo, Ohio 160,000
..............................................................................................................................BP PLC 651,000
BP Products North America Inc
.............................................................................................................................. Whiting, Indiana 413,500
BP West Coast Products LLC
.............................................................................................................................. Ferndale, Washington 227,000
BP Exploration Alaska Inc
.............................................................................................................................. Prudhoe Bay, Alaska 10,500
..............................................................................................................................KOCH INDUSTRIES INC 585,630
Flint Hills Resources LP
.............................................................................................................................. Corpus Christi, Texas 295,630
.............................................................................................................................. Saint Paul, Minnesota 290,000
..............................................................................................................................WRB REFINING LP 482,000
WRB Refining LP
.............................................................................................................................. Wood River, Illinois 336,000 (50% Phillips 66, 50% Cenovus)
.............................................................................................................................. Borger, Texas 146,000 (50% Phillips 66, 50% Cenovus)
..............................................................................................................................HOLLYFRONTIER CORP 467,350
HollyFrontier Tulsa Refining LLC
.............................................................................................................................. Tulsa West, Oklahoma 85,000
.............................................................................................................................. Tulsa East, Oklahoma 70,300
HollyFrontier El Dorado Refining LLC
.............................................................................................................................. El Dorado, Kansas 138,000
HollyFrontier Navajo Refining LLC
.............................................................................................................................. Artesia, New Mexico 102,000
HollyFrontier Cheyenne Refining LLC
.............................................................................................................................. Cheyenne, Wyoming 47,000
HollyFrontier Woods Cross Refining LLC
.............................................................................................................................. Woods Cross, Utah 25,050
..............................................................................................................................ROYAL DUTCH/SHELL GROUP 437,975
Shell Oil Products US
.............................................................................................................................. Martinez, California 156,400
.............................................................................................................................. Anacortes, Washington 145,000
.............................................................................................................................. Saint Rose, Louisiana 45,000
Shell Chemical LP
.............................................................................................................................. Saraland, Alabama 91,575
Energy Information Administration, Refinery Capacity 201639

CORPORATION / Refiner / Location
Table 5. Refiners' Total Operable Atmospheric Crude Oil Distillation Capacity as of January 1, 2016
Calendar Day
Barrels per
CORPORATION / Refiner / Location Calendar Day
Barrels per
CARLYLE GROUP
Philadelphia Energy Solutions
.............................................................................................................................. Philadelphia, Pennsylvania 335,000
DEER PARK REFINING LTD PTNRSHP (50% Royal Dutch/Shell Group, 50% Pemex)
Deer Park Refining LTD Partnership
.............................................................................................................................. Deer Park, Texas 285,500
ACCESS INDUSTRIES
Houston Refining LP
.............................................................................................................................. Houston, Texas 263,776
..............................................................................................................................ALON ISRAEL OIL COMPANY LTD 237,500
Paramount Petroleum Corporation
.............................................................................................................................. Paramount, California 84,500
Alon Refining Krotz Springs Inc
.............................................................................................................................. Krotz Springs, Louisiana 80,000
Alon USA Energy Inc
.............................................................................................................................. Big Spring, Texas 73,000
TOTAL SA
Total Petrochemicals & Refining USA
.............................................................................................................................. Port Arthur, Texas 225,500
DELTA AIR LINES INC
Monroe Energy LLC
.............................................................................................................................. Trainer, Pennsylvania 190,000
..............................................................................................................................CVR ENERGY 185,000
Coffeyville Resources Rfg & Mktg
.............................................................................................................................. Coffeyville, Kansas 115,000
Wynnewood Refining Co
.............................................................................................................................. Wynnewood, Oklahoma 70,000
..............................................................................................................................CALUMET SPECIALTY PRODUCTS PARTNERS, L.P. 169,920
Calumet Lubricants Co LP
.............................................................................................................................. Superior, Wisconsin 38,000
.............................................................................................................................. Cotton Valley, Louisiana 13,020
.............................................................................................................................. Princeton, Louisiana 8,300
Calumet Shreveport LLC
.............................................................................................................................. Shreveport, Louisiana 57,000
Calumet Montana Refining LLC
.............................................................................................................................. Great Falls, Montana 33,600
Calumet Lubricants Co
.............................................................................................................................. San Antonio, Texas 20,000
..............................................................................................................................DELEK GROUP LTD 155,000
Lion Oil Co
.............................................................................................................................. El Dorado, Arkansas 83,000
Delek Refining LTD
.............................................................................................................................. Tyler, Texas 72,000
BP-HUSKY REFINING LLC (50% BP, 50% Husky)
BP-Husky Refining LLC
.............................................................................................................................. Toledo, Ohio 153,000
HUSKY ENERGY INC
Lima Refining Company
.............................................................................................................................. Lima, Ohio 152,000
..............................................................................................................................WESTERN REFINING INC. 147,500
Western Refining Company LP
.............................................................................................................................. El Paso, Texas 122,000
Western Refining Southwest Inc
.............................................................................................................................. Gallup, New Mexico 25,500
..............................................................................................................................CHS INC 145,600
CHS McPherson Refinery Inc
.............................................................................................................................. McPherson, Kansas
b
86,000
Cenex Harvest States Coop
.............................................................................................................................. Laurel, Montana 59,600
PETROBRAS AMERICA INC
Pasadena Refining Systems Inc
.............................................................................................................................. Pasadena, Texas 112,229
Energy Information Administration, Refinery Capacity 2016 40

CORPORATION / Refiner / Location
Table 5. Refiners' Total Operable Atmospheric Crude Oil Distillation Capacity as of January 1, 2016
Calendar Day
Barrels per
CORPORATION / Refiner / Location Calendar Day
Barrels per
..............................................................................................................................SINCLAIR OIL CORP 109,500
Sinclair Wyoming Refining Co
.............................................................................................................................. Sinclair, Wyoming 85,000
Little America Refining Co
.............................................................................................................................. Evansville, Wyoming 24,500
..............................................................................................................................SUNCOR ENERGY INC 103,000
Suncor Energy (USA) Inc
.............................................................................................................................. Commerce City West, Colorado 67,000
.............................................................................................................................. Commerce City East, Colorado 36,000
Total.................................................................................................... 17,233,921
Companies with Capacity
30,001 to 100,000 bbl/cd
PAR PACIFIC HOLDINGS
Hawaii Independent Energy LLC
.................................................................................................... Ewa Beach, Hawaii 93,500
TRANSWORLD OIL USA INC
Calcasieu Refining Co
.................................................................................................... Lake Charles, Louisiana 89,000
NORTHERN TIER ENERGY LLC
St Paul Park Refining Co LLC
.................................................................................................... Saint Paul, Minnesota 88,900
KINDER MORGAN ENERGY PTNRS LP
Kinder Morgan Crude & Condensate
.................................................................................................... Galena Park, Texas 84,000
PLACID OIL CO
Placid Refining Co
.................................................................................................... Port Allen, Louisiana 75,000
....................................................................................................ARCTIC SLOPE REGIONAL CORP 74,700
Petro Star Inc
.................................................................................................... Valdez, Alaska 55,000
.................................................................................................... North Pole, Alaska 19,700
LINDSAY GOLDBERG LLC
Axeon Specialty Products LLC
.................................................................................................... Paulsboro, New Jersey 74,000
RED APPLE GROUP INC
United Refining Co
.................................................................................................... Warren, Pennsylvania 65,000
....................................................................................................HUNT CONSLD INC 47,000
Hunt Refining Co
.................................................................................................... Tuscaloosa, Alabama 36,000
Hunt Southland Refining Co
.................................................................................................... Sandersville, Mississippi 11,000
BUCKEYE PARTNERS LP
Buckeye Texas Processing LLC
.................................................................................................... Corpus Christi, Texas 46,250
....................................................................................................ERGON INC 45,300
Ergon Refining Inc
.................................................................................................... Vicksburg, Mississippi 23,000
Ergon West Virginia Inc
.................................................................................................... Newell, West Virginia 22,300
TRAILSTONE LP
US Oil & Refining Co
.................................................................................................... Tacoma, Washington 40,700
FJ MANAGEMENT INC
Big West Oil Co
.................................................................................................... North Salt Lake, Utah 30,500
Total.................................................................................................... 853,850
Companies with Capacity10,001 to 30,000 bbl/cd
COUNTRYMARK COOP INC
Countrymark Cooperative Inc
.................................................................................................... Mount Vernon, Indiana 27,100
Energy Information Administration, Refinery Capacity 201641

CORPORATION / Refiner / Location
Table 5. Refiners' Total Operable Atmospheric Crude Oil Distillation Capacity as of January 1, 2016
Calendar Day
Barrels per
CORPORATION / Refiner / Location Calendar Day
Barrels per
KERN OIL & REFINING CO
Kern Oil & Refining Co
.................................................................................................... Bakersfield, California 26,000
PETROMAX REFINING CO LLC
Petromax Refining Co LLC
.................................................................................................... Houston, Texas 25,000
DAKOTA PRAIRIE REFINING
Dakota Prairie Refining LLC
.................................................................................................... Dickinson, North Dakota 19,500
BLACK ELK REFINING LLC
Wyoming Refining Co
.................................................................................................... New Castle, Wyoming 18,000
....................................................................................................SILVER EAGLE REFINING INC 18,000
Silver Eagle Refining
.................................................................................................... Woods Cross, Utah 15,000
.................................................................................................... Evanston, Wyoming 3,000
CONOCOPHILLIPS
ConocoPhillips Alaska Inc
.................................................................................................... Prudhoe Bay, Alaska 15,000
SAN JOAQUIN REFINING CO INC
San Joaquin Refining Co Inc
.................................................................................................... Bakersfield, California 15,000
BLUE DOLPHIN ENERGY CO
Lazarus Energy LLC
.................................................................................................... Nixon, Texas 13,765
AMERICAN REFINING GROUP INC
American Refining Group Inc
.................................................................................................... Bradford, Pennsylvania 11,000
Total.................................................................................................... 188,365
Companies with Capacity
10,000 bbl/cd or Less
GREKA ENERGY
Santa Maria Refining Company
.................................................................................................... Santa Maria, California 9,500
WORLD OIL CO
Lunday Thagard Co
.................................................................................................... South Gate, California 8,500
MARTIN RESOURCE MGMT CORP
Cross Oil Refining & Marketing Inc
.................................................................................................... Smackover, Arkansas 7,500
CONTINENTAL REFINING CO LLC
Continental Refining Company LLC
.................................................................................................... Somerset, Kentucky 5,500
GOODWAY REFINING LLC
Goodway Refining LLC
.................................................................................................... Atmore, Alabama 4,100
GENESIS ENERGY LP
Antelope Refining LLC
.................................................................................................... Douglas, Wyoming 3,800
FORELAND REFINING CORP
Foreland Refining Corp
.................................................................................................... Ely, Nevada 2,000
Total.................................................................................................... 40,900
U.S. Total........................................................... 18,317,036
Energy Information Administration, Refinery Capacity 2016 42

CORPORATION / Refiner / Location
Table 5. Refiners' Total Operable Atmospheric Crude Oil Distillation Capacity as of January 1, 2016
Calendar Day
Barrels per
CORPORATION / Refiner / Location Calendar Day
Barrels per
Formerly 50% ExxonMobil, 50% PDV.
a
bFormerly owned by NCRA.
Source: Energy Information Administration (EIA), Form EIA-820, "Annual Refinery Report."
Energy Information Administration, Refinery Capacity 201643

Year/PAD
District Distillation
Crude Oil
Atmospheric
Distillation
Vacuum
Cracking
Thermal Catalytic Cracking
Fresh Recycled
Catalytic
Hydro-
Cracking
Catalytic
Reforming Desulfurization
Hydrotreating/
Fuels
Solvent
Deasphalting
Downstream Charge Capacity
Table 6. Operable Crude Oil and Downstream Charge Capacity of Petroleum Refineries, January 1, 1987 to
(Thousand Barrels per Stream Day, Except Where Noted)
January 1, 2016
JAN 1, 1987 16,460 6,935 1,928 5,251 466 1,189 3,805 9,083 230
JAN 1, 1988 16,825 7,198 2,080 5,424 381 1,202 3,891 9,170 240
JAN 1, 1989 16,568 7,225 2,073 5,324 326 1,238 3,911 9,440 245
JAN 1, 1990 16,507 7,245 2,108 5,441 314 1,282 3,896 9,537 279
JAN 1, 1991 16,557 7,276 2,158 5,559 304 1,308 3,926 9,676 271
JAN 1, 1992 16,633 7,127 2,100 5,608 280 1,363 3,907 9,644 276
JAN 1, 1993 15,935 6,892 2,082 5,540 244 1,397 3,728 9,677 269
JAN 1, 1994 15,904 6,892 2,107 5,586 191 1,376 3,875 10,616 261
JAN 1, 1995 16,326 7,248 2,123 5,583 169 1,386 3,867 10,916 251
JAN 1, 1997 16,287 7,349 2,050 5,595 155 1,388 3,727 11,041 275
JAN 1, 1999 17,155 7,538 2,046 5,920 153 1,552 3,779 11,461 319
JAN 1, 2000 17,393 7,617 2,163 5,949 99 1,576 3,770 11,440 351
JAN 1, 2001 17,511 7,798 2,277 5,983 86 1,615 3,797 11,673 350
JAN 1, 2002 17,676 7,779 2,329 5,989 80 1,633 3,753 11,845 362
JAN 1, 2003 17,675 7,788 2,377 6,052 79 1,644 3,777 11,987 350
JAN 1, 2004 17,815 7,964 2,435 6,098 87 1,602 3,812 13,501 366
JAN 1, 2005 18,031 8,120 2,491 6,151 87 1,624 3,836 14,087 384
JAN 1, 2006 18,308 8,398 2,540 6,188 87 1,637 3,859 14,808 386
JAN 1, 2007 18,425 8,251 2,564 6,219 82 1,791 3,908 15,447 379
JAN 1, 2008 18,558 8,421 2,606 6,266 79 1,770 3,892 15,807 378
JAN 1, 2009 18,681 8,542 2,639 6,292 79 1,743 3,829 16,131 381
JAN 1, 2010 18,581 8,543 2,632 6,140 92 1,820 3,700 16,023 383
JAN 1, 2011 18,953 8,650 2,672 6,220 96 1,856 3,721 16,683 383
JAN 1, 2012 18,560 8,680 2,763 6,033 85 1,880 3,642 16,565 375
JAN 1, 2013 18,972 8,938 2,877 6,089 84 2,081 3,758 16,860 368
JAN 1, 2014 19,064 8,987 2,959 6,032 76 2,208 3,759 17,095 370
JAN 1, 2015 19,134 8,979 2,975 6,012 76 2,305 3,741 17,324 370
JAN 1, 2016 19,508 9,073 2,983 6,052 76 2,318 3,743 17,483 371
1,353PADD I 586 82 499 5 45 264 1,030 22
4,221PADD II 1,775 577 1,339 16 322 893 3,867 18
10,118PADD III 4,830 1,636 3,118 34 1,309 1,864 9,319 244
720PADD IV 256 90 210 5 55 134 592 6
3,096PADD V 1,626 599 887 16 586 588 2,675 80
JAN 1, 2017 19,668 9,074 2,985 6,061 76 2,373 3,745 17,624 371a
1,353PADD I 586 82 499 5 45 264 1,046 22
4,256PADD II 1,775 579 1,339 16 348 893 3,893 18
10,228PADD III 4,830 1,636 3,118 34 1,332 1,866 9,417 244
735PADD IV 256 90 218 5 61 134 593 6
3,096PADD V 1,626 599 887 16 586 588 2,675 80
2016-2017 160 1 2 9 0 55 2 141 0a
0PADD I 0 0 0 0 0 0 16 0
35PADD II 0 2 0 0 26 0 26 0
110PADD III 0 0 0 0 23 2 98 0
15PADD IV 0 0 8 0 6 0 1 0
0PADD V 0 0 0 0 0 0 0 0
Projected data from refiners.
Notes:
NA = Not available.
Totals may not equal sum of components due to independent rounding.
a
The EIA-820 refinery capacity survey was not conducted for January 1, 1996 or January 1, 1998.
Source: Energy Information Administration (EIA), Form EIA-820, "Annual Refinery Report."
Energy Information Administration, Refinery Capacity 2016 44

Year/PAD
District Alkylates Aromatics Road Oil
and
Lubricants
Petroleum
Coke (MMcfd)
Hydrogen
Sulfur
(short
tons/day)
Production Capacity
Asphalt
Isomers
Marketable
Table 7. Operable Production Capacity of Petroleum Refineries, January 1, 1987 to January 1, 2016
(Thousand Barrels per Stream Day, Except Where Noted)
a
JAN 1, 1987 974 287 788 326 250 364 2,569 23,806
JAN 1, 1988 993 289 788 465 232 368 2,418 27,639
JAN 1, 1989 1,015 290 823 469 230 333 2,501 28,369
JAN 1, 1990 1,030 290 844 456 232 341 2,607 24,202
JAN 1, 1991 1,077 292 866 490 229 367 2,527 23,875
JAN 1, 1992 1,095 290 812 494 217 356 2,644 23,811
JAN 1, 1993 1,083 286 814 499 217 393 2,674 25,940
JAN 1, 1994 1,086 278 793 499 213 410 2,940 24,554
JAN 1, 1995 1,105 285 846 502 217 427 3,139 24,885
JAN 1, 1997 1,120 288 872 577 244 458 3,052 26,466
JAN 1, 1999 1,172 302 846 667 233 441 3,104 26,423
JAN 1, 2000 1,185 315 886 643 218 464 3,143 26,645
JAN 1, 2001 1,191 318 900 654 214 538 3,230 27,446
JAN 1, 2002 1,181 313 917 658 218 548 3,244 29,107
JAN 1, 2003 1,191 316 873 679 216 646 3,265 29,766
JAN 1, 2004 1,205 322 887 688 210 672 3,258 30,606
JAN 1, 2005 1,229 318 881 703 217 696 2,965 31,004
JAN 1, 2006 1,238 319 893 708 220 709 2,823 32,421
JAN 1, 2007 1,227 306 877 739 234 722 3,100 33,021
JAN 1, 2008 1,261 285 858 727 249 735 3,109 33,487
JAN 1, 2009 1,261 299 847 736 230 762 2,914 33,500
JAN 1, 2010 1,249 271 844 715 240 760 2,985 34,058
JAN 1, 2011 1,262 297 828 703 243 778 3,082 35,483
JAN 1, 2012 1,247 297 796 688 242 823 3,215 36,663
JAN 1, 2013 1,269 318 741 737 241 867 3,047 39,478
JAN 1, 2014 1,266 297 744 739 240 883 3,094 41,375
JAN 1, 2015 1,267 316 710 757 265 887 3,102 41,266
JAN 1, 2016 1,286 323 733 755 273 889 2,997 41,343
PADD I 83 10 93 27 21 21 69 1,159
PADD II 281 113 267 168 10 173 582 8,352
PADD III 633 198 201 325 202 501 910 24,820
PADD IV 46 0 82 17 0 28 177 1,033
PADD V 243 2 89 219 40 167 1,259 5,979
JAN 1, 2017 1,290 323 733 755 273 890 3,038 41,634b
PADD I 83 10 93 27 21 21 69 1,159
PADD II 281 113 267 168 10 173 604 8,352
PADD III 634 198 201 325 202 501 912 25,111
PADD IV 48 0 82 17 0 28 194 1,033
PADD V 243 2 89 219 40 167 1,259 5,979
2016-2017 4 0 0 0 0 1 41 291b
PADD I 0 0 0 0 0 0 0 0
PADD II 0 0 0 0 0 0 22 0
PADD III 1 0 0 0 0 0 2 291
PADD IV 2 0 0 0 0 0 17 0
PADD V 0 0 0 0 0 0 0 0
Includes hydrogen production capacity of hydrogen plants on refinery grounds.
Projected data from refiners.
Notes:
NA = Not available. MMcfd = Million cubic feet per day.
a
Totals may not equal sum of components due to independent rounding.
b
The EIA-820 refinery capacity survey was not conducted for January 1, 1996 or January 1, 1998.
Source: Energy Information Administration (EIA), Form EIA-820, "Annual Refinery Report."
Energy Information Administration, Refinery Capacity 201645

Year/PAD
District
Cokers Catalytic Crackers Hydrocrackers
Capacity Inputs Capacity Inputs Capacity Inputs
Table 8. Capacity and Fresh Feed Input to Selected Downstream Units at U.S. Refineries, 2014 - 2016
(Barrels per Calendar Day)
Reformers
Capacity Inputs
2014 2,686,917 5,616,015 2,034,6892,337,425 4,884,975 1,662,603 2,591,9923,419,407
74,900 475,800 41,50047,633 407,342 29,849PADD I 175,036240,550
520,521 1,213,427 310,950444,060 1,023,877 267,016PADD II 645,874837,754
1,479,496 2,916,764 1,118,2391,312,296 2,598,230 879,381PADD III 1,290,4491,699,083
82,500 189,324 28,50062,833 167,647 21,241PADD IV 98,452118,360
529,500 820,700 535,500470,603 687,879 465,115PADD V 382,181523,660
2015 2,686,299 5,583,169 2,123,4312,366,852 4,834,386 1,700,249 2,731,1673,392,641
74,900 473,800 41,50051,699 406,197 34,847PADD I 181,392237,550
519,740 1,217,590 312,850439,066 1,054,008 253,332PADD II 654,940814,550
1,489,899 2,882,183 1,202,2011,361,005 2,584,515 956,816PADD III 1,394,6821,702,952
82,500 188,576 28,50068,090 166,455 18,792PADD IV 100,225117,160
519,260 821,020 538,380446,992 623,211 436,463PADD V 399,929520,429
2016 2,650,839 5,596,552 2,121,715NA NA NA NA3,385,049
74,900 475,800 41,500NA NA NAPADD I NA241,050
521,543 1,235,625 292,600NA NA NAPADD II NA812,460
1,458,026 2,867,837 1,193,745NA NA NAPADD III NA1,700,570
82,500 195,480 51,700NA NA NAPADD IV NA118,830
513,870 821,810 542,170NA NA NAPADD V NA512,139
NA = Not Available.
Note: Capacities are as of January 1 of the indicated year.
Sources: Capacities are from the Energy Information Admistration (EIA) Form EIA-820, "Annual Refinery Report."
Inputs are from the form EIA-810, "Monthly Refinery Report." Year 2014 data is final, 2015 data is preliminary.
Energy Information Administration, Refinery Capacity 2016 46

Method
PAD Districts
I II III IV V United States
Table 9. Refinery Receipts of Crude Oil by Method of Transportation by PAD District, 2015
(Thousand Barrels)
a
Pipeline 25,319 1,270,581 1,894,658 178,448 290,577 3,659,583
Domestic 2,766 679,552 1,624,647 86,978 222,419 2,616,362
Foreign 22,553 591,029 270,011 91,470 68,158 1,043,221
Tanker 305,663 0 941,152 0 513,584 1,760,399
Domestic 119,833 0 28,324 0 180,353 328,510
Foreign 185,830 0 912,828 0 333,231 1,431,889
Barge 22,367 4,569 227,383 0 28,604 282,923
Domestic 15,192 4,569 171,808 0 3,649 195,218
Foreign 7,175 0 55,575 0 24,955 87,705
Tank Cars (Rail) 53,713 1,465 13,440 17 56,605 125,240
Domestic 48,658 1,429 6,313 17 54,373 110,790
Foreign 5,055 36 7,127 0 2,232 14,450
Trucks 2,924 24,145 100,003 41,420 8,161 176,653
Domestic 2,924 24,145 100,003 41,420 8,161 176,653
Foreign 0 0 0 0 0 0
Total 409,986 1,300,760 3,176,636 219,885 897,531 6,004,798
Domestic 189,373 709,695 1,931,095 128,415 468,955 3,427,533
Foreign 220,613 591,065 1,245,541 91,470 428,576 2,577,265
Receipts are reported by the last method of transportation used if the distance traveled is greater than 100 miles. If several methods are used and none are
greater than 100 miles, the method which represents the greatest distance traveled is reported. For example, if crude oil traveled by rail for 1,500 miles and then
by barge for 120 miles, then the reported mode of transportation would be barge rather than rail.
Source: Energy Information Administration (EIA), Form EIA-820, "Annual Refinery Report."
a
Energy Information Administration, Refinery Capacity 201647

Commodity
PAD Districts
I II III IV V
United
States
Table 10a. Fuel Consumed at Refineries by PAD District, 2015
(Thousand Barrels, Except Where Noted)
Crude Oil 0 0 0 0 0 0
Liquefied Petroleum Gases 0 1,834 309 20 846 3,009
Distillate Fuel Oil 0 26 220 8 110 364
Residual Fuel Oil 20 18 22 2 333 395
Still Gas 15,955 50,290 112,346 8,842 44,613 232,046
Marketable Petroleum Coke 0 0 0 520 90 610
Catalyst Petroleum Coke 8,229 17,001 43,013 2,876 10,891 82,010
Natural Gas (million cubic feet) 48,181 151,555 445,865 28,953 177,513 852,067
Coal (thousand short tons) 17 0 0 0 0 17
Purchased Electricity (million kWh) 2,664 12,821 25,048 2,142 4,185 46,860
Purchased Steam (million pounds) 4,611 10,684 98,350 1,755 12,939 128,339
Other Products 61 78 333 13 466 951a
Note: Includes volumes used as fuel at refineries and all nonprocessing losses of crude oil and petroleum products (e.g., spills, fire losses, contamination,
etc.)
Includes pentanes plus, other hydrocarbons, oxygenates, hydrogen, unfinished oils, gasoline, special naphthas, jet fuel, lubricants, asphalt and road oil,
and miscellaneous products.
Source: Energy Information Administration (EIA), Form EIA-820, "Annual Refinery Report," and Form EIA-810, "Monthly Refinery Report."
a
Commodity
PAD Districts
I II III IV V
United
States
Table 10b. Natural Gas Used as Feedstock for Hydrogen Production by PAD District, 2015
(Million Cubic Feet)
Natural Gas Used As Feedstock For
Hydrogen Production
5,865 48,390 56,223 12,330 58,145 180,953
Source: Energy Information Administration (EIA), Form EIA-820, "Annual Refinery Report".
Energy Information Administration, Refinery Capacity 2016 48

PAD District / Refinery Location
Total Atmospheric
Distillation
Capacity (bbl/cd)
Crude Oil Total Downstream
Charge Capacity
(bbl/sd)
Date
Operable
Date of Last
Operation
Date
Shutdown
Table 11. New, Shutdown and Reactivated Refineries During 2015
a b
NEW
PAD District III 71,250
Buckeye Texas Processing
LLC
Corpus Christi, TX 46,250 11/15
Petromax Refining Co LLC Houston, TX 25,000 07/15
SHUTDOWN
PAD District III 0 12,000
Pelican Refining Company
LLC
Lake Charles, LA 0 12,000 12/14 01/15
a
b
bbl/cd=Barrels per calendar day.
bbl/sd=Barrels per stream day.
Sources: Energy Information Administration (EIA) Form EIA-810, "Monthly Refinery Report" and Form EIA-820, "Annual Refinery Report."
Energy Information Administration, Refinery Capacity 201649

Former Corporation/Refiner
Total Atmospheric Crude
Oil Distillation Capacity
(bbl/cd) New Corporation/Refiner Date of Sale
Table 12. Refinery Sales During 2015
CHS Inc./CHS McPherson Refinery Inc.CHS Inc./NCRA 9/15
McPherson, KS 86,000
PBF Energy Co LLC/Chalmette Refining LLCChalmette Refining LLC 11/15
Chalmette, LA 192,500
bbl/cd= Barrels per calendar day
Sources: Energy Information Administration (EIA) Form EIA-810, "Monthly Refinery Report" and Form EIA-820, "Annual Refinery Report."
Energy Information Administration, Refinery Capacity 2016 50

PAD District / Refinery Location
Total Atmospheric
Distillation
Capacity (bbl/cd)
Crude Oil Total Downstream
Charge Capacity
(bbl/sd)
Date of Last
Operation
Date
Shutdown
Table 13. Refineries Permanently Shutdown By PAD District Between January 1, 1990 and January 1, 2016
PAD District I 570,450
Primary Energy Corp Richmond, VA 6,100 0 a
GNC Energy Corp Greensboro, NC 3,000 0 a
Saint Mary's Refining Co Saint Mary's, WV 4,000 4,480 02/93 03/93
Cibro Refining Albany, NY 41,850 27,000 07/93 09/93
Calumet Lubricants Co LP Rouseville, PA 12,800 26,820 03/00 06/00
Young Refining Corp. Douglasville, GA 5,400 0 07/04 07/04
Sunoco Inc Westville, NJ 145,000 263,000 11/09 02/10
Western Refining Yorktown
Inc
Yorktown, VA 66,300 182,600 09/11 12/11
Sunoco Inc Marcus Hook, PA 178,000 278,000 12/11 12/11
Chevron USA Inc Perth Amboy, NJ 80,000 47,000 03/08 07/12
Hess Corporation Port Reading, NJ 0 115,000 02/13 03/13
Axeon Specialty Products
LLC
Savannah, GA 28,000 0 09/12 12/14
PAD District II 472,315
Coastal Refining & Mktg El Dorado, KS 0 20,000 b
Intercoastal Energy Svcs
Corp
Troy, IN 1,250 2,250 11/90 03/91
Farmland Industries Philipsburg, KS 26,400 22,800 12/91 07/92
Coastal Refining & Mktg Wichita, KS 28,800 41,300 05/93 06/93
Coastal Refining & Mktg Augusta, KS 0 21,000 06/93 06/93
Crystal Refining Carson City, MI 3,000 0 10/92 09/93
Marathon Indianapolis, IN 50,000 68,000 09/93 10/93
Indian Refining Lawrenceville, IL 80,750 103,000 09/95 10/95
Cyril Petrochemical Corp Cyril, OK 7,500 0 09/95 12/95
Laketon Refining Laketon, IN 11,100 0 06/95 01/96
Total Petroleum, Inc. Arkansas City, KS 56,000 74,840 08/96 09/96
TPI Petro Inc. Alma, MI 51,000 63,300 11/99 12/99
Premcor Refining Group Blue Island, IL 80,515 124,500 01/01 04/01
Premcor Refining Group Hartford, IL 64,000 116,700 09/02 10/02
Ventura Refining &
Transmission LLC
Thomas, OK 12,000 0 10/10 11/14
Energy Information Administration, Refinery Capacity 201651

PAD District / Refinery Location
Total Atmospheric
Distillation
Capacity (bbl/cd)
Crude Oil Total Downstream
Charge Capacity
(bbl/sd)
Date of Last
Operation
Date
Shutdown
Table 13. Refineries Permanently Shutdown By PAD District Between January 1, 1990 and January 1, 2016
PAD District III 299,480
Imron Refining, Inc. San Leon, TX 7,000 0 c 08/90
Eagle Refining Jackson, TX 1,800 1,800 01/90 10/90
Vulcan Refining Cordova, AL 9,500 5,000 09/90 12/90
Sabine Resources Stonewall, LA 12,000 0 c 02/92
Rattlesnake Refining Wickett, TX 8,000 10,400 02/92 03/92
Longview Refining Assoc Longview, TX 13,300 13,800 08/92 09/92
Thriftway Co Bloomfield, NM 4,000 3,250 01/92 10/92
El Paso Refining El Paso, TX 50,000 76,000 10/92 12/92
Dubach Gas Dubach, LA 8,500 3,000 12/93 12/93
Amerada Hess Purvis, MS 30,000 50,500 01/94 02/94
Barrett Refg Corp Vicksburg, MS 8,000 0 06/95 01/96
Arcadia Refining & Mktg Lisbon, LA 7,350 6,700 01/96 02/96
Canal Refg Co. Chuch Point, LA 9,500 2,100 07/95 09/97
Gold Line Refining LTD Jennings, LA 12,000 0 07/97 01/98
Petrolite Corp Kilgore, TX 600 750 12/97 02/98
Pride Refining Inc. Abilene, TX 42,750 40,500 05/98 04/98
Shell Oil Co Odessa, TX 28,300 33,500 10/98 11/98
Berry Petroleum Co. Stephens, AR 6,700 3,700 07/99 02/00
Dow Haltermann Products Channelview, TX 880 0 09/04 12/05
Hunt Southland Refining Co Lumberton, MS 5,800 0 03/05 12/06
Gulf Atlantic Operations
LLC
Mobile, AL 16,700 15,400 03/06 09/07
Western Refining
Southwest Inc
Bloomfield, NM 16,800 19,500 12/09 11/12
Trigeant LTD Corpus Christi, TX 0 29,000 12/13 12/14
Pelican Refining Company
LLC
Lake Charles, LA 0 12,000 12/14 01/15
PAD District IV 58,000
Amoco Oil Co. Casper, WY 40,000 44,900 12/91 12/91
Landmark Refining Fruita, CO 10,000 25,900 01/92 11/93
Pennzoil Producing Co. Roosevelt, UT 8,000 12,900 09/94 10/94
Energy Information Administration, Refinery Capacity 2016 52

PAD District / Refinery Location
Total Atmospheric
Distillation
Capacity (bbl/cd)
Crude Oil Total Downstream
Charge Capacity
(bbl/sd)
Date of Last
Operation
Date
Shutdown
Table 13. Refineries Permanently Shutdown By PAD District Between January 1, 1990 and January 1, 2016
PAD District V 410,360
Gibson Oil & Refining Bakersfield, CA 9,600 0 07/87 12/90
Chevron USA Inc Kenai, AK 22,000 0 06/91 07/91
Anchor Refining Co. McKittrick, CA 10,000 6,000 06/91 08/91
Golden West Santa Fe Springs, CA 47,000 94,300 02/92 03/92
Eco Asphalt Inc. Long Beach, CA 10,550 7,000 c 10/92
Fletcher Oil & Refining Carson, CA 29,675 48,100 09/92 10/92
Sunbelt Refining Coolidge, AZ 10,000 7,000 08/93 09/93
Chemoil Refining Corp Long Beach, CA 18,000 0 02/94 04/94
Powerine Oil Co. Santa Fe Springs, CA 46,500 100,300 06/95 09/95
Sunland Refining Corp. Bakersfield, CA 12,000 2,650 03/95 12/95
Intermountain Refining Co. Fredonia, AZ 3,800 2,000 01/94 05/96
Pacific Refining Co. Hercules, CA 50,000 62,400 07/95 09/97
Sound Refining Inc Tacoma, WA 11,900 6,000 10/98 12/98
Chevron USA Inc. Richmond Beach, WA 0 6,200 05/00 06/00
Foreland Refining Corp. Tonopah, NV 0 3,000 02/01 01/02
Tricor Refining LLC Bakersfield, CA 0 14,400 07/01 01/02
Paramount Petroleum
Corporation
Portland, OR 0 10,000 11/06 12/08
Tenby Inc Oxnard, CA 2,800 0 12/11 12/11
Flint Hills Resources LP North Pole, AK 126,535 5,500 a 06/14
U.S. Total 1,810,605
PAD District VI 704,300
Arochem International Ponce, PR 75,600 37,000 12/91 12/92
Peerless Oil & Chemical Ponce, PR 8,800 45,200 09/94 12/94
Chevron Phillips Chem Guayama, PR 0 93,200 03/01 01/02
Caribbean Petroleum Corp San Juan, PR 42,000 60,500 12/00 01/05
Shell Chem Yabucoa Inc Yabucoa, PR 77,900 91,300 10/08 12/09
Hovensa LLC Kingshill, VI 500,000 1,086,000 02/12 02/12
a. Facility in operation as other than a refinery since it no longer processes crude oil or unfinished oils.
b. Facility maintained asphalt production capacity until September, 2004.
c. Never Operated
bbl/cd=Barrels per calendar day
bbl/sd=Barrels per stream day.
Sources: Energy Information Administration (EIA) Form EIA-810, "Monthly Refinery Report" and Form EIA-820, "Annual Refinery Report."
Energy Information Administration, Refinery Capacity 201653
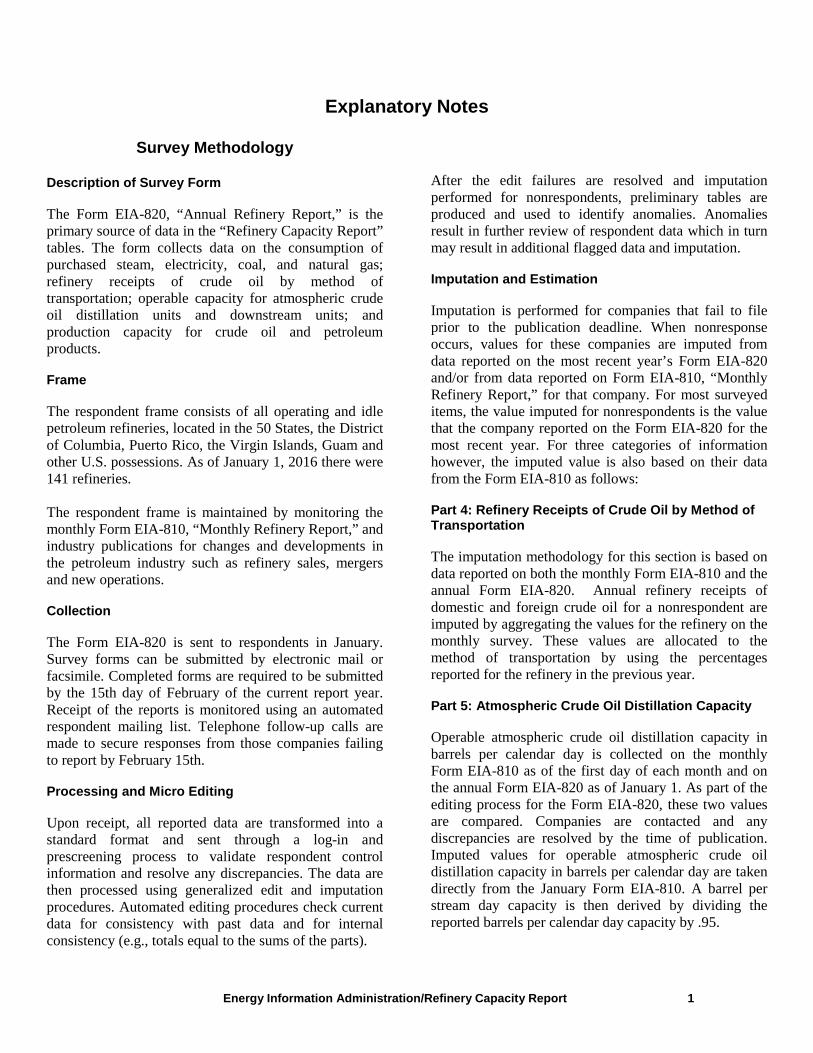
Energy Information Administration/Refinery Capacity Report 1
Explanatory Notes
Survey Methodology Description of Survey Form The Form EIA-820, “Annual Refinery Report,” is the primary source of data in the “Refinery Capacity Report” tables. The form collects data on the consumption of purchased steam, electricity, coal, and natural gas; refinery receipts of crude oil by method of transportation; operable capacity for atmospheric crude oil distillation units and downstream units; and production capacity for crude oil and petroleum products. Frame The respondent frame consists of all operating and idle petroleum refineries, located in the 50 States, the District of Columbia, Puerto Rico, the Virgin Islands, Guam and other U.S. possessions. As of January 1, 2016 there were 141 refineries. The respondent frame is maintained by monitoring the monthly Form EIA-810, “Monthly Refinery Report,” and industry publications for changes and developments in the petroleum industry such as refinery sales, mergers and new operations. Collection The Form EIA-820 is sent to respondents in January. Survey forms can be submitted by electronic mail or facsimile. Completed forms are required to be submitted by the 15th day of February of the current report year. Receipt of the reports is monitored using an automated respondent mailing list. Telephone follow-up calls are made to secure responses from those companies failing to report by February 15th. Processing and Micro Editing Upon receipt, all reported data are transformed into a standard format and sent through a log-in and prescreening process to validate respondent control information and resolve any discrepancies. The data are then processed using generalized edit and imputation procedures. Automated editing procedures check current data for consistency with past data and for internal consistency (e.g., totals equal to the sums of the parts).
After the edit failures are resolved and imputation performed for nonrespondents, preliminary tables are produced and used to identify anomalies. Anomalies result in further review of respondent data which in turn may result in additional flagged data and imputation. Imputation and Estimation Imputation is performed for companies that fail to file prior to the publication deadline. When nonresponse occurs, values for these companies are imputed from data reported on the most recent year’s Form EIA-820 and/or from data reported on Form EIA-810, “Monthly Refinery Report,” for that company. For most surveyed items, the value imputed for nonrespondents is the value that the company reported on the Form EIA-820 for the most recent year. For three categories of information however, the imputed value is also based on their data from the Form EIA-810 as follows: Part 4: Refinery Receipts of Crude Oil by Method of Transportation The imputation methodology for this section is based on data reported on both the monthly Form EIA-810 and the annual Form EIA-820. Annual refinery receipts of domestic and foreign crude oil for a nonrespondent are imputed by aggregating the values for the refinery on the monthly survey. These values are allocated to the method of transportation by using the percentages reported for the refinery in the previous year. Part 5: Atmospheric Crude Oil Distillation Capacity Operable atmospheric crude oil distillation capacity in barrels per calendar day is collected on the monthly Form EIA-810 as of the first day of each month and on the annual Form EIA-820 as of January 1. As part of the editing process for the Form EIA-820, these two values are compared. Companies are contacted and any discrepancies are resolved by the time of publication. Imputed values for operable atmospheric crude oil distillation capacity in barrels per calendar day are taken directly from the January Form EIA-810. A barrel per stream day capacity is then derived by dividing the reported barrels per calendar day capacity by .95.

Energy Information Administration/Refinery Capacity Report 2
Parts 6 and 7: Downstream Charge Capacity and Production Capacity Current year and projected year data for downstream charge capacity and production capacity are taken directly from the previous year’s annual report. Macro Editing A comparison of the data collected on the EIA-820 with other similar data series and industry trade journals is performed each year. Dissemination Prior to 2006, the data collected on Form EIA-820, “Annual Refinery Report,” was published in the Petroleum Supply Annual, Volume 1. Beginning with data for 2006, the Form EIA-820 data are published as a standalone product in the EIA publication “Refinery Capacity Report.” This report contains statistics on consumption of purchased steam, electricity, coal, and natural gas; refinery receipts of crude oil by method of transportation; current and projected capacities for atmospheric crude oil distillation, downstream charge and production capacities. The data are also published in the Annual Energy Review. The “Refinery Capacity Report” can be found at: http://www.eia.gov/petroleum/refinerycapacity/
Additional Sources of Data
The Form EIA-820, “Annual Refinery Report,” is the primary source of data in the “Refinery Capacity Report” tables. In addition, some data collected on the Form EIA-810, “Monthly Refinery Report,” are included.
Quality
Response Rates The response rate for the Form EIA-820 is normally 100 percent. Non-sampling Errors There are two types of errors usually associated with data produced from a survey -sampling errors and nonsampling errors. Because estimates from the Form
EIA-820 survey are based on a complete census of the frame of petroleum refineries, there is no sampling error in the data presented in this report. The data, however, are subject to nonsampling errors. Nonsampling errors are those which can arise from: (1) the inability to obtain data from all companies in the frame or sample (nonresponse) and the method used to account for nonresponses; (2) definitional difficulties and/or improperly worded questions which lead to different interpretations; (3) mistakes in recording or coding the data obtained from respondents; and (4) other errors of collection, response, coverage, and estimation. Quality control procedures are employed in the collection and editing operations to minimize misrepresentation and misreporting. Nonresponse follow-up procedures are employed to reduce the number of nonrespondents, and procedures employed to impute missing data, introduce a minimal amount of error, given the relatively small volume of imputed data. Resubmissions EIA-820 resubmissions are required whenever an error greater than 5 percent of the true value is discovered. In the event of a reporting error, company reports are updated after contact with the company and are followed up by corrected report resubmissions. Revision Policy The “Refinery Capacity Report” reflects EIA’s final data on refinery capacity and will be revised only if, in EIA’s judgment, a revision is expected to substantively affect understanding of the U.S. refinery capacity.
Confidentiality Information on operable atmospheric crude oil distillation capacity, downstream charge capacity, and production capacity reported on Parts 5, 6, and 7 of Form EIA-820 are not considered confidential and are published in the “Refinery Capacity Report.” All other information reported on Form EIA-820 (i.e. Parts 3 and 4 and respondent information) will be protected and not disclosed to the public to the extent that it satisfies the criteria for exemption under the Freedom of Information Act (FOIA), 5 U.S.C. §552, the DOE regulations, 1 0 C.F.R. §1004.11, implementing the FOIA, and the Trade Secrets Act, 18 U.S.C. §1905.

Energy Information Administration/Refinery Capacity Report 3
The Federal Energy Administration Act requires the EIA to provide company-specific data to other Federal agencies when requested for official use. The information reported on this form may also be made available, upon request, to another component of the Department of Energy (DOE); to any Committee of Congress, the General Accountability Office, or other Federal agencies authorized by law to receive such information. A court of competent jurisdiction may obtain this information in response to an order. The information may be used for any nonstatistical purposes such as administrative, regulatory, law enforcement, or adjudicatory purposes. Company specific data are also provided to other DOE offices for the purpose of examining specific petroleum operations in the context of emergency response planning and actual emergencies. Disclosure limitation procedures are not applied to the statistical data published from this survey’s information. Thus, there may be some statistics that are based on data from fewer than three respondents, or that are dominated by data from one or two large respondents. In these cases, it may be possible for a knowledgeable person to estimate the information reported by a specific respondent.
Refinery Capacity History
Refinery capacity data collection was begun in 1918 by the Bureau of Mines, then in the Department of Commerce, and was operated on a voluntary basis until 1980. In 1980, the mandatory Energy Information Administration (EIA) Form EIA-177, “Capacity of Petroleum Refineries,” was implemented. Information on refining capacity was expanded to include not only current year operations, but two-year projections, and refinery input/production data. Working storage capacity data was also added to the form and product categories were added for total coverage. Information on refinery downstream facilities was expanded to include a breakdown of thermal operations and to add vacuum distillation, catalytic hydrorefining and hydrotreating. Production capacity was also added to include information on isomerization, alkylation, aromatics, asphalt/road oil, coking, lubricants and hydrogen. In 1983, the form was revised to improve the consistency and quality of the data collected by the EIA and redesignated as Form EIA-820, “Annual Refinery
Report.” Two sections for data previously reported monthly were added: (1) refinery receipts of crude oil by method of transportation, and (2) fuels consumed for all purposes at refineries. Also, the second year projections on refining capacity were eliminated. As a result of a study conducted by the EIA evaluating motor gasoline data collected by the Federal Highway Administration (FHWA) and by the EIA, motor gasoline blending plants were included for the first time in the respondent frame in order to produce more accurate statistics on the production of motor gasoline. In 1987, the form was revised to reduce respondent burden and to better reflect current refinery operations through updated terminology. Information on projected input/production of refinery processing facilities was deleted. Several categories under catalytic hydrotreating were combined: naphtha and reformer feeds were combined into a single category as well as residual fuel oil and “other.” Thermal cracking types, gas oil and “other” were also combined into a single category. Catalytic reforming types, conventional and bi-metallic were replaced with low and high pressure processing units. Two new categories were added: fuels solvent deasphalting was added to downstream charge capacity and sulfur recovery was added to production capacity. In 1994, the form was revised to enable EIA to calculate utilization rates for certain downstream processing units and to reflect storage capacity of fuels mandated by the Clean Air Act Amendments of 1990. Additions to the form included calendar day downstream charge capacity for fluid and delayed coking, catalytic cracking, and catalytic hydrocracking. Also storage capacity categories for reformulated, oxygenated, and other finished motor gasoline were added, as well as oxygenate storage capacity and separate categories for high and low sulfur distillate fuel oil. In 1995, motor gasoline blending plants were dropped from the survey frame, since by this time, the only section of the form that applied to them was working and shell storage capacity. Also in 1995, a decision was made to no longer collect storage capacity from shutdown refineries; therefore, these refineries were also eliminated from the survey frame. In 1996, the survey was moved to a biennial schedule (every other year) and was renamed “Biennial Refinery Report.” The survey was not conducted for January 1, 1996 or January 1, 1998. Respondents were not required

Energy Information Administration/Refinery Capacity Report 4
to submit data for crude oil and petroleum products consumed at refineries during 1995 and 1997. These data are available from the Form EIA-810, “Monthly Refinery Report.” The requirement to submit data for refinery consumption of natural gas, coal, and purchased steam and electricity on the Form EIA-820 remained. In 2000, the survey was moved to an annual schedule. In 2004, the survey form was amended to reflect the increasing emphasis on the removal of sulfur from transportation fuels. In 2009, natural gas used as feedstock for hydrogen plant production was added to the form. Also, isooctane production capacity was added.
In 2010, the survey form was amended to reflect the increasing use of bio-fuels. Storage capacities of biomass-based diesel fuel, other renewable diesel fuel and other renewable fuels were added to the form. Also, barrels per calendar day capacity of the catalytic reformer was added; previously this was only collected on a stream day basis. In 2011, storage capacity data was removed from the form. Storage capacity is now being collected as of March 31 and September 30 on the Form EIA-810, “Monthly Refinery Report.”