Embed Size (px)
Citation preview
REFERENCES
Abbott, A, M. Claim, D. Dickson and D. Swinbanks 1993, Drug Sponsorship, Nature, 361, February 27, p. 757-68.
Aken, J.E. van 1994, De Bedrijfskunde als Ontwerpwetenschap, Bedrijfskunde, p. 16-26. Albertini, S. and J. Butler 1994, The R&D Networking Process in a Pharmaceutical
Company, The R&D Management Conference, Manchester. Allen, Th.J. 1977, Managing the Flow of Technology: Technology Transfer and the
Dissemination of Technological Information within the R&D Organization, Massachusetts Institute of Technology Press, Cambridge Massachusetts. and R. Katz 1986, The Dual Ladder: Motivational Solution or Managerial Delusion? in R&D Management, 16 (2), p. 18-26. 1989, Managing Engineers and Scientists: Some New Perspectives, in Human Resources Management in International Firms, Evans P., Y. Doz and A. Laurent (eds.), MacMillan Press, London, p. 191-99.
Anderson, P. 1993 Toward Exemplary Research in the Management of Technology. An Introductory Essay, Journ. of Engineering & Technology Management, 10, p. 7-22.
Andrews, F.M. (ed.) 1979, Scientific Productivity. The Effectiveness of Research Groups in Six Countries, Cambridge University Press/UNESCO, Cambridge and Paris.
Angilley, AS. 1973, Returns to Scale in Research in the Ethical Pharmaceutical Industry: Some Further Empirical Evidence, in The Journal of Industrial Economics, 22, p. 81-93.
Anthony, R.N. 1965, Planning and Control Systems. A Framework for Analysis, Harvard University, Boston.
Argyris, C. and D. Schon 1978, Organization Learning: A Theory of Action Perspective, Addison-Wesley, Reading Massachusetts.
Ashby, W.R. 1956, Introduction to Cybernetics, Chapmann and Hall, London. Assen, A van and G.J. Keijsers 1992, Loopbaanontwikkeling en Inzetbaarheid van
'Kenniswerkers', in Gedrag & Organisatie. Tijdschrift voor Sociale, Arbeids- en Organisatiepsychologie, 5 (6), p. 417-27.
Badawy, M.K. 1982 Developing Managerial Skills in Engineers, Van Nostrand Reinold, New York.
__ 1988, Managing Human Resources, in Research Technology Management, 31 (5), p. 19-35.
Bagozzi, R.P. 1980, Causal Models in Marketing, John Wiley & Sons, New York. __ 1984, A Prospectus for Theory Construction in Marketing, Journal of Market
ing, 48, p. 11-29. Ballance, R., Pogany J. and Forstner H. 1992, The World's Pharmaceutical Industries:
an International Perspective on Innovation, Competition and Policy, UNIDO,
236 References
Edward Elgar Pub!', London. Basberg, B. 1987, Patents and the Measurement of Technological Change: a Survey of
the Literature, in Research Policy, 16, p. 131-41. Benders, J., J. de Haan and D. Bennett 1994, Symbiotic Approaches: Work and
Technology, in Management of Technology IV, T.M. Khalil and A. Bayraktar (eds.), Ind. Engineering and Management Press, Norcross, Georgia, p. 1361-67.
Besse, RM. 1973, A Comparison of the University with the Cooperation, in The University as an Organization, J.A. Perkins (ed.), McGraw-Hill, New York.
Betz, F. 1987, Managing Technology: Competing through New Ventures, Innovation and Corporate Research, Prentice-Hall, Englewood Cliffs, New Jersey.
Bie S.E. de, F.L. Leeuw, E.E. Maan (ed.) 1983, Ondenoeksmanagement in de Sociale Wetenschappen, VUGA, 's-Gravenhage.
Biemans, W.G. 1992, Managing Innovation within Networks, Routledge, London, New York.
__ and J. van der Meer-Kooistra 1994, Case Research voor Bedrijfskundig Onderzoek 1 and 2, Bedrijfskunde, p. 51-56 and 95-104.
Birnbaum, R 1988, How Colleges Work The Cybernetics of Academic Organization and Leadership, Jossey-Bass, San Francisco, London.
Blackburn, RS. 1982, Dimensions of Structure: a Review and Reappraisal, Academy of Management Review, 7, p. 59-66.
Boer, H. 1990, Organising for Manufacturing Innovation; The Case of Flexible Manufacturing Systems, PhD thesis University of Twente, Enschede
Bowers, D.J. 1994, The Fragility of R&D Networks in Biomedical Innovation: Problems for Project Management caused by Structural Pressure within Healthcare Systems, The R&D Management Conference, Manchester.
Bresser RK. and RL.M. Dunbar 1986, Context, Structure and Academic Effectiveness, Organization Studies, 7/1, p. 1-25.
Burns, T. and G.M. Stalker 1961, The Management of Innovation, Tavistock, London. Campbell, D.T. and D.W. Fiske, 1959, Convergent and Discriminant Validation by the
Multitrait-Multimethod Matrix, in Psychological Bulletin, p. 81-105. Capron H. 1994, Technological Competition and Strategy of Firms inside the Triad, in
Management of Technology IV, T.M. Khalil and A. Bayraktar (eds.), Industrial Engineering and Management Press, Norcross, Georgia, p. 467-77.
Centre for Medicines Research 1993, Annual Report 1992-1993, CMR, Carshalton. Chatterji, D. 1993, Emerging Challenges for R&D Executives. An American perspec
tive, R&D Management, 23 (3), p. 239-47. Centraal Bureau voor de Statistiek (CBS) 1985, De Tijdsbesteding van het Weten
schappelijk Personeel van Universiteiten en Hogescholen en Academische Ziekenhuizen, Staatsuitgeverij 's-Gravenhage.
Charney, C. 1991, Time to Market. Reducing Product Lead Time, Society of Manufacturing Engineers, Michigan.
Child, J. 1974, 1975 Managerial and Organizational Factors Associated with Company Performance-Part 1/11. A Contingency Analysis, Journal of Management Studies,
References 237
11, p. 175-189, 12, p. 12-27. and P. Bate 1987, Organization of Innovation. East-West Perspectives, Walter de Gruyter, Berlin, New York.
Clark, K.B. and T. Fujimoto 1991, Product Development Peiformance. Strategy, Organization and Management in the World Auto Industry, Harvard Business School Press, Boston, Massachusetts.
Cohen, M.D. and J.G. March 1974, Leadership and Ambiguity: the American College President. McGraw-Hill, New York.
Cole, J.R and S. Cole 1973, Social Stratification in Science, Chicago University Press, Chicago.
Corstjens, 1991, Marketing Strategy in the Pharmaceutical Industry, Chapman and Hall. Cronbach, L.J. 1970, Essentials of Psychological Testing, Harper & Row, New York,
Evanston, London. Dalton, G.W., P.H. Thompson and RL. Price 1982, The Four Stages of Professional
Careers, in R Katz (ed.), Career Issues in Human Resources Manpgement, Prentice-Hall, Englewood Cliffs, New Jersey.
Daft, RL. 1992, Organization Theory and Design, 4th ed., West Publishing Company, Saint Pau!.
Dean B. v. (ed.) 1963, Operations research in Research and Development, John Wiley and Sons Inc., New York, London.
Deming, W.E. 1982, Quality, Productivity and Competitive Position, Massachusetts Institute of Technology Press, Cambridge Massachusetts.
DiMasi, J.A., Hansen, RW., Grabowski, H.G., Lasagna, L. 1991, Cost of Innovation in Pharmaceutical Industry, fournal of Health Economics, 10, p. 107-142.
Dits, H. 1988, Turn to Coal. Mission Orientation of Academic Research, PhD thesis, University of Amsterdam.
Dijk, A. van, J. Frankfort, T. Horn and K. Vos, 1993, Wetenschaps- en Technologiebeleid in Nederland, DSWO Press, Leiden.
Donaldson G. and J.W. Lorsch 1983, Decision Making at the Top, the Shaping of Strategic Direction, Basic Books Inc., New York.
Donnellon, A. 1993, Crossfunctional Teams in Product Development, in fournal of Product Innovation Management, 10, p. 377-92.
Duncan Reekie, W. and M.H. Weber 1979, Profits, Politics and Drugs. Macmillan Press, London and Basingstoke.
Easterbrook, P.J., J.A. Berlin, R Gopalan, D.R Matthews 1991, Publication Bias in Clinical Research, in The Lancet, 337, p. 867-72.
Elfferich, P. 1992, Organisatievormen van Research and Development als Managementvraagstuk, PhD thesis Erasmus University Rotterdam, Eburon, Delft.
Emery, F.E. (ed.) 1972, Systems Thinking. Selected Readings, Penguin Books Ltd., Harmondsworth, Middlesex.
Engelen, J.M.L. van 1989, De Afstemming van Informatiesystemen op Marketingstrategieen, PhD thesis University of Twente, Keikes Pub!', Diepenheim.
__ 1991, The Role of Information Systems in Marketing Success, in Business
238 References
Strategy and Information Technology. E. Sutherland, and Y. Morieux (eds.), Routledge, London, New York, p. 72-85. and AH. van der Zwaan 1994, Bedrijfskundige Methodologie 2, Een Technisch-Methodologische Context, Bedrijfskunde, p. 85-94.
Etzioni, A 1961, A Comparative Analysis of Complex Organizations, Free Press, New York. 1964, Modem Organizations, Prentice-Hall, Englewood Cliffs, New Jersey.
Evan, W.M. (ed.) 1971, Organizational Experiments. Laboratory and Field Research, Harper and Row, Publ., New York, Evanston, London.
Feenstra L. and RO. Fock (eds.) 1987, De Creatieve Factor, Opstellen over Creativiteit, Boom Meppel, Amsterdam.
Fisscher, O.AM. 1986, Onderzoek in drie Research Instellingen naar de Sturing en Motivatie in Samenhang met de Gerichtheid van het Researchwerk, PhD thesis, Erven van der Kamp BV, Groningen. 1991, De rol van R&D, Handboek voor Management en Technologie, Kluwer Bedrijfswetenschappen, Deventer.
Fitzgerald, J.D. 1992, Technology Transfer Issues in Licensing Pharmaceutical Products, in R&D Management, 22 (3), p. 199-208.
Franklin, M.N. 1988, The Community of Science in Europe. Preconditions for Research Effectiveness in European Community Countries, University of StrathcIyde, Gower/EC Aldershot.
Freeman, e. 1982, The Economics of Industrial Innovation, Pinter, London. Gadourek, 1. 1976, Sociologische Onderzoekstechnieken, V. Loghum Slaterus, Deventer. Galbraith, J. 1973, Designing Complex Organizations, Addison-Wesley, Reading Mas-
sachusetts. Gambardella, A 1992, Competitive Advantages from in-house Scientific Research. The
US Pharmaceutical Industry in the 1980s, in Research Policy, 21, p. 391-407. Garfield, E. 1979, Citation Indexing. Its Theory and Application in Science, Technology,
and Humanities, John Wiley and Sons Inc., New York, London. Gerwin, D. 1981, Relations between Structure and Technology, in Handbook of
Organizational Design Vol. 2, P.e. Nystrom and W.H. Starbuck (eds.), Oxford University Press, Oxford.
Gilley, J.W., K.A Fulmer and S.J. Reithlingshoefer 1986, Searching for Academic Excellence. Twenty Colleges and Universities on the Move and their Leaders, Collier Macmillan, London.
Goodman, P.S., RS. Atkin and F.D. Schoorman 1983 in Organizational Effectiveness: A Comparison of Multiple Models. Cameron K.S. and D.A Whetten (eds.), Orlando: Harcourt Brace Jovanovich.
Gouldner, AW. 1957, Cosmopolitans and Locals: Toward an Analysis of Latent Social Roles, Administrative Science Quarterly, 2, p. 281-307.
Grabowski, H.G. and Vernon, J.M. 1987, Pioneers, Imitators, and Generics, in Quarterly Journal of Economics, 102 (3), p. 491-525.
Graves, P.E., J.R Marchand, and R Thompson 1982, Economics' Departmental
References 239
Rankings: Research Incentives, Constraints, and Efficiency, in American Economic Review, 5, p. 1131-41. and N.S. Langowitz 1993, Innovative Productivity and Returns to Scale in the Pharmaceutical Industry, in Strategic Management Journal, 14, p. 593-605.
Groot, A.D. de 1984, The Theory of the Science Forum: Subject and Purpose, Methodology and Science, 4 p. 230-59.
Groot T.L.CM. 1988, Management van Universiteiten. Een Ondenoek naar de Mogelijkheden voor Doelmatig en Doeltreffend Universitair Bestuur, PhD thesis, Wolters Noordhoff, Groningen.
Gross, F. (ed.) 1983, Decision Making in Drug Research, Raven Press, New York. Gunz, H.P. 1980, Dual ladders in Research: A Paradoxical Organizational Fix, in R&D
Management, 10 (3), p. 41-48. Hamel G. and CK. Pralahad 1989, Strategic Intent, in The Best of The Harvard
Business Review, Harvard University, USA, p. 187-200. Hardy, C, A. Langley, H. Mintzberg, and J. Rose 1984, Strategy Formation in the
University Setting, in College and University Organization, J.L. Bess (ed.), New York University Press, New York, London.
Havelock RG. 1975, Planning for Innovation through Dissemination and Utilization of Knowledge, 5th ed., CRUSK, Ann Arbor Michigan.
Hazeu, c.A. 1989, Systeem en Gedrag in het Wetenschappelijk Ondenoek, PhD thesis, VUGA Uitg., 's-Gravenhage. and Spangenberg 1991, University Research Performance: Measurement, Management and Optimization, Beleidsgerichte Studies Hoger Onderwijs en WetenschappeJijk Onderzoek 25, SDU, 's-Gravenhage.
Heeringen A. van, A.N.M. Langendorff 1988, Wetenschaps- en Technologie-indicatoren 1988, Serie Publikaties van de Raad van Advies van het Wetenschapsbeleid 20, RA WB 's-Gravenhage.
Henke, J.W., A.R Krachenberg and T.F. Lyons 1993, Cross-functional Teams. Good Concept, Poor Implementation, in Journal of Innovation Management, 10, p. 216-29.
Hippel, E. von 1988, The Sources of Innovation, Oxford University Press, New York, Oxford.
Hoechst-Roussel 1990, Pharma Forschung. Publikationen des Jahres 1990, Hoechst AG, Frankfurt am Main.
Hofstede, G.H. 1980, Culture's Consequences: International Differences in Work-related Values, Sage, Beverly Hills.
__ 1981, Management Control of Public and Not-for-Profit Activities, in Accounting, Organizations and Society, 3, p. 193-211.
Hoptroff, RG., Bramson, M.J. and Hall, T.J. 1991, Forecasting Economic Turning Points with Neural Nets, in IEEE, 1, p. 347-353.
Hull, D.L. 1988, Science as Process: an Evolutionary Account of the Social and Conceptual Development of Science, University of Chicago Press, Chicago.
Irvine, J. and B.R Martin 1985, Evaluating Big Science: CERN's Past Performance
240 References
and Future Prospects, Scientometrics, 3-6, p. 281-308. 1986, An international Comparison of Government Funding of Academically Related Research, a Study carried out for the Advisory Board for the Research Councils, ABRC Science Policy Studies 2, London.
Janszen, F.H.A 1994, The Technological Innovation Process in the Pharmaceutical Industry, in Management of Technology IV, T.M. Khalil and B.A Bayraktar (eds.), Ind. Engineering and Management Press, Norcross, Georgia, p. 143-53. 1994, R&D Management and the Role of the Primary Process in Research and Development, in Management of Technology IV, T.M. Khalil and B.A Bayraktar (eds.), Ind. Engineering and Management Press, Norcross, Georgia, p. 434-43.
Jain, RK and H.C. Triandis 1990, Management of Research and Development Organizations. Managing the Unmanageable, John Wiley and Sons Inc., New York, London.
Johnes, G. 1988, Determinants of Research Output in Economics Departments in British Universities, in Research Policy, p. 171-78.
Jones, O. 1994, Strategic HRM in the Pharmaceutical Industry: The Employment of R&D Scientists, The R&D Management Conference, Manchester.
Kanter, RM. 1989, The New Managerial Work, in The Best of The Harvard Business Review, Harvard University, USA, p. 13-20.
Katz, D. and RL. Kahn 1978, The Social Psychology of Organizations, (2nd ed.), John Wiley and Sons Inc., New York, London.
Keller, G. 1983, Academic Strategy: the Management Revolution in American Higher Education, John Hopkins University Press, Baltimore.
Kendall, KE. and J.E. Kendall 1988, Systems Analysis and Design, Prentice-Hall, Englewood Cliffs, New Jersey.
Kieser A and H. Kubicek 1977, Organisation, Walter de Gruyter, Berlin, New York. Kistemaker J. 1982, in Management of Science, Relation to Industrial and National
Needs, North-Holland. Kistemaker, J. 1985, Hoe Herkent men een Goed Instituut? in Kwaliteit in de Weten
schap. Een Meetbaar Begrip? H. A Becker and AF.J. van Raan (eds.), DSWO Press, Leiden.
Knorr-Cetina, KD. 1981, The Manufacture of Knowledge. An essay on the Constructivist and Contextual Nature of Science, Pergamon Press, Oxford, New York, Toronto, Sydney, Paris, Frankfurt.
Koenig, M.E.D. 1983, A Bibliometric Analysis of Pharmaceutical Research, in Research Policy, 12 p. 15-36.
Kramer, N.J.T.A and J. de Smit 1982, Systeemdenken: Inleiding tot de Begrippen en Concepten, Stenfert Kroese, Leiden.
Krauch, H. 1970, Die organisierte Forschung, Hermann Luchterhand Verlag GmbH, Neuwied am Rhein und Berlin.
Krishnan, V., S.D. Eppinger and D.E. Whitney 1994, Overlapping Product Development Activities by Modelling Information Exchange, Massachusetts Institute of
References 241
Technology, Cambridge, Massachusetts. Kruger, D. 1994, Time-based Incentives in R&D. An Empirical Survey in the German
Pharmaceutical Industry, The R&D Management Conference, Manchester. Kruijff, M.L de 1993, Twee Plannen in de Gezondheidszorg. Gereguleerde Competitie van
Geneesmiddelen, Workshop Farmacie: Innovatie, Concurrentie en Regulering, Rotterdam.
Kuhn, Th.S. 1970 The Structure of Scientific Revolutions, 2nd ext. ed., University of Chicago Press, Chicago.
Latour, B. and Woolgar, S. 1979, Laboratory Life. The Social Construction of Scientific Facts, Sage Publications, Beverley Hills, London.
__ 1987, Science in Action. How to Follow Scientists and Engineers through Society, Open University Press, Milton Keynes.
Lawrence P.R. and J.W. Lorsch 1967, Organization and Environment: Managing Differentiation and Integration, Harvard University, Boston.
Leeuw, AC.J. de 1979, The Control Paradigm is an Aid for Understanding and Designing Organizations, Progr. in Cyb. and Syst. Res., 5, p. 93-100. 1984, De Wet van de Bestuurlijke Drukte, van Gorcum, Assen/Maastricht. 1990, Organisaties: Management, Analyse, On twerp en Verandering, een Systeemvisie, 4th ed., Van Gorcum, Assen.
Leufkens, H.G.M., F.M. Haaijer-Ruskamp and A Bakker 1993, De Toekomst van het Geneesmiddel in de Gezondheidszorg. Een Scenario-analyse, Bohn Stafleu Van Loghum, Houten, Zaventem.
Leupold A, P. Weingart, M. Winterhager 1982, Wissenschaftsindikatoren und quantitative Wissenschaftsforschung. Eine annotierte Bibliographie, B.K. Verlag GmbH, Bielefeld.
Lewin, K. 1958, Group Decision and Social Change, in Readings in Social Psychology, Maccoby, J.E., T.W. Newcomb and E. Hartley (eds.), Holt, Rinehart and Winston, New York.
Lidstone J. and T. Collier 1987, Marketing Planning for the Pharmaceutical Industry, Gower.
Lorsch J.W. and J.J. Morse 1974, Organizations and their Members: a Contingency Approach, Harper and Row, New York, Evanston, San Francisco, London.
__ (eds.) 1987, Handbook of Organizational Behaviour, Prentice-Hall, Englewood Cliffs, New Jersey.
Lunsford, T.F. 1970, Authority and Ideology in the Administered University, in The State of the University: Authority and Change, C.E. Kruytbosch and S.L. Messinger (eds.), Sage, Beverly Hills, California.
Lynn, M. 1991, The Billion-Dollar Battle. Merck v. Glaxo, Heinemann, London. Lutz, F.W. 1982, Tightening Up Loose Coupling in Organizations of Higher Educa
tion, in Administrative Science Quarterly, 27, p. 653-69. MacKenzie, D., Wajcman, J. 1985, The Social Shaping of Technology, Open University
Press, Milton Keynes, Philadelphia. Maddox, J. 1988, Theoreticians Thrive among Dunes, Nature, 336, November 17, p.
242 References
199. Marquardt, M. and A. Reynolds 1994, The Global Learning Organization. Gaining
Competitive Advantage through Continuous Learning. Irwin, Burr Ridge, New York.
Mason, RO. 1979, The Role of Management in Science, Publ Adm. Review, p. 112-16. Maturana, H.R and F.J. Varela 1984, The Tree of Knowledge: The Biological Roots of
Human Understanding, Shambale, Boston. Mayntz, R 1985, Forschungsmanagement: Steuerungsversuche zwischen Scylla und
Charybdis; Problem der Organisation und Leitung von Hochschulfreien offentlich financierten Forschungsinstituten Westdeutscher Verlag, Opladen.
Mellink M. 1986, Beheersing door Spanningsverdeling, Schets van een Economisch Beheersingssysteem voor Onderzoekorganisaties, Ministerie van Onderwijs en Wetenschappen, Voider en Co, Organisatieadviseurs, 's-Gravenhage.
Mendelsohn E., P.Q. Weingart, R Whitley (eds.) 1977, The Social Production of Scientific Knowledge, D. Reidel Pub!. Comp., Dordrecht, Boston.
Merck & Co. 1991, Values and Vision. A Merck Century. Miller, D.B. 1986, Managing Professionals in Research and Development. A Guide for
Improving Productivity and Organizational Effectiveness, Jossey-Bass Publishers, San Francisco.
Ministerie van Economische Zaken 1993, Fannaceutisch Onderzoek in Nederland. Een Strategisch Perspectief, Booz Allen&Hamilton, 's-Gravenhage.
Ministerie van Onderwijs en Wetenschappen (O&W) 1992, Speur- en ontwikkelingswerk in Nederland, Beleid, Financiering en Uitvoering, Sdu Uitgeverij, 's-Gravenhage.
__ 1992, Wetenschapsbudget 1993, Sdu Uitgeverij, 's-Gravenhage. __ 1992, Voortgang Wetenschapsbeleid, Sdu Uitgeverij, 's-Gravenhage. Ministerie van Welzijn, Volksgezondheid en Cultuur 1993, Financieel Overzicht Zorg
1994, Sdu Uitgeverij, 's-Gravenhage. Minne, B. 1992, De Technologische Positie van Nederland, ESB, p. 748-752. Mintzberg, H. 1979, The Structuring of Organizations: a Synthesis of the Research,
Prentice-Hall, Englewood Cliffs, New Jersey. 1983, Power In and Around Organizations, Prentice-Hall, Englewood Cliffs, New Jersey.
Moed H.F. 1989, The Use of Bibliometric Indicators for the Assessment of Research Peifonnance in the Natural and Life Sciences. Aspects of Data Collection, Reliability, Validity and Applicability, PhD thesis, DSWO, Leiden. RE. de Bruin, J. Beerens, J.A. Schoneveld, and I. Vriend 1992, A Bibliometric System for the Assessment of National Research Peifonnance: Database Description and First Application Scientometrics, Research Report to the Netherlands Organization for Scientific Research (NWO), The Hague.
Morgan, RD. and E.W. Garney 1994, The Integration of Suppliers into the Product Development Process, The R&D Management Conference, Manchester.
Narin, F. 1987, Citation Analysis. Bibliometric Techniques in the Evaluation of Research Programs, in Science and Technology Policy, 2, p. 99-106.
References 243
Nederhof, AJ. and AF.J. van Raan 1987, Peer Review and Bibliometric Indicators of Scientific Performance: A Comparison of Cum Laude Doctorates with Ordinary Doctorates in Physics, Scientometrics, 5-6.
Newstrom, J.W., W.E. Reif and RM. Monczka, 1975, A Contingency Approach to Management: Readings, McGraw-Hili, New York.
Omta, S.W.F. and e. Roozendaal 1988, Biotechnologie in COMETT-verband, in Biotechnologie in Nederland, 5 (1), p. 45-48.
Omta, S.W.F., J.M.L. van Engelen and L.M. Bouter 1993, Contingencies related to Research Perfonnance in Academia: a Comparative Study of 40 Biomedical Departments in the Netherlands, Research Report 1993-11, Groningen, 20 p. 1993, Managing Industrial Pharmaceutical Innovation, a Comparative Study, Book of Papers, 9th International Conference of ISPIM, Eindhoven, p. 333-48. 1993, A Comparative Study of Management and Organization of Biomedical and Phannaceutical Research in Universities, Institutes and Companies, in Bedrijfskunde en Technologie, UT Service, Enschede, p. 97-105. 1994, Innovative and Industrial Performance in Pharmaceutical R&D, a Management Control Perspective, in Omega, The International Journal of Management Science, 22 (3), p. 209-19. 1994, Managing Industrial Pharmaceutical R&D. A Comparative Study of Management Control and Innovative Effectiveness in European and AngloAmerican Companies, in R&D Management, 24 (4), p. 303-15. 1994, Managing Industrial Pharmaceutical R&D, The Fourth International Conference on Management of Technology, Miami. 1994, Effectiveness in Industrial Pharmaceutical R&D, the Human Factor, The R&D Management Conference, Manchester.
Omta, S.W.F., 1994, The Effectiveness of Management and Organization of Pharmaceutical R&D. A Comparative Study, in Coursebook - Managing the R&D Process, P.e. de Weerd-Nederhof, I.e. Kerssens-van Drongelen, R Verganti (eds.), Twente Quality Centre, p. 143-52.
Omta, S.W.F., J.M.L. van Engelen and L.M. Bouter 1995, A Management Control Perspective on Industrial Pharmaceutical R&D, in Proceedings of the TwentyEights Annual Hawaii International Conference on System Sciences, Vol. III, J.F. Nunamaker and RH. Sprague (eds.), IEEE Computer Society Press, Los Alamitos, p. 552-62.
Omta, S.W.F., and J.M.L. van Engelen 1995, Research Performance and Effectiveness: a Comparative Study of 57 Biomedical Laboratories in Universities and Institutes, NVAM-congres, Erasmus Universiteit Rotterdam.
Oppenheim AN. 1966, Questionnaire Design and Attitude Measurement, Basic Books, New York.
Organization for Economic Co-operation and Development (OECD) 1980, Het Meten van Wetenschappelijke en Technische Activiteiten. The Frascati Manual, StaatsdrukkerijlUitgeverij, 's-Gravenhage.
Ouchi, W.G. 1980, Markets, Bureaucracies, and Clans, in Administrative Science
244 References
Quarterly p. 120-41. Pavitt, K. 1984, Sectoral Patterns of Technical Change: Towards a Taxonomy and a
Theory, in Research Policy, 13, p. 343-73. 1988, Uses and Abuses of Patent Statistics, in Handbook of Quantitative Studies of Science and Technology, A.F.J. van Raan (ed.), Elsevier Scientific Publishing, Amsterdam.
Paszmann B., 1969, Das Leitungssystem des Forschungs- und Entwicklungsbereiches industrieller Unternehmungen, Inauguraldissertation Universitat zu K61n.
Payne, R 1987, Individual Differences and Performance amongst R&D Personnel. Some Implications for Management Development, in R&D Management, 17 (3), p. 153-61.
Pearce, J.A. and RB. Robinson 1988, Fonnulation and Implementation of Competitive Strategy, Irwin, Homewood, Illinois.
Peitgen, R.O. and P.H. Richter 1986, The Beauty of Fractal: Images of Complex Dynamical Systems, Springer Verlag, Berlin.
Pelz, D. and F.M. Andrews 1976, Scientists in Organizations. Productive Climates for Research and Development, 2end ext. ed., John Wiley and Sons Inc., New York, London and Sydney.
Pennings, J.M. 1975, The Relevance of the Structural-Contingency Model for Organizational Effectiveness, Administrative Science Quarterly 20, p. 393-410.
Pfeffer, J. and Salancik, G.R 1978, The External Control of Organizations, Harper and Row, New York.
Porter, M.E. 1985, Competitive Advantage, Creating and Sustaining Superior Performance, Free Press, New York.
Raad van Advies voor het Wetenschapsbeleid (RA WB) 1983 Advies inzake de Prioriteiten in het Gezondheidsonderzoek, Serie Publikaties van de RA WB nr. 33, Staatsuitgeverij, 's-Gravenhage. 1988 Advies over het Missiepatroon van de Niet-universitaire Onderzoeksinstituten, Serie Publikaties van de RA WB nr. 60, Staatsuitgeverij, 's-Gravenhage.
Raad voor Gezondheidsonderzoek (RGO) 1993, Advies Brede Analyse Gezondheidsonderzoek, Deel 1 , Advies nr. 9, Staatsuitgeverij, 's-Gravenhage. 1994, Advies Brede Analyse Gezondheidsonderzoek, Deel 2, Advies nr. 10, Staatsuitgeverij, 's-Gravenhage.
Raelin, J.A. 1986 The Clash of Cultures: Managers and Professionals, Harvard Business School Press, Boston.
Redwood, H. 1987, The Phannaceutical Industry: Trends, Problems and Achievements, Oldwick press, Felixtowe.
Rigter H. 1986, Evaluation of Performance of Health Research in the Netherlands, in Research Policy, 15, p. 33-48.
Roussel, P.A., Saad, K.A., Erickson, T.J. 1991, Third Generation R&D, Harvard Business School Press, Boston, Massachusetts.
Rudner, R 1966, Philosophy of Social Science, Prentice-Hall, Englewood Cliffs, New Jersey.
References 245
Russo, J.E. and P.J.H.H. Schoemaker 1989, Ten Barriers to Brilliant Decision-making and how to Overcome them, Doubleday/Currency, New York.
Schwartzman, D. 1976, Innovation in the Pharmaceutical Industry, The John Hopkins University Press, Baltimore and London.
Segers J.H.G. 1988, Onderzoeksmanagement, IVA, Tilburg. Senge, P.M. 1990, The Fifth Discipline, Doubleday, New York. Shrieves, R.E. 1978, Market Structure and Innovation: A new Perspective, in The
Journal of Industrial Economics, 26, p. 329-47. Smak, N. 1990, Innoveren: Toedoen of Toeval? MBA-thesis Innovatieadviesgroep TNO
Delft, Vrije Universiteit Amsterdam. Smith, M.e. 1991, Pharmaceutical Marketing Strategy and Cases, The Haworth Press,
Binghamton. Slootman, AW. 1991, Arbeidsbeleving van Universitair Wetenschappelijk Personeel, PhD
thesis CSHOB, University of Twente, Enschede. Snier, H. 1995, Concurrentie & Strategie in de Geneesmiddelensector, PhD thesis
Erasmus University Rotterdam, Eburon, Delft. Soete, L.L.G. 1979, Firm Size and Inventive Activity. The Evidence Reconsidered, in
European Economic Review, 12, p. 319-40. Spangenberg, J.F.A 1989, Economies of Atmosphere. The Joint Impact of Scale, Scope,
and Atmosphere on Scientific Peiformance in Clinical Medicine and Economics, PhD thesis University of Limburg, Van Gorcum, Assen, Maastricht.
Spangenberg, J.F.A, R. Starmans, Y.W. Bally, B. Breemhaar, F.J. Nijhuis and e.AF. van Dorp 1990, Prediction of Scientific Performance in Clinical Medicine, in Research Policy, 19, p. 239-55.
Spiegel-Rosing I., and D. de Solla Price (eds.) 1977, Science, Technology and Society. A Cross-Disciplinary Perspective, Sage publications, London, Beverly Hills.
Spilker, B. 1989, Multinational Drug Companies. Issues in Drug Discovery and Development, Raven Press, New York.
Stamm T. 1981, Zwischen Staat und Selbstverwaltung. Die deutsche Forschung im Wiederaufbau 1945-1965, Verlag Wissenschaft und Politik, K61n.
Stroup, H. 1966, Bureaucracy in Higher Education, Free Press, New York. Taggart, J.H. and Blaxter T.J. 1992, Strategy in Pharmaceutical R&D: a Portfolio Risk
Matrix, in R&D Management, 22(3), p. 241-254. Taggart, J.H. 1993, The World Pharmaceutical Industry, Routledge, London, New York. Taylor, e.W. and F. Barron (ed.) 1963, Scientific Creativity: its Recognition and Develop
ment, John Wiley and Sons Inc., New York, London. Taylor, J.B. 1994, Discovery of New Medicines, in The Textbook of Pharmaceutical
Medicine, 2nd ed., J.P. Griffin, J. O'Grady and F.O. Wells (eds.), Greystone Books Ltd., Antrim, N. Ireland.
Thomas, L. 1979, The Lives of a Cell, (Notes of a Biology Watcher), The Viking Press, New York. 1983, The Youngest Science: Notes of a Medicine-Watcher, The Viking Press, New York.
246 References
Tuininga, E.J. 1990, Social Management in Professional Organizations: Searching for New Impulses, in R&D Management, 20 (2), p. 139-53.
Tushman, M. and Moore, W. (ed.) 1988, Readings in the Management of Innovation, Balling PubL Co., Cambridge.
Twiss, B.C. 1992, Managing Technological Innovation, 4th ext. ed. Pitman PubL, Longman Group, London.
Valle, F. della and A Gambardella 1993, Biological Revolution and Strategies for Innovation in Pharm. Companies, in R&D Management, 23 (4).
Veblen, T. 1957 (1918), The Higher Leaming in America, Sasamore Press, New York. Veld, J. in 't 1988, Analyse van Organisatieproblemen. Een Toepassing van Denken in
Systemen en Processen, 5th ed., Stenfert Kroese, Leiden. Ven A van de and D. Ferry 1980, Measuring and Assessing Organizations, John Wiley
and Sons Inc., New York, London. Volberda, H.W. 1992, Organizational Flexibility. Change and Preservation, PhD thesis
University of Groningen, Wolters Noordhof, Groningen. Vos R 1989, Drugs Looking for Diseases, PhD thesis University of Groningen. Waks, N. 1983, Government-assisting Professional Organizations: Public or Private? in
European Journal of Operational Research, 13, p. 251-55. Webb, E.J., D.T. Campbell, RD. Schwartz and L. Sechrest 1966, Unobtrusive Measures:
Non-Reactive Measures in the Social Sciences, Rand McNally, Chicago. Weggeman M. 1989, Leidinggeven aan Professionals Vereist een Aangepaste Manage
mentstijl, in Holland Harvard Review, 18, p. 7-16. Weick, K.E. 1979, The Social Psychology of Organizing, 2nd ed., Addison-Wesley,
Reading, Massachusetts. 1984, Contradictions in a Community of Scholars: the Cohesion-Accuracy Trade Off, in College and University Organization, J.L. Bess (ed.), New York University Press, New York, London.
Weingart, P. 1970, Die Amerikanische Wissenschaftslobby, Bertelsmann Universiteitsverlag, Dusseldorf.
__ 1976, Wissensproduktion und Soziale Struktur, Suhrkamp verlag, Frankfurt am Main.
Winzum, C. van 1992, Drug Innovation, Europe and Politics: A Vision, First European Congress of Pharmaceutical Sciences, Amsterdam.
Wolf, P. de 1987, The Pharmaceutical Industry: Structure, Intervention and Competitive Strength, in The Structure of European Industry, H.W. de Jong (ed.), Kluwer Academic Publishers, Dordrecht, Boston, London.
Woodward, J. 1965, Industrial Organization: Theory and Practice, Oxford University Press, London.
Yin, RK. 1989, Case Study Research - Design and Methods, Sage Publications, London. Zeldenrust, S. 1989, Ambiguity, Choice and Control in Research, PhD thesis, University
of Amsterdam. Zwaan, AH. van der and J.M.L. van Engelen 1994, Bedrijfskundige Methodologie 1,
Wetenschapstheoretische Context, Bedrijfskunde, p. 27-35.

APPENDIX A
Definitions of the different terms used in ReQuest 1 and 2
Research unit Consists of a number of researchers, supported by technical, analytical and administrative staff under supervision of a research manager, working on one or more specific research projects.
Full-time equivalents (ftes) The extent of the appointment, i.e. a staff member with a full-time job accounts for 1.0 fte, a staff member working half-time for 0.5 fte.
Research manager Directs a research unit, for instance a professor heading an academic research group, or a department leader in an institute or industrial laboratory.
Senior scientific staff Accountable to the research manager, in charge of one or more research or development projects and leading attached junior scientific staff members and the technical, analytical and administrative support staff.
Junior scientific staff Supervised by the senior scientific staff, carry out research projects (for instance PhD students).
Technical, analytical and administrative suppol1 staff Provide technical, analytical and administrative support (e.g. a secretary, a chemical analyst, in as far as they are attached directly to the research unit).
Education Providing and receiving education (specifically PhD students).
Administration and management Administrative functions outside the research unit (for instance preparing and attending Faculty Council meetings and meetings of the Faculty directorate and cooperative meetings) and administrative and managerial activities within the unit.
Acquisition Research supplies acquired through, for instance, funding agencies and industry. Also
248 Appendix A
comprises writing and checking project proposals, consulting with contracting parties and reporting on contract research.
Research project A group of interrelated research activities aimed at obtaining original results, for instance through developing new theories and methods, or new products and processes, or by way of opening unexplored fields of research. Project progress is, in most cases, reported to the higher hierarchical levels within the organization (for instance Faculty Council, directorate) or to funding agencies supporting the project.
Personnel means Includes the scientific and the analytical, technical and administrative support staff of the research unit.
Material means Running costs and replacement and purchasing costs of apparatus.
Funding Basic funding plus external funding (= 100%).
Basic funding The structural funding of the research unit (direct funding at universities; structural and target funding in institutes.
External funding Means received by the research units, not on a structural basis but owing to projects submitted to funding agencies or through contracts with government and industry.
ReQuest 1
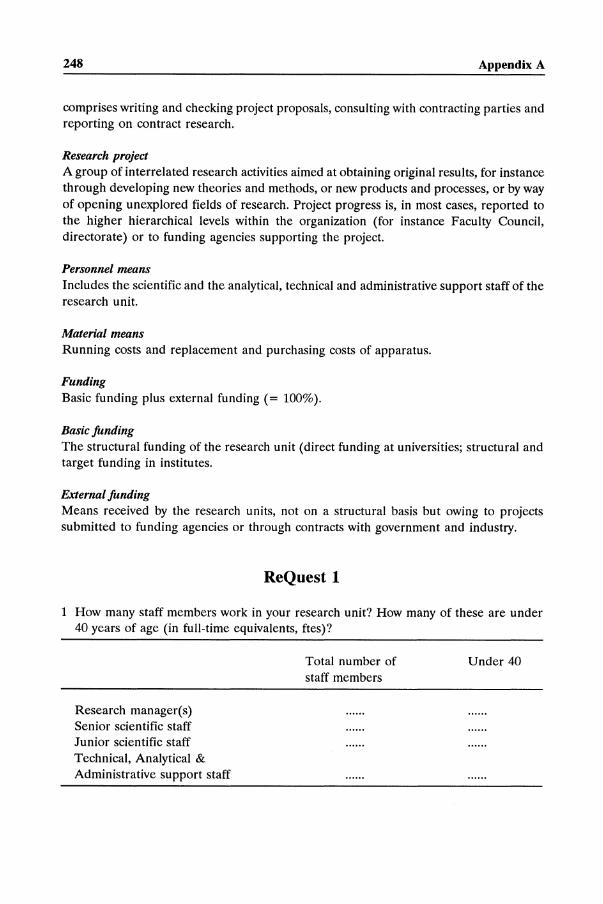
1 How many staff members work in your research unit? How many of these are under 40 years of age (in full-time equivalents, ftes)?
Research manager(s) Senior scientific staff Junior scientific staff Technical, Analytical & Administrative support staff
Total number of staff members
Under 40

Appendix A 249
2 Please indicate below how the working hours of the research unit scientific staff are roughly spent.
Research Senior Junior Manager Sci. Staff Sci. Staff
Research Education Management & Administration Acquisition Clinical practice Other activities,
Total 100% 100% 100%
3 Please indicate below the number of scientific staff members of your research unit involved in the three largest research projects currently in progress?
First (largest) project Second project Third project
...... ftes
...... ftes
...... ftes
4 How many scientific staff members are employed on a permanent basis? ...... ftes
5 How many technical, analytical and administrative support staff members are employed on a permanent basis? ...... ftes
6 How many scientific staff members have obtained a PhD within the past three years? ...... ftes
7 Please indicate below the development of the personnel and material means during the last 10 years.
1980 1985 1990
Personnel means ...... ftes ...... ftes ...... ftes Material means ...... US$ ...... US$ ...... US$ Basic funding ...... % ...... % ...... % External funding ...... % ...... % ...... %
250 Appendix A
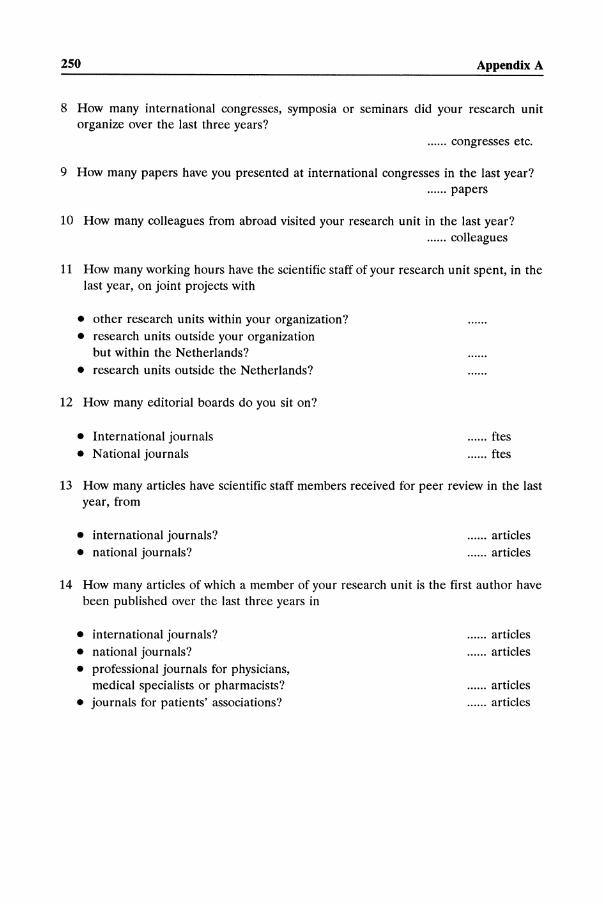
8 How many international congresses, symposia or seminars did your research unit organize over the last three years?
...... congresses etc.
9 How many papers have you presented at international congresses in the last year? ...... papers
10 How many colleagues from abroad visited your research unit in the last year? ...... colleagues
11 How many working hours have the scientific staff of your research unit spent, in the last year, on joint projects with
• other research units within your organization? • research units outside your organization
but within the Netherlands?
• research units outside the Netherlands?
12 How many editorial boards do you sit on?
• International journals • National journals
...... ftes
...... ftes
13 How many articles have scientific staff members received for peer review in the last year, from
• international journals? • national journals?
...... articles
...... articles
14 How many articles of which a member of your research unit is the first author have been published over the last three years in
• international journals? • national journals? • professional journals for physicians,
medical specialists or pharmacists? • journals for patients' associations?
...... articles
...... articles
...... articles
...... articles
Appendix A 251
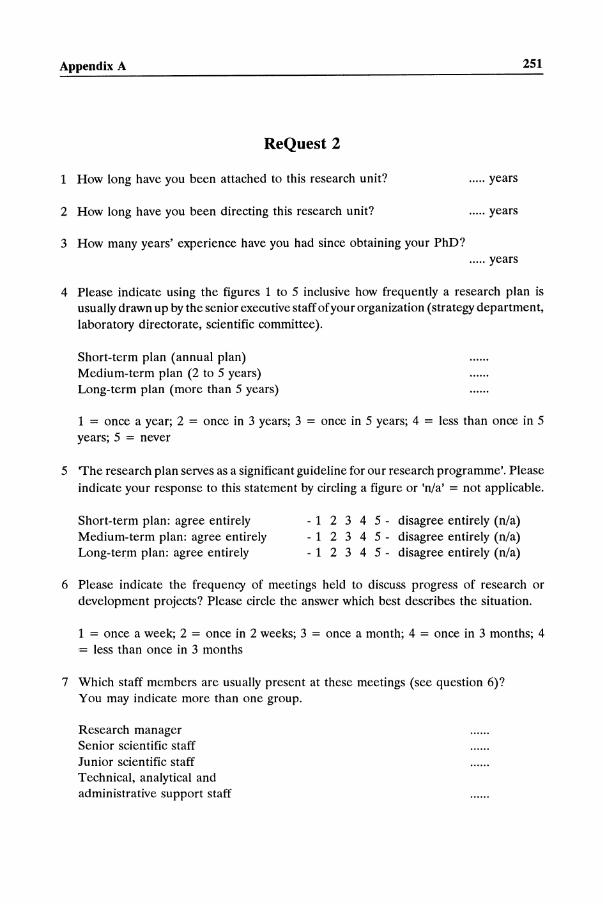
ReQuest 2
1 How long have you been attached to this research unit? ..... years
2 How long have you been directing this research unit? ..... years
3 How many years' experience have you had since obtaining your PhD? ..... years
4 Please indicate using the figures 1 to 5 inclusive how frequently a research plan is usually drawn up by the senior executive staff of your organization (strategy department, laboratory directorate, scientific committee).
Short-term plan (annual plan) Medium-term plan (2 to 5 years) Long-term plan (more than 5 years)
1 == once a year; 2 = once in 3 years; 3 = once in 5 years; 4 = less than once in 5 years; 5 = never
5 'The research plan serves as a significant guideline for our research programme'. Please indicate your response to this statement by circling a figure or 'nla' = not applicable.
Short-term plan: agree entirely Medium-term plan: agree entirely Long-term plan: agree entirely
- 1 2 3 4 5 - disagree entirely (n/a) - 1 2 3 4 5 - disagree entirely (n/a) - 1 2 3 4 5 - disagree entirely (n/a)
6 Please indicate the frequency of meetings held to discuss progress of research or development projects? Please circle the answer which best describes the situation.
1 = once a week; 2 = once in 2 weeks; 3 = once a month; 4 = once in 3 months; 4 .= less than once in 3 months
7 Which staff members are usually present at these meetings (see question 6)? You may indicate more than one group.
Research manager Senior scientific staff Junior scientific staff Technical, analytical and administrative support staff
252
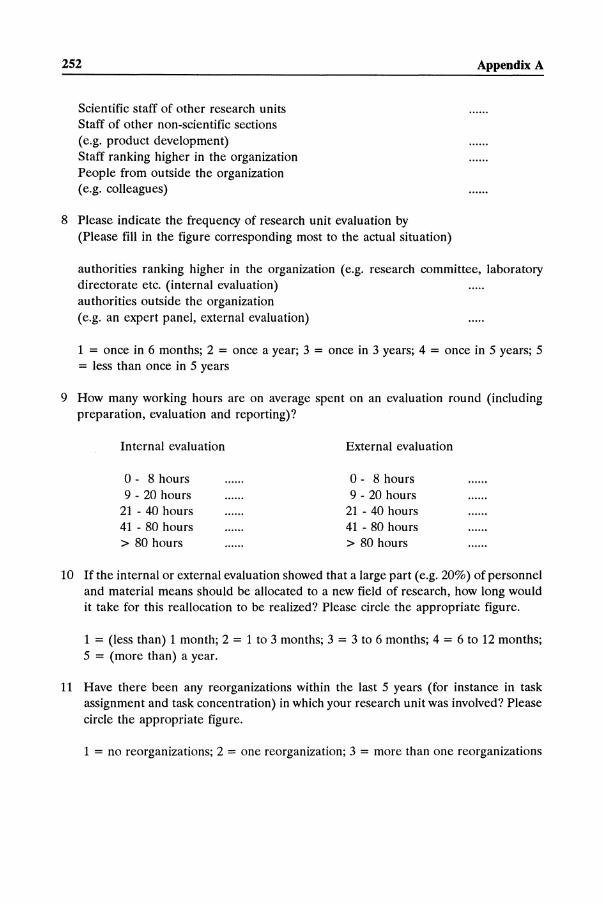
Scientific staff of other research units Staff of other non-scientific sections (e.g. product development) Staff ranking higher in the organization People from outside the organization (e.g. colleagues)
8 Please indicate the frequency of research unit evaluation by (Please fill in the figure corresponding most to the actual situation)
Appendix A
authorities ranking higher in the organization (e.g. research committee, laboratory directorate etc. (internal evaluation) authorities outside the organization (e.g. an expert panel, external evaluation)
1 = once in 6 months; 2 = once a year; 3 = once in 3 years; 4 = once in 5 years; 5 = less than once in 5 years
9 How many working hours are on average spent on an evaluation round (including preparation, evaluation and reporting)?
Internal evaluation
0- 8 hours 9 - 20 hours
21 - 40 hours 41 - 80 hours > 80 hours
External evaluation
0- 8 hours 9 - 20 hours
21 - 40 hours 41 - 80 hours > 80 hours
10 If the internal or external evaluation showed that a large part (e.g. 20%) of personnel and material means should be allocated to a new field of research, how long would it take for this reallocation to be realized? Please circle the appropriate figure.
1 = (less than) 1 month; 2 = 1 to 3 months; 3 = 3 to 6 months; 4 = 6 to 12 months; 5 = (more than) a year.
11 Have there been any reorganizations within the last 5 years (for instance in task assignment and task concentration) in which your research unit was involved? Please circle the appropriate figure.
1 = no reorganizations; 2 = one reorganization; 3 = more than one reorganizations
Appendix A 253
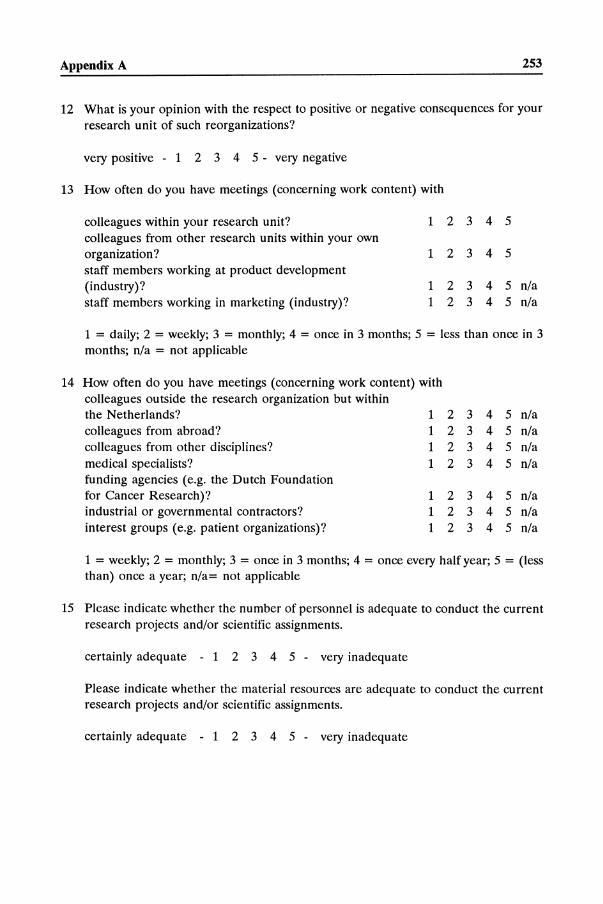
12 What is your opinion with the respect to positive or negative consequences for your research unit of such reorganizations?
very positive - 1 2 3 4 5 - very negative
13 How often do you have meetings (concerning work content) with
14
colleagues within your research unit? 1 2 3 4 5 colleagues from other research units within your own organization? 1 2 3 4 5 staff members working at product development (industry)? 1 2 3 4 5 n/a staff members working in marketing (industry)? 1 2 3 4 5 n/a
1 = daily; 2 = weekly; 3 = monthly; 4 = once in 3 months; 5 = less than once in 3 months; n/a = not applicable
How often do you have meetings (concerning work content) with colleagues outside the research organization but within the Netherlands? 1 2 3 4 5 n/a colleagues from abroad? 1 2 3 4 5 n/a colleagues from other disciplines? 1 2 3 4 5 n/a medical specialists? 1 2 3 4 5 n/a funding agencies (e.g. the Dutch Foundation for Cancer Research)? 1 2 3 4 5 n/a industrial or governmental contractors? 1 2 3 4 5 n/a interest groups (e.g. patient organizations)? 1 2 3 4 5 n/a
1 = weekly; 2 = monthly; 3 = once in 3 months; 4 = once every half year; 5 = (less than) once a year; n/a= not applicable
15 Please indicate whether the number of personnel is adequate to conduct the current research projects and/or scientific assignments.
certainly adequate - 1 2 3 4 5 - very inadequate
Please indicate whether the material resources are adequate to conduct the current research projects and/or scientific assignments.
certainly adequate - 1 2 3 4 5 - very inadequate
254 Appendix A
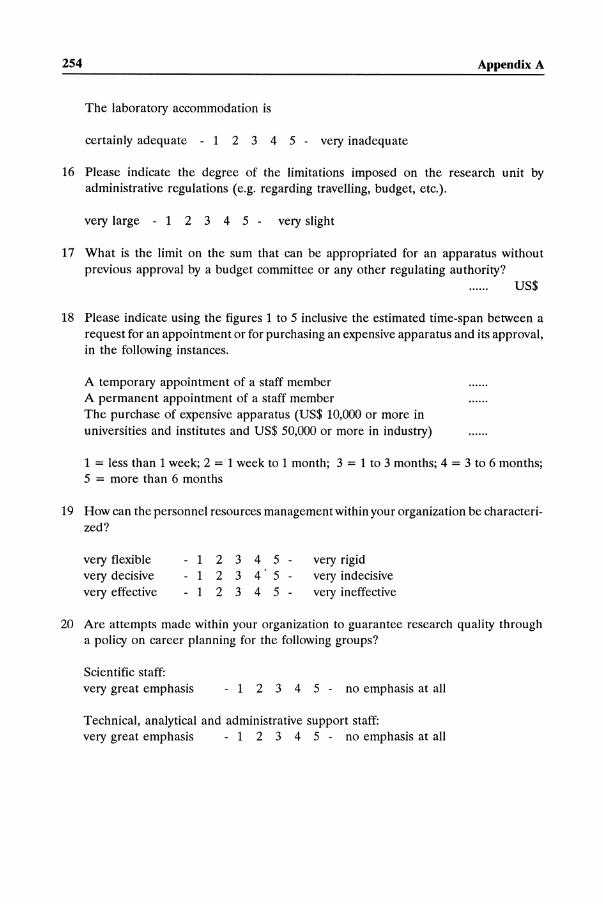
The laboratory accommodation is
certainly adequate - 1 2 3 4 5 - very inadequate
16 Please indicate the degree of the limitations imposed on the research unit by administrative regulations (e.g. regarding travelling, budget, etc.).
very large - 1 2 3 4 5 - very slight
17 What is the limit on the sum that can be appropriated for an apparatus without previous approval by a budget committee or any other regulating authority?
US$
18 Please indicate using the figures 1 to 5 inclusive the estimated time-span between a request for an appointment or for purchasing an expensive apparatus and its approval, in the following instances.
A temporary appointment of a staff member A permanent appointment of a staff member The purchase of expensive apparatus (US$ 10,000 or more in universities and institutes and US$ 50,000 or more in industry)
1 = less than 1 week; 2 = 1 week to 1 month; 3 = 1 to 3 months; 4 = 3 to 6 months; 5 = more than 6 months
19 How can the personnel resources management within your organization be characterized?
very flexible very decisive very effective
-12345-- 1 2 3 45--12345-
very rigid very indecisive very ineffective
20 Are attempts made within your organization to guarantee research quality through a policy on career planning for the following groups?
Scientific staff: very great emphasis - 1 2 3 4 5 - no emphasis at all
Technical, analytical and administrative support staff: very great emphasis - 1 2 3 4 5 - no emphasis at all
Appendix A 255
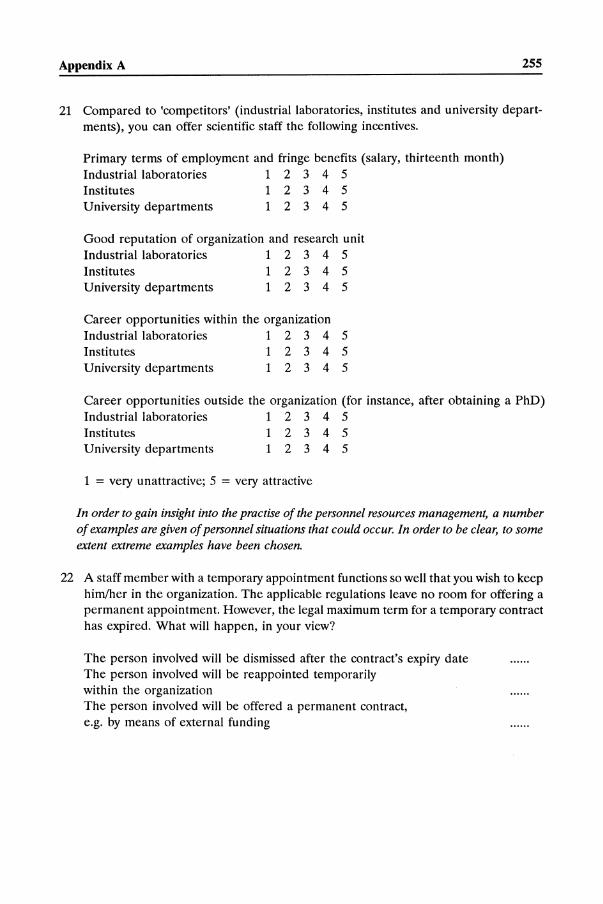
21 Compared to 'competitors' (industrial laboratories, institutes and university departments), you can offer scientific staff the following incentives.
Primary terms of employment and fringe benefits (salary, thirteenth month) Industrial laboratories 1 2 3 4 5 Institutes University departments
12345 12345
Good reputation of organization and research unit Industrial laboratories 1 2 3 4 5 Institutes 1 2 3 4 5 University departments 1 2 3 4 5
Career opportunities within the organization Industrial laboratories 1 2 3 4 5 Institutes 1 2 3 4 5 University departments 1 2 3 4 5
Career opportunities outside the organization (for instance, after obtaining a PhD) Industrial laboratories 1 2 3 4 5 Institutes University departments
1 2 3 4 5 12345
1 = very unattractive; 5 = very attractive
In order to gain insight into the practise of the personnel resources management, a number of examples are given of personnel situations that could occur. In order to be clear, to some extent extreme examples have been chosen.
22 A staff member with a temporary appointment functions so well that you wish to keep him/her in the organization. The applicable regulations leave no room for offering a permanent appointment. However, the legal maximum term for a temporary contract has expired. What will happen, in your view?
The person involved will be dismissed after the contract's expiry date The person involved will be reappointed temporarily within the organization The person involved will be offered a permanent contract, e.g. by means of external funding
256 Appendix A
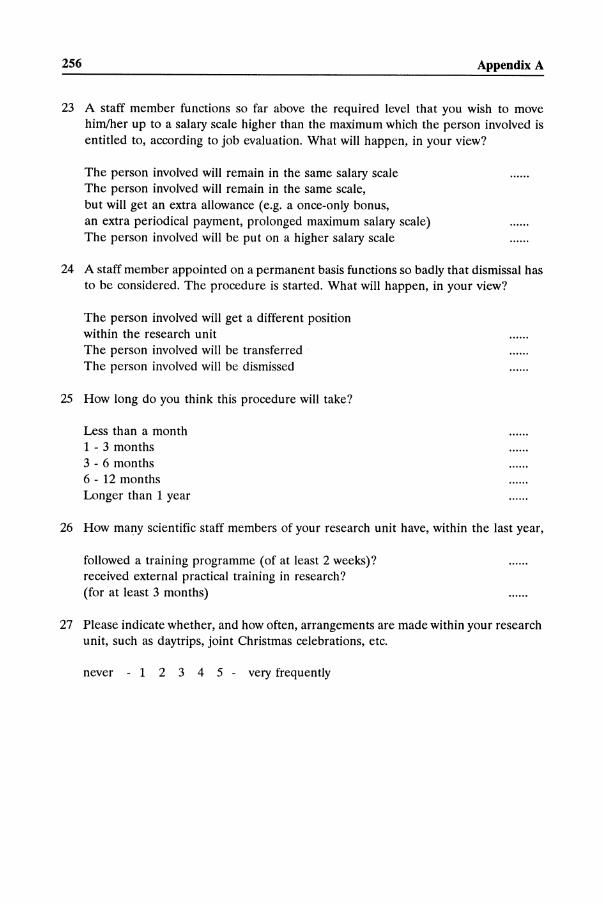
23 A staff member functions so far above the required level that you wish to move him/her up to a salary scale higher than the maximum which the person involved is entitled to, according to job evaluation. What will happen, in your view?
The person involved will remain in the same salary scale The person involved will remain in the same scale, but will get an extra allowance (e.g. a once-only bonus, an extra periodical payment, prolonged maximum salary scale) The person involved will be put on a higher salary scale
24 A staff member appointed on a permanent basis functions so badly that dismissal has to be considered. The procedure is started. What will happen, in your view?
The person involved will get a different position within the research unit The person involved will be transferred The person involved will be dismissed
25 How long do you think this procedure will take?
Less than a month 1 - 3 months 3 - 6 months 6 - 12 months Longer than 1 year
26 How many scientific staff members of your research unit have, within the last year,
followed a training programme (of at least 2 weeks)? received external practical training in research? (for at least 3 months)
27 Please indicate whether, and how often, arrangements are made within your research unit, such as day trips, joint Christmas celebrations, etc.
never - 1 2 3 4 5 - very frequently
APPENDIX B
General questions about R&D management
1. Organization of the R&D process
• What is the input of personal and material means in the different phases of the R&D process (discovery (synthesis and test phase), pharmaceutical development and clinical development phases I to IV)?
• In which countries are the different phases of the R&D process located? • How much time do the separate steps in the R&D process roughly take? Would it
be possible to shorten the time span of the different steps in the R&D process? If so, which measures have to be taken to shorten the different steps of the R&D process?
• How are the research and development laboratories organized (e.g. linear, matrix or project organization). What is the average department and project size and the lateral and multi-functional staff composition of the projects in the different steps of the R&D process? What is the percentage of the scientific staff in the total R&D staff in the different steps of the R&D process?
• Can clear differences be pointed out between research laboratories and laboratories for development (e.g. concerning size and hierarchy)?
• How are the clinical development phases I to IV organized (e.g. quality control of clinical research)?
2. Portfolio planning and evaluation (product-line development)
• Which medical indication areas do your company cover? • Which criteria determine the strategy concerning the initiating or phasing out of
research lines?
• Where in the R&D process are the most important GolNo-Go moments?
3. Innovation
• By which methods are innovation areas localized? • What percentage of the R&D budget is spent on basic research, what percentage
of this budget is spent on cooperative projects with universities and research institutes?
• What is the policy concerning basic research, also with regard to contracting out to universities and/or to institutes, or execution by your own company's laboratories?
258 Appendix B
• What policy is maintained on cooperation with universities and institutes? • Approximately how many compounds have to be analyzed and patented in order to
develop one new product?
4. Human resources
• Is there a dual (or hybrid) ladder system (managerial or scientific)? • How can the primary and secondary working conditions in your company be assessed
in comparison to those in other innovative pharmaceutical companies? • What incentives are being given to scientific staff (both material and immaterial)? • What is the company policy on scientific publishing?
5. Management
• Comparison of the management of your company with that of universities and of institutes (weak and strong points).
• Budget responsibility - at which level in the organization? • How are investments decided upon? • In which phase, in terms of 'corporate' to 'entrepreneurial', would you place your
company?
6. Output
• How many patents obtained through research and development efforts by your industrial laboratory (no licences-in, no me-too licences) have resulted in marketable products over the past 5 years?
• What percentage of the research and development efforts by your company's laboratory was recovered last year on the basis licensing-out to other companies?
• What was last year's operating profit margin (pre-tax on profit to turnover ratio) of your company?
APPENDICES C TO I
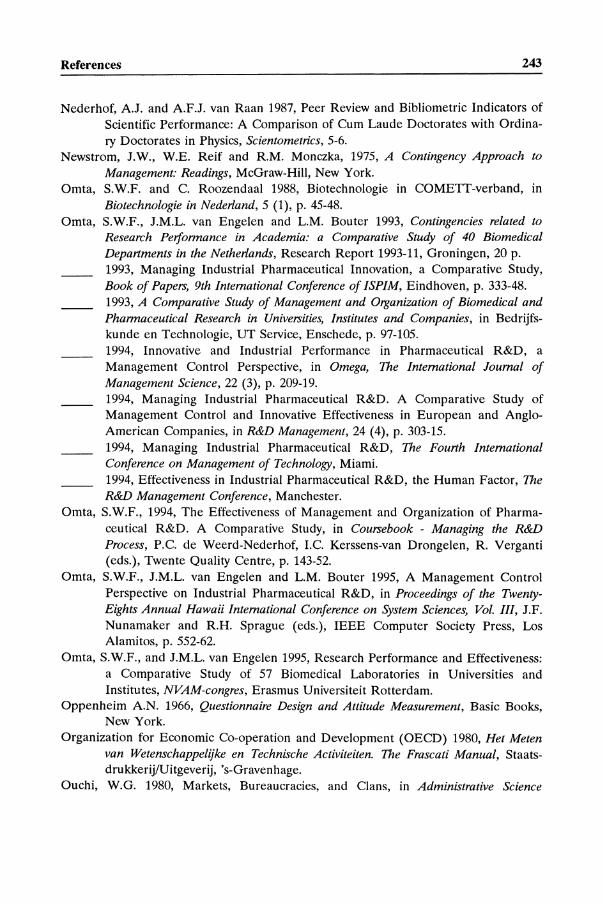
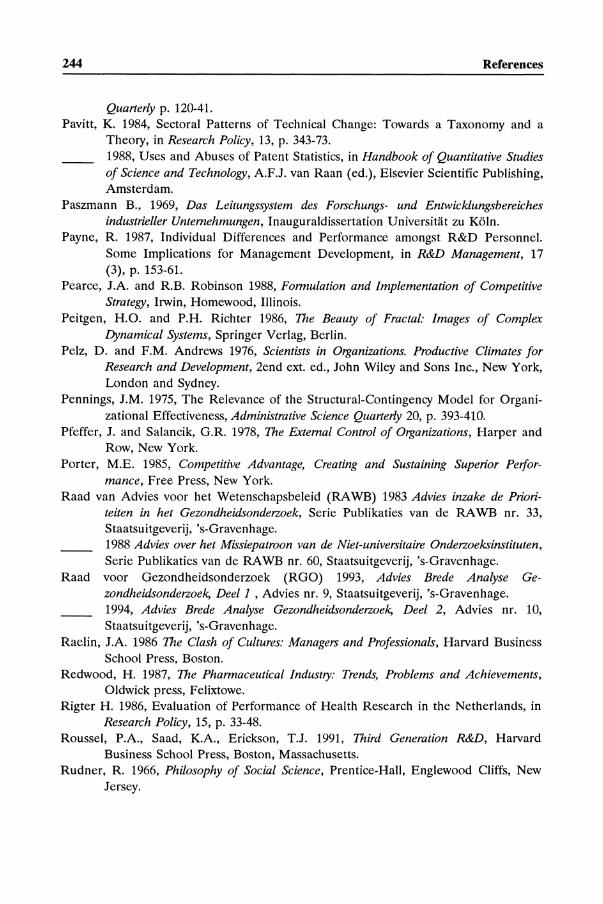
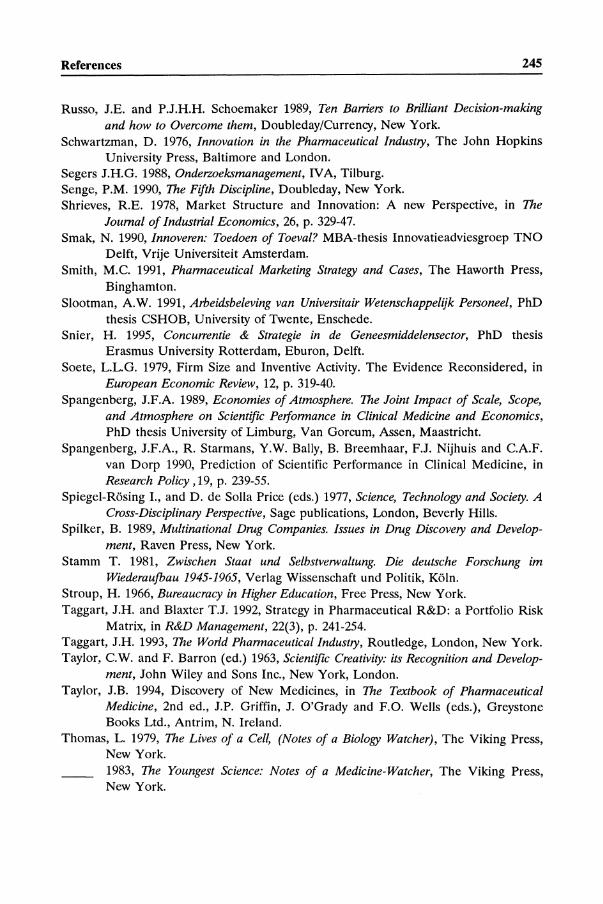
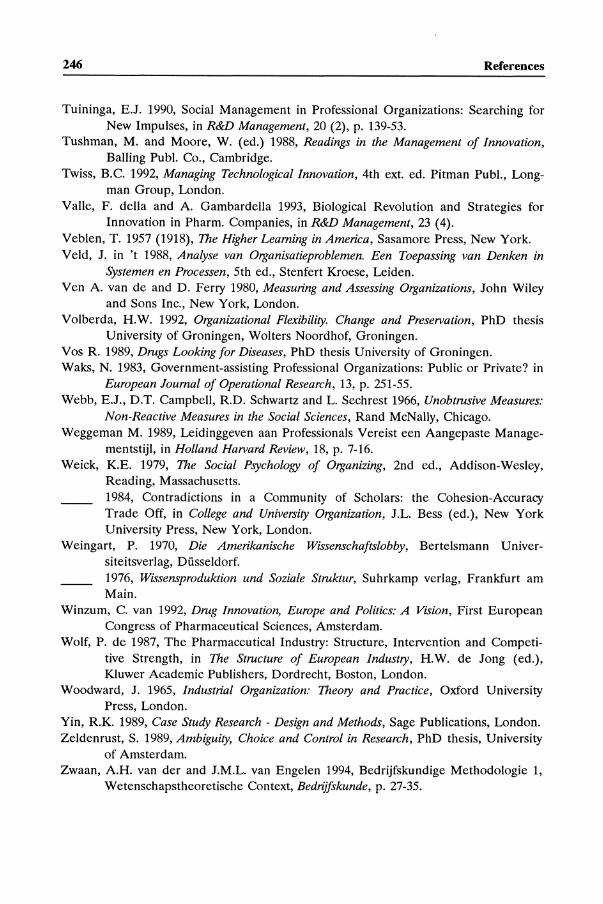
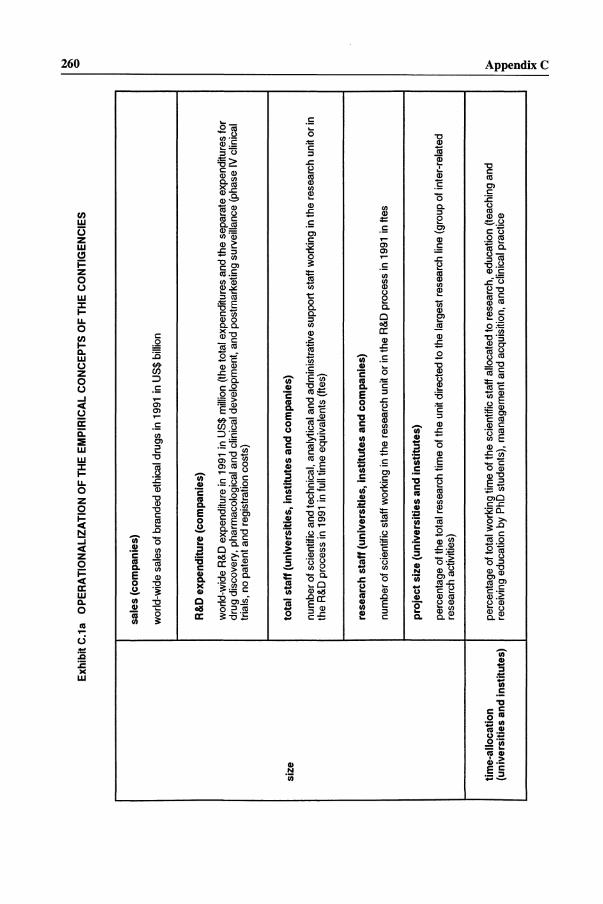
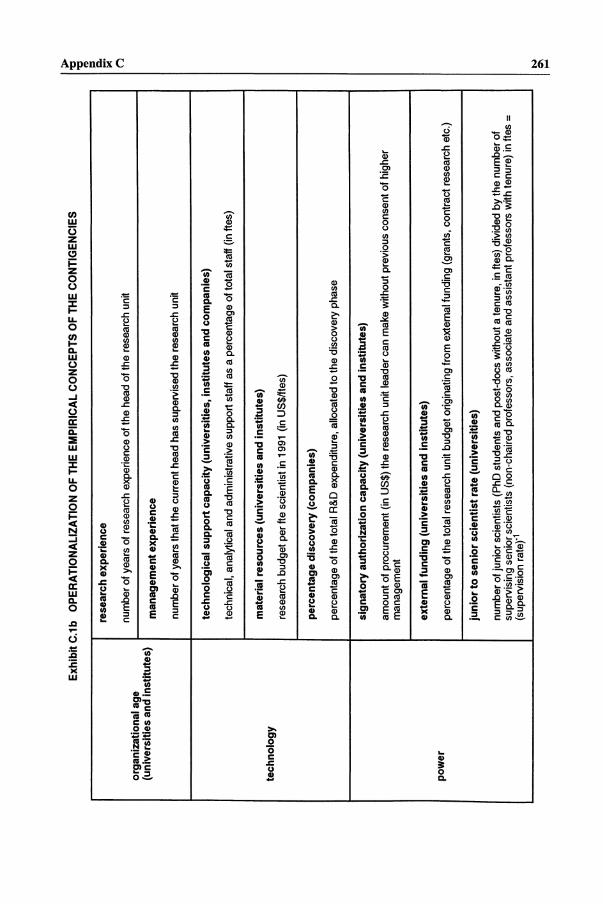
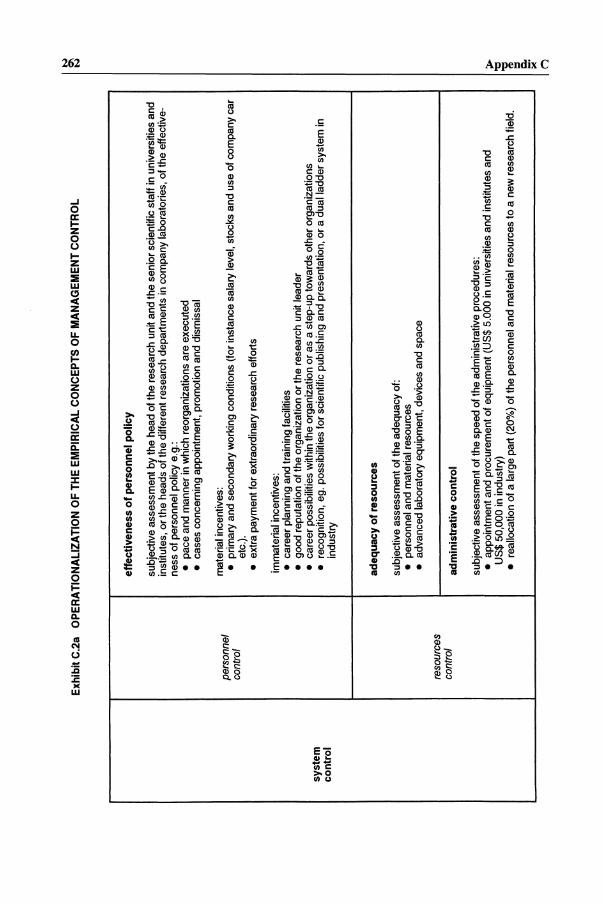
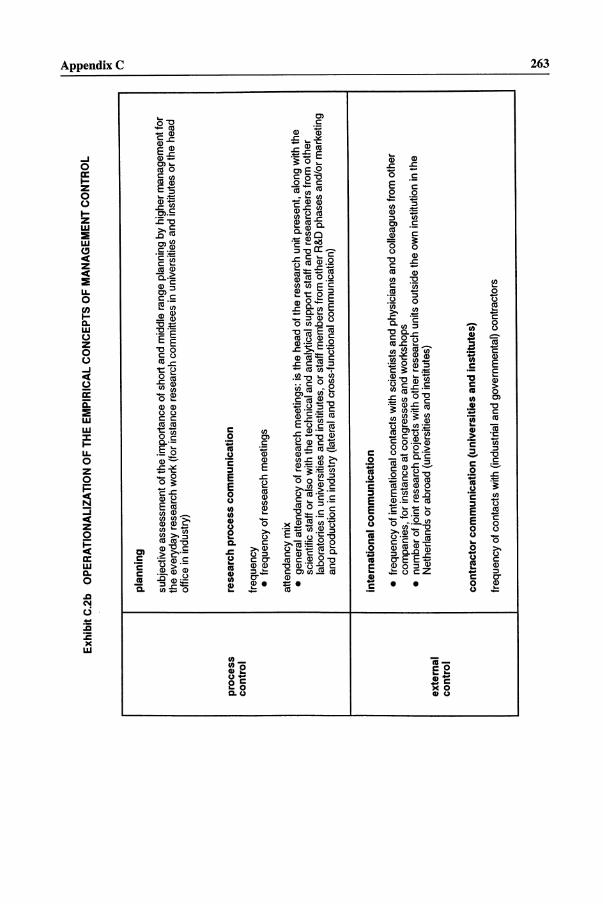
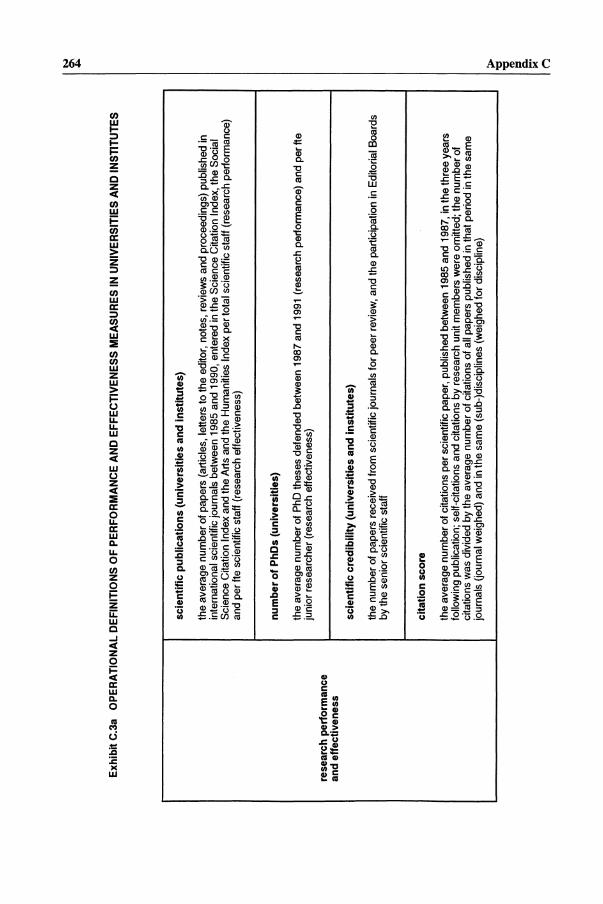
Appendix C The exhibits C.l to C.4 inclusive, show the operationalizations of the contingencies, management control and performance and effectiveness.
Appendix D The exhibits D.1 to D.S inclusive, show the factor structures of the contingencies, management control and performance and effectiveness.
Appendix E
The exhibits E.1 to E.3 inclusive, show the comparisons of preclinical and paraclinical units with clinical units in universities and with the research units in institutes, by use of one-way ANOYA.
Appendix F The exhibits F.1 to F.4 inclusive, show the Spearman rank correlations of the contingencies and management control with performance and effectiveness in preclinical and paraclinical units, and clinical units in universities and the research units in institutes.
Appendix G
The exhibits G.1 to G.3 inclusive, show a qualitative comparison of the different universities and institutes.
Appendix H The exhibits H.1 to H.4 inclusive, show different cross-sections of the industrial study sample, by use of one-way ANOY A.
~
Exh
ibit
C.1
a O
PE
RA
TIO
NA
LIZ
AT
ION
OF
TH
E E
MP
IRIC
AL
CO
NC
EP
TS
O
F T
HE
CO
NT
IGE
NC
IES
o
sale
s (c
ompa
nies
)
wor
ld-w
ide
sale
s of
bra
nded
et
hica
l dr
ugs
in 1
991
in U
S$
billi
on
R&
D e
xpen
ditu
re
(com
pani
es)
I
wor
ld·w
ide
R&
D e
xpen
ditu
re
in 1
991
in U
S$ m
illio
n (t
he t
otal
exp
endi
ture
s an
d th
e se
para
te
expe
ndit
ures
fo
r dr
ug d
isco
very
, ph
arm
acol
ogic
al
and
clin
ical
dev
elop
men
t, an
d po
stm
arke
ting
su
rvei
llan
ce
(pha
se
IV c
lini
cal
tria
ls,
no p
aten
t an
d re
gist
rati
on
cost
s)
size
to
tal
staf
f (u
nive
rsit
ies,
in
stit
ute
s an
d c
ompa
nies
)
num
ber
of s
cien
tifi
c an
d te
chni
cal,
anal
ytic
al
and
adm
inis
trat
ive
supp
ort
staf
f w
orki
ng i
n th
e re
sear
ch
unit
or
in
the
R&
D p
roce
ss
in 1
991
in f
ull t
ime
equi
vale
nts
(fte
s)
rese
arch
st
aff
(uni
vers
itie
s,
inst
itu
tes
and
com
pani
es)
num
ber
of s
cien
tifi
c st
aff
wor
king
in
the
rese
arch
un
it o
r in
the
R&
D p
roce
ss
in 1
991
in f
tes
i
pro
ject
siz
e (u
niv
ersi
ties
an
d i
nst
itu
tes)
perc
enta
ge
of t
he t
otal
res
earc
h ti
me
of th
e un
it d
irec
ted
to t
he l
arge
st
rese
arch
li
ne (
grou
p of
int
er-r
elat
ed
rese
arch
ac
tivi
ties
)
tim
e-al
loca
tion
pe
rcen
tage
of
tot
al w
orki
ng t
ime
of t
he s
cien
tifi
c st
aff
allo
cate
d to
res
earc
h,
educ
atio
n (t
each
ing
and
(uni
vers
itie
s an
d in
stit
utes
) re
ceiv
ing
educ
atio
n by
PhD
stu
dent
s),
man
agem
ent
and
acqu
isit
ion,
an
d cl
inic
al p
ract
ice
>
:g ~ S<i. n
Exh
ibit
C.1
b O
PER
AT
ION
AL
IZA
TIO
N O
F TH
E E
MPI
RIC
AL
CO
NC
EPTS
O
F TH
E C
ON
TIG
ENC
IES
rese
arch
ex
peri
ence
orga
niza
tion
al
age
num
ber
of y
ears
of
res
earc
h ex
peri
ence
of
the
hea
d of
the
rese
arch
un
it
(uni
vers
itie
s an
d in
stit
utes
) m
anag
emen
t ex
peri
ence
num
ber
of y
ears
th
at t
he c
urre
nt
head
ha
s su
perv
ised
th
e re
sear
ch
unit
tech
no
log
ical
su
pp
ort
ca
paci
ty
(uni
vers
itie
s,
inst
itu
tes
and
com
pani
es)
tech
nica
l, an
alyt
ical
an
d ad
min
istr
ativ
e su
ppor
t st
aff
as a
per
cent
age
of to
tal
staf
f (i
n ft
es)
tech
no
log
y
mat
eria
l re
sour
ces
(uni
vers
itie
s an
d in
stit
utes
)
rese
arch
bu
dget
pe
r ft
e sc
ient
ist
in 1
991
(in
US
$lft
es)
perc
enta
ge
dis
cov
ery
(c
ompa
nies
)
perc
enta
ge
of th
e to
tal
R&
D e
xpen
ditu
re,
allo
cate
d to
the
dis
cove
ry
phas
e
sig
nat
ory
au
thor
izat
ion
capa
city
(u
nive
rsit
ies
and
inst
itut
es)
amou
nt
of p
rocu
rem
ent
(in
US$
) th
e re
sear
ch
unit
lead
er c
an m
ake
wit
hout
pre
viou
s co
nsen
t of
hig
her
man
agem
ent
exte
rnal
fu
nd
ing
(un
iver
siti
es
and
inst
itut
es)
pow
er
perc
enta
ge
of t
he t
otal
res
earc
h un
it bu
dget
or
igin
atin
g fr
om e
xter
nal
fund
ing
(gra
nts,
co
ntra
ct
rese
arch
et
c.)
jun
ior
to s
enio
r sc
ien
tist
ra
te (
univ
ersi
ties
)
num
ber
of j
unio
r sc
ient
ists
(P
hD s
tude
nts
and
post
-doc
s w
ithou
t a
tenu
re,
in f
tes)
div
ided
by
the
num
ber
of
supe
rvis
ing
seni
or s
cien
tist
s (n
on-c
hair
ed
prof
esso
rs,
asso
ciat
e an
d as
sist
ant
prof
esso
rs
wit
h te
nure
) in
fte
s =
(s
uper
visi
on
rate
)"l
I I I i
Ii Co
~.
("')
N
0'1 ~
N
Exh
ibit
C.2
a O
PER
AT
ION
AL
IZA
TIO
N O
F T
HE
EM
PIR
ICA
L C
ON
CE
PTS
OF
MA
NA
GE
ME
NT
CO
NT
RO
L
~
effe
ctiv
enes
s of
per
sonn
el
polic
y
subj
ecti
ve
asse
ssm
ent
by t
he h
ead
of th
e re
sear
ch
unit
and
the
sen
ior
scie
ntif
ic s
taff
in
univ
ersi
ties
an
d in
stit
utes
, or
the
hea
ds
of t
he d
iffe
rent
res
earc
h de
part
men
ts
in c
ompa
ny
labo
rato
ries
, of
the
effe
ctiv
e-ne
ss
of p
erso
nnel
po
licy
e.g
.: •
pace
an
d m
anne
r in
whi
ch r
eorg
aniz
atio
ns
are
exec
uted
•
case
s co
ncer
ning
ap
poin
tmen
t, pr
omot
ion
and
dism
issa
l
pers
onne
l m
ater
ial
ince
ntiv
es:
• pr
imar
y an
d se
cond
ary
wor
king
con
diti
ons
(for
inst
ance
sa
lary
le
vel,
stoc
ks
and
use
of c
ompa
ny
car
cont
rol
etc.
).
• ex
tra
paym
ent
for
extr
aord
inar
y re
sear
ch
effo
rts
imm
ater
ial
ince
ntiv
es:
• ca
reer
pl
anni
ng
and
trai
ning
fac
ilit
ies
• go
od r
eput
atio
n of
the
orga
niza
tion
or
the
rese
arch
un
it l
eade
r
syst
em
• ca
reer
po
ssib
ilit
ies
wit
hin
the
orga
niza
tion
or
as
a st
ep-u
p to
war
ds
othe
r or
gani
zati
ons
• re
cogn
itio
n,
ego
poss
ibil
itie
s fo
r sc
ient
ific
pub
lish
ing
and
pres
enta
tion
, or
a d
ual
ladd
er s
yste
m
in
cont
rol
indu
stry
adeq
uac
y of
res
ourc
es
subj
ecti
ve
asse
ssm
ent
of t
he a
dequ
acy
of:
• pe
rson
nel
and
mat
eria
l re
sour
ces
• ad
vanc
ed
labo
rato
ry
equi
pmen
t, de
vice
s an
d sp
ace
reso
urce
s co
ntro
l ad
min
istr
ativ
e co
ntro
l
subj
ecti
ve
asse
ssm
ent
of t
he s
peed
of
the
adm
inis
trat
ive
proc
edur
es:
• ap
poin
tmen
t an
d pr
ocur
emen
t of
equ
ipm
ent
(US$
5.0
00 i
n un
iver
siti
es
and
inst
itut
es
and
US
$ 50
,000
in
ind
ustr
y)
• re
allo
cati
on
of a
lar
ge p
art
(20%
) of
the
per
sonn
el
and
mat
eria
l re
sour
ces
to a
new
res
earc
h fi
eld.
t ~. ("
':l
pro
cess
co
ntr
ol
exte
rnal
co
ntr
ol
Ex
hib
it C
.2b
OP
ER
AT
ION
AL
IZA
TIO
N O
F T
HE
EM
PIR
ICA
L C
ON
CE
PT
S
OF
MA
NA
GE
ME
NT
CO
NT
RO
L
pla
nn
ing
subj
ecti
ve
asse
ssm
ent
of th
e im
port
ance
of
sho
rt a
nd m
iddl
e ra
nge
plan
ning
by
high
er m
anag
emen
t fo
r th
e ev
eryd
ay
rese
arch
w
ork
(for
inst
ance
re
sear
ch
com
mit
tees
in
uni
vers
itie
s an
d in
stit
utes
o
r th
e he
ad
offi
ce i
n in
dust
ry)
rese
arch
p
roce
ss
com
mu
nic
atio
n
freq
uenc
y •
freq
uenc
y of
res
earc
h m
eeti
ngs
atte
ndan
cy
mix
•
gene
ral
atte
ndan
cy
of r
esea
rch
mee
ting
s:
is t
he h
ead
of t
he r
esea
rch
unit
pre
sent
, al
ong
wit
h th
e sc
ient
ific
sta
ff o
r al
so w
ith t
he t
echn
ical
an
d an
alyt
ical
su
ppor
t st
aff
and
rese
arch
ers
from
oth
er
labo
rato
ries
in
uni
vers
itie
s an
d in
stit
utes
, or
sta
ff m
embe
rs
from
oth
er R
&D
pha
ses
and/
or m
arke
ting
an
d pr
oduc
tion
in
ind
ustr
y (l
ater
al a
nd c
ross
-fun
ctio
nal
com
mun
icat
ion)
inte
rnat
ion
al
com
mu
nic
atio
n
• fr
eque
ncy
of i
nter
nati
onal
co
ntac
ts
with
sci
enti
sts
and
phys
icia
ns
and
coll
eagu
es
from
oth
er
com
pani
es,
for
inst
ance
at
con
gres
ses
and
wor
ksho
ps
• nu
mbe
r of
joi
nt r
esea
rch
proj
ects
w
ith
othe
r re
sear
ch
unit
s ou
tsid
e th
e ow
n in
stit
utio
n in
the
N
ethe
rlan
ds
or a
broa
d (u
nive
rsit
ies
and
inst
itut
es)
con
trac
tor
com
mu
nic
atio
n
(un
iver
siti
es
and
inst
itu
tes)
freq
uenc
y of
con
tact
s w
ith (
indu
stri
al a
nd g
over
nmen
tal)
co
ntra
ctor
s
~ ~ ~. ("}
N
Q\ ~
Exh
ibit
C.3
a O
PE
RA
TIO
NA
L D
EF
INIT
ION
S O
F P
ER
FO
RM
AN
CE
A
ND
EF
FE
CT
IVE
NE
SS
M
EA
SU
RE
S
IN U
NIV
ER
SIT
IES
AN
D I
NS
TIT
UT
ES
scie
ntif
ic p
ub
lica
tio
ns
(uni
vers
itie
s an
d i
nsti
tute
s)
the
aver
age
num
ber
of p
aper
s (a
rtic
les,
le
tter
s to
the
edi
tor,
no
tes,
re
view
s an
d pr
ocee
ding
s)
publ
ishe
d in
in
tern
atio
nal
scie
ntif
ic j
ourn
als
betw
een
1985
and
19
90,
ente
red
in t
he S
cien
ce
Cit
atio
n In
dex,
the
Soc
ial
Scie
nce
Cit
atio
n In
dex
and
the
Art
s an
d th
e H
uman
itie
s In
dex
per
tota
l sc
ient
ific
sta
ff (
rese
arch
pe
rfor
rnan
ce)
and
per
fte
scie
ntif
ic s
taff
(re
sear
ch
effe
ctiv
enes
s)
nu
mb
er o
f P
hDs
(uni
vers
itie
s)
the
aver
age
num
ber
of P
hD t
hese
s de
fend
ed
betw
een
1987
and
19
91
(res
earc
h pe
rfor
man
ce)
and
per
fie
juni
or r
esea
rche
r (r
esea
rch
effe
ctiv
enes
s)
rese
arch
pe
rfor
man
ce
and
effe
ctiv
enes
s
scie
ntif
ic c
red
ibil
ity
(un
iver
siti
es
and
inst
itu
tes)
the
num
ber
of p
aper
s re
ceiv
ed
from
sci
enti
fic
jour
nals
fo
r pe
er r
evie
w,
and
the
part
icip
atio
n in
Edi
tori
al B
oard
s by
the
sen
ior
scie
ntif
ic s
taff
cita
tio
n s
core
the
aver
age
num
ber
of c
itat
ions
pe
r sc
ient
ific
pap
er,
publ
ishe
d be
twee
n 19
85 a
nd
1987
, in
the
thre
e ye
ars
foll
owin
g pu
blic
atio
n;
self
-cit
atio
ns
and
cita
tion
s by
res
earc
h un
it m
embe
rs
wer
e om
itted
; th
e nu
mbe
r of
ci
tati
ons
was
di
vide
d by
the
ave
rage
nu
mbe
r of
cita
tions
of
all
pape
rs
publ
ishe
d in
tha
t pe
riod
in
the
sam
e jo
urna
ls
(jou
rnal
wei
ghed
) an
d in
the
sam
e (s
ub-)
disc
ipli
nes
(wei
ghed
fo
r di
scip
line
)
----------
~ ~
"C
I'D g, S:;.
(i
~
'CS 8- ~.
r:l
Exh
ibit
C.3
b O
PER
AT
ION
AL
DE
FIN
ITIO
NS O
F PE
RFO
RM
AN
CE
AN
D E
FFE
CT
IVE
NE
SS M
EA
SUR
ES
IN U
NIV
ER
SIT
IES
AN
D I
NST
ITU
TE
S
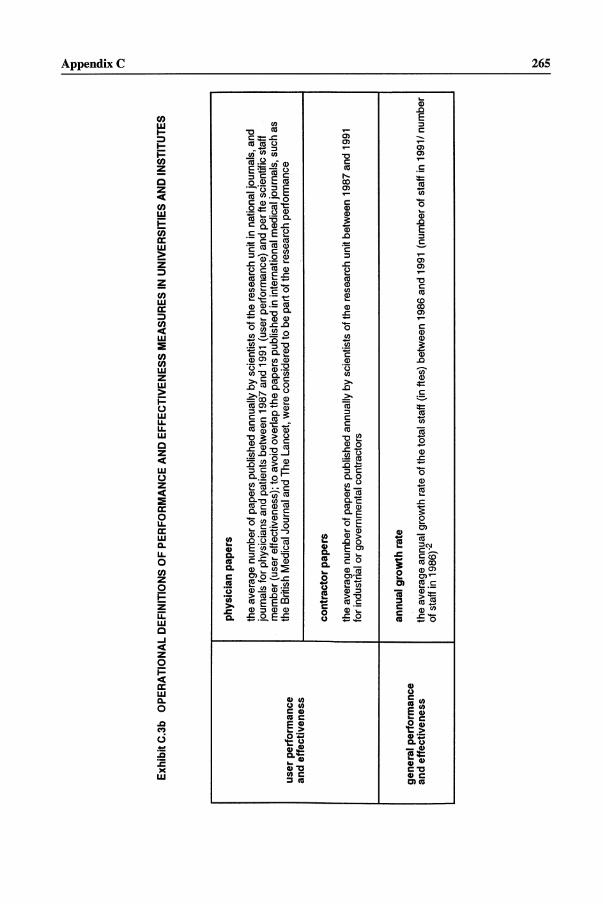
phys
icia
n pa
pers
the
aver
age
num
ber
of p
aper
s pu
blis
hed
annu
ally
by
scie
ntis
ts
of t
he r
esea
rch
unit
in
nati
onal
jo
urna
ls,
and
jour
nals
fo
r ph
ysic
ians
an
d pa
tien
ts
betw
een
1987
and
199
1 (u
ser
perf
orm
ance
) an
d pe
r fi
e sc
ient
ific
sta
ff
rnem
ber
(use
r ef
fect
iven
ess)
; to
avo
id o
verl
ap t
he p
aper
s pu
blis
hed
in i
nter
nati
onal
m
edic
al
jour
nals
, su
ch a
s
user
pe
rfor
man
ce
the
Bri
tish
Med
ical
Jou
rnal
an
d T
he L
ance
t, w
ere
cons
ider
ed
to b
e pa
rt o
f th
e re
sear
ch
perf
orm
ance
and
effe
ctiv
enes
s
cont
ract
or
pape
rs
the
aver
age
num
ber
of p
aper
s pu
blis
hed
annu
ally
by
sci
enti
sts
of t
he r
esea
rch
unit
bet
wee
n 19
87 a
nd
1991
fo
r in
dust
rial
or
gove
rnm
enta
l co
ntra
ctor
s
annu
al g
row
th
rate
ge
nera
l pe
rfor
man
ce
and
effe
ctiv
enes
s th
e av
erag
e an
nual
gr
owth
rat
e of
the
tota
l st
aff
(in
fles
) be
twee
n 19
86 a
nd
1991
(n
umbe
r of
sta
ff i
n 19
911
num
ber
of s
taff
in
1986
)"2
~
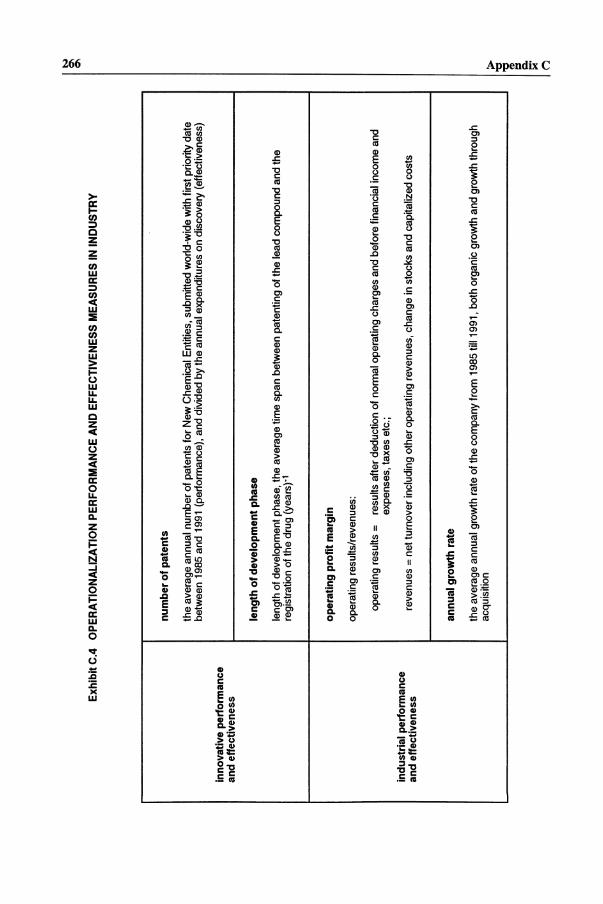
Exh
ibit
C.4
O
PER
AT
ION
AL
IZA
TIO
N P
ER
FOR
MA
NC
E
AN
D E
FFE
CT
IVE
NE
SS
ME
ASU
RE
S IN
IN
DU
STR
Y
inno
vati
ve
perf
orm
ance
an
d ef
fect
iven
ess
indu
stri
al p
erfo
rman
ce
and
effe
ctiv
enes
s
num
ber
of
pate
nts
the
aver
age
annu
al
num
ber
of p
aten
ts
for
New
Che
mic
al
Ent
ities
, su
bmit
ted
wor
ld-w
ide
wit
h fi
rst
prio
rity
dat
e be
twee
n 19
85 a
nd
1991
(p
erfo
rman
ce),
an
d di
vide
d by
the
ann
ual
expe
ndit
ures
on
dis
cove
ry
(eff
ecti
vene
ss)
leng
th o
f de
velo
pmen
t ph
ase
leng
th o
f de
velo
pmen
t ph
ase,
th
e av
erag
e ti
me
span
be
twee
n pa
tent
ing
of th
e le
ad c
ompo
und
and
the
regi
stra
tion
of
the
dru
g (y
ears
)"
oper
atin
g pr
ofit
mar
gin
oper
atin
g re
sult
slre
venu
es:
oper
atin
g re
sult
s =
re
sult
s af
ter
dedu
ctio
n of
nor
mal
ope
rati
ng
char
ges
and
befo
re f
inan
cial
inc
ome
and
expe
nses
, ta
xes
etc.
;
reve
nues
=
net
turn
over
inc
ludi
ng o
ther
ope
rati
ng
reve
nues
, ch
ange
in
sto
cks
and
capi
tali
zed
cost
s
annu
al
grow
th r
ate
the
aver
age
annu
al
grow
th r
ate
of t
he c
ompa
ny
from
198
5 ti
ll 1
991,
bot
h or
gani
c gr
owth
and
gro
wth
thr
ough
ac
quis
itio
n
~
0\ :g ~ 8- ~.
("'l
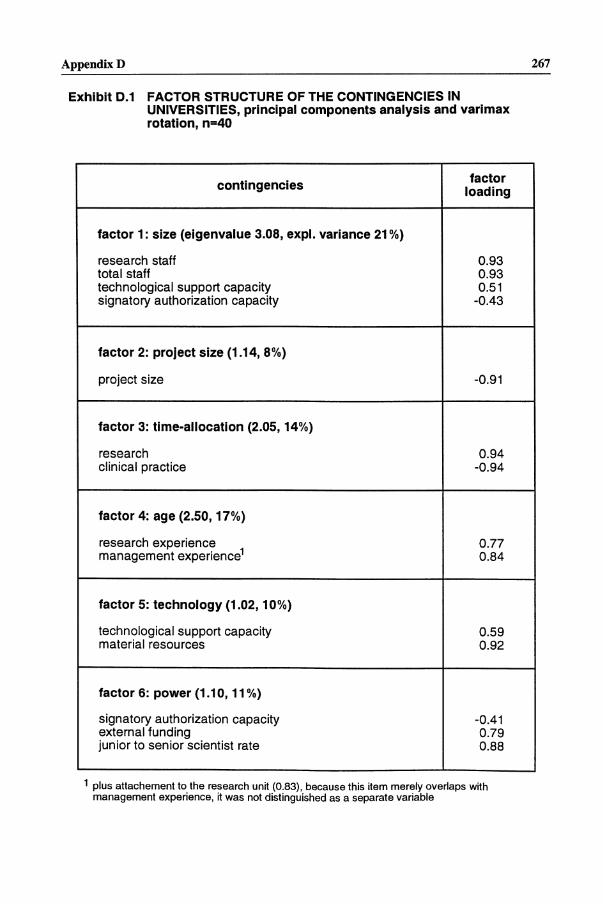
AppendixD
Exhibit 0.1 FACTOR STRUCTURE OF THE CONTINGENCIES IN UNIVERSITIES, principal components analysis and varimax rotation, n=40
contingencies factor
loading
factor 1: size (eigenvalue 3.08, expl. variance 21 %)
research staff 0.93 total staff 0.93 technological support capacity 0.51 signatory authorization capacity -0.43
factor 2: project size (1.14, 8%)
project size -0.91
factor 3: time-allocation (2.05, 14%)
research 0.94 clinical practice -0.94
factor 4: age (2.50, 17%)
research experience 0.77 management experience 1 0.84
factor 5: technology (1.02, 10%)
technological support capacity 0.59 material resources 0.92
factor 6: power (1.10, 11 %)
signatory authorization capacity -0.41 external funding 0.79 junior to senior scientist rate 0.88
1 plus attachement to the research unit (0.83), because this item merely overlaps with management experience, it was not distinguished as a separate variable
267
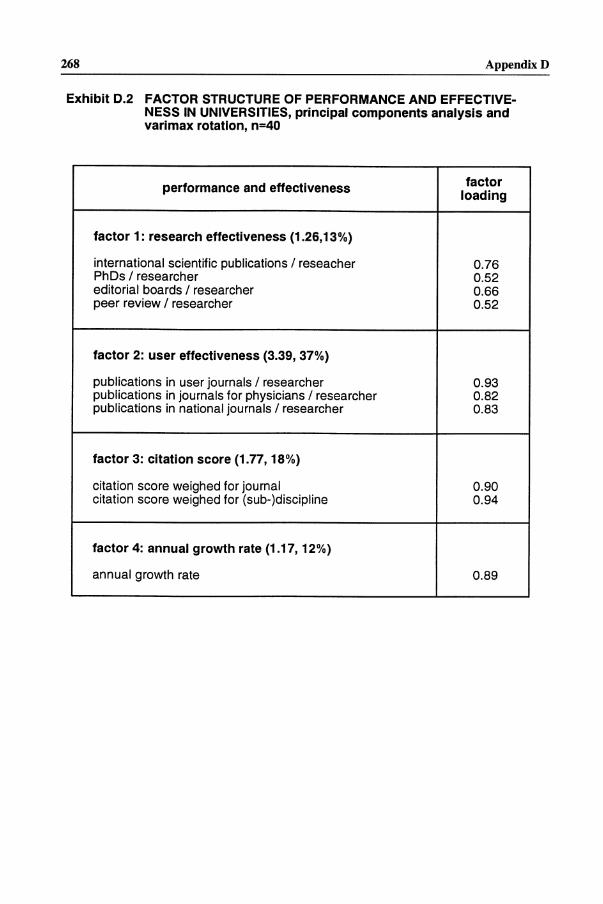
268 AppendixD
Exhibit 0.2 FACTOR STRUCTURE OF PERFORMANCE AND EFFECTIVENESS IN UNIVERSITIES, principal components analysis and varimax rotation, n=40
performance and effectiveness factor loading
factor 1 : research effectiveness (1.26,13 %)
international scientific publications / reseacher 0.76 PhDs / researcher 0.52 editorial boards I researcher 0.66 peer review / researcher 0.52
factor 2: user effectiveness (3.39, 37%)
publications in user journals / researcher 0.93 publications in journals for physicians / researcher 0.82 publications in national journals / researcher 0.83
factor 3: citation score (1.77,18%)
citation score weighed for journal 0.90 citation score weighed for (sub-)discipline 0.94
factor 4: annual growth rate (1.17, 12%)
annual growth rate 0.89
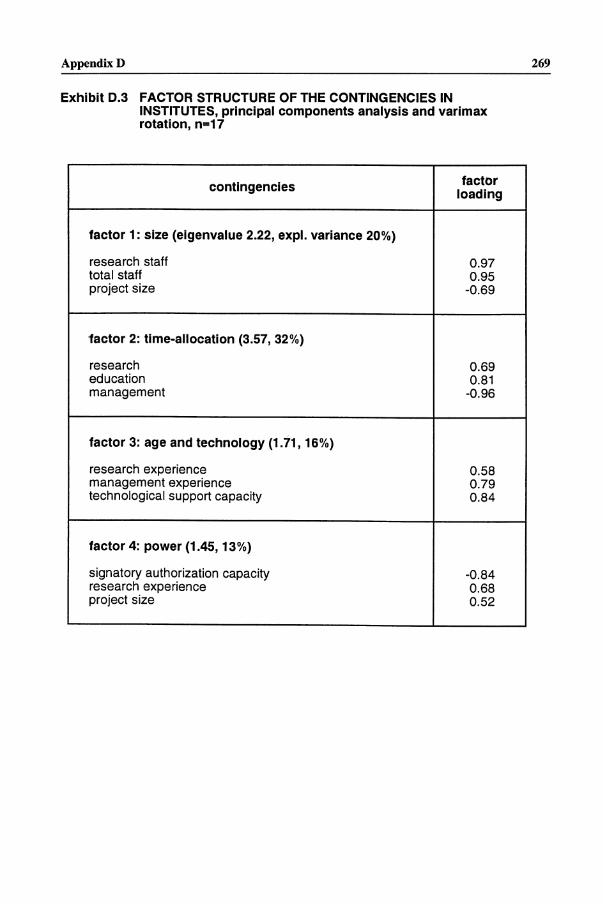
AppendixD 269 ---------------------------------------------------------
Exhibit 0.3 FACTOR STRUCTURE OF THE CONTINGENCIES IN INSTITUTES, principal components analysis and varimax rotation, n=17
contingencies factor
loading
factor 1: size (eigenvalue 2.22, expl. variance 20%)
research staff 0.97 total staff 0.95 project size -0.69
factor 2: time-allocation (3.57, 32%)
research 0.69 education 0.81 management -0.96
factor 3: age and technology (1.71,16%)
research experience 0.58 management experience 0.79 technological support capacity 0.84
factor 4: power (1.45,13%)
signatory authorization capacity -0.84 research experience 0.68 project size 0.52
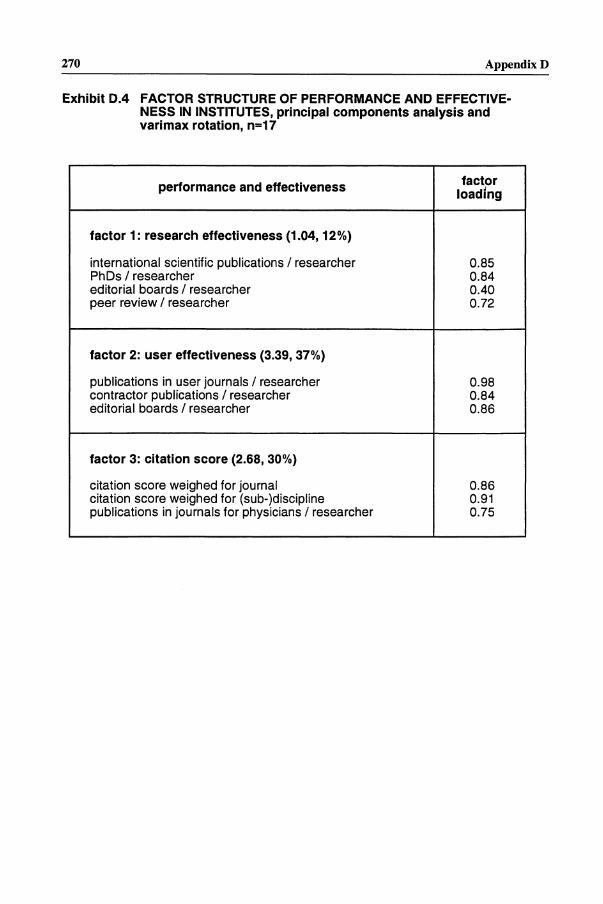
270 AppendixD
Exhibit 0.4 FACTOR STRUCTURE OF PERFORMANCE AND EFFECTIVENESS IN INSTITUTES, principal components analysis and varimax rotation, n=17
performance and effectiveness factor loading
factor 1: research effectiveness (1.04, 12%)
international scientific publications / researcher 0.85 PhDs / researcher 0.84 editorial boards / researcher 0.40 peer review / researcher 0.72
factor 2: user effectiveness (3.39, 37%)
publications in user journals / researcher 0.98 contractor publications / researcher 0.84 editorial boards / researcher 0.86
factor 3: citation score (2.68, 30%)
citation score weighed for journal 0.86 citation score weighed for (sub-)discipline 0.91 publications in journals for physicians / researcher 0.75
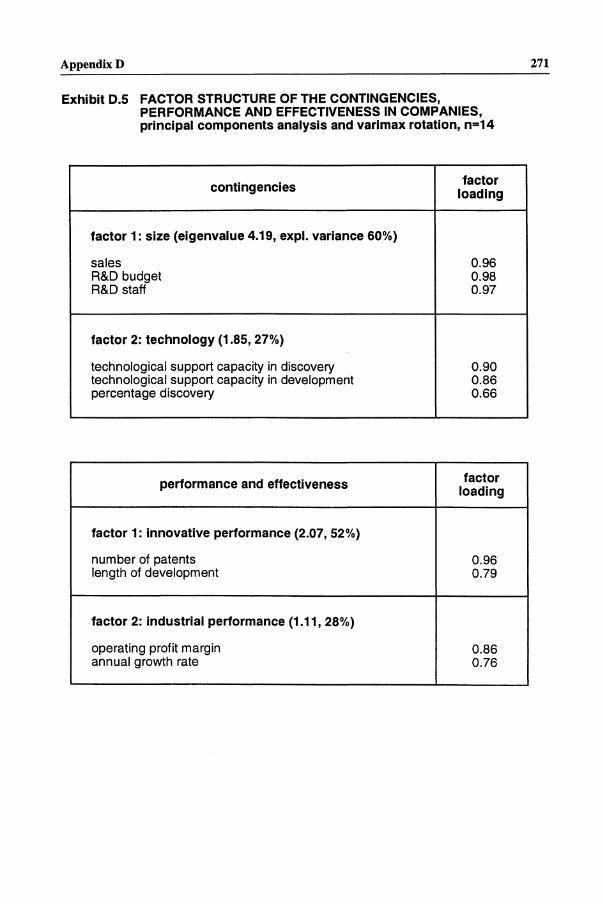
AppendixD
Exhibit 0.5 FACTOR STRUCTURE OF THE CONTINGENCIES, PERFORMANCE AND EFFECTIVENESS IN COMPANIES, principal components analysis and varimax rotation, n=14
contingencies factor loading
factor 1: size (eigenvalue 4.19, expl. variance 60%)
sales 0.96 R&D budget 0.98 R&D staff 0.97
factor 2: technology (1.85,27%)
technological support capacity in discovery 0.90 technological support capacity in development 0.86 percentage discovery 0.66
performance and effectiveness factor loading
factor 1: innovative performance (2.07, 52%)
number of patents 0.96 length of development 0.79
factor 2: industrial performance (1.11, 28%)
operating profit margin 0.86 annual growth rate 0.76
271
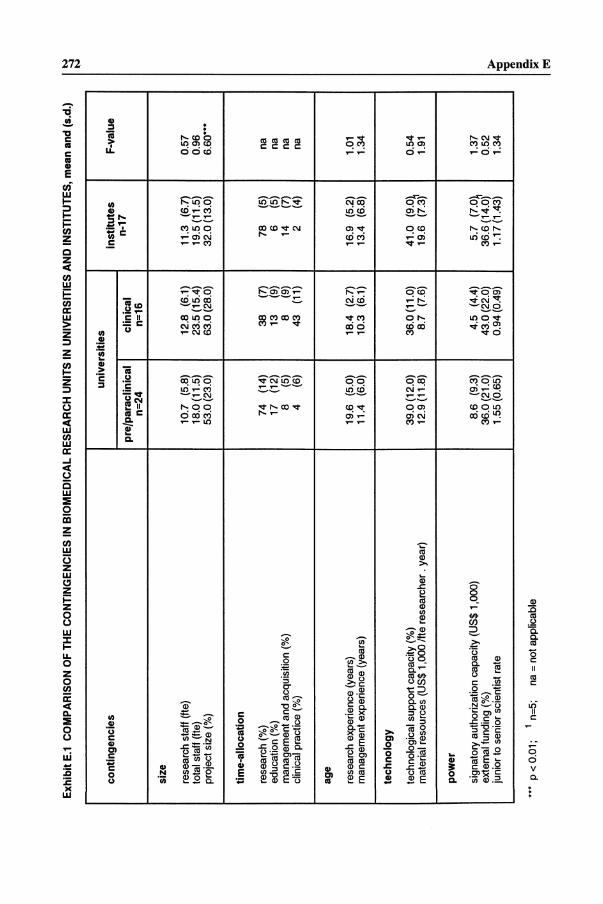
Exh
ibit
E.1
C
OM
PAR
ISO
N
OF
TH
E C
ON
TIN
GE
NC
IES
IN
BIO
ME
DIC
AL
RE
SE
AR
CH
U
NIT
S I
N U
NIV
ER
SIT
IES
AN
D I
NS
TIT
UT
ES
, m
ean
and
(s.d
.)
I ~
un
iver
siti
es
cont
inge
ncie
s
pre/
para
clin
ical
cl
inic
al
n=24
n=
16
size
rese
arch
st
aff
(fte
) 10
.7
(5.8
) 12
.8
(6.1
) to
tal
staf
f (l
te)
18.0
(11
.5)
23.5
(15
.4)
proj
ect
size
('Y
o) 53
.0 (
23.0
) 63
.0(2
8.0)
tim
e-al
loca
tion
rese
arch
('Y
o) 74
(1
4)
38
(7)
educ
atio
n ('Y
o) 17
(1
2)
13
(9)
man
agem
ent
and
acqu
isiti
on
('Yo)
8 (5
) 8
(9)
clin
ical
pra
ctic
e ('Y
o) 4
(6)
43
(1
1 )
age
rese
arch
ex
peri
ence
(y
ears
) 19
.6
(5.0
) 18
.4
(2.7
) m
anag
emen
t ex
peri
ence
(y
ears
) 11
.4
(6.0
) 10
.3
(S.1
)
tech
no
log
y
tech
nolo
gica
l su
ppor
t ca
paci
ty
('Yo)
39
.0 (
12.0
) 3S
.0 (
11.0
) m
ater
ial
reso
urce
s (U
S$ 1
,000
lit
e re
sear
cher
. ye
ar)
12.9
(11
.8)
8.7
(7.6
)
pow
er
sign
ator
y au
thor
izat
ion
capa
city
(U
S$ 1
,000
) 8.
S (9
.3)
4.5
(4.4
) ex
tern
al
fund
ing
('Yo)
36.0
(21
.0)
43.0
(22
.0)
juni
or to
sen
ior
scie
ntis
t ra
te
1.55
(0.
S5)
0.94
(0.
49)
•••
p <
0.0
1;
1 n=
5;
na =
not
app
lica
ble
inst
itu
tes
n-17
11.3
(6
.7)
19.5
(11
.5)
32.0
(13
.0)
78
(5)
6 (5
) 14
(7
) 2
(4)
16.9
(5
.2)
13.4
(6
.8)
41.0
(9
.0~
19.6
(7
.3)
5.7
(7.0
~ 36
.S (
14.0
) 1.
17 (
1.43
)
F-v
alue
0.57
0.
96
6.60
'"
na
na
na
na
1.01
1.
34
0.54
1.
91
1.37
0.
52
1.34
N ~
'0
fI) [ ~.
tr'J
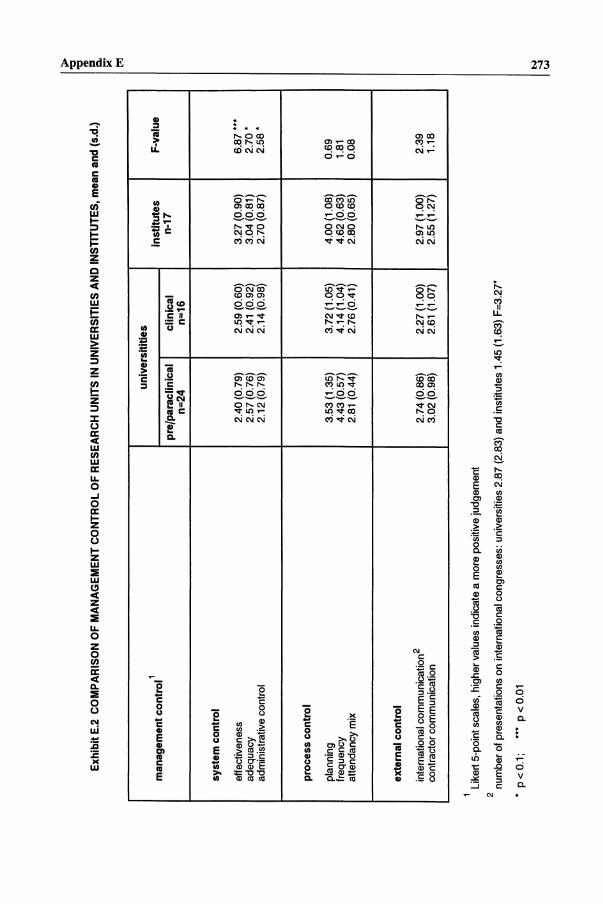
~
'g
Ex
hib
it E
.2
CO
MP
AR
ISO
N
OF
MA
NA
GE
ME
NT
CO
NT
RO
L O
F R
ES
EA
RC
H
UN
ITS
IN
UN
IVE
RS
ITIE
S A
ND
IN
ST
ITU
TE
S,
mea
n an
d (s
.d.)
I is
. s:;.
tfj
un
iver
siti
ties
1
inst
itu
tes
F-v
alue
m
anag
emen
t co
ntr
ol
pre/
para
clin
ical
cl
inic
al
n-17
n=
24
n=16
syst
em
cont
rol
effe
ctiv
enes
s 2.
40(0
.79)
2.
59 (
0.60
) 3.
27 (
0.90
) 6.
87 '
"
adeq
uacy
2.
57 (
0.76
) 2.
41
(0.9
2)
3.04
(0.
81)
2.70
'
adm
inis
trat
ive
cont
rol
2.12
(0.
79)
2.14
(0.
98)
2.70
(0.
87)
2.58
'
proc
ess
con
tro
l
plan
ning
3.
53 (
1.35
) 3.
72 (
1.05
) 4.
00 (
1.08
) 0.
69
freq
uenc
y 4.
43 (
0.57
) 4.
14 (
1.04
) 4.
62 (
0.63
) 1.
81
atte
ndan
cy
mix
2.
81
(0.4
4)
2.76
(0.
41)
2.80
(0.
65)
0.08
exte
rnal
co
ntr
ol
inte
rnat
iona
l co
mm
unic
atio
n2
2.74
(0.
86)
2.27
(1.
00)
2.97
(1.
00)
2.39
co
ntra
ctor
co
mm
unic
atio
n 3.
02 (
0.98
) 2.
61
(1.0
7)
2.55
(1.
27)
1.18
1 L
iker
t 5-
poin
t sc
ales
, hi
gher
val
ues
indi
cate
a
mor
e po
siti
ve j
udge
men
t 2
num
ber
of p
rese
ntat
ions
on
int
erna
tion
al
cong
ress
es:
univ
ersi
ties
2.
87 (
2.83
) an
d in
stit
utes
1.
45 (
1.63
) F
=3.
27'
, p
< 0
.1;
'"
p <
0.0
1
!j
(.-J
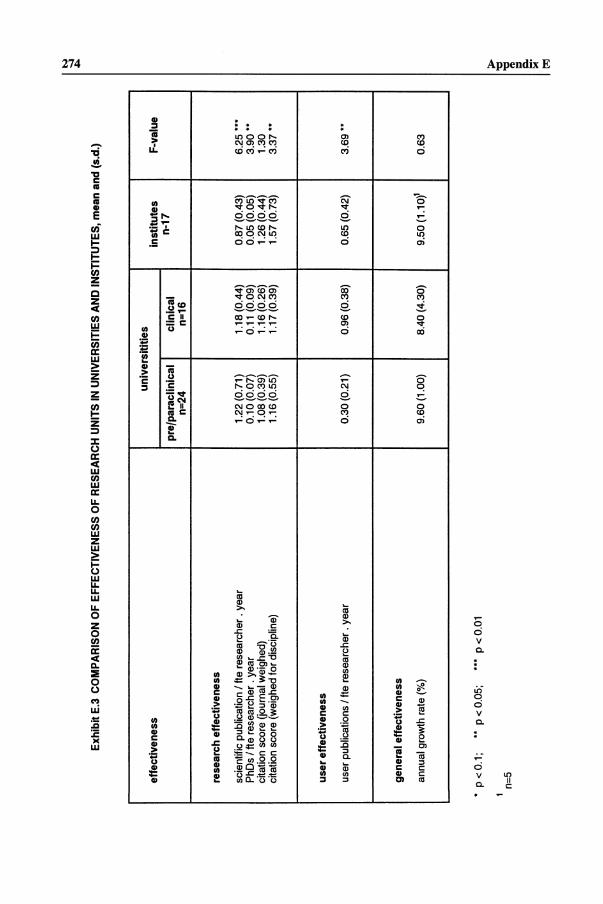
Exh
ibit
E.3
CO
MPA
RIS
ON
OF
EFF
EC
TIV
EN
ESS
OF
RE
SEA
RC
H U
NIT
S IN
UN
IVE
RSI
TIE
S A
ND
IN
STIT
UT
ES,
mea
n an
d (s
.d.)
univ
ersi
titie
s ef
fect
iven
ess
inst
itute
s F-
valu
e
pre/
para
clin
ical
cl
inic
al
n-17
n=24
n=
16
rese
arch
ef
fect
iven
ess
scie
ntif
ic p
ubli
cati
on /
fie
res
earc
her.
y
ear
1.22
(0.
71)
1.18
(0.
44)
0.87
(0.
43)
6.25
---
PhD
s /
fie
rese
arch
er.
year
0.
10 (
0.07
) 0.
11 (
0.09
) 0.
05 (
0.05
) 3.
90 -
-ci
tati
on s
core
O
ourn
al
wei
ghed
) 1.
08 (
0.39
) 1.
16 (
0.26
) 1.
26 (0
.44)
1.
30
cita
tion
sco
re
(wei
ghed
fo
r di
scip
line
) 1.
16 (
0.55
) 1.
17 (
0.39
) 1.
57 (0
.73)
3.
37 -
-
user
eff
ectiv
enes
s
user
pub
lica
tion
s /
fie
rese
arch
er.
yea
r 0.
30 (
0.21
) 0.
96 (
0.38
) 0.
65 (
0.42
) 3.
69 -
-
gene
ral
effe
ctiv
enes
s
annu
al
grow
th r
ate
(%)
9.60
(1.
00)
8.40
(4.
30)
9.50
(1.1
0)1
0.63
-p <
0.
1;
_.
p <
0.0
5;
•••
P <
0.0
1
1 n=
5
~ ~ ~ s:;.
tf.j
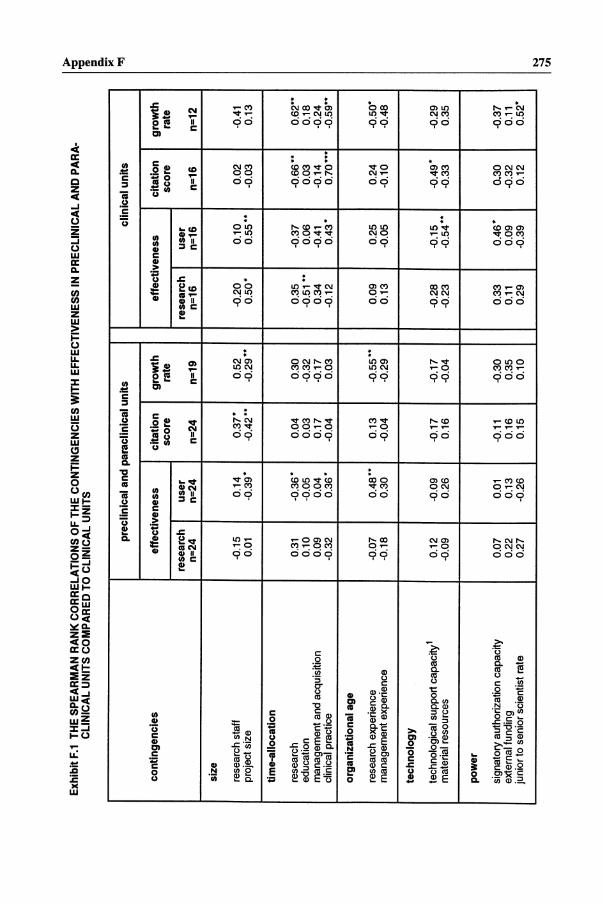
Exh
ibit
F.1
TH
E S
PEA
RM
AN
RA
NK
CO
RR
EL
AT
ION
S O
F T
HE
CO
NT
ING
EN
CIE
S W
ITH
EFF
EC
TIV
EN
ESS
IN
PR
EC
LIN
ICA
L A
ND
PA
RA
C
LIN
ICA
L U
NIT
S C
OM
PAR
ED
TO
CL
INIC
AL
UN
ITS
prec
linic
al
and
para
clin
ical
un
its
clin
ical
un
its
cont
inge
ncie
s ef
fect
iven
ess
cita
tion
grow
th
effe
ctiv
enes
s ci
tatio
n sc
ore
rate
sc
ore
rese
arch
us
er
rese
arch
us
er
n=24
n=
24 n
=24
n=19
n=
16
n=16
n=
16
size
rese
arch
st
aff
-0.1
5 0.
14
0.37
" 0.
52
-0.2
0 0.
10
0.02
pr
ojec
t si
ze
0.01
-0
.39"
-0
.42
""
-0.2
9""
0.50
" 0.
55""
-0
.03
time-
allo
catio
n
rese
arch
0.
31
-0.3
6"
0.04
0.
30
0.35
-0
.37
-0.6
6""
educ
atio
n 0.
10
-0.0
5 0.
03
-0.3
2 -0
.51
""
0.06
0.
03
man
agem
ent
and
acqu
isit
ion
0.09
0.
04
0.17
-0
.17
0.34
-0
.41
-0.1
4 cl
inic
al p
ract
ice
-0.3
2 0.
36"
-0.0
4 0.
03
-0.1
2 0.
43"
0.70
"""
orga
niza
tiona
l ag
e
rese
arch
ex
peri
ence
-0
.07
0.48
""
0.13
-0
.55
""
0.09
0.
25
0.24
m
anag
emen
t ex
peri
ence
-0
.18
0.30
-0
.04
-0.2
9 0.
13
-0.0
5 -0
.10
tech
nolo
gy
tech
nolo
gica
l su
ppor
t ca
paci
ty 1
0.
12
-0.0
9 -0
.17
-0.1
7 -0
.28
-0.1
5 -0
.49"
m
ater
ial
reso
urce
s -0
.09
0.26
0.
16
-0.0
4 -0
.23
-0.5
4 ""
-0
.33
pow
er
sign
ator
y au
thor
izat
ion
capa
city
0.
07
0.01
-0
.11
-0.3
0 0.
33
0.46
" 0.
30
exte
rnal
fu
ndin
g 0.
22
0.13
0.
16
0.35
0.
11
0.09
-0
.32
juni
or to
sen
ior
scie
ntis
t ra
te
0.27
-0
.26
0.15
0.
10
0.29
-0
.39
0.12
-
----------------
grow
th
rate
n=12
-0.4
1 0.
13
0.62
""
0.18
-0
.24
-0.5
9""
-0.5
0"
-0.4
8
-0.2
9 0.
35
-0.3
7 0.
11
0.52
"
~ 8- ~.
~ ~
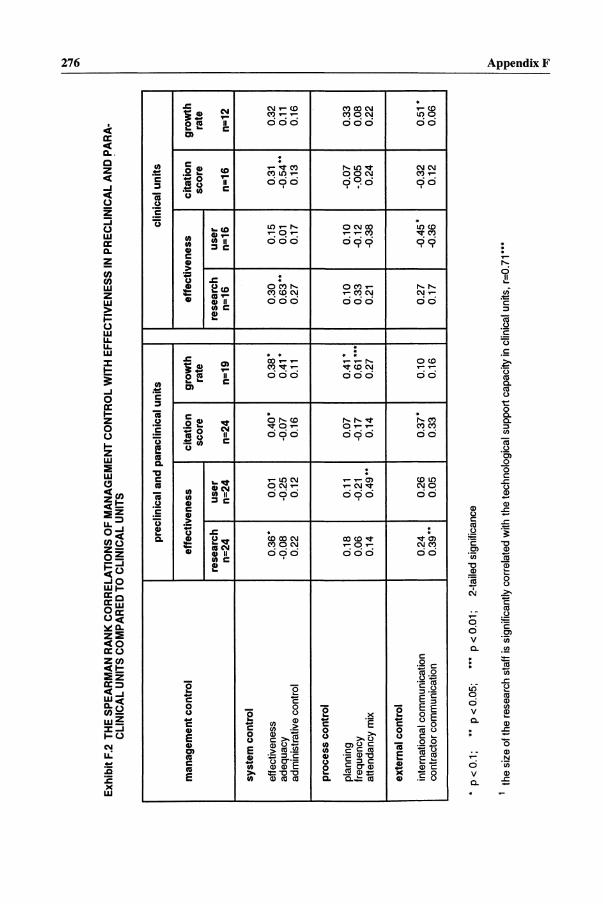
Exh
ibit
F.2
TH
E SP
EAR
MA
N R
AN
K C
OR
RE
LA
TIO
NS
OF
MA
NA
GE
ME
NT
CO
NTR
OL
WIT
H E
FFE
CT
IVE
NE
SS
IN P
RE
CL
INIC
AL
AN
D P
AR
A
CL
INIC
AL
UN
ITS
CO
MPA
RED
TO
CL
INIC
AL
UN
ITS
prec
lini
cal
and
para
clin
ical
u
nit
s cl
inic
al u
nit
s
man
agem
ent
cont
rol
effe
ctiv
enes
s ci
tati
on
grow
th
effe
ctiv
enes
s ci
tati
on
grow
th
scor
e ra
te
scor
e ra
te
rese
arch
us
er
rese
arch
us
er
n=24
n=
24
n=24
n=
19
n=16
n=
16
n=16
n=
12
syst
em
cont
rol
effe
ctiv
enes
s 0.
36-
0.01
0.
40-
0.38
-0.
30
0.15
0.
31
0.32
ad
equa
cy
-0.0
8 -0
.25
-0.0
7 0.
41-
0.63
--0.
01
-0.5
4--
0.11
ad
min
istr
ativ
e co
ntro
l 0.
22 0
.12
0.16
0.
11
0.27
0.
17
0.13
0.
16
proc
ess
cont
rol
plan
ning
0.
18
0.11
0.
07
0.41
-0.
10
0.10
-0
.07
0.33
fr
eque
ncy
0.06
-0
.21
-0.1
7 0.
61--
-0.
33
-0.1
2 -.
005
0.08
at
tend
ancy
m
ix
0.14
0.
49--
0.14
0.
27
0.21
-0
.38
0.24
0.
22
exte
rnal
co
ntro
l
inte
rnat
iona
l co
mm
unic
atio
n 0.
24
0.26
0.
37-
0.10
0.
27
-0.4
5 -
-0.3
2 0.
51-
cont
ract
or
com
mun
icat
ion
0.39
--0.
05
0.33
0.
16
0.17
-0
.36
0.12
0.0
6 --
-
-p
< 0
.1;
--P
< 0
.05;
--
-p
< 0
.01;
2-
taile
d si
gnif
ican
ce
1 th
e si
ze o
f th
e re
sear
ch
staf
f is
sig
nifi
cant
ly c
orre
late
d w
ith t
he t
echn
olog
ical
su
ppor
t ca
paci
ty
in c
linic
al u
nits
, r=
0.71
---
. !
---
~ >
'0
~ S. s;J'
""l
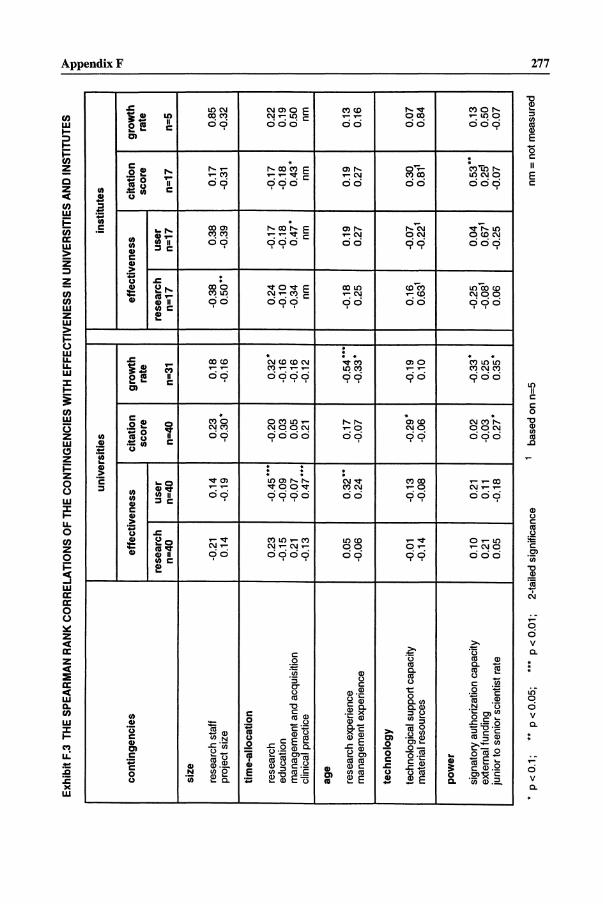
Exh
ibit
F.3
T
HE
SP
EA
RM
AN
RA
NK
CO
RR
EL
AT
ION
S
OF
TH
E C
ON
TIN
GE
NC
IES
WIT
H E
FFE
CT
IVE
NE
SS
IN U
NIV
ER
SIT
IES
AN
D I
NST
ITU
TE
S
univ
ersi
ties
in
stit
utes
> I ~. ""
l co
ntin
genc
ies
effe
ctiv
enes
s ci
tati
on
grow
th
effe
ctiv
enes
s ci
tati
on
grow
th
scor
e ra
te
scor
e ra
te
rese
arch
u
ser
rese
arch
u
ser
n=40
n=
40 n
=40
n=
31
n=17
n=
17
n=17
n=
5
size
rese
arch
st
aff
-0.2
1 0.
14 0
.23
0.18
-0
.38
0.38
0.
17
0.85
pr
ojec
t si
ze
0.14
-0
.19
-0.3
0·
-0.1
6 0.
50""
-0
.39
-0.3
1 -0
.32
tim
e-al
loca
tion
rese
arch
0.
23
-0.4
5 ""
" -0
.20
0.32
" 0.
24
-0.1
7 -0
.17
0.22
ed
ucat
ion
-0.1
5 -0
.09
0.03
-0.
16
-0.1
0 -0
.18
-0.1
8 0.
19
man
agem
ent
and
acqu
isiti
on
0.21
-0
.07
0.05
-0
.16
-0.3
4 0.
47*
0.43
" 0.
50
clin
ical
pra
ctic
e -0
.13
0.47
"""
0.21
-0
.12
nm
nm n
m
nm
age
rese
arch
ex
peri
ence
0.
05
0.32
"·
0.17
-0
.54
"."
-0.1
8 0.
19
0.19
0.
13
man
agem
ent
expe
rien
ce
-0.0
6 0.
24
-0.0
7 -0
.33"
0.
25
0.27
0.2
7 0.
16
tech
nolo
gy
tech
nolo
gica
l su
ppor
t ca
paci
ty
-0.0
1 -0
.13
-0.2
9·
-0.1
9 0.
16
-0.0
7 0.
30
0.07
m
ater
ial
reso
urce
s -0
.14
-0.0
8 -0
.06
0.10
0.6
31
-0.2
21
0.81
1 0.
84
pow
er
sign
ator
y au
thor
izat
ion
capa
city
0.
10
0.21
0.
02
-0.3
3"
-0.2
5 0.
04
0.53
""
0.13
ex
tern
al
fund
ing
0.21
0.
11
-0.0
3 0.
25
-0.0
81
0.67
1 0.
251
0.50
ju
nior
to s
enio
r sc
ient
ist
rate
0.
05
-0.1
8 0.
27"
0.35
" 0.
06
-0.2
5 -0
.07
-0.0
7
" p
<
0.1
; ".
P <
0.0
5;
.""
P <
0.0
1;
2-ta
iled
sign
ific
ance
1
base
d on
n=5
nm
= n
ot m
easu
red
j
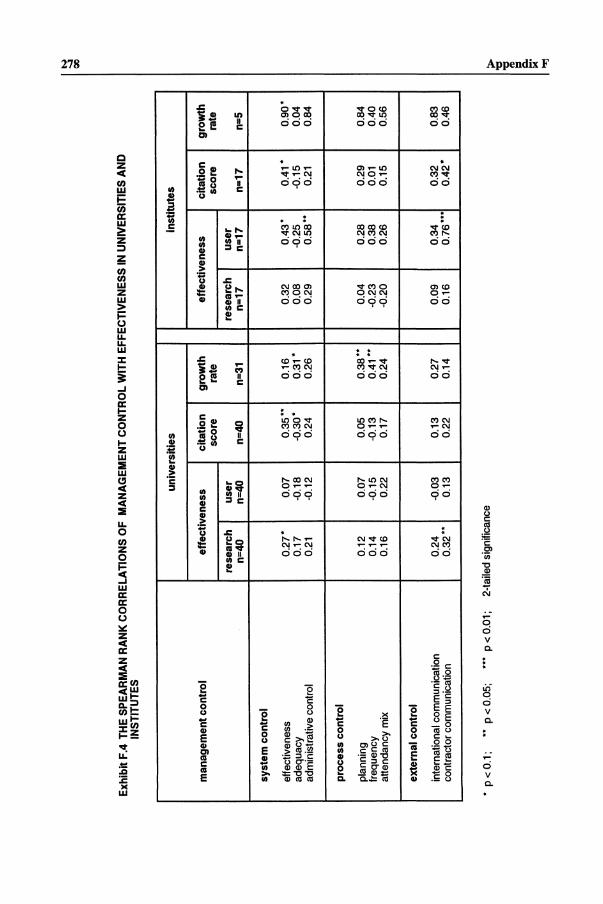
Exh
ibit
F.4
TH
E S
PEA
RM
AN
RA
NK
CO
RR
EL
AT
ION
S O
F M
AN
AG
EM
EN
T C
ON
TR
OL
WIT
H E
FFE
CT
IVE
NE
SS I
N U
NIV
ER
SIT
IES
AN
D
INST
ITU
TE
S
univ
ersi
ties
inst
itute
s
man
agem
ent
cont
rol
effe
ctiv
enes
s ci
tatio
n gr
owth
ef
fect
iven
ess
cita
tion
scor
e ra
te
scor
e re
sear
ch
user
re
sear
ch
user
n=
4O
n=4O
n=
4O
n=31
n=
17
n=17
n=
17
syst
em
cont
rol
effe
ctiv
enes
s 0
.27
' 0.
07
0.35
" 0.
16 0
.32
0.4
3'
0.4
1'
adeq
uacy
0.
17
-0.1
8 -0
.30'
0
.31
' 0.
08
-0.2
5 -0
.15
adm
inis
trat
ive
cont
rol
0.21
-0
.12
0.24
0.
26
0.29
0.
58"
0.21
proc
ess
cont
rol
plan
ning
0.
12
0.07
0.
05
0.38
" 0.
04
0.28
0.2
9 fr
eque
ncy
0.14
-0
.15
-0.1
3 0.
41"
-0.2
3 0.
38
0.01
at
tend
ancy
m
ix
0.16
0.
22
0.17
0.
24
-0.2
0 0.
26
0.15
exte
rnal
co
ntro
l
inte
rnat
iona
l co
mm
unic
atio
n 0.
24
-0.0
3 0.
13 0
.27
0.09
0.3
4 0.
32
cont
ract
or
com
mun
icat
ion
0.32
" 0.
13
0.22
0.
14
0.16
0.
76**
' 0.
42"
~~-
----
• p
< 0
.1;
•• P
< 0
.05;
••
• P
< 0
.01;
2-
taile
d si
gnif
ican
ce
grow
th
rate
n=5
0.9
0'
0.04
0.
84
0.84
0.
40
0.56
0.83
0.
46
~ >
"0
~ S. ~.
""1
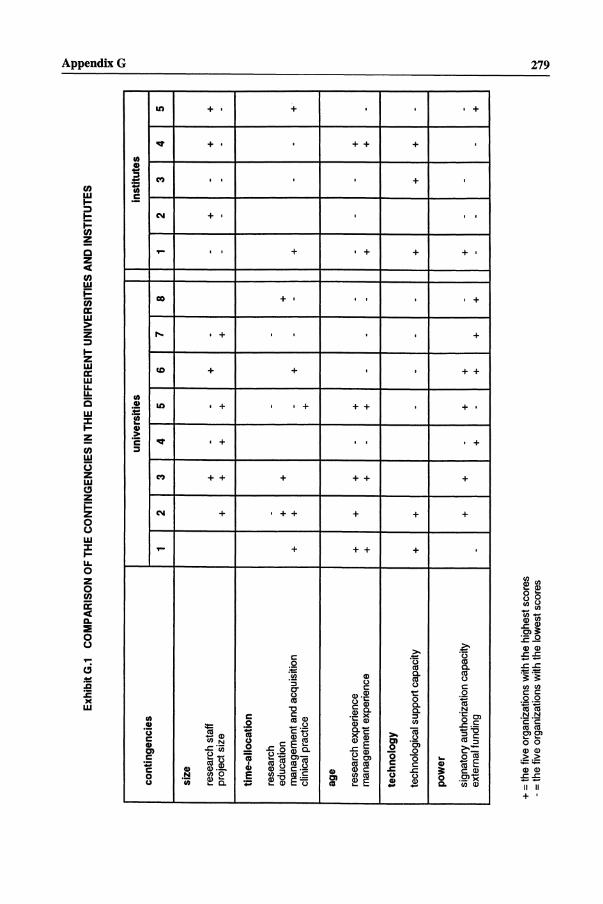
Exh
ibit
G.1
C
OM
PAR
ISO
N O
F T
HE
CO
NT
ING
EN
CIE
S IN
TH
E D
IFFE
RE
NT
UN
IVE
RSI
TIE
S AN
D I
NST
ITU
TE
S
cont
inge
ncie
s
size
rese
arch
st
aff
proj
ect
size
time-
allo
catio
n
rese
arch
ed
ucat
ion
man
agem
ent
and
acqu
isit
ion
clin
ical
pra
ctic
e
age
rese
arch
ex
peri
ence
m
anag
emen
t ex
peri
ence
tech
nolo
gy
tech
nolo
gica
l su
ppor
t ca
paci
ty
pow
er
sign
ator
y au
thor
izat
ion
capa
city
ex
tern
al
fund
ing
-----
---
+ =
the
five
org
aniz
atio
ns
with
the
hig
hest
sc
ores
-=
the
fiv
e or
gani
zati
ons
with
the
low
est
scor
es
1 +
+
+
+ -
univ
ersi
ties
2 3
4 5
+
--
+ +
+
+
--
+ +
+
- +
+ +
-
+
+
-+
+
-
+
+
-+
+
-
Inst
itute
s
6 7
8 1
2 3
+
--
+
-+
-
--
-+
+
-
-+
-
--
--
--
-+
--
-+
+
+
-+
-
-+
+ +
-
-----
4 + - - +
+
+ -
5 + - + - - - +
~
'i ~ ~ ~
IC
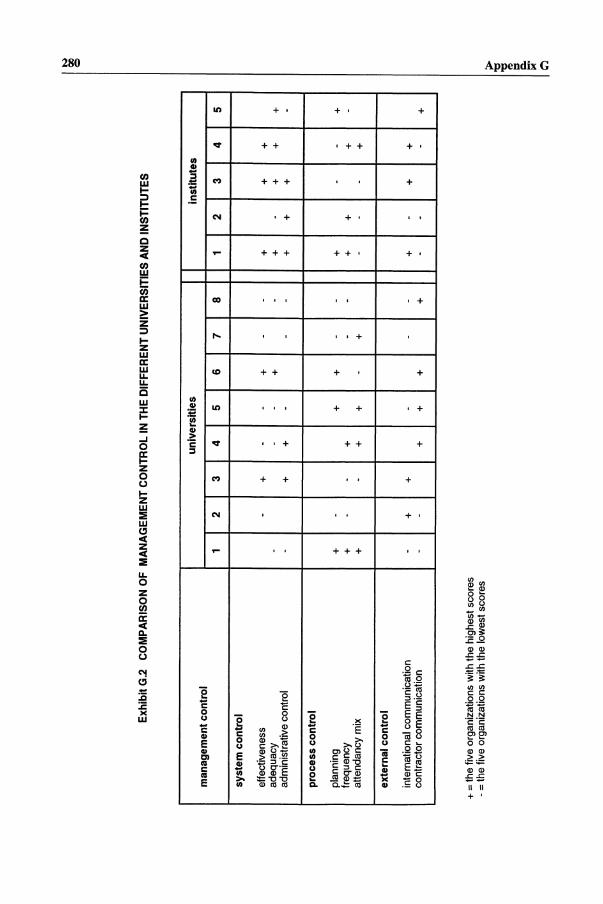
Exh
ibit
G.2
C
OM
PA
RIS
ON
O
F M
AN
AG
EM
EN
T C
ON
TR
OL
IN
TH
E D
IFF
ER
EN
T U
NIV
ER
SIT
IES
AN
D I
NS
TIT
UT
ES
man
agem
ent
cont
rol
syst
em
con
tro
l
effe
ctiv
enes
s ad
equa
cy
adm
inis
trat
ive
cont
rol
proc
ess
con
tro
l
plan
ning
fr
eque
ncy
atte
ndan
cy
mix
exte
rnal
co
ntr
ol
inte
mat
iona
l co
mm
unic
atio
n co
ntra
ctor
co
mm
unic
atio
n ----
--
----
+ =
the f
ive
orga
niza
tions
w
ith t
he h
ighe
st
scor
es
-= the
fiv
e or
gani
zatio
ns
with
the
low
est
scor
es
1 2
3
-+
- -
+
+
-+
-
-+
-
-+
+
-
-
univ
ersi
ties
in
stit
ute
s
4 5
6 7
8 1
2 3
--
+
--
+
+
--
+
-+
-
+
+
--
-+
+
+
+
+
--
+
-+
-
-+
+
+
+
-
+
--
-
--
-+
-
+
+
+
+
+
--
4 5
+
+ +
-
-+
+
-
+
+ -
+
~ >- ~ =
Co s:;. ~
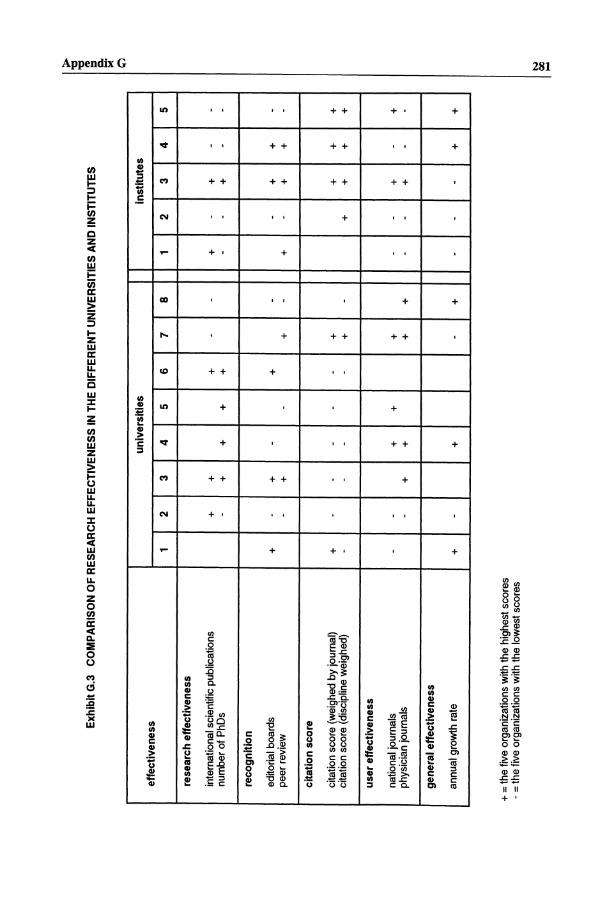
Exh
ibit
G.3
C
OM
PAR
ISO
N O
F R
ESE
AR
CH
EFF
EC
TIV
EN
ESS
IN
TH
E D
IFFE
RE
NT
UN
IVE
RSI
TIE
S A
ND
IN
STIT
UT
ES
effe
ctiv
enes
s
rese
arch
ef
fect
iven
ess
inte
rnat
iona
l sc
ient
ific
pub
lica
tion
s nu
mbe
r of
PhO
s
reco
gniti
on
edit
oria
l bo
ards
pe
er
revi
ew
cita
tion
scor
e
cita
tion
sco
re
(wei
ghed
by
jou
rnal
) ci
tati
on s
core
(d
isci
plin
e w
eigh
ed)
user
eff
ectiv
enes
s
nati
onal
jo
urna
ls
phys
icia
n jo
urna
ls
gene
ral
effe
ctiv
enes
s
annu
al
grow
th r
ate
L-
__
__
__
__
_
+ =
the f
ive
orga
niza
tion
s w
ith
the
high
est
scor
es
-= the
fiv
e or
gani
zati
ons
wit
h th
e lo
wes
t sc
ores
1 +
+ - - +
univ
ersi
ties
2 3
4 5
+
+
-+
+
+
-+
-
-+
-
--
--
--
-+
+
-+
+
-+
inst
itute
s
6 7
8 1
2 3
4
+
--
+
-+
-
+
--
+
-
+
--
+
+
+
-+
-
+
+
-+
+
+
-
+
-+
+
+
+
--
+
-+
+
--
+
-
-+
-
--
+
_.-
> 1 Q
. ~.
c;':l
5 - - - - +
+
I I I
+
I
-i !
-~
~ ""'
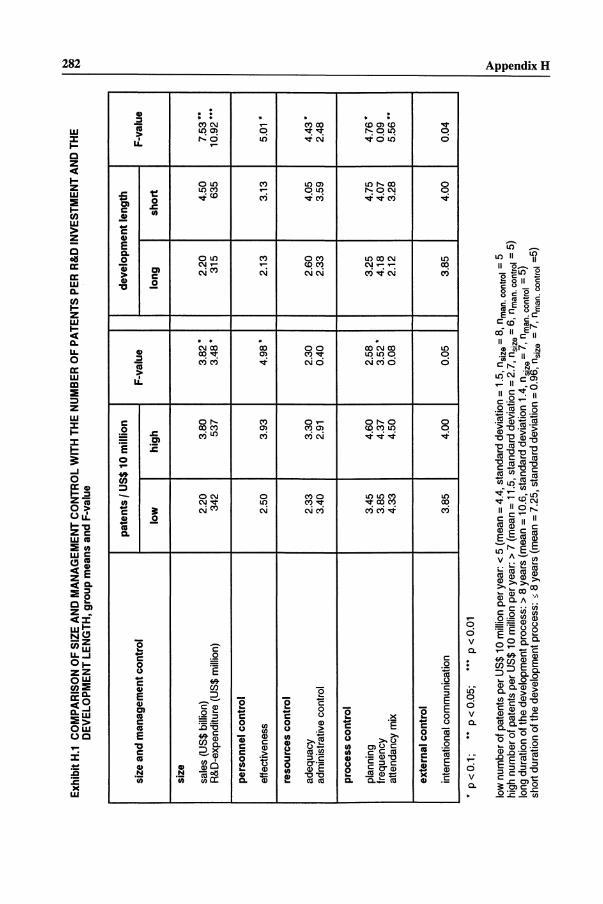
Exh
ibit
H.1
C
OM
PAR
ISO
N O
F SI
ZE
AN
D M
AN
AG
EM
EN
T C
ON
TR
OL
WIT
H T
HE
NU
MB
ER
OF
PAT
EN
TS
PER
R&
D I
NV
EST
ME
NT
AN
D T
HE
D
EV
EL
OPM
EN
T L
EN
GT
H, g
roup
m
eans
an
d F-
valu
e
pate
nts
I US$
10
mill
ion
deve
lopm
ent
leng
th
size
and
man
agem
ent
cont
rol
F-va
lue
low
hi
gh
long
size
sale
s (U
S$ b
illi
on)
2.20
3.
80
3.8
2"
2.20
R
&D
-exp
endi
ture
(U
S$ m
illi
on)
342
537
3.4
8"
315
pers
onne
l co
ntro
l
effe
ctiv
enes
s 2.
50
3.93
4
.98
" 2.
13
reso
urce
s co
ntro
l
adeq
uacy
2.
33
3.30
2.
30
2.60
ad
min
istr
ativ
e co
ntro
l 3.
40
2.91
0.
40
2.33
proc
ess
cont
rol
plan
ning
3.
45
4.60
2.
58
3.25
fr
eque
ncy
3.85
4.
37
3.5
2"
4.18
at
tend
ancy
m
ix
4.33
4.
50
0.08
2.
12
exte
rnal
co
ntro
l
inte
rnat
iona
l co
mm
unic
atio
n 3.
85
4.00
0.
05
3.85
-------
• p
< 0
.1 ;
••
P
< 0
.05;
..
. P
< 0
.01
low
num
ber
of p
aten
ts
per
US
$ 10
mil
lion
per
yea
r:
< 5
(m
ean
= 4
.4,
stan
dard
de
viat
ion
= 1
.5,
nsiz
e =
8,
nm
an. c
ontr
ol
= 5
hi
gh n
umbe
r of
pat
ents
pe
r U
S$
10 m
illi
on p
er y
ear:
>
7 (
mea
n =
11.
5, s
tand
ard
devi
atio
n =
2.7
, ns
ize
= 6
, n
man
. con
trol
=
5)
long
dur
atio
n of
the
dev
elop
men
t pr
oces
s:
> 8
yea
rs
(mea
n =
10.
6, s
tand
ard
devi
atio
n 1.
4, n
ize
= 7
, n
man
. con
trol
=
5)
shor
t du
rati
on o
f th
e de
velo
pmen
t pr
oces
s:
$ 8
year
s (m
ean
= 7
.25,
st
anda
rd
devi
atio
n =
0.9~,
nsiz
e =
7,
n man
. con
trol
=
5)
shor
t 4.50
63
5
3.13
4.05
3.
59
4.75
4.
07
3.28
4.00
F-va
lue
7.5
3""
10
.92
"""
5.01
"
4.4
3"
2.48
4.7
6"
0.09
5.
56 "
.
0.04
...
~ ~
> 'C
'C
t!> a ~. ::r:
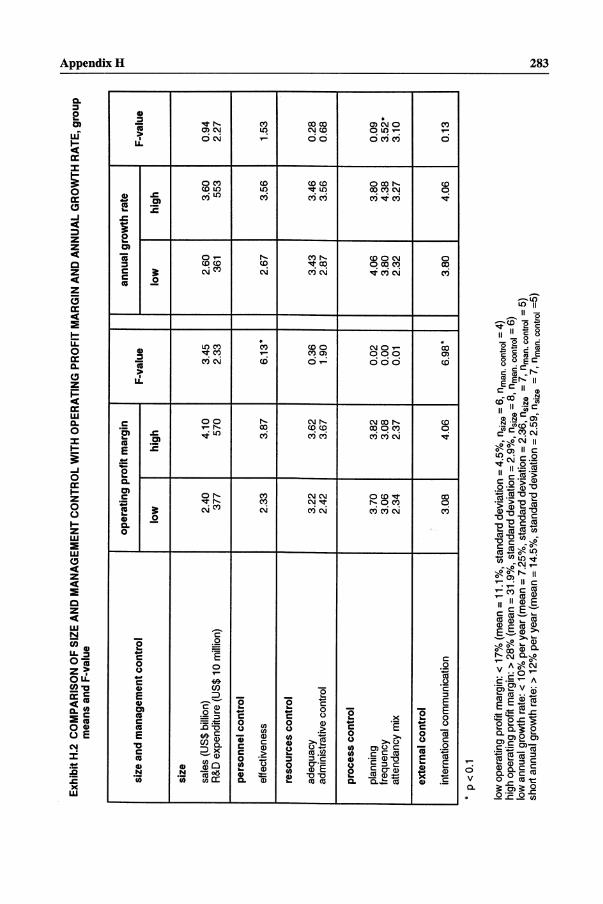
>
Exh
ibit
H.2
CO
MPA
RIS
ON
OF
SIZ
E A
ND
MA
NA
GE
ME
NT
CO
NT
RO
L W
ITH
OPE
RA
TIN
G P
RO
FIT
MA
RG
IN A
ND
AN
NU
AL
GR
OW
TH
RA
TE
, gro
up
l:g m
eans
an
d F-
valu
e ~
oper
atin
g pr
ofit
mar
gin
size
and
man
agem
ent
cont
rol
F-va
lue
low
hi
gh
size
sale
s (U
S$ b
illi
on)
2.40
4.
10
3.45
R
&D
exp
endi
ture
(U
S$ 1
0 m
illio
n)
377
570
2.33
pers
onne
l co
ntro
l
effe
ctiv
enes
s 2.
33
3.87
6
.13
'
reso
urce
s co
ntro
l
adeq
uacy
3.
22
3.62
0.
36
adm
inis
trat
ive
cont
rol
2.42
3.
67
1.90
proc
ess
cont
rol
plan
ning
3.
70
3.82
0.
02
freq
uenc
y 3.
06
3.08
0.
00
atte
ndan
cy
mix
2.
34
2.37
0.
01
exte
rnal
co
ntro
l
inte
rnat
iona
l co
mm
unic
atio
n 3.
08
4.06
6
.98
'
* p
< 0
.1
low
ope
rati
ng
prof
it m
argi
n:
< 1
7% (
mea
n =
11.
1 %
, st
anda
rd
devi
atio
n =
4.5
%,
nsiz
e =
6,
nm
an. c
ontr
ol =
4)
high
ope
rati
ng
prof
it m
argi
n:
> 2
8% (
mea
n =
31.
9%,
stan
dard
de
viat
ion
= 2
.9%
, ns
ize
= 8
, n
man
. con
trol
=
6)
low
ann
ual
grow
th r
ate:
<
10%
per
yea
r (m
ean
= 7
.25%
, st
anda
rd
devi
atio
n =
2.3
6,
nsiz
e =
7,
nm
an. c
ontr
ol
= 5
) sh
ort
annu
al
grow
th r
ate:
>
12%
per
yea
r (m
ean
= 1
4.5%
, st
anda
rd
devi
atio
n =
2.5
9,
nsiz
e =
7,
nm
an. c
ontr
ol
=5)
Q.
~.
annu
al g
row
th
rate
==
F-
valu
e lo
w
high
2.60
3.
60
0.94
36
1 55
3 2.
27
, I
2.67
3.
56
1.53
3.43
3.
46
0.28
I
2.87
3.
56
0.68
4.06
3.
80
0.09
3.
80
4.38
3
.52
' 2.
32
3.27
3.
10
3.80
4.
06
0.13
~ ~
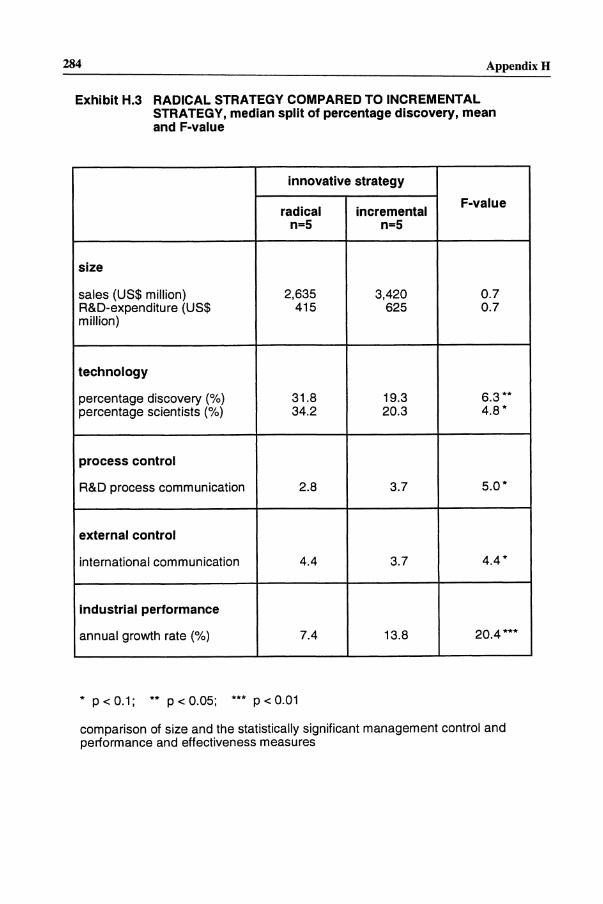
284 AppendixH
Exhibit H.3 RADICAL STRATEGY COMPARED TO INCREMENTAL STRATEGY, median split of percentage discovery, mean and F-value
innovative strategy
radical incremental F-value
n=5 n=5
size
sales (US$ million) 2,635 3,420 0.7 R&D-expenditure (US$ 415 625 0.7 million)
technology
percentage discovery (%) 31.8 19.3 6.3 ** percentage scientists (%) 34.2 20.3 4.8 *
process control
R&D process communication 2.8 3.7 5.0*
external control
international communication 4.4 3.7 4.4*
industrial performance
annual growth rate (%) 7.4 13.8 20.4 ***
* p < 0.1; ** p < 0.05; *** P < 0.01
comparison of size and the statistically significant management control and performance and effectiveness measures
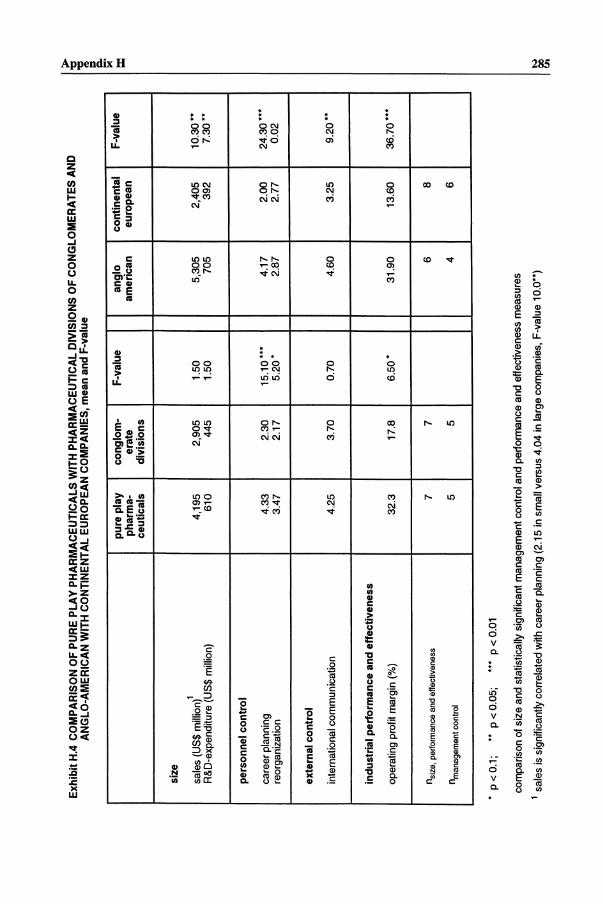
Exh
ibit
H.4
CO
MPA
RIS
ON
OF
PUR
E P
LA
Y P
HA
RM
AC
EU
TIC
AL
S W
ITH
PH
AR
MA
CE
UT
ICA
L D
IVIS
ION
S O
F C
ON
GL
OM
ER
AT
ES
AN
D
AN
GL
O-A
ME
RIC
AN
WIT
H C
ON
TIN
EN
TA
L E
UR
OPE
AN
CO
MPA
NIE
S, m
ean
and
F-va
lue
pure
pla
y co
nglo
m-
F-va
lue
angl
o ph
arm
a-er
ate
amer
ican
ce
utic
als
divi
sion
s
size
sale
s (U
S$ m
illio
n)1
4,19
5 2,
905
1.50
5,
305
R&
D-e
xpen
ditu
re
(US$
mill
ion)
61
0 44
5 1.
50
705
pers
onne
l co
ntro
l
care
er
plan
ning
4.
33
2.30
15
.10
•••
4.17
re
orga
niza
tion
3.47
2.
17
5.2
0'
2.87
exte
rnal
co
ntro
l
inte
rnat
iona
l co
mm
unic
atio
n 4.
25
3.70
0.
70
4.60
indu
stri
al
perf
orm
ance
an
d ef
fect
iven
ess
oper
atin
g pr
ofit
mar
gin
(%)
32.3
17
.8
6.5
0'
31.9
0
nsize
, pe
rform
ance
an
d ef
fecti
vene
ss
7 7
6
nman
agem
ent
cont
rol
5 5
4
------
• p
< 0
.1;
••
p <
0.0
5;
•••
P <
0.0
1
com
pari
son
of s
ize
and
stat
istic
ally
si
gnif
ican
t m
anag
emen
t co
ntro
l an
d pe
rfor
man
ce
and
effe
ctiv
enes
s m
easu
res
1 sa
les
is si
gnif
ican
tly c
orre
late
d w
ith c
aree
r pl
anni
ng
(2.1
5 in
sm
all
vers
us
4.04
in l
arge
com
pani
es,
F-va
lue
10
.0")
cont
inen
tal
euro
pean
2,40
5 39
2
2.00
2.
77
3.25
13.6
0 8 6
F-va
lue
10.3
0 ••
7
.30
"
24.3
0 ••
• 0.
02
9.20
••
36.7
0 ••
•
~
'i 5. ~. =: N
ffi

APPENDIX I
Base-line description of the industrial study sample
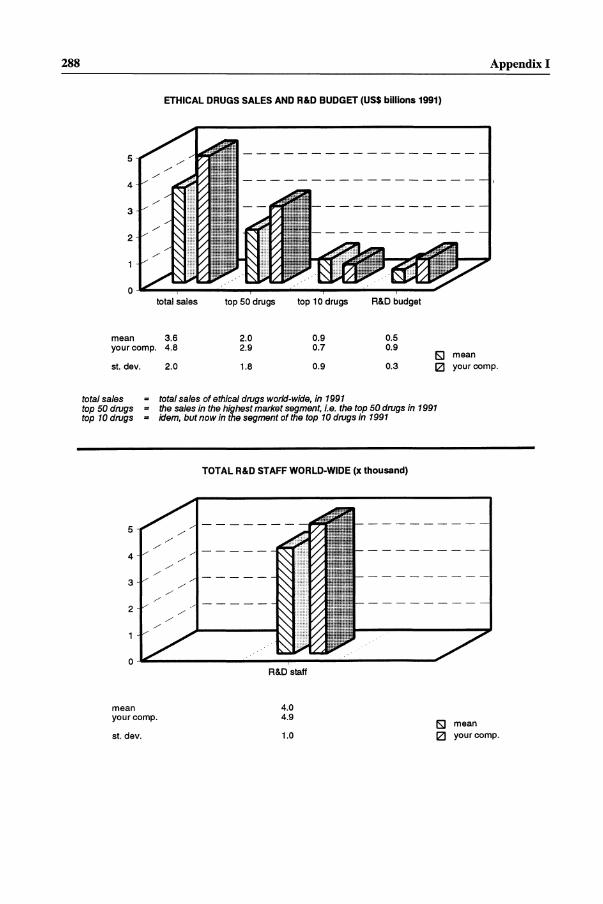
288
ETHICAL DRUGS SALES AND R&D BUDGET (US$ billions 1991)
5
4
3
2
o~--~----------~--------~--------~----~ total sales
mean 3.6 your compo 4.8
top 50 drugs
2.0 2.9
top 10 drugs
0.9 0.7
R&D budget
0.5 0.9
IS:] mean
Appendix I
sl. dey. 2.0 1.8 0.9 0.3 IZI your compo
total sales total sales of ethical drugs world-wide. in 1991 top 50 drugs = the sales in the highest market segment. i.e. the top 50 drugs in 1991 top 10 drugs idem. but now in the segment of the top 10 drugs in 1991
5
/'
4
/'
3
/'
2
/'
0
mean yourcomp.
sl. dey.
/' /'
/' /'
/' /'
/' /'
TOTAL R&D STAFF WORLD-WIDE (x thousand)
- - -
- - -
- - -
- -
- -
- -
R&D staff
4.0 4.9
1.0 IS:] mean IZI your compo
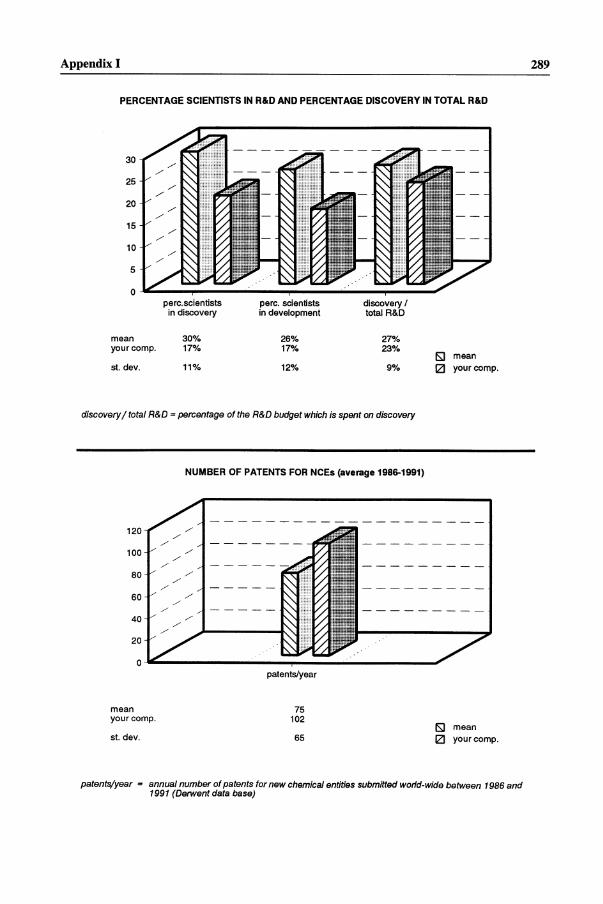
Appendix I
PERCENTAGE SCIENTISTS IN R&D AND PERCENTAGE DISCOVERY IN TOTAL R&D
30
25
20
15
10
5
o~----~----------~------~----~----~
mean yourcomp.
sl. dev.
perc.scientists in discovery
30% 17%
11%
perc. scientists in development
26% 17%
12%
discovery I total R&D
27% 23%
9%
discovery/total R&D = percentage of the R&D budget which is spent on discovery
120
100
80
60
40
20
0
mean yourcomp.
sl. dev.
./
./
./
./
./
./
./
./
./
NUMBER OF PATENTS FOR NCEs (average 1986-1991)
./
./
./
./
./
patents/year
75 102
65
ISJ mean IZl your compo
ISJ mean IZl your compo
patents/year = annual number of patents for new chemical entities submitted world-wide between 1986 and 1991 (Derwent data base)
289

290 Appendix I
LENGTH OF PHARMACEUTICAL AND CLINICAL DEVELOPMENT (years)
mean your company
standard deviation
9.4 7.0
2.1 lSI mean IZI your company
length of pharmaceutical and clinical development 2 the average development time of a new drug, not including drugs with a relatively short development time (such as antibiotics) nor with a relatively long development time (such as anti-psychotics)
ANNUAL GROWTH RATE AND OPERATING PROFIT MARGIN
40%
35 /' /'
30 /' /' /'
25 /' /'
20 /' /'
15 /'
10
5
o
/'
annual growth rate
mean your company
standard deviation
11% 13%
4%
operating profit margin
24% 36%
11% lSI mean IZl your company
annual growth rate = annual growth rate of the company, both organic growth and growth by acquisition between 1986 and 1991
operating profit margin = pretax profit to turnover rate in 1991
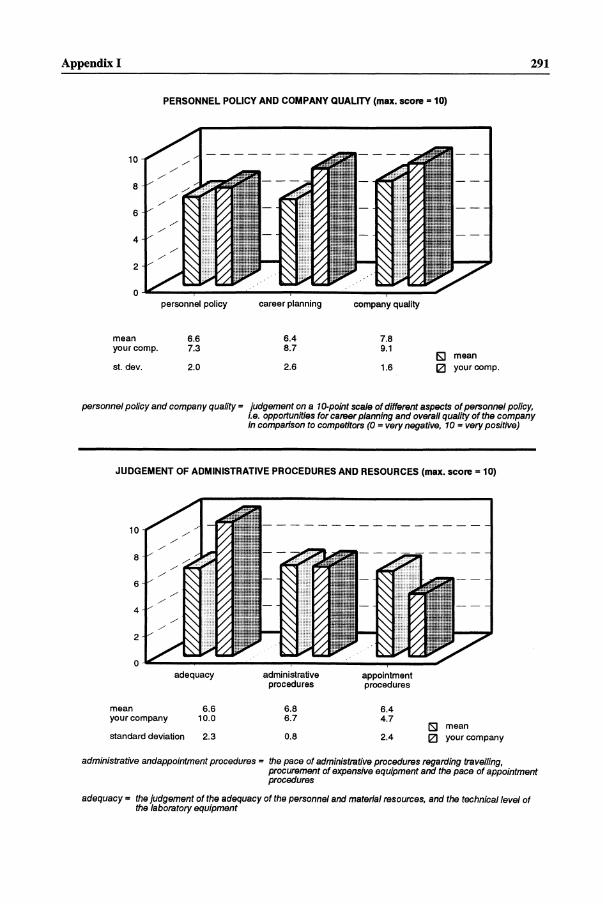
Appendix I
PERSONNEL POLICY AND COMPANY QUALITY (max. score = 10)
10
8
6
4
2
o~----~----------~------------~----~
mean yourcomp.
st. dev.
personnel policy
6.6 7.3
2.0
career planning
6.4 8.7
2.6
company quality
7.8 9.1
1.6 ISJ mean IZI your compo
291
personnel policy and company quality = judgement on a to-point scale of different aspects of personnel policy, i.e. opportunities for career planning and overall quality of the company in comparison to competitors (0 = very negative, to - very positive)
JUDGEMENT OF ADMINISTRATIVE PROCEDURES AND RESOURCES (max. score = 10)
10
8
6
4
2
o~----------------~------------~----~ adequacy
mean 6.6 your company 10.0
standard deviation 2.3
administrative procedures
6.8 6.7
0.8
appointment procedures
6.4 4.7
2.4 lSI mean IZI your company
administrative andappointment procedures = the pace of administrative procedures regarding travelling, procurement of expensive equipment and the pace of appointment procedures
adequacy = the judgement of the adequacy of the personnel and material resources, and the technical level of the laboratory equipment
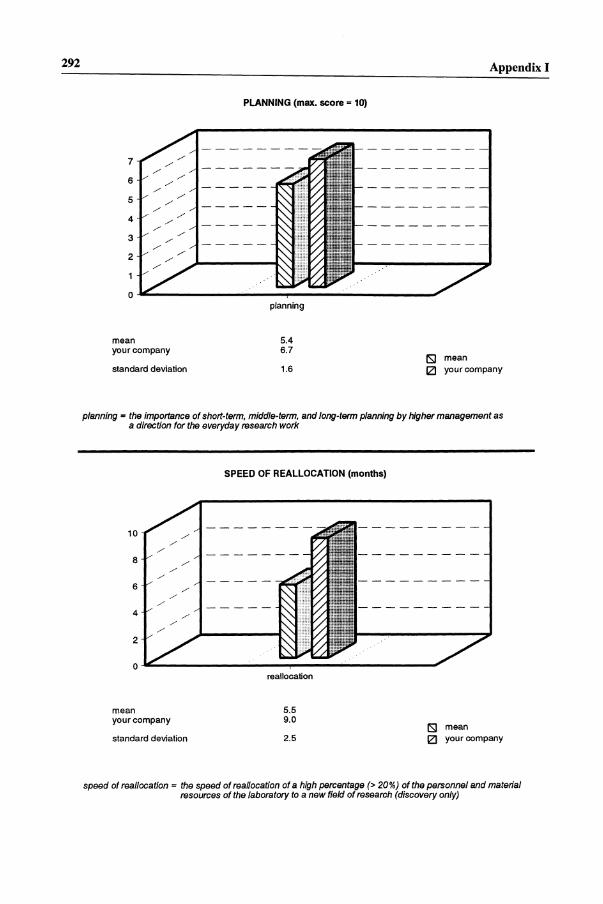
292 Appendix I
PLANNING (max. score = 10)
7
6 /' /'
/' --- --5 /'
/' --- --/'
4 /' /' --- - -/'
3 /' /' --- - -/'
2 /' /'
o~----------------~------------------~
mean your company
standard deviation
planning
5.4 6.7
1.6 lSI mean IZI your company
planning = the importance of short-term. middle-term. and long-term planning by higher management as a direction for the everyday research work
10 /' /'
/'
8 /' /'
/'
6 /' /'
/'
4 /' /'
/'
2
0
mean your company
standard deviation
SPEED OF REALLOCATION (months)
-----
-----
reallocation
5.5 9.0
2.5 lSI mean IZI your company
speed of reallocation = the speed of reallocation of a high percentage (> 20%) of the personnel and material resources of the laboratory to a new field of research (discovery only)
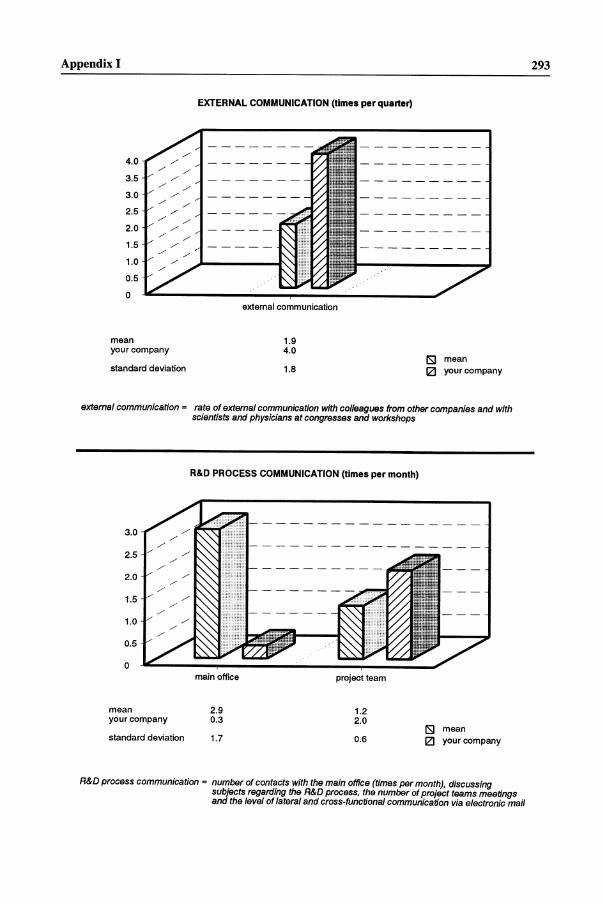
Appendix I
4.0
3.5
3.0
2.5
2.0
1.5
1.0
0.5
o
mean
/' /'
/' /' /'
/' /'
/' /'
your company
standard deviation
EXTERNAL COMMUNICATION (times per quarter)
external communication
1.9 4.0
1.8 lSI mean IZI your company
external communication = rate of external communication with colleagues from other companies and with scientists and physicians at congresses and workshops
3.0
2.5
2.0
1.5
1.0
0.5
o
mean your company
standard deviation
R&D PROCESS COMMUNICATION (times per month)
main office
2.9 0.3
1.7
project team
1.2 2.0
0.6 lSI mean IZI your company
R&D process communication = number of contacts with the main office (times per month), discussing sUbjects regarding the R&D process, the number of project teams meetings and the level of lateral and cross-functional communication via electronic mail
293
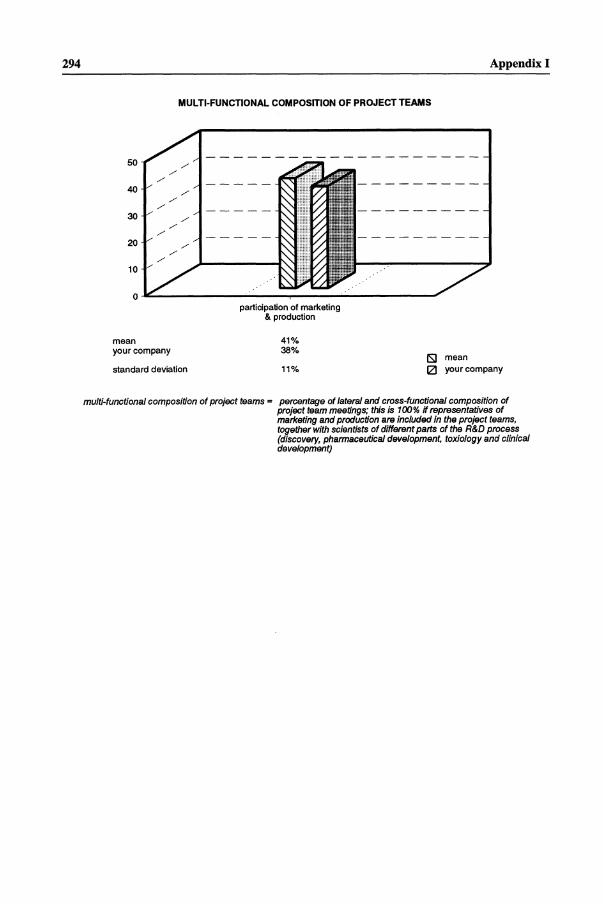
294 Appendix I
MULTI-FUNCTIONAL COMPOSITION OF PROJECT TEAMS
50 /' /'
/'
40 /' /'
/'
30 /' /'
/'
20 /' /'
/'
10
0
mean your company
standard deviation
-----
-----
-----
participation of marketing & production
41% 38%
11% CSJ mean IZI your company
multi-functional composition of project teams = percentage of lateral and cross-functional composition of project team meetings; this is 100% if representatives of marketing and production are included in the project teams, together with scientists of different parts of the R&D process (discovery, pharmaceutical development, toxiology and clinical development)


![Copyright page: © [2013] Ahmet Bayraktar ALL RIGHTS RESERVED](https://img.pdfslide.us/doc/110x75/62746faffb6d1b4c2e3c06e4/copyright-page-2013-ahmet-bayraktar-all-rights-reserved.jpg)