Embed Size (px)
Citation preview

8/2/2019 Reference spm
http://slidepdf.com/reader/full/reference-spm 1/7
PHYSICAL REVIEW A VOLUME 17, NUMBER 4 APRIL 1978
Self-phase-modulation in silica optical fibers
R. H. Stolen and Chinlon Lin
Bell Telephone Laboratories, Holmdel, New Jersey 07733
(Received 10 October 1977)
%e report measurements of frequency broadening due to self-phase-modulation (SPM) in optical fibers.
The use of single-mode silica-core fibers and mode-locked argon-laser pulses leads to the simplest and
cleanest measurements yet made of SPM. The qualitative features of the frequency spectrum are i' goodagreement with theoretical expectations. The experiment provides an independent measurement of n2, ,the self-
focusing coeAicient. The results also point to some simple and useful techniques based on fibers f6r the
measurement and analysis. of mode-locked laser pulses.
I. INTRODUCTION
An intensity-dependent refractive index leads to
self-focusing and phase modulation within a singleoptical pulse. In fibers, any additional confine-ment caused by self-focusing is negligible, but asmall phase retardation at the peak of the pulsewith respect to the leading and trailing edges will
add up in a long fiber and result in sizable phasemodulation. The frequency broadening associatedwith this phase modulation will, in combination
with group-velocity dispersion, increase the pulsespreading. Since pulse spreading limits the in-
formation rate in a fiber transmission system,self-phase-modulation will be an important power-limiting nonlinear process in high-capacity single-mode fibers.Self-phase-modulation (SPM) was first observed
as a modulated spectrum extending both above. andbelow the laser frequency after self-focusing had,occurred in a liquid-filled cell and was explainedas phase modulation due to the intensity dependent
refractive index by Shimizu. ' Because this pro-cess took place in self-focused filaments, the in-
tensity was high and there were problems with
competing nonlinear effects and uncertainties con-cerning the filament size. Self-phase-modulationwas obtained in the absence of self-trapping orself-focusing and at low powers by using CS,-filledglass fibers. ' Analysis of the measured frequency
spectrum was complicated, however, because ofthe multimode nature of the liquid-filled fiber and
because the 2.5-ps half-width of the optical pulsewas comparable to the relaxation time of the non-
linearity in CS,.In this paper we report measurements of fre-
quency broadening of mode-locked argon-laserpulses due to SPM in single-mode silica-core fi-bers. Because of the stability of the system it waspossible to slowly increase the optical power and
observe clearly the development of the broadened
spectrum. Analysis is simplified because the re-
laxation time of the nonlinearity in glass is much
faster than the pulse length. ' The qualitative fea-tures of the frequency spectrum are in good agree-ment with theoretical expectations and the mea-sured nonlinear coefficient agrees well with valuesobtained by other techniques. . Typically, in our100-m single-mode fibers the frequency bandwidth
increases by a factor of 3.0 for a peak power of
about 3 W.
II. EXPERIMENTAL
MODE-LOCKED
5145A
Ml Ll
I I
y-V
ISOLATOR 116m
L2 M2
pi PHOTO-
DIODE
FP~ FP2
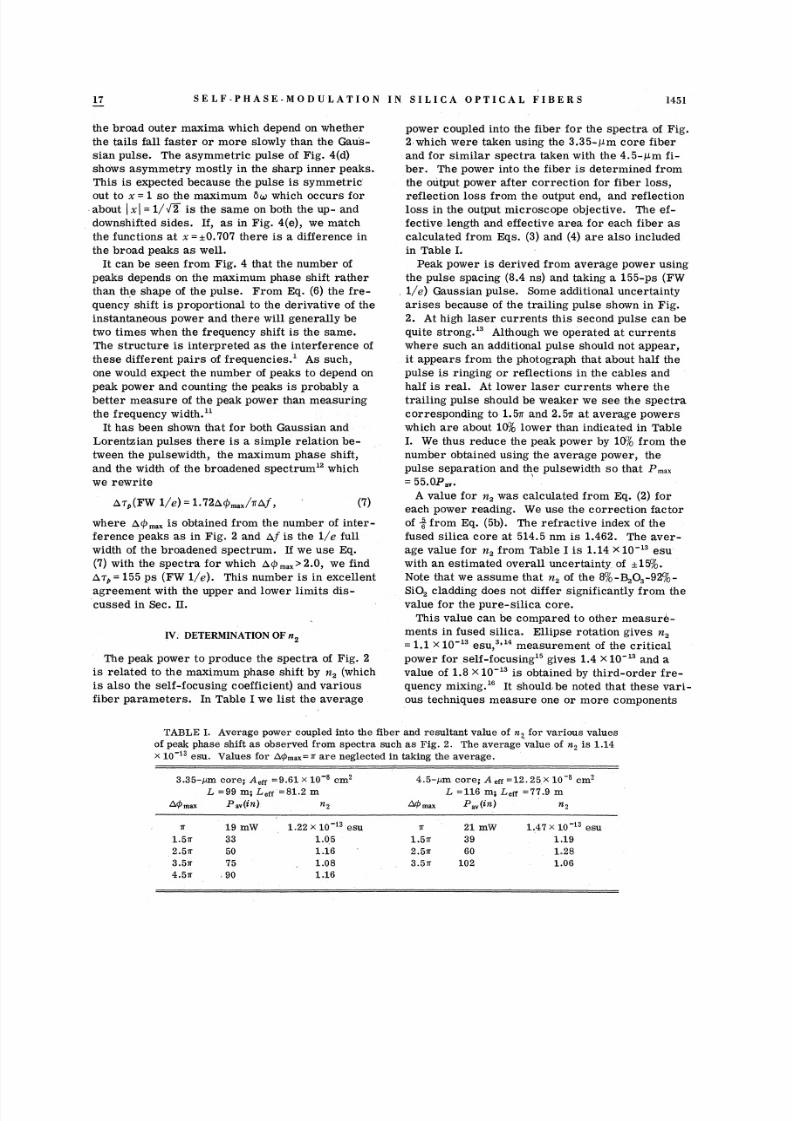
FIG. 1. Experimental arrangement.
The experimental arrangement is illustrated in
Fig. 1. The argon-ion laser operates at 514.5 nm
and is mode-locked with an acousto-optic. cell andrf driver. Reflections from the lenses and fiberends as well as backward scattered Rayleigh lightfrom the fiber broaden the mode-locked pulse soan isolator consisting of a Faraday rotator and two
polarizers was inserted between the laser and fi-
ber. Light is coupled in and out of the fiber with20~ microscope objectives.Measurements were made on two silica-core,
borosilicate-clad fibers. The first fiber was 116m long and had a core diameter of 4.5 p m, a char-acteristic number V' of 4.0, and a loss at 514.5nm of 32 dB/km. While this fiber supported two
modes it was possible by careful coupling to exciteonly the fundamental LI'py mode. The second fiberwas 99 m long with a 3.35-pm core diameter, a V
number of 2.53, and a loss of 17 dB/km.The frequency spectrum of the input pulse was
measured with a scanning confocal Fabry-Perot
17 1448 1978 The American Physical Society

8/2/2019 Reference spm
http://slidepdf.com/reader/full/reference-spm 2/7
17 . SE LF-P HASE-MOD 6 LATION IN SILICA. OPTICAL FIBERS 1449
200ps/div
PULSE SHAPE
0 05~ 1.5m'
2.5n
I
I
l 50.0GHz
FREQUENCY SPECTRUM
FIG. 2. Photographs of input pulse shape and theoutput. spectrum from a 3.35-pm silica-core fiber.Spectra are labeled by the maximum phase shift whichis proportional to peak power.
width observed.The pulse length is extremely dependent on the
mode-locker drive frequency. This frequency was
adjusted by maximizing the width of the broadened
spectrum.This was in
fact amore convenient
method of "peaking up" the mode locker than the
conventional technique of observing the pulse dura-tion with a fast diode and sampling oscilloscope.After each of the photographs in Fig. 2- was
taken, the average power out of the fiber was mea-sured. The peak power at the beginning of the fi-ber can then be deduced from the pulse width and
separation after correction for fiber loss and end. reflection. Mode strippers were used at the be-ginning and end of the fiber to remove unwanted
cladding light.The core-cladding boundaries of the fibers were
reasonably sharp and the mode profiles were ap-
proximated by the LPO, mode of step index fibers.'
The mode profile and its corresponding far fieldpattern were first calculated using measured val-ues of core size and index difference. There issome uncertainty in any measurement of the coresize of such small fibers and the numbers werechecked by comparing measured and calculated farfield patterns. This usually resulted in an increasein the value for the core diameter by about 10%%uo.
interferometer with a 10-GHz free spectral range.The spectrum after the fiber was measured with apiezoelectrically scanned planar Fabry- Perotwhich was set for a free spectral range of 115.3GHz. The confocal Fabry-Perot resolved the in-
dividual axial modes of the mode-locked laserwhile the resolution of the planar Fabry-Perot wasabout —, of the laser linewidth. Figure 2 shows
photographs of the output spectrum from the 3.35-pm fiber at different powers as displayed on an
oscilloscope. The power was varied by changingthe input coupling. Spectra are labeled by the max-imum phase shift which is proportional to peakpower and will be discussed in greater detail later.The unbroadened laser linewidth is 4.6 6Hz (FW1/e).The duration of the mode-locked pulse was mea-
suredusing a
silicon PIN photodiode withare-
sponse time of about 50 ps. A photograph of the
pulse as seen on a sampling oscilloscope is in-cluded in Fig. 2. The measured 1/e pulse width is190 ps so if we assume a Gaussian pulse and aGaussian detector response this sets an upper lim-it to the pulse width of 180 ps (FW 1/e). The lower
limit is the transform of a 4.6-GHz Gaussian pulsewhich would be 140 ps (FW 1/e). The pulse wasmeasured before and after the fiber at both low and
high power with no difference in pulse shape or
III. FREQUENCY SPECTRUM
The frequency spectrum after self-phase-modu-lation is given by the Fourier transform of the
pulseamplitude"':
F( )'
P(t) 1/2 t 6${t) t{&-(do) t -dt2r
The, phase shift b, P(t) in a lossless fiber is pro-, portional to the fiber length L and the intensity-dependent refractive index 6n which in turn is pro-portional to the intensity:
~y(t) = (2~a, /~){)n,
5n =-.n, Z',
E' = 10'[St{P(t)/ncA„,,(2a)
(2b)
(2c)
where n, is the coefficient for self-focusing in esu,A,
is the vacuum wavelength, n is the refractive in-dex, E is the peak field amplitude in cgs units, and
J'(t) is the pump power in watts.Because of linear absorption (n) in the fiber, I
is replaced by an effective length which is lessthan the actual fiber length:
L .1 -ctI,
L {tff e dl=nl
0
The effective area A, ff is the same as for stimu-lated Baman or Brillouin scattering in a single-

8/2/2019 Reference spm
http://slidepdf.com/reader/full/reference-spm 3/7
R. - H. STOLEN AND CHINLON LIN 17
mode fiber' and is determined by an integral overthe mode field $(r, 6).
(I)"r chd8 .
(4)
The effective area as defined by Eq. (4) is reason-ably close to the fiber core area (4,). For V
=2.53, A,«=1.09A, and for V=4.0, A,ff 0 VVA, .In both cases we assume the modes are the LPpymodes of a step-index fiber.Equatfon (2) assumes that linear polarization is
maintained in the fiber. Actually, the polarizationis completely scrambled in both the fibers which
reduces 5n. We can, however, arrive at a suit-able correction factor by averaging the values of6n-for linear and circular polarizations. In silica,n, is dominated by the electronic contribution so
to a good approximation':5n(circular) =—, 5n(linear)
so that
5n(average) =—e'5n(linear) .
(»)
(5b)
Although we have not done so it is possible to in-clude the effects of a linear chirp on the frequencyspectrum. This would be done by multiplyingP(t)'~ in Eq. (1) by the term e' '~', where p is re-lated to the amount of chirp. "Calculated frequency spectra are shown in Fig.
3 for Gaussian pulses with different peak powers.We have plotted the curves for which ~(I) is in
integral units of &m. It can be seen that the photo-graphs in Fig. 2 are in good agreement with the
calculated spectra. The photographs in Fig. 2were taken at powers for which the spectramatched the calculated curves of Fig. 3. The max-ima and minima at hu = 0 do not occur exactly atpeak phase shifts of 2m, but the error ranges from
only 1.5% at 1.5)( to 0.3% at 4.5)(.While the measured frequency spectra and those
Because of SI'M the leading edge of the pulse isdownshifted in frequency and the trailing edge isupshifted. If the pulse is asymmetric in time the
maximum 5+ from Eq. (6) will differ between the
upshifted and downshifted sides so one would ex-pect an asymmetric broadened spectrum.One would also expect that non-Gaussian pulses
would broaden slightly differently than thespectrafor the Gaussian pulse shown in Fig. 3. To ex-
amine this question and the effect of asymmetry,we calculated broadened frequency spectra forsome non-. Gaussian pulses. To do this we choosea pulse which is Gaussian around x=0. The lead-ing or trailing ends, however, can be Gaussian
(e"), fall off faster than Gaussian (ae ' * '), or
fall more slowly than Gaussian (ce d" ). The con-stants a, b, c, and d are fixed by requiring con-
tinuity of the functions and their derivatives atsome'particular value of x. In Fig. 4 we plot fre-quency spectra for several such pulses choosingmaximum phase shifts of 1.5m and 4.5m. The func-
tions are givenon
the left side of the figure. Fig-ures 4(b) and 4(c) show that there are differencesbetween the heights of the sharp inner peaks and
(a) e-xele-xel e-xe
(b) aebx le-x lae bxe QVQ
(c) cedxIe-xelce-dx
calculated for a Gaussian pulse agree very well,there is some difference in that the measuredspectra show some asymmetry. This asymmetrycan be qualitatively understood to arise fromasymmetry in the pulse shape. The approximatefrequency shift at time (t) is given by the time de-rivative of the phase perturbation which is propor-tional to the power. '
sap 2mI, 85n5(x) t
et A. Bt
I-CA
Z 0I-
0.5 w' 1.5 m'
(d) aebxele-xelce-dx
(e) aebx le x Ice dx
l.5 m' 4.5 m'
2.5 m 3.5 m
FREQUENCY
FIG. 3. Calculated frequency spectra for a Gaussianpulse. Spectra are labeled by maximum phase shift; atthe peak of the pulse.
FIG. 4. Comparison of frequency spectra from self-phase-modulation between a Gaussian pulse and a num-ber of non-Gaussian and asymmetric pulses. Only
spectra for peak phase shifts of 1.5n and 4.5e areplotted. In (b), (c), and (d) the functions are matchedat x'=+ 1.0 so a=e '~3~, b= 0.667,c=e, d=2.0. In Ethe boundary is x=+ 0.7 and a=e 6~3 b= 0 952 c=e'd= 1.4.
8/2/2019 Reference spm
http://slidepdf.com/reader/full/reference-spm 4/7
SELF-PHASE-MODULATION IN/
SILICA OPTICAL FIBERS
the broad outer maxima which depend on whether
the tails fall faster or more slowly than the Gaus-
sian pulse. The asymmetric pulse of Fig. 4(d)shows asymmetry mostly in the sharp inner peaks.This is expected because the pulse is symmetric'out to x = 1 so the maximum 5& which occurs forabout
~ x~= 1/W2 is the same on both the up- and
downshifted sides. If, as in Fig. 4(e), we match
the functions at x =~0.707 there is a difference in
the broad peaks as well.It can be seen from Fig. 4 that the number of
peaks depends on the maximum phase shift ratherthan the shape of the pulse. From Etl. (6) the fre-quency shift is proportional to the derivative of theinstantaneous power and there will generally betwo times when the frequency shift is the same.The structure is interpreted as the interference of
these different pairs of frequencies. ' As such,one would exyect the number of peaks to depend on
peak power and counting the peaks is probably abetter measure of the peak power than measuring
the frequency width. "It has been shown that for both Gaussian and
Lorentzian pulses there is a simple relation be-tween the pulsewidth, the maximum phase shift,and the width of the broadened spectrum" which
we rewrite
b.7~(FW 1/e) = 1.726$,„/vlf, (7)
IV. DETERMINATION OF n2
The peak power to produce the spectra of Fig. 2is related to the maximum phase shift by n, (whichis also the self-focusing coefficient) and variousfiber parameters. In Table I we list the average .
where b.Q, „
is obtained from the number of inter-ference peaks as in Fig. 2 and bf is the 1/e full
width of the broadened spectrum. If we use Eq.
(7)with the spectra for which
LQ&2.
0,we find
d v~= 155 ps (FW 1/e). This number is in excellent
agreement with the upper and lower limits dis-cussed in Sec. II.
power coupled into the fiber for the spectra of Fig.2 which were taken using the 3.35-pm core fiberand for similar spectra taken with the 4.5-pm fi-ber. The power into the fiber is determined fromthe output power after correction for fiber loss,reflection loss from the output end, and reflectionloss in the output microscope objective. The ef-fective. length and effective area for each fiber ascalculated from Egs. (3) and (4) are also included
in Table I.Peak power is derived from average power using
the pulse spacing (8.4 ns) and taking a 155-ps (FW, 1/e) Gaussian pulse. Some additional uncertainty
arises because of the trailing pulse shown in Fig.2. At high laser currents this second pulse can bequite strong. " Although we operated at currentswhere such an additional pulse should not appear,it appears from the photograph that about half the
pulse is ringing or reflections in the cables and
half is real. At lower laser currents where thetrailing pulse should be weaker we see the spectracorresponding to 1.5m and 2.5m at average powerswhich are about 1(@ lower than indicated in TableI. We thus reduce the peak power by 1(Y/o from the
number obtained using the average power, the
pulse separation and the pulsewidth so that I' .,= 55.0P,„.
value for n, was calculated from Eg. (2) foreach power reading. We use the correction factorof —,from Eq. (5b). The refractive index of thefused silica core at 514.5 nm is 1.462. The aver-age value for n, from Table I is 1.14 ~10 "esuwith an estimated overall uncertainty, of +15%.Note that we assume that n, of the 8/p-820&-92/p-
SiO, cladding does not differ significantly from thevalue for the pure-silica core.This value can be compared to other measure-
ments in fused silica. Ellipse rotation gives n,= 1.1 &&10 "esu, '"measurement of the criticalpower for self-focusing" gives 1.4 ~ 10 "and avalue of 1.8 x10 " is obtained by third-order fre-quency mixing. " It should be noted that these vari-ous techniques measure one or more components
TABLE I. Average power coupled into the fiber and resultant value of n2 for various valuesof peak phase shift as observed from spectra such as Fig. 2. The average value of n2-is 1.14
x 10~
esu. Values for Apm„=~are neglected in taking the average.
3.35-pm core; A,~z ——9.61x 10 cmL =99 m; I eff =81.2 m
&4 m~ &av(&n)
4.5-pm core; Aeff 12.25,x 10 8 cm2
116 ms &egg 77o9 m
4mm Py(in) n,
1.5r2.5m3.5x4.5m'
19 mW3350
75
90
1.22x10 ~3 esu1.051.161.081.16
1.5&.2.5x3.5x
21 mW
3960102
1.47x 10 ~3 esu1.191.281.06

8/2/2019 Reference spm
http://slidepdf.com/reader/full/reference-spm 5/7
1452 R. H. STOLEN AND CHIN LON LIN 17
of the third-order susceptibility tensor X,. Relat-ing n, to these components of X, involves certainapproximations which may be valid only to about
15%." Also X, itself contains both electronic and
Raman contributions" which are weighted slightly
differently depending on the specific measurement
technique and these corrections are usually
ignored. Finally, most of these techniques involve
seondary standards such as the Raman cross sec-tion of benzene which are. themselves uncertain.An important advantage of the self-phase-modu-
lation measurement of n, is that it involves no
secondary standards. The present experiment un-
fortunately does require some assumptions about
the components of X, which lead to the correctionfactor of Eq. (5). This is, however, not a funda-mental limitation since we could, in principle, use
a birefringent fiber which would maintain polariza-tion" so that this correction would not be needed.
We could, in fact, use such a birefringent fiber tocheck the accuracy of Eq. (5b) and thus gain addi-
tional information about the components of X3.
V. ANOMALOUS LOW-POWER EFFECTS
When the mode locker is slightly mistuned, we
see nonlinear effects on the frequency spectrumat powers well below those where broadening isobserved in Fig. 2. Figures 5(a)-5(c) show spec-tra with slight mistuning of the mode-locker forthree powers, The highest power [Fig. 5(c)] cor-responds to a maximum phase shift of approxi-mately 0.3v and the power for 5(b) and 5(a) de-
crease by factors of 2. For comparison, the fre-quency spectrum of the unbroadened pulse with
optimum mode locking is shown in Fig. 5(d), Foroptimum mode locking there is no change in the
frequency spectrum as power is increased until
I I I I I II I='5.0 GHz~
FIG. 5. Intensity-dependent narrowing and asymmetryfor slight mode-locker mistuning. Power is increasedby a factor of 2 from fa) to (b) and from (b) to (c). (1)shows the spectrum at low powers for optimum mode-
locking.
powers corresponding to about 0.5m are reached.This is what would be expected for a Gaussianpulse. Obviously, the measured spectrum is notquite Gaussian. The three-peak structure is prob-ably related to the weak second pulse seen in Fig.
The asymmetry in the low-power spectra both
in the optimized [5(d)] and mistuned [5(a)] cases isnot understood. It is not due to a nonlinear scanof the confocal Fabry-Perot because it is possibleto count the individual axial modes .of the laser in
the spectrum and verify that the scan is indeed
linear.There are two qualitative explanations for the
intensity dependent narrowing and asymmetry atthese low powers. When the mode locker is slight-ly mistuned the pulse length is longer than thetransform limit and some sort of chirp must exist.One possibility is that SPM in the fiber is cancel-ling some of this chirp and narrowing the frequen-
cy spectrum. Another possible explanation is thatthe low-frequency side of the spectrum is ampli-fied at the expense of the high-frequency sidethrough a low-frequency Raman cross section. A
transform-limited pulse could not be narrowed by
such a mechanism, - but it might be possible to re-duce the frequency width of a mistuned pulse.The difficulty with either of these explanations is
that the relevant susceptibilities appear to be toosmall to explain the observed effects. An intrigu-
ing possibility is that we are seeing the effect of arelaxation process in the vicinity of 1 cm '.
VI. CRITICAL POWER FOR FIBERTRANSMISSION
The combination of frequency broadening from
SPM and group velocity dispersion will increasethe pulse spreading in a long. fiber used for com-
munications. A critical length can be defined
where the high frequency part of the pulse is re-tarded by one pulse length with respect to the low-
frequency side. The expression for this criticallength is'
(8)
where D(A) =X'd'z/dX' is the dispersion, cT~ is thepulse length, and 6n
„is the maximum index
change. If we choose parameters relevant to our
3.35-pm fiber at the maximum phase. shift of 4.&rwe obtain z, = 1.5 km. This justifies our neglectof pulse spreading in the analysis of the data and
agrees with the result that the pulse length is un-
changed even at the highest powers. In calculating
Z„5n was obtained from AQ =4.5w by using
Eq. (2a). The dispersion D(A) =0.08 at 514.5 nm, "and the pulse length is 155 ps. At very high pow-
ers self-steepening should occur." For the pa-rameters in the present experiment, however, the

8/2/2019 Reference spm
http://slidepdf.com/reader/full/reference-spm 6/7
SELF-PHASE-MODULATION IN SILICA OPTICAL FIBERS 1453
self-steepening distance is three orders of magni-tude longer than Z, .'To evaluate the effect of SPM on a single-mode
fiber transmission system, it is somewhat simplerto define a critical power rather than a criticallength. If the capaci. ty of a single-mode fiber islimited by pulse dispersion, then any additional
broadening is undesirable so that we define criticalpower as that power for which the initial pulsedoubles in frequency width. From Fig. 2 the fre-quency width doubles at LQ = 2.0 so from Eq. (2)
(9)
Because of linear loss, most of the frequencybroadening takes place near the beginning of a longfiber while the pulse spreading takes place alongthe entire fiber.The critical
powerfrom
Eq. (9)for
a lengthof
3.3-pm 17-dB/km fiber would be 180 mW. Note
that in this case L =1/+=255 m from Eq. (3) andwe assume the fiber maintains linear polarization.
By way of comparison, the critical power for stim-ulated Raman scattering for the same fiber would
be 3 W. This illustrates that in a high-capacitysingle-mode fiber SPM may be the dominate non-
linear effect.
VII. CONCLUSION
Frequency broadenirig from self-phase-modula-tion has been observed in a single-mode silica core
fiber. The spectrum is in good agreement with
that calculated for a simple Gaussian pulse and the
nonlinear coefficient agrees well with previousmeasurements by different techniques.
By defining a critical power as that power forwhich the initial frequency width doubles it is seenthat SPM will be a significant effect at lower pow-
ers than the stimulated Raman effect and that SPM
will be important in high-capacity single-mode fi-ber transmission systems.The results also point to some simple and useful
techniques based on fibers for the measurementand analysis of mode-locked laser pulses. Max-
imizing the frequency width or the number of peaksof the broadened transmitted spectrum provides asimple and sensitive way of "peaking up" the mode-
locker drive frequency. The number of interfer-ence peaks combined with the frequency width pro-vides an accurate measure of pulse width. Finally,the qualitative features of the broadened spectrumshow up asymmetries and deviations from Gaussian
behavior of the mode-locked pulse itself.
ACKNOWLEDGMENTS
We are grateful to H. A. Haus for discussions on
the theory of self-phase-modulation; to A. Chvyoungand M. D. Levenson for discussions concerning the
self-focusing coefficient; to E. P. Ippen and D. J.Eilenberger for the silicon PIN diode and the
pulse-length measurement; and to W. Pleibel fortechnical assistance.
~F. Shimizu, Phys. Rev. Lett. 19, 1097 (1967).2E. P. Ippen, C. V. Shank, and T. K. Gustafson, Appl.Phys. Lett. 24, 190 (1974).
3A. Owyourg, R. W. Hellwarth and N. George, Phys.Rev. B 5, 628 (1972).
4D. Gloge, Appl. Opt. 10, 2252 (1971).5T.K. Gustafson, J.P. Taran, H. A. Haus, J.R. Lifsitz,and P. L. Kelley, Phys. Rev. 177, 306 (1969).
~R. A. Fisher and W. K. Bischel, J.Appl. Phys. 46, 4921(1975).
~R. H. Stolen and E. P. Ippen, Appl. Phys. Lett. 22, 276(1973).A. Owyoung, Ph.D. thesis, California Institute of
Technology, 1971 (unpublished); Clearinghouse forFederal Scientific and Technical Information ReportNo, .AFOSR- TR-71-3132 (unpublished).
C.C.Wang, Phys. Rev. 152, 149 (1966).H. A. Haus (private communication).
P. Cubeddu, R. Polloni, C. A. Sacchi, and O. Svelto,Phys. Rev. A 2, 1955 (1970).
C. H. Lin and T. K. Gustafson, IEEE J. QuantumElectron. 8, 429 (1972).
~BCoherept Radiation instruction manual for Model No.467 Mode-Locker (unpublished).
~4A. Owyoung, IEEE J. Quantum Electron. 9, 1064 (1973);Opt. Commun. 16, 266 (1976).W. L. Smith, J.H. Bechtel, and N. Bloembergen, Phys.Rev. B 12, 706 (1975).
~6M. D. Levenson, IEEE J.Quantum Electron. 10, 110'(1974).J. J. Song and M. D. Levenson, J. Appl. Phys. 48,3496 (1977).E. Snitzer and H. Osterberg, J.Opt. Soc.Am. 51, 499(1961);R. H. Stolen and A. Ashkin, Appl. Phys. Lett.22, 294 (1973); A. Papp and H. Harms, Appl. Opt. 14,2406 (1975).
~9D. Gloge, Appl. Opt. 10, 2442 (1971).F. DiMartini, C.H. Townes. T. K. Gustafson, and
P. L. Kelley, Phys. Rev. 164, 312 (1967).

8/2/2019 Reference spm
http://slidepdf.com/reader/full/reference-spm 7/7