Embed Size (px)
Citation preview
RSS Campanella Acculab 1
Reference Sound Source Calibration at
Different Temperatures and Altitudes.
Angelo Campanella--December 2000--- -Campanella AssociatesCompensation for environmental variables in the calibration
and the application of Reference Sound Sources.* Atmospheric temperature (site sound velocity).
* Barometric Pressure (site altitude)
RSS Campanella Acculab 2
Introduction
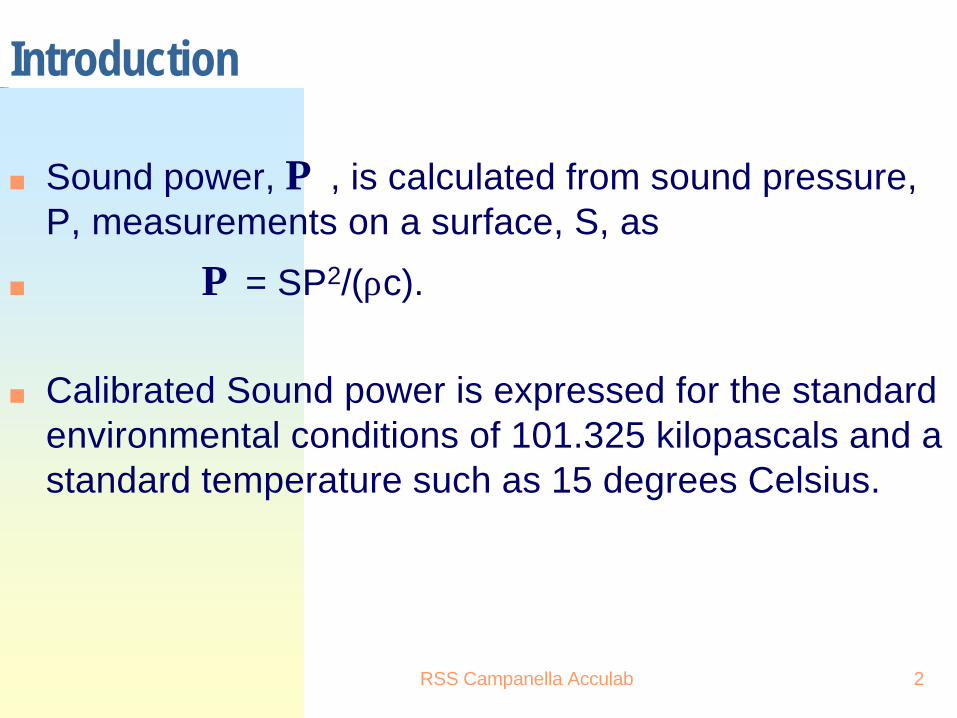
n Sound power, Π , is calculated from sound pressure, P, measurements on a surface, S, as
n Π = SP2/(ρc).
n Calibrated Sound power is expressed for the standard environmental conditions of 101.325 kilopascals and a standard temperature such as 15 degrees Celsius.
RSS Campanella Acculab 3
Real Life
n Calibration laboratories may not be at sea level or standard temperature.
n Practical test sites (where sound power emitted by a device under test is to be determined by the comparison method via an RSS) can be at higher elevations and outdoors at uncontrolled temperatures.
RSS Campanella Acculab 4
What This Meansn The sound pressure level (SPL) varies inversely
with altitude.
n The air density varies inversely with altitude
n For constant temperature, the sound power (being pressure squared divided by air density) varies inversely with altitude.
RSS Campanella Acculab 5
Barometric Pressure Experiment:n Barometric Pressure, B, directly affects the emitted
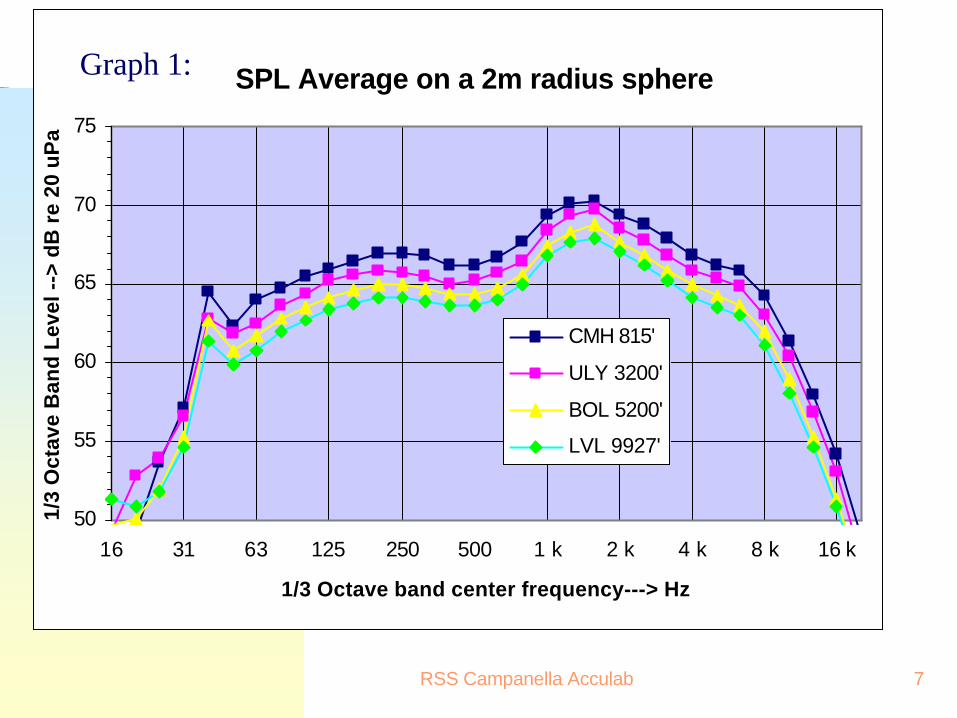
sound pressure level, P. n By Experiment as B decreases, so does P (Graph 1),
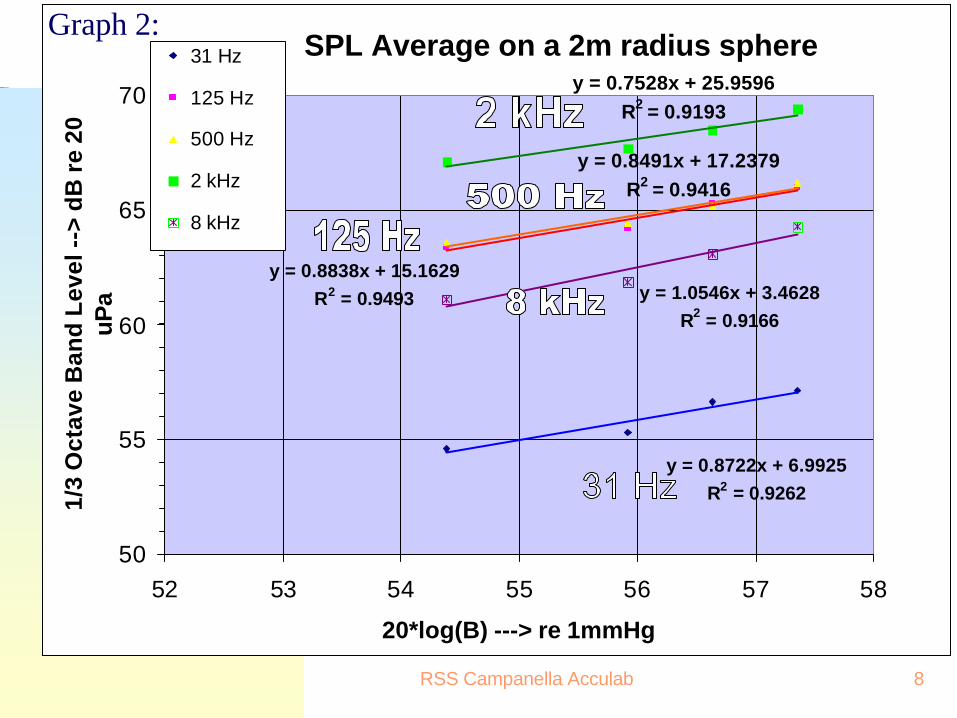
and so also does ρ. Graph 2 shows that P ∝ B .
n Altogether, P2/ ρ, or Π, reduces linearly with B:
n Π = SP2/(ρc): Π ∝ B: 20log Π ∝ 20logB
n P is directly measured. Sound power Π is computed.n We want to predict the sound pressure P expected at
B from a source of known (“calibrated”) Πo.n We return to this “representation” problem later.
RSS Campanella Acculab 6
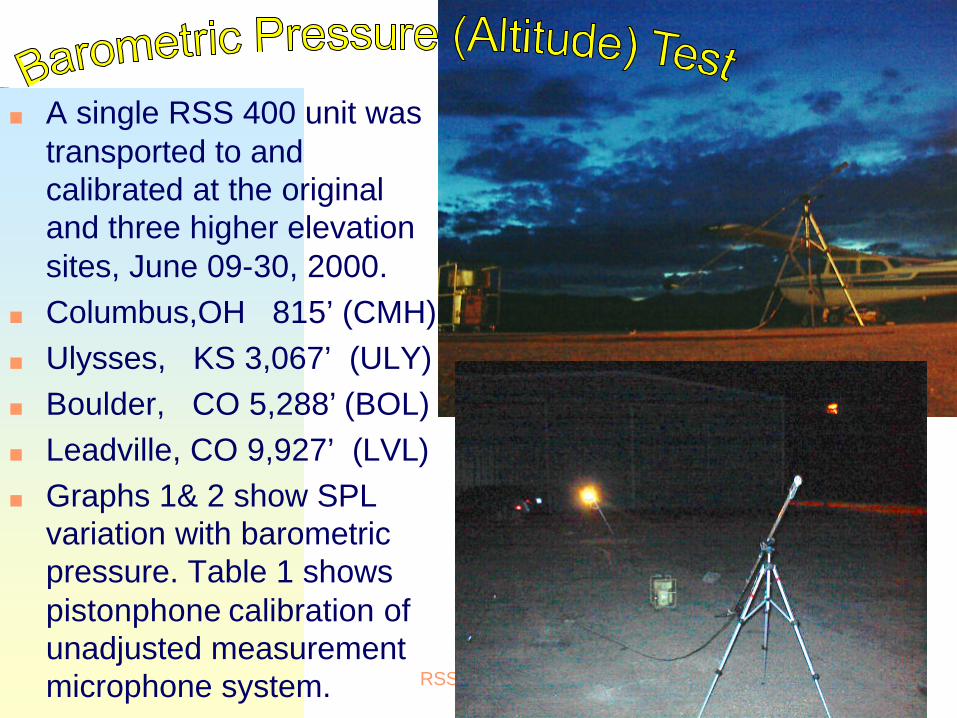
n A single RSS 400 unit was transported to and calibrated at the original and three higher elevation sites, June 09-30, 2000.
n Columbus,OH 815’ (CMH)n Ulysses, KS 3,067’ (ULY)n Boulder, CO 5,288’ (BOL)n Leadville, CO 9,927’ (LVL)n Graphs 1& 2 show SPL
variation with barometric pressure. Table 1 shows pistonphone calibration of unadjusted measurement microphone system.
RSS Campanella Acculab 7
SPL Average on a 2m radius sphere
50
55
60
65
70
75
16 31 63 125 250 500 1 k 2 k 4 k 8 k 16 k
1/3 Octave band center frequency---> Hz
1/3
Oct
ave
Ban
d L
evel
-->
dB
re
20 u
Pa
CMH 815'
ULY 3200'
BOL 5200'
LVL 9927'
Graph 1:
RSS Campanella Acculab 8
SPL Average on a 2m radius spherey = 0.7528x + 25.9596
R2 = 0.9193
y = 0.8491x + 17.2379R2 = 0.9416
y = 0.8838x + 15.1629R2 = 0.9493
y = 0.8722x + 6.9925R2 = 0.9262
y = 1.0546x + 3.4628R2 = 0.9166
50
55
60
65
70
52 53 54 55 56 57 58
20*log(B) ---> re 1mmHg
1/3
Oct
ave
Ban
d L
evel
-->
dB
re
20
uPa
31 Hz
125 Hz
500 Hz
2 kHz
8 kHz
Graph 2:
RSS Campanella Acculab 9
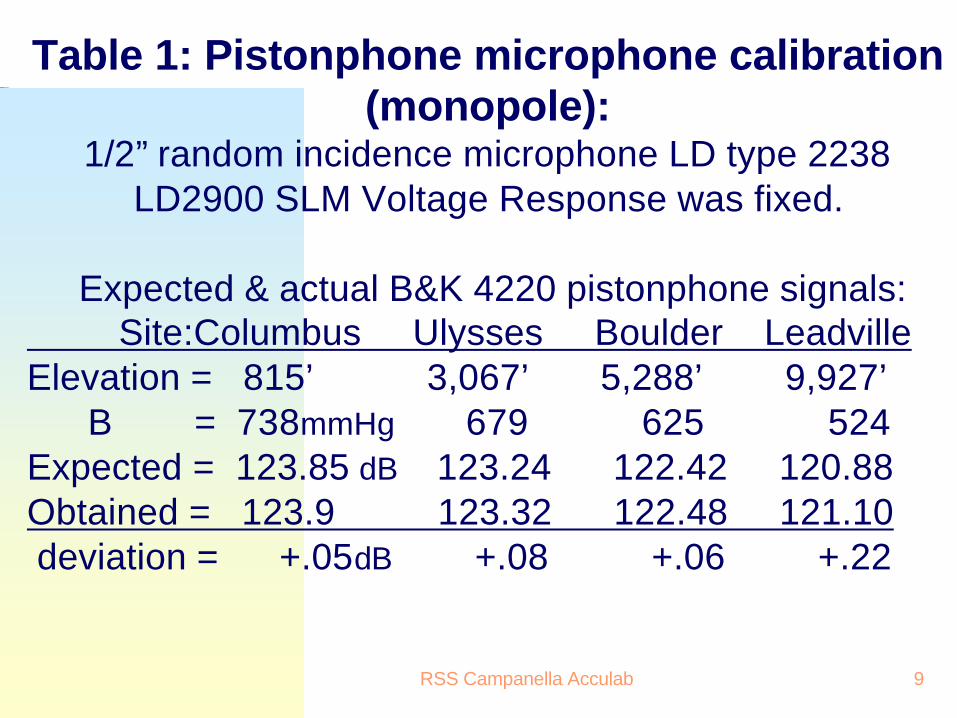
Table 1: Pistonphone microphone calibration (monopole):
1/2” random incidence microphone LD type 2238LD2900 SLM Voltage Response was fixed.
Expected & actual B&K 4220 pistonphone signals:Site:Columbus Ulysses Boulder Leadville
Elevation = 815’ 3,067’ 5,288’ 9,927’B = 738mmHg 679 625 524
Expected = 123.85 dB 123.24 122.42 120.88Obtained = 123.9 123.32 122.48 121.10deviation = +.05dB +.08 +.06 +.22
RSS Campanella Acculab 10
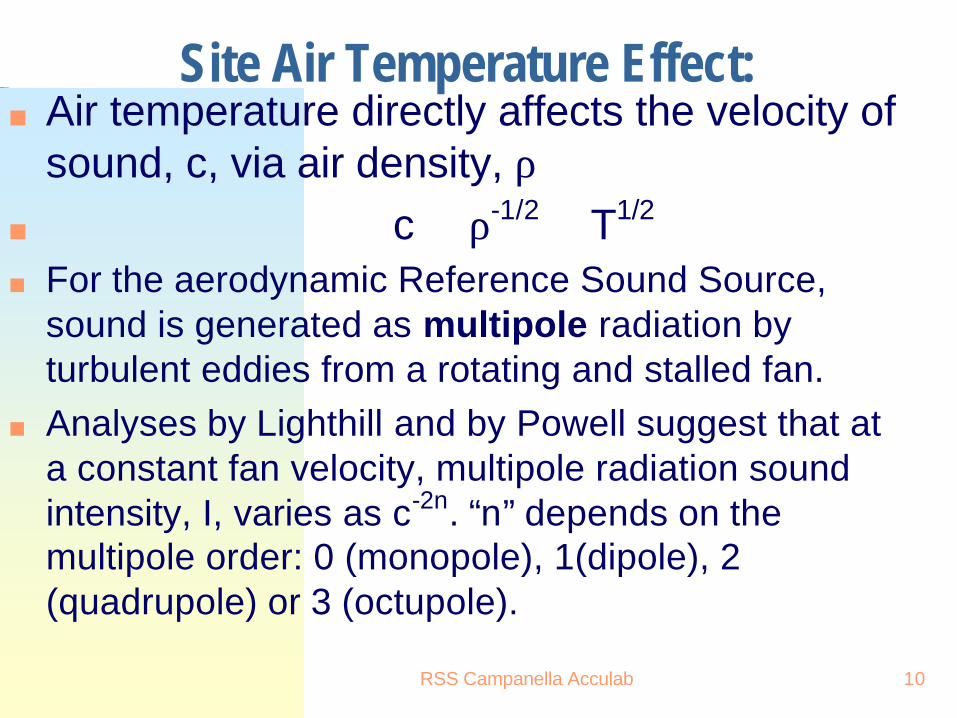
Site Air Temperature Effect:n Air temperature directly affects the velocity of
sound, c, via air density, ρn c ∝ ρ-1/2 ∝ T1/2
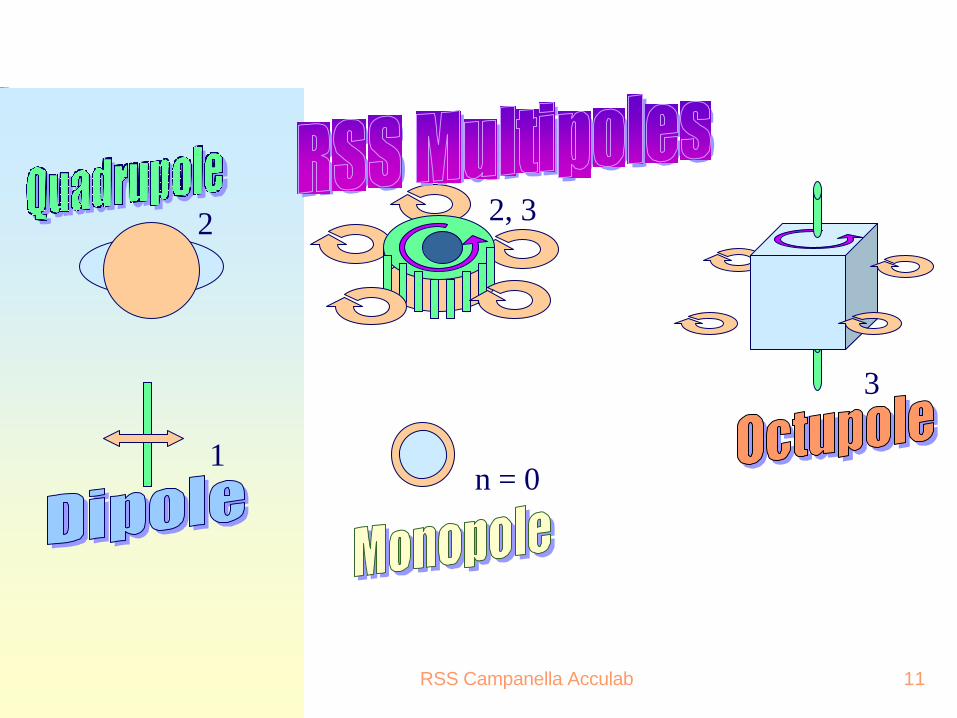
n For the aerodynamic Reference Sound Source, sound is generated as multipole radiation by turbulent eddies from a rotating and stalled fan.
n Analyses by Lighthill and by Powell suggest that at a constant fan velocity, multipole radiation sound intensity, I, varies as c-2n. “n” depends on the multipole order: 0 (monopole), 1(dipole), 2 (quadrupole) or 3 (octupole).
RSS Campanella Acculab 11
1
2
n = 0
3
2, 3
RSS Campanella Acculab 12
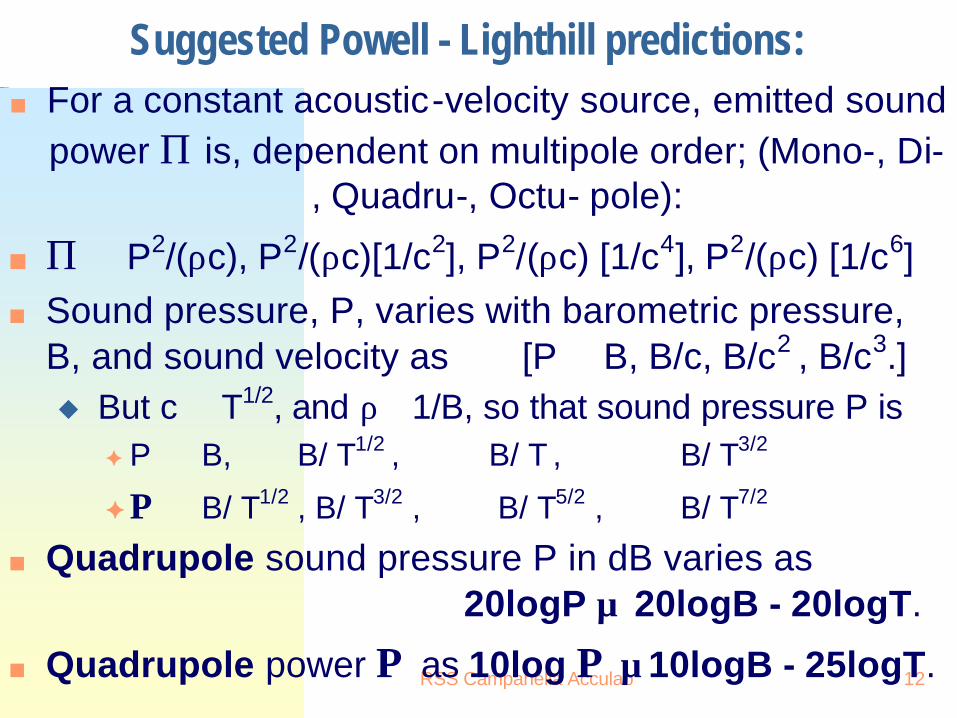
Suggested Powell - Lighthill predictions:n For a constant acoustic-velocity source, emitted sound
power Π is, dependent on multipole order; (Mono-, Di-, Quadru-, Octu- pole):
n Π ∝ P2/(ρc), P2/(ρc)[1/c2], P2/(ρc) [1/c4], P2/(ρc) [1/c6]n Sound pressure, P, varies with barometric pressure,
B, and sound velocity as [P ∝ B, B/c, B/c2 , B/c3.]u But c ∝ T1/2, and ρ∝ 1/B, so that sound pressure P is
F P ∝ B, B/ T1/2 , B/ T , B/ T3/2
F Π ∝ B/ T1/2 , B/ T3/2 , B/ T5/2 , B/ T7/2
n Quadrupole sound pressure P in dB varies as20logP ∝ 20logB - 20logT.
n Quadrupole power Π as 10log Π ∝10logB - 25logT.
RSS Campanella Acculab 13
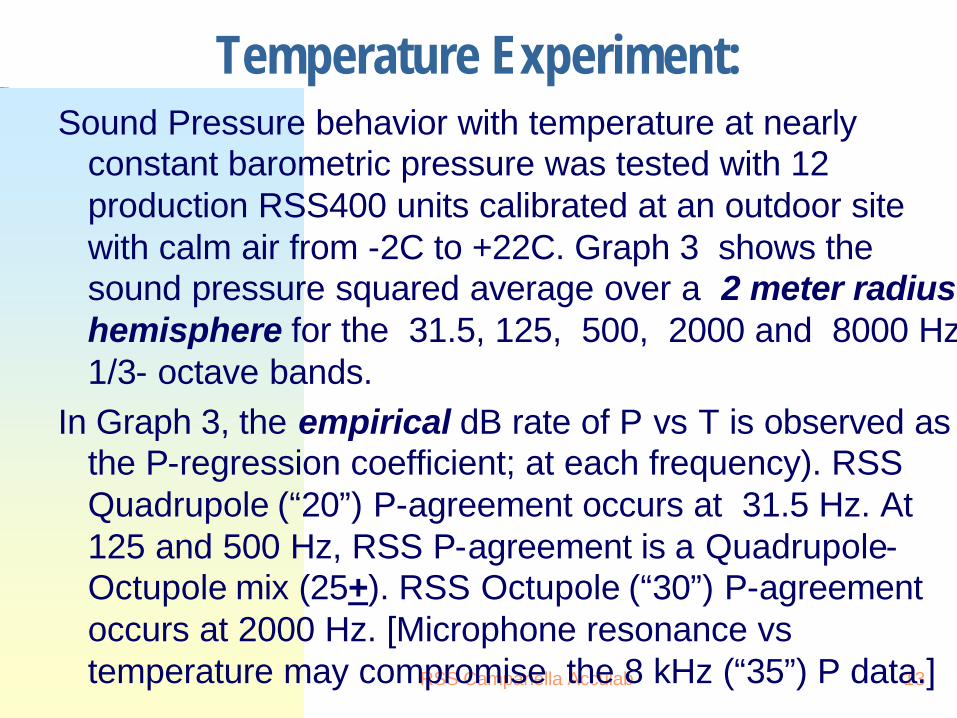
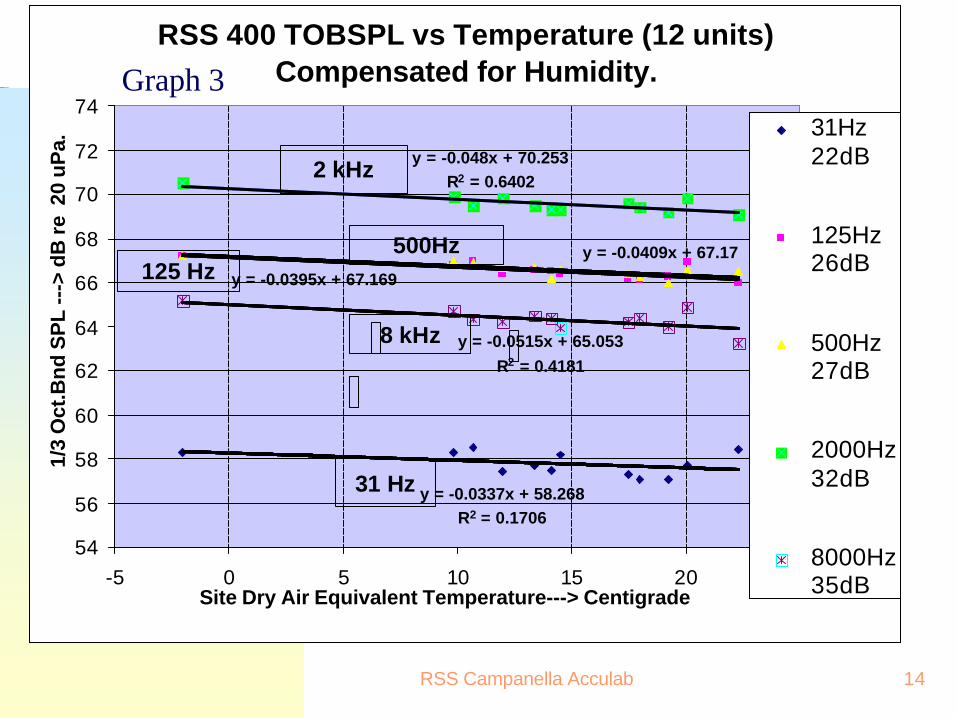
Temperature Experiment:Sound Pressure behavior with temperature at nearly
constant barometric pressure was tested with 12 production RSS400 units calibrated at an outdoor site with calm air from -2C to +22C. Graph 3 shows the sound pressure squared average over a 2 meter radius hemisphere for the 31.5, 125, 500, 2000 and 8000 Hz 1/3- octave bands.
In Graph 3, the empirical dB rate of P vs T is observed as the P-regression coefficient; at each frequency). RSS Quadrupole (“20”) P-agreement occurs at 31.5 Hz. At 125 and 500 Hz, RSS P-agreement is a Quadrupole-Octupole mix (25+). RSS Octupole (“30”) P-agreement occurs at 2000 Hz. [Microphone resonance vs temperature may compromise the 8 kHz (“35”) P data.]
RSS Campanella Acculab 14
RSS 400 TOBSPL vs Temperature (12 units)Compensated for Humidity.
y = -0.0515x + 65.053R2 = 0.4181
y = -0.048x + 70.253R2 = 0.6402
y = -0.0337x + 58.268R2 = 0.1706
y = -0.0409x + 67.17
y = -0.0395x + 67.169
54
56
58
60
62
64
66
68
70
72
74
-5 0 5 10 15 20 25Site Dry Air Equivalent Temperature---> Centigrade
1/3
Oct
.Bn
d S
PL
--->
dB
re
20
uP
a.
31Hz22dB
125Hz 26dB
500Hz 27dB
2000Hz32dB
8000Hz35dB
125 Hz
31 Hz
500Hz
8 kHz
2 kHz
Graph 3
RSS Campanella Acculab 15
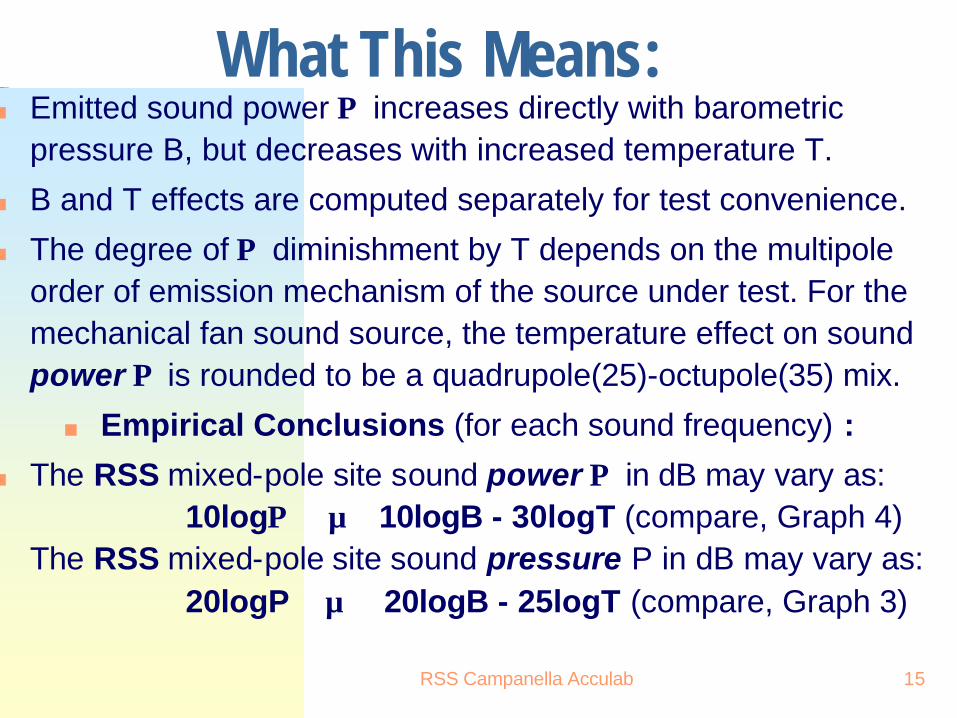
What This Means:n Emitted sound power Π increases directly with barometric
pressure B, but decreases with increased temperature T.
n B and T effects are computed separately for test convenience.
n The degree of Π diminishment by T depends on the multipole order of emission mechanism of the source under test. For the mechanical fan sound source, the temperature effect on sound power Π is rounded to be a quadrupole(25)-octupole(35) mix.
n Empirical Conclusions (for each sound frequency) :
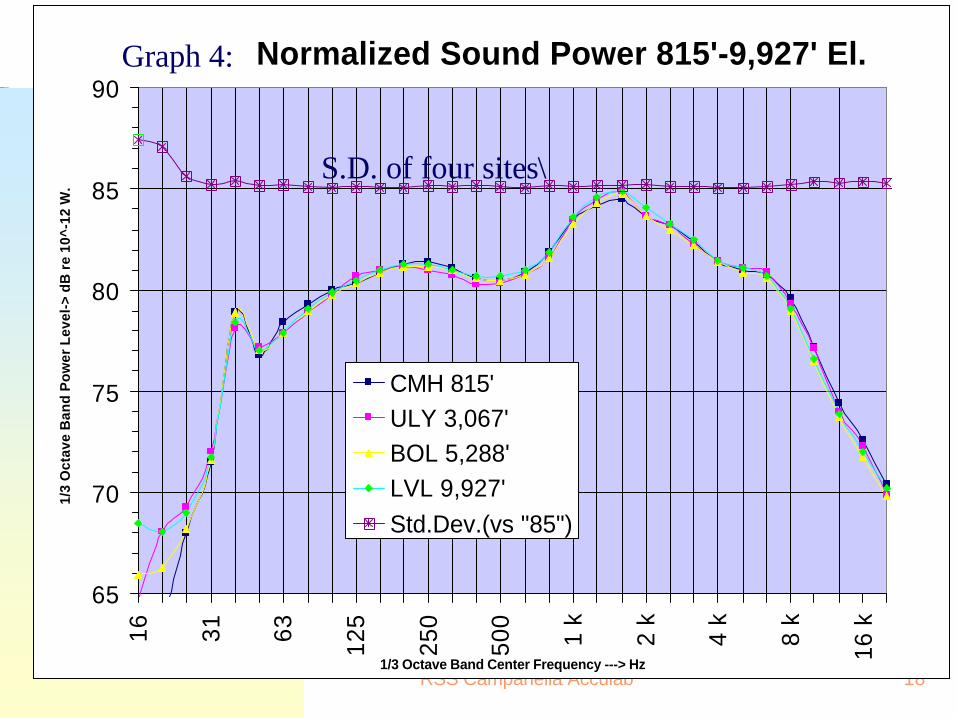
n The RSS mixed-pole site sound power Π in dB may vary as: 10logΠ ∝ 10logB - 30logT (compare, Graph 4)
The RSS mixed-pole site sound pressure P in dB may vary as: 20logP ∝ 20logB - 25logT (compare, Graph 3)
RSS Campanella Acculab 16
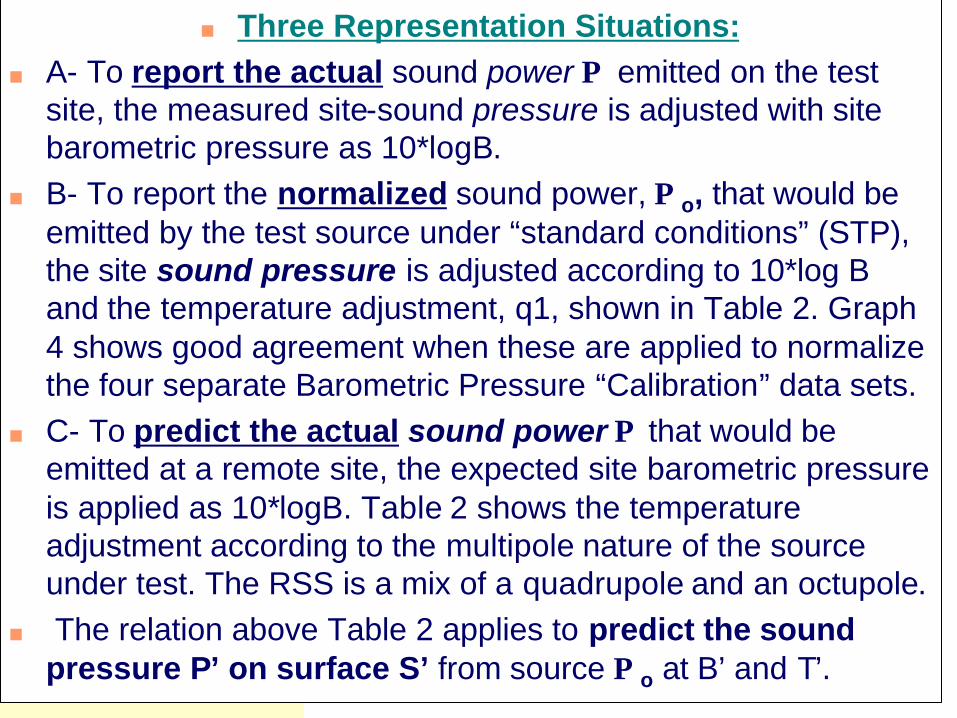
n Three Representation Situations:n A- To report the actual sound power Π emitted on the test
site, the measured site-sound pressure is adjusted with site barometric pressure as 10*logB.
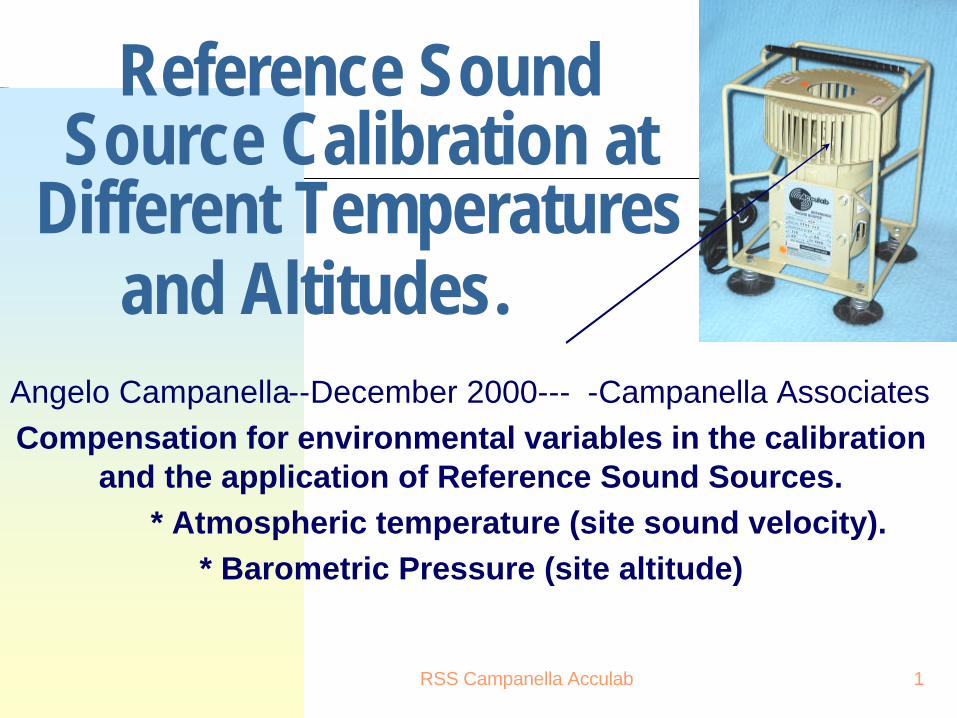
n B- To report the normalized sound power, Πo, that would be emitted by the test source under “standard conditions” (STP), the site sound pressure is adjusted according to 10*log B and the temperature adjustment, q1, shown in Table 2. Graph 4 shows good agreement when these are applied to normalize the four separate Barometric Pressure “Calibration” data sets.
n C- To predict the actual sound power Π that would be emitted at a remote site, the expected site barometric pressure is applied as 10*logB. Table 2 shows the temperature adjustment according to the multipole nature of the source under test. The RSS is a mix of a quadrupole and an octupole.
n The relation above Table 2 applies to predict the sound pressure P’ on surface S’ from source Πo at B’ and T’.
RSS Campanella Acculab 17
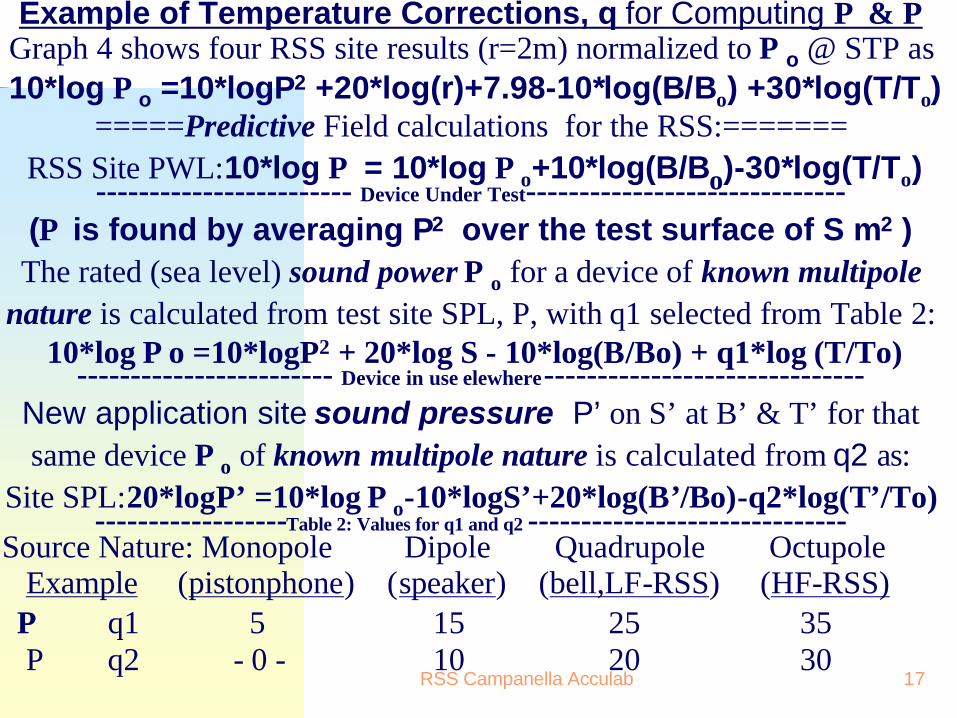
Example of Temperature Corrections, q for Computing Π & PGraph 4 shows four RSS site results (r=2m) normalized to Πo @ STP as10*log Πo =10*logP2 +20*log(r)+7.98-10*log(B/Bo) +30*log(T/To)
=====Predictive Field calculations for the RSS:=======RSS Site PWL:10*log Π = 10*log Πo+10*log(B/Bo)-30*log(T/To)------------------------ Device Under Test------------------------------(Π is found by averaging P2 over the test surface of S m2 )The rated (sea level) sound power Πo for a device of known multipole
nature is calculated from test site SPL, P, with q1 selected from Table 2:10*log Πo =10*logP2 + 20*log S - 10*log(B/Bo) + q1*log (T/To)
------------------------ Device in use elewhere------------------------------New application site sound pressure P’ on S’ at B’ & T’ for that same device Πo of known multipole nature is calculated from q2 as:
Site SPL:20*logP’ =10*log Πo-10*logS’+20*log(B’/Bo)-q2*log(T’/To)------------------Table 2: Values for q1 and q2 ------------------------------
Source Nature: Monopole Dipole Quadrupole OctupoleExample (pistonphone) (speaker) (bell,LF-RSS) (HF-RSS)
Π q1 5 15 25 35 P q2 - 0 - 10 20 30
RSS Campanella Acculab 18
Normalized Sound Power 815'-9,927' El.
65
70
75
80
85
90
16 31 63 125
250
500
1 k
2 k
4 k
8 k
16 k
1/3 Octave Band Center Frequency ---> Hz
1/3
Oct
ave
Ban
d P
ow
er L
evel
-> d
B r
e 10
^-12
W.
CMH 815'ULY 3,067'BOL 5,288'LVL 9,927'Std.Dev.(vs "85")
Graph 4:
S.D. of four sites\
RSS Campanella Acculab 19
Compensation For Test Site Altitude & Temperature (for Comparison Tests; ISO 3747, ANSI S12.8, AMCA 300 etc)
n ISO 6926 Section 7.6 (“Calculations”) should be reviewed. Measurements near sea level may be affected within precision of method. Sound power determinations at higher altitudes will be affected beyond the precision of this method.
n Research should be conducted in the effect of gas sound velocity on radiated sound power for aerodynamic reference sound sources.
By Angelo Campanella: This is a plan for the future:By Angelo Campanella: This is a plan for the future:
RSS Campanella Acculab 20
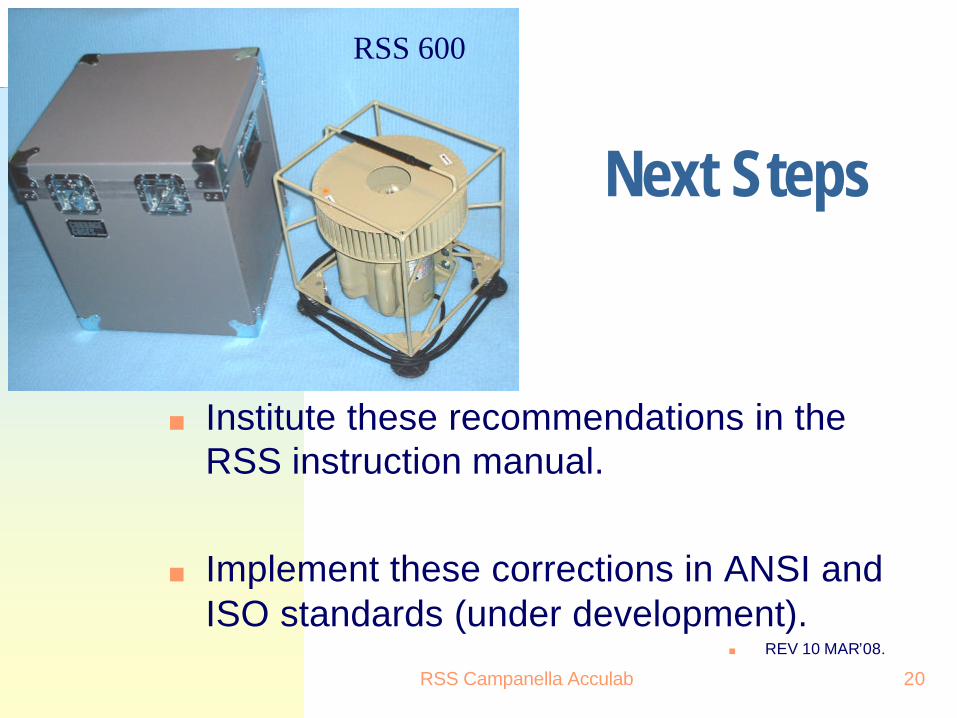
Next Steps
n Institute these recommendations in the RSS instruction manual.
n Implement these corrections in ANSI and ISO standards (under development).
n REV 10 MAR’08.
RSS 600