Embed Size (px)
Citation preview
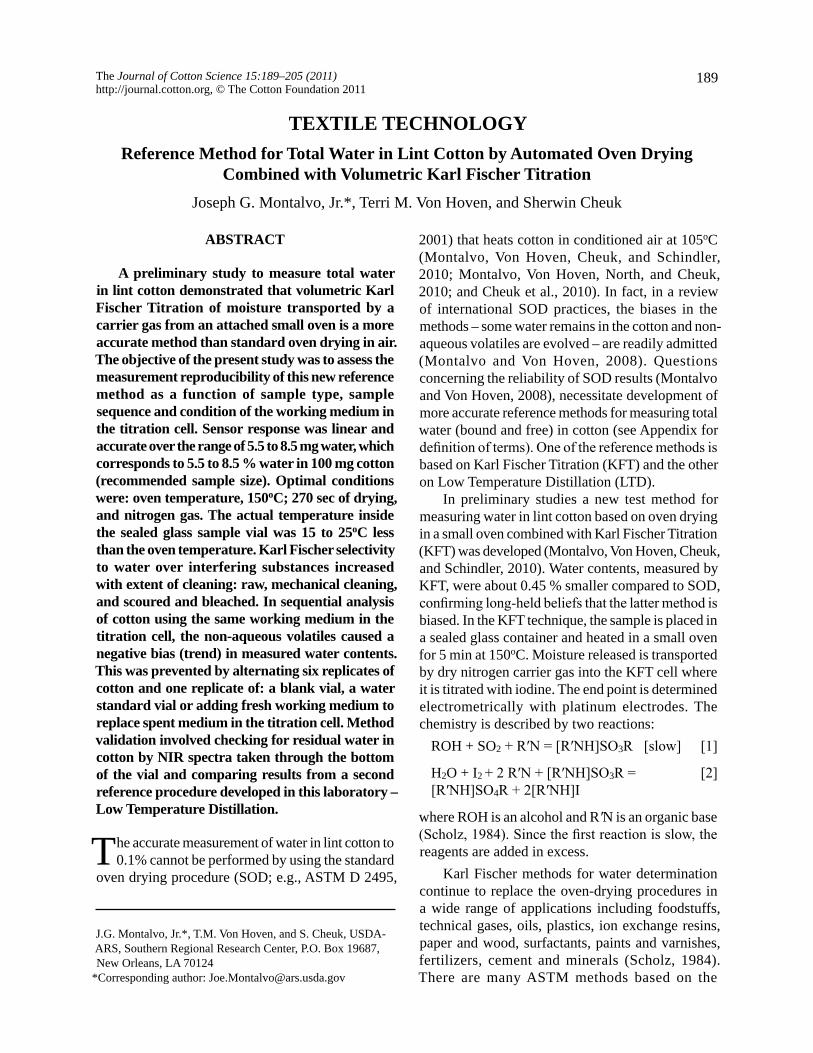
189The Journal of Cotton Science 15:189–205 (2011) http://journal.cotton.org, © The Cotton Foundation 2011
TEXTILE TECHNOLOGYReference Method for Total Water in Lint Cotton by Automated Oven Drying
Combined with Volumetric Karl Fischer TitrationJoseph G. Montalvo, Jr.*, Terri M. Von Hoven, and Sherwin Cheuk
J.G. Montalvo, Jr.*, T.M. Von Hoven, and S. Cheuk, USDA-ARS, Southern Regional Research Center, P.O. Box 19687, New Orleans, LA 70124
*Corresponding author: [email protected]
ABSTRACT
A preliminary study to measure total water in lint cotton demonstrated that volumetric Karl Fischer Titration of moisture transported by a carrier gas from an attached small oven is a more accurate method than standard oven drying in air. The objective of the present study was to assess the measurement reproducibility of this new reference method as a function of sample type, sample sequence and condition of the working medium in the titration cell. Sensor response was linear and accurate over the range of 5.5 to 8.5 mg water, which corresponds to 5.5 to 8.5 % water in 100 mg cotton (recommended sample size). Optimal conditions were: oven temperature, 150oC; 270 sec of drying, and nitrogen gas. The actual temperature inside the sealed glass sample vial was 15 to 25oC less than the oven temperature. Karl Fischer selectivity to water over interfering substances increased with extent of cleaning: raw, mechanical cleaning, and scoured and bleached. In sequential analysis of cotton using the same working medium in the titration cell, the non-aqueous volatiles caused a negative bias (trend) in measured water contents. This was prevented by alternating six replicates of cotton and one replicate of: a blank vial, a water standard vial or adding fresh working medium to replace spent medium in the titration cell. Method validation involved checking for residual water in cotton by NIR spectra taken through the bottom of the vial and comparing results from a second reference procedure developed in this laboratory – Low Temperature Distillation.
The accurate measurement of water in lint cotton to 0.1% cannot be performed by using the standard
oven drying procedure (SOD; e.g., ASTM D 2495,
2001) that heats cotton in conditioned air at 105oC (Montalvo, Von Hoven, Cheuk, and Schindler, 2010; Montalvo, Von Hoven, North, and Cheuk, 2010; and Cheuk et al., 2010). In fact, in a review of international SOD practices, the biases in the methods – some water remains in the cotton and non-aqueous volatiles are evolved – are readily admitted (Montalvo and Von Hoven, 2008). Questions concerning the reliability of SOD results (Montalvo and Von Hoven, 2008), necessitate development of more accurate reference methods for measuring total water (bound and free) in cotton (see Appendix for definition of terms). One of the reference methods is based on Karl Fischer Titration (KFT) and the other on Low Temperature Distillation (LTD).
In preliminary studies a new test method for measuring water in lint cotton based on oven drying in a small oven combined with Karl Fischer Titration (KFT) was developed (Montalvo, Von Hoven, Cheuk, and Schindler, 2010). Water contents, measured by KFT, were about 0.45 % smaller compared to SOD, confirming long-held beliefs that the latter method is biased. In the KFT technique, the sample is placed in a sealed glass container and heated in a small oven for 5 min at 150oC. Moisture released is transported by dry nitrogen carrier gas into the KFT cell where it is titrated with iodine. The end point is determined electrometrically with platinum electrodes. The chemistry is described by two reactions:
ROH + SO2 + R′N = [R′NH]SO3R [slow] [1]
H2O + I2 + 2 R′N + [R′NH]SO3R = [2] [R′NH]SO4R + 2[R′NH]I
where ROH is an alcohol and R′N is an organic base (Scholz, 1984). Since the first reaction is slow, the reagents are added in excess.
Karl Fischer methods for water determination continue to replace the oven-drying procedures in a wide range of applications including foodstuffs, technical gases, oils, plastics, ion exchange resins, paper and wood, surfactants, paints and varnishes, fertilizers, cement and minerals (Scholz, 1984). There are many ASTM methods based on the
190MONTALVO ET AL.: REFERENCE METHOD FOR WATER IN COTTON LINT
Karl Fischer technique for water determination (Scholz, 1984). There are many National Institute of Standards and Technology (NIST) Standard Reference Materials (SRMs) based on the Karl Fischer approach (Margolis et al., 2004a,b). The Karl Fischer approach is faster than conventional oven drying, more accurate and highly precise (Pyper, 1985). This improvement in precision allows for use of smaller samples and measurement of sample variability in large or bulk samples. Modern KFT instrumentation is fully automated and includes a multi sample turntable.
There are fundamental questions related to total water content in cotton that require satisfactory answers by KFT, which provides a specific measure of water. Some of these questions have been addressed by SOD, but the biases in the method may have confounded the results. For example, with area of growth fixed at one location, are there differences in water content between varieties, early and late defoliation and gin dryer temperature for samples conditioned to moisture equilibrium in a conditioned laboratory? Similarly, are there differences in water content between raw and cleaned cottons?
Margolis et al. (2004a, b) showed that verification of the automated Karl Fischer method had to be demonstrated prior to measuring water content in NIST standard reference materials. In the analysis of cotton samples by the automated KFT method, it must also be shown that results are independent of the number of sequential samples analyzed with the same working medium in the titration cell. This is not a trivial issue since the kinetics of the Karl Fischer reaction may be influenced uniquely by the non-aqueous volatiles in cotton.
The objectives of this paper are to: (1) document the sensor accuracy and linearity with a certified water standard prior to analyzing cotton; (2) demonstrate the linear response range of different masses of cotton analyzed; (3) optimize the KFT oven temperature and test for differences in temperature between inside the sealed vial and the oven; (4) determine the selectivity of the method to water in cotton relative to the interferences in cotton; (5) demonstrate in the automatic mode of operation, the number of replicates of a cotton sample that can be analyzed by sequential volumetric titration in the same working medium; and (6) validate the automatic KFT method by comparing the independent KFT and LTD reference method results.
FUNDAMENTALS
Moisture and total water contents. The reader is referred to the Appendix for special terms and their meanings. In the context of this paper, moisture content of cotton is the amount of weight loss of the test specimen by SOD. All weight loss, including non-aqueous volatile material, is attributed to water and is expressed as a percentage of the mass of the specimen taken for analysis. In contrast, total water content is the specific measure of all or the total amount of water (H2O, free plus bound) in the cotton specimen, and is expressed as a percentage of the mass of the specimen taken for analysis (wet basis in this paper).
The difference between total water content and moisture content in cotton is due to the fact that the latter is simply a measure of weight loss in ambient air and is nonspecific for the chemical compound H2O. Weight loss in ambient air is confounded by oxidation (Montalvo, Von Hoven, Cheuk, and Schindler, 2010; Cheuk et al., 2010).
Understanding Karl Fischer calculations. (See the Appendix for derivation of calibrations equations applied to cotton).
Model calculations. Is the water content in an empty KFT sample vial, exposed to standard textile testing conditions (ASTM D1776; 70oF and 65% RH) before sealing and analysis, of sufficient amount to bias the cotton results? Is the water content of the dry nitrogen carrier gas sufficient to bias the cotton results?
Consider the explanatory hypothetical calculations in Table 1 and Figure 1. For a 0.1 g sample of cotton containing 7% water, 7 mg of water is titrated before the end point is reached. According to Scholz (1984), 1 L of air at ambient temperature and 100% RH contains 20 mg water or 0.18 mg in an empty nine mL KFT vial. At 65% RH, the corresponding amount is 0.12 mg water, which agrees well with 0.1 mg water measured in this study by KFT. Thus, the blank vial contributes a significant amount of water compared to that amount in 0.1 g cotton (i.e., 7.1 % water in cotton uncorrected versus 7 % corrected).
Based on a 100 mg cotton sample to analyze by KFT, Figure 1 illustrates the predicted effect on the measured water content in cotton by KFT, with no blank correction, the corrected blank, and twice the blank value subtracted from the cotton results. Sample masses 100 mg ±30 mg are included in the

191JOURNAL OF COTTON SCIENCE, Volume 15, Issue 2, 2011
simulations. As to the dry nitrogen used to flush the released moisture into the titration cell, the calculations (Table 1) show an insignificant amount of moisture titrated.
is necessary so that a dry titration cell is ready for the next sample. Eventually the increase in the volume of spent solution – from titration of cotton samples on the turntable and pre-titration between samples – will exceed the allowed volume of solution in the titration cell and must be removed by available pumps. By considering the water content of the cottons and the titer of the KFT reagent, calculations can be performed to ensure that the titration cell will not overflow with spent solution generated in automatic analysis of a turntable of samples.
Emphasis in this paper is on measurement reproducibility as a function of sample type, sample sequence and condition of the working medium in the titration cell. In analysis of replicates of the certified water standard, the buildup of Karl Fischer reaction products in the working medium must not influence water content results. Similarly, in analysis of cleaned or raw cotton replicates, the buildup of cotton non-aqueous volatiles in the working medium must not influence results.
Potentiometry with polarized platinum electrodes. The preferred indicator electrodes in KFT are platinum. The two electrodes are polarized (i.e., one positive and the other negative in potential) by forcing a small constant current (50 µA) to flow between the electrodes. When polarized, voltages of 200 to 500 mU can be measured. When the end point in the titration is reached, there is a slight excess of iodine in solution, the redox pair in this case is I/I-, and the voltage drops to virtually zero thus indicating the end point. This type of end point indication is referred to as controlled current potentiometry with two electrodes or bipotentiometry. (Note that the KFT titration software uses U for voltage and V for volume of titrant.)
MATERIALS AND METHODS
Dry Nitrogen. Dry nitrogen in compressed gas cylinders was obtained from Airgas (New Orleans, LA). The certified moisture content was < 20 ppb (weight/volume).
Lint Cottons and Conditioning. Three cottons were used throughout the study, two commercial and the control cotton. The control cotton had been scoured and bleached and is readily available at commercial retailers nationwide as cotton balls. The commercial cottons were obtained from the Agricultural Marketing Service (AMS). One had been mechanically cleaned (AMS clean); the other
Table 1. Calculated mg water titrated: cotton, KFT empty sample vial and nitrogen carrier gas.
Sample Descriptive mg water titrated
cotton 100 mgz, 7% water 7.0
empty KFT sample vial
9 mL, exposed to air at RH: 100% 65% Found, KFT
0.18y
0.12x
0.10w
dry nitrogen < 20 ppb waterv (weight/vol)
60 mL/min x 5 min < 0.003z Sample size used in this paper.y Scholz (1984).x Computed from 100% RH value.w Found in this paper: 0.02 mL titrant consumed with a
titer = 5 mg water/mL reagent or 0.1 mg water titrated.v Source: Certificate of analysis of compressed gas
cylinder.
6.8
6.85
6.9
6.95
7
7.05
7.1
7.15
7.2
60 70 80 90 100 110 120 130 140
Cotton mass (mg)
Wat
er c
onte
nt b
y K
FT (%
)
subtracted none subtracted x2
Figure 1. Simulation plots of water content in cotton by KFT with and without correction for the blank vial (100 mg sample size). Assumed true values: 7% water in cotton, titer is 5 mg water titrated/mL reagent and blank consumes 0.02 mL titrant.
Sample sequence and condition of the working medium. Sample replicates of the cottons are loaded onto the multi sample turntable (35 sample positions) and are analyzed by sequential KFT using the same working medium (solvent) in the titration cell. The solvent mixture of the previous titration is immediately used as the working medium for titration of the next sample. In this way, the use of fresh solvent is minimized.
Automatic “conditioning” between each sample on the turntable – a pre-titration using KFT reagent to keep the working medium at its equivalency point –
192MONTALVO ET AL.: REFERENCE METHOD FOR WATER IN COTTON LINT
current = 50 µA, minimum volume increment = 9.9 µL, end point voltage = 250 mU and stop criterion = 20 µL drift/min.
Position # 36 on the sample turntable was reserved by the instrument manufacturer for the “conditioning” vial. (Note: KFT instrument conditioning is needed to titrate to dryness the tubing leading from the sample vial to the titration cell and the working medium in the titration cell. This procedure is automatically carried out prior to analyzing each cotton sample.) Conditioning was performed with an empty sealed sample vial. The sealed vial consisted of a 9 mL glass vial sealed with an aluminum crimp cap with silicone/PTFE septum. The PTFE layer faced the inside of the vial.
To initiate the conditioning process, the double wall needle (center needle the gas inlet and the outer needle the gas exit) mounted on a needle arm above the turntable, was software activated to move to position # 36 and then downward to penetrate the Teflon septum of the empty vial. Dry nitrogen at 60 mL/min flowed through the vial and into the titration vessel. The vial (and associated tubing) was titrated with the Karl Fischer reagent until dry and the end point determined with platinum electrodes. (Note that conditioning was done at ambient temperature whereas the blank, titer and cotton sample vials were all processed at 150oC for about five min with nitrogen flowing through the vials. For the 150oC extractions, the double wall needle, after penetrating the Teflon septum, continued its downward movement and the vial was positioned below the turntable in the oven module.)
Generally sample positions one to twelve on the turntable were reserved for the analysis of four blank vials followed by eight titer determinations. The first blank is referred to as a “dummy”, and tended to be higher in water content than the remaining three, which were tightly clustered in water content results. The dummy blank value was not included in calculating a mean blank value for use in correcting cotton results.
The conditioned 100 mg cotton test specimens were weighed to the nearest 0.1 mg, placed in the Karl Fischer glass vials and immediately crimped with septum caps. The sealed samples were then placed into Mason jars that had been acclimated in the conditioned lab. The samples were encapsulated in the jars until testing to maintain the environment. Prior to KFT analysis of cotton samples, blank vials were run for quality control measures. (To confirm complete removal of water from the fibers, an NIR spectrum was
was raw (AMS raw) from a different crop year. Also, a portion of the AMS raw cotton was cleaned in the laboratory by two passes through a Shirley Analyzer (Model Mk1, SDL Atlas, Stockport, UK) and designated AMS raw-SRRC cleaned. However, no information is available on the drying during ginning of the AMS cottons.
Pinches of fiber were randomly selected from the cottons to make four 20 g laboratory samples (control, AMS clean, AMS raw and AMS raw – SRRC cleaned). Each laboratory sample was hand blended, placed in an open paper bag and conditioned to standard textile testing conditions (ASTM D1776, 2008; 70oF ± 2oF and 65 ± 2 % RH) for at least 24 hours. From each laboratory sample, random tufts were selected to prepare the 100 mg specimens for KFT and 1 g specimens for LTD.
Volumetric Karl Fischer TitrationConditioning of KFT sample vials and
aluminum crimp caps. All KFT glass sample vials and aluminum crimp caps were conditioned to standard textile testing conditions (ASTM D1776, 2008; 70oF ± 2oF and 65 ± 2 % RH) for at least 24 hours.
General description of the instrumentation and method. This fully automated system (MetrohmUSA, Tampa, FL) uses the following components (description and model number follows): oven sample processor with a carousel for 35 glass sample vials (Model 774); a mechanical burette (Model 800 Dosino), titration cell stirrer (Model 801); stand for the titration cell with platinum electrode (Model 803 Ti), and the titration software (tiamo® version 1.2). Hydranal composite 5K containing iodine was used as the titration reagent and Hydranal medium K the working medium in the titration cell.
The apparatus was prepared for use by pumping in fresh working medium into the titration cell, turning on the small oven, the volumetric titrator, and allowing initializations to be completed. The oven temperature was set at 150oC. The reagent reservoir (1 L bottle) must not be empty. The cylinder of compressed dry nitrogen should be open.
Preliminary experiments (Montalvo, Von Hoven, Cheuk, and Schindler, 2010) used 100 mg samples of the three cottons, an oven temperature of 150oC, 60 mL/min dry nitrogen carrier gas and an extraction (drying) time of 270 sec. These same parameters were used in the generalized method in this paper, which was subjected to further testing as discussed below. Other titration parameters were: polarization
193JOURNAL OF COTTON SCIENCE, Volume 15, Issue 2, 2011
taken through the bottom wall of the vial using a fiber-optic probe (Table 2; Montalvo, Von Hoven, Cheuk and Schindler, 2010). The samples were deemed dry if there was no visible peak in the spectrum at 1940 nm.)
From the volume of Karl Fischer reagent consumed, the mean water content (%, wet weight) in cotton was calculated based on at least six replicates, after correction for mean atmospheric moisture in the blank vials, by Eq. 14 (see Appendix). The KFT system had been calibrated with a water standard supplied by Metrohm that is traceable to NIST. This standard (0.7 mL, weighed to the nearest 0.1 mg) was added to a sample vial with a plastic syringe, the vial crimped and placed on the sample turntable. Mean titer (mg water/mL reagent) values were calculated from at least three replicates by Eq. 12 (Appendix).
All statistical calculations were performed with Microsoft Office Excel 2003 including linear regressions, coefficients of determination, mean values and standard deviations.
Platinum electrodes – accuracy and linearity of response. To allow for direct injection of the water standard into the titration cell, the molecular sieve drying tube on top of the titration cell was removed and in its place a loosely fitted ground glass stopper was inserted to control moisture seepage into the titration cell. All injections were made with a microliter syringe at the beginning of a blank vial determination. Nitrogen flow was at 60 mL/min. The accuracy of the Model 841 volumetric titrator was determined by direct injection of small
increments of 0.55 to 0.85 mL of Hydranal water standard into the titration cell. The amount of water titrated was corrected by the blank determination. The data was plotted as mean mg water titrated vs. mL water standard added to check the linear range and accuracy of the sensors. To check the effect of the oven performance at 150oC on sensor readings, 0.1 to 0.85 mL of the water standard was added in small increments to an empty vial, crimped and immediately analyzed. Again, the data was plotted as mean mg water titrated vs. mL water standard added.
Linear response to cotton and recommended sample size. Cottons of mass range from 6.25 to 205 mg (three replicates at each mass) were used to assess linearity of response. Averaged results were plotted as mg water titrated versus sample size. The recommended sample size was estimated from the linear plots of the three cottons investigated.
Confirmation of the optimum oven temperature. All three cottons were tested at oven temperatures ranging from 105oC to 160oC in 5 degree increments. Immediately after analysis, a Bruker Model MPA near-infrared (NIR) spectrophotometer (Bruker Optics, Billerica, MA) was used to test for completeness of evaporation of the water from the fibers (see end point, Table 2; Montalvo, Von Hoven, Cheuk and Schindler, 2010). Absorption spectra were taken directly through the glass bottom of the KFT sample vial by use of a fiber-optic probe and recorded in the range 800 to 2500 nm. Mean spectra were computed based on six replicates.
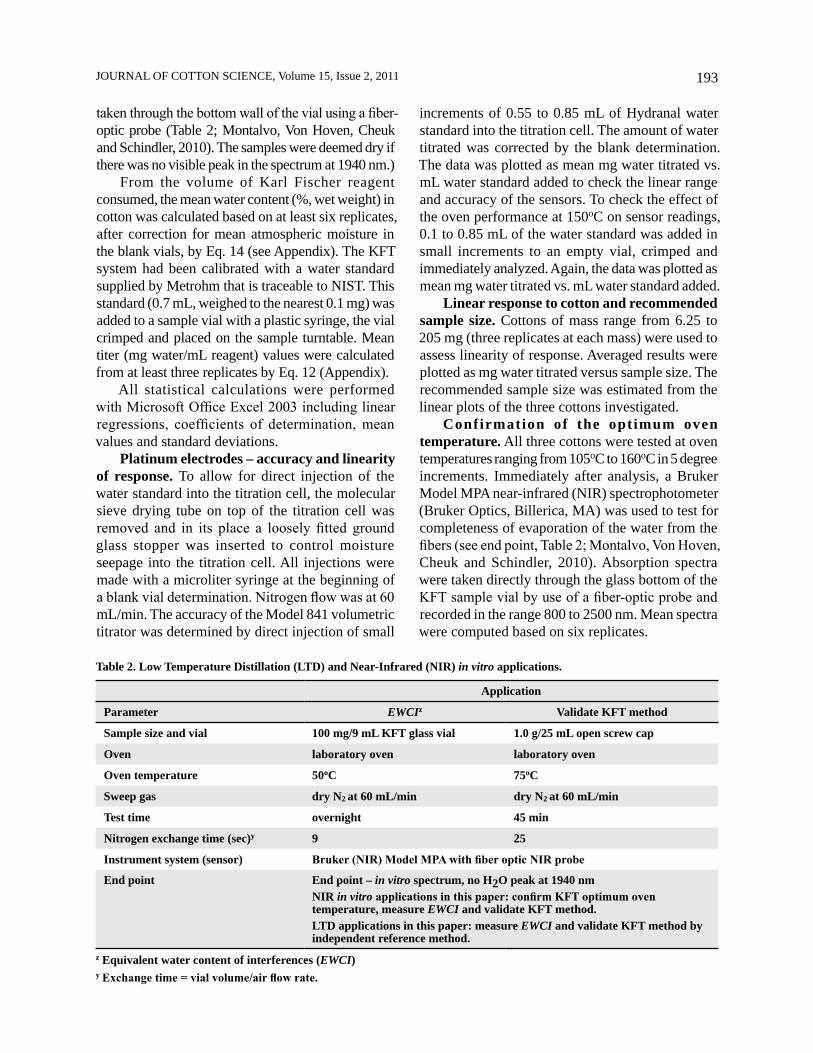
Table 2. Low Temperature Distillation (LTD) and Near-Infrared (NIR) in vitro applications.
Application
Parameter EWCIz Validate KFT method
Sample size and vial 100 mg/9 mL KFT glass vial 1.0 g/25 mL open screw cap
Oven laboratory oven laboratory oven
Oven temperature 50oC 75oC
Sweep gas dry N2 at 60 mL/min dry N2 at 60 mL/min
Test time overnight 45 min
Nitrogen exchange time (sec)y 9 25
Instrument system (sensor) Bruker (NIR) Model MPA with fiber optic NIR probe
End point End point – in vitro spectrum, no H2O peak at 1940 nmNIR in vitro applications in this paper: confirm KFT optimum oven temperature, measure EWCI and validate KFT method.LTD applications in this paper: measure EWCI and validate KFT method by independent reference method.
z Equivalent water content of interferences (EWCI)y Exchange time = vial volume/air flow rate.
194MONTALVO ET AL.: REFERENCE METHOD FOR WATER IN COTTON LINT
Measuring temperature variability in the sealed vial. One hundred mg samples of the three cottons were placed in the glass sample vials and the septa crimped. Sealed empty vials were also prepared. The septum of an empty vial was pierced with a 20 gauge needle to allow for the temperature probe to be inserted two-thirds down the length of the vial. The Type K temperature probe was connected by a short cable to a Model 86460-05 digital thermometer (Cole-Parmer Instrument Co., Vernon Hills, IL). The temperature calibration is traceable to NIST.
After placing the empty vial with temperature probe inside the container, the vial was placed on the turntable. After checking that the Karl Fischer oven was set at 150oC and the nitrogen flow turned off, the analysis of the vial was allowed to proceed in the usual manner. The operator made sure that the temperature cable was not in the way of the needle arm of the instrument as the double wall needle pierced the septum and lowered the vial into the oven. The temperature inside the vial was recorded at 100 sec, 150 sec, 200 sec and 250 sec after the start of the run. A second operator repeated the experiment on the empty vial with nitrogen flow turned off.
Experiments were repeated by both operators with the nitrogen flow turned on at 60 mL/min for the empty vial and all three cottons. Results by both operators were averaged. A plot was constructed of the averaged temperature inside the vial plotted against drying time.
Equivalent water content of interferences (EWCI). Cotton samples were pre-dried by low temperature distillation (Table 2) so that the equivalent water content of interferences (EWCI) could be measured by KFT. This drying technique was carried out in a laboratory oven at a mild temperature (50oC) to minimize removal of non-aqueous volatiles. In a sealed and vented KFT vial containing 100 mg cotton, dry nitrogen (preheated to 50oC in a heat exchanger in the oven) was injected into the fibers at 60 mL/min for at least 12 hours. Next, to ensure the sample was free of moisture, in vitro NIR spectra were taken through the bottom of the sample vial with a fiber optic NIR probe to confirm complete removal of water (Table 2).
The pre-dried samples were run by the normal KFT procedure to measure reagent consumption. From the volume titrated, after correction for the blank vials, the amount of interferences was expressed as the averaged equivalent water content of the interferences (EWCI, %, wet basis).
Validation of the KFT Method by Low Temperature Distillation (LTD)
The total water content in the three conditioned cottons was confirmed by a second independent reference method dubbed LTD (see Table 2).
Conditioning of LTD sample vials, septa and screw caps. All LTD glass sample vials, septa and screw caps were conditioned to standard textile testing conditions (ASTM D1776, 2008; 70o ± 2oF and 65 ± 2 % RH) for at least 24 hours.
LTD method – general description. A weighed amount of conditioned cotton was placed in a sealed glass vial. Two needles were inserted through the septum and into the vial, one the dry nitrogen carrier gas inlet and the other, the gas outlet. The vial was placed in a laboratory oven at < 100oC and the gas injected into the fiber matrix. An NIR spectrum was taken through the bottom of the vial to confirm complete removal of the water in the fibers (Table 2).
Specific procedure. A 1 g sample of conditioned fiber was weighed to the nearest 0.1 mg, packed in the bottom of a 25 mL clear glass vial with open screw cap (# 08922-46 and #10-90, respectively, Cole-Parmer). A silicone rubber septum 2 mm by 18 mm diameter (# SSP136-080, SSP Companies, Ballston Spa, NY) was inserted into the open cap and the cap screwed tightly on the glass vial. The weights of the empty vial with screw cap and the cotton sample were recorded to the nearest 0.1 mg.
Two 20 gauge stainless steel needles were pushed through the septum and into the vial to allow for the transport of water vapor out of the fiber matrix. Both needles were custom made (female Luer lock, one 4” in length and the other 1”, # 7751-11, Hamilton, Co., Reno, NV ) with a side hole in the tip to prevent coring of the septum. The longer needle made contact with the center of the septum and the center of the bottom of the vial. The 1” needle was placed off-center of the septum and extended about 0.5” into the vial.
A laboratory oven was fitted with 50’ of coiled 1/4” O.D. copper tubing to preheat the carrier gas. The exit end of the tubing was connected to a series of “T” fittings to allow four Luer lock manifolds (# 618, Cadence Science, Cranston, RI), each with three ports, to be connected. Thus, 12 test samples were dried simultaneously at 75oC for 45 min. The gas flow, monitored by a CSI Model 6000 Solid Stage Flowmeter

195JOURNAL OF COTTON SCIENCE, Volume 15, Issue 2, 2011
(Cambridge Scientific Instruments (England), was set to 60 mL/min for each test specimen.
Disposable gloves were used when handling the samples. After the heating period, the vials were removed from the oven and the needles immediately pulled out of the septa. After a cooling period, each vial was reweighed to determine the loss in weight. To ensure that all of the water had been removed from the samples, an in vitro NIR spectrum was taken through the bottom of the sealed glass container (Table 2). All of the weight loss by this method is attributed to water. Results were expressed as averaged total water content (%, wet basis) based generally on 12 replicates after correction for blanks run by the same procedure.
RESULTS AND DISCUSSION
Instrument calibration. Accuracy and linearity of response of the KFT method must be demonstrated with a certified water standard before it can be applied to the measurement of water in cotton. The instrument system consists of the Model 774 oven connected to the Model 841 volumetric titrator with two identical platinum electrodes (sensor).
The accuracy of the Model 841 volumetric titrator was determined by direct injection of 0.55, 0.6, 0.7, 0.8, and 0.85 mL of Hydranal water standard into the titration cell, corresponding to water masses of 5.5, 6, 7, 8 and 8.5 mg. The plot of the averaged mg water titrated (y-axis) versus mL water standard added was linear (see Table 3, R2 > 0.999), the intercept was close to zero indicating the bias was small, and the measured water mass concentration (slope) in the water standard was within the certified value of 10.05 ± 0.01 mg/mL. Therefore, the sensor responses were linear and accurate over the range of 5.5 – 8.5 mg water, the
range over which water determinations are made in 100 mg raw lint cotton (recommended sample size, see below), which corresponds to 5.5 – 8.5 % water in the fiber matrix.
Coupling of the Model 774 oven to the Model 841 Karl Fischer Titrator did not decrease the performance of the water measurement (Table 3). The slope of the response of the instrument to increasing amounts of the certified water standard added to a dry nine mL vial (and immediately crimped) gave a slope comparable with direct addition to the titrator. In this comprehensive study, small increments of the water standard, from 0.1 to 0.85 mL, were added to a vial. This corresponds to a working range of 1 – 8.5% water in 100 mg of processed lint. The slope and intercept, respectively, were 10.04 mg water/mL and -0.0102 mg water (R2 > 0.999). In these measurements, the small positive bias attributed to the atmospheric moisture in the vial before capping, had been subtracted prior to calculating the mass of water titrated.
Response to cotton and recommended sample size. Preliminary experiments utilized 100 mg cotton samples in a tightly crimped nine mL Karl Fischer glass vial, with oven temperature set at 150oC, 60 mL/min dry nitrogen carrier gas to transport the released moisture into the titration cell, and an extraction time of 5 min (Montalvo, Von Hoven, Chuck, and Schindler, 2010). The completeness of the evaporation of the water from the fibers had been confirmed by NIR spectra taken through the glass bottom of the vial immediately after KFT processing. The strong NIR absorption band at 1930 nm is due solely to moisture and was absent after five min of drying at 150oC in the KFT oven (Table 2; Montalvo, Von Hoven, Cheuk and Schindler, 2010 ). All three cottons gave similar NIR results.
Table 3. Measurement of mass concentration of water in Hydranal® water standardz by various components in the KFT method.
slope intercept
Instrument component mass concentration (mg/ml std.)
mass of water (µg) R2 ny
titrator only 10.06 0.2 1 15
oven + titrator 10.04 - 0.1 > 0.999 30
y = mx + b; y, mg water titrated; x, mL cotton standard; m, regression slope in units of mg water titrated/mL water standard; and y, intercept in µg of water
z Certified value of water in the water standard: 10.05 mg/ml ± 0.01 mg/ml.y n = number of specimens analyzed.
196MONTALVO ET AL.: REFERENCE METHOD FOR WATER IN COTTON LINT
By contrast, residual moisture remaining in the cottons after 24 hrs of standard oven drying in ambient air at 105oC was easily detected by NIR and confirms prior work (Rodgers et al., 2010; Montalvo, Von Hoven, Cheuk and Schindler, 2010). To clarify the contributions to the literature of this important phase in the research, it was stated that the strong OH absorbance at 1930 nm is due primarily to the moisture on the fiber and not the cotton fiber itself, and the paper demonstrated residual moisture on the fiber after 24 hrs of standard oven drying (Rodgers et al., 2010). After sample processing at 150oC, it was shown there was no absorbance at 1930 nm indicating that all of water in the cotton had been removed by evaporation (Montalvo et al., 2010).
In the current study, cotton samples of mass range from 6.25 to 205 mg were used to assess the response characteristics of the evaporation of water from the fibers that were heated in the oven at 150oC with a five min extraction period. All plots of the mg water titrated versus sample mass were linear and the intercepts close to zero (cotton, intercept in µg water titrated and R2): control, 21.6, > 0.999; AMS clean, 67.5, 0.999; and AMS raw, 42.1, > 0.999. Thirty-nine test specimens were analyzed for each cotton.
Above 205 mg, the responses gradually became nonlinear. At 400 mg mass, the response was very erratic and the instrument aborted for all three cottons investigated without reaching the end point. Thus, the recommended 100 mg sample size established in the preliminary study is the correct
value. This sample size is about half that of the upper linear response value (205 mg) and should assure all lint cottons analyzed are within the range of linear results. Additionally, an adverse matrix effect on results (see below) in the analysis of 100 mg raw cotton is more easily prevented than with larger sample masses.
A reviewer of this paper noted that our claim of a linear response to cotton and recommended sample size based on three cottons does not represent a diverse sample set and therefore is difficult to justify based on the limited sampling. Indeed, we should point out that the sample set is diverse: scoured and bleached (the control), mechanically cleaned, and raw. All three cottons represent different varieties and treatments, area of growth, maturity, etc. Furthermore, each linearity experiment is time consuming and costly. Rather than increase the limited project funds for additional linearity experiments, future work will be devoted to expanding the database in Table 4 – comparability of the KFT and LTD reference method results.
Oven temperature optimization, extraction time and carrier gas. The oven heating module in the oven sample processor consists of a small solid aluminum block positioned under the sample rack. When the oven is turned on, the block temperature rapidly reaches its preset value in the isothermal mode prior to the start of a series determination of cotton samples. The oven temperature must be high enough to allow complete evaporation of the water in the fiber matrix.
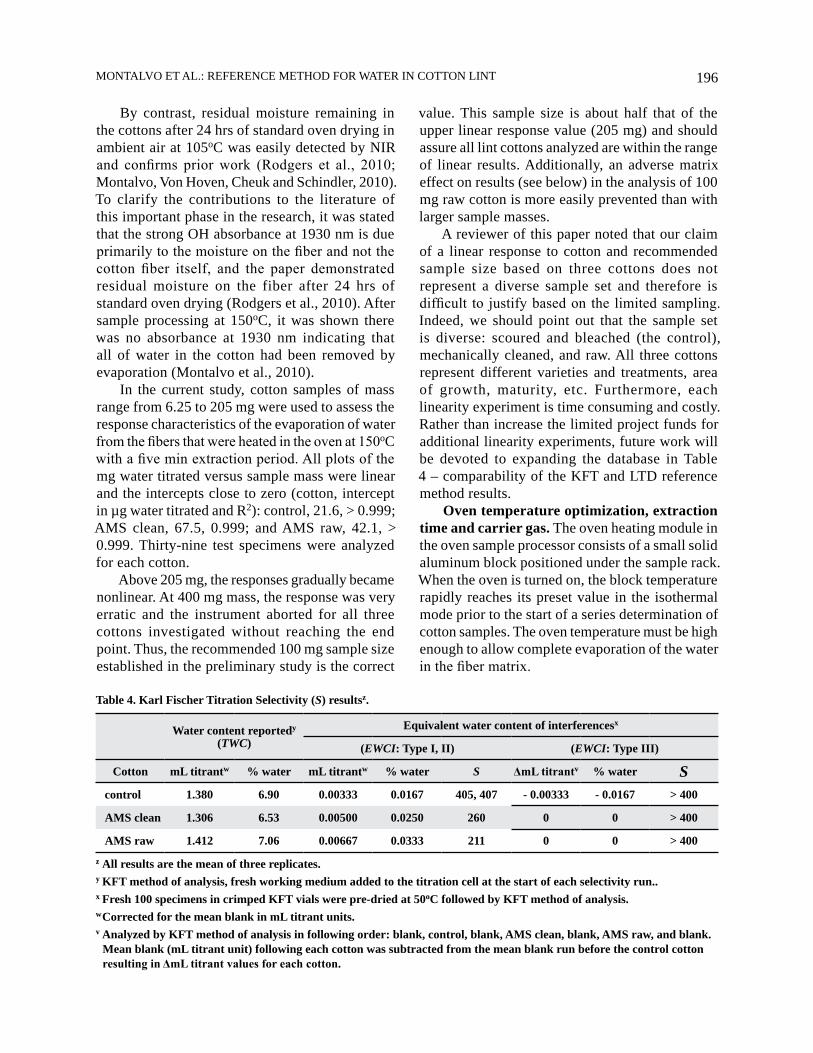
Table 4. Karl Fischer Titration Selectivity (S) resultsz.
Water content reportedy
(TWC)Equivalent water content of interferencesx
(EWCI: Type I, II) (EWCI: Type III)
Cotton mL titrantw % water mL titrantw % water S ΔmL titrantv % water Scontrol 1.380 6.90 0.00333 0.0167 405, 407 - 0.00333 - 0.0167 > 400
AMS clean 1.306 6.53 0.00500 0.0250 260 0 0 > 400
AMS raw 1.412 7.06 0.00667 0.0333 211 0 0 > 400z All results are the mean of three replicates.y KFT method of analysis, fresh working medium added to the titration cell at the start of each selectivity run..x Fresh 100 specimens in crimped KFT vials were pre-dried at 50oC followed by KFT method of analysis.w Corrected for the mean blank in mL titrant units.v Analyzed by KFT method of analysis in following order: blank, control, blank, AMS clean, blank, AMS raw, and blank.
Mean blank (mL titrant unit) following each cotton was subtracted from the mean blank run before the control cotton resulting in ΔmL titrant values for each cotton.
197JOURNAL OF COTTON SCIENCE, Volume 15, Issue 2, 2011
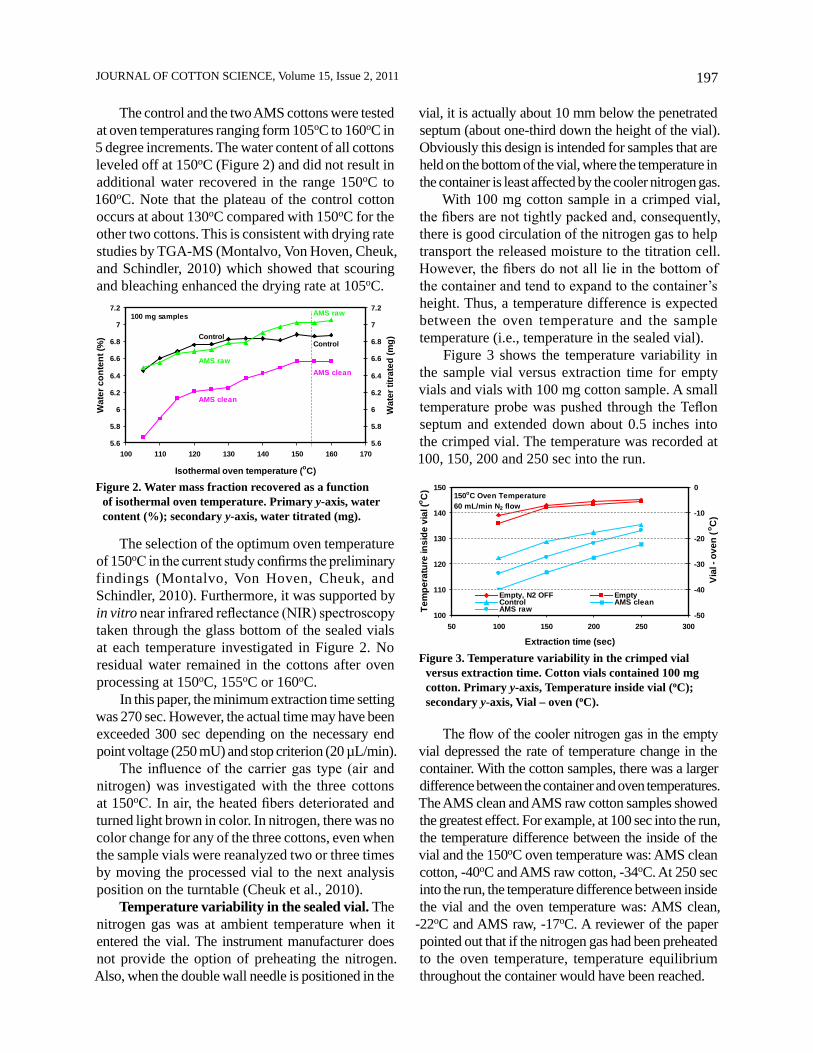
The control and the two AMS cottons were tested at oven temperatures ranging form 105oC to 160oC in 5 degree increments. The water content of all cottons leveled off at 150oC (Figure 2) and did not result in additional water recovered in the range 150oC to 160oC. Note that the plateau of the control cotton occurs at about 130oC compared with 150oC for the other two cottons. This is consistent with drying rate studies by TGA-MS (Montalvo, Von Hoven, Cheuk, and Schindler, 2010) which showed that scouring and bleaching enhanced the drying rate at 105oC.
vial, it is actually about 10 mm below the penetrated septum (about one-third down the height of the vial). Obviously this design is intended for samples that are held on the bottom of the vial, where the temperature in the container is least affected by the cooler nitrogen gas.
With 100 mg cotton sample in a crimped vial, the fibers are not tightly packed and, consequently, there is good circulation of the nitrogen gas to help transport the released moisture to the titration cell. However, the fibers do not all lie in the bottom of the container and tend to expand to the container’s height. Thus, a temperature difference is expected between the oven temperature and the sample temperature (i.e., temperature in the sealed vial).
Figure 3 shows the temperature variability in the sample vial versus extraction time for empty vials and vials with 100 mg cotton sample. A small temperature probe was pushed through the Teflon septum and extended down about 0.5 inches into the crimped vial. The temperature was recorded at 100, 150, 200 and 250 sec into the run.
100
110
120
130
140
150
50 100 150 200 250 300
Extraction time (sec)
Tem
pera
ture
insi
de v
ial (
o C)
-50
-40
-30
-20
-10
0
Via
l - o
ven
(o C)
Empty, N2 OFF EmptyControl AMS cleanAMS raw
150oC Oven Temperature60 mL/min N2 flow
Figure 3. Temperature variability in the crimped vial versus extraction time. Cotton vials contained 100 mg cotton. Primary y-axis, Temperature inside vial (oC); secondary y-axis, Vial – oven (oC).
Figure 2. Water mass fraction recovered as a function of isothermal oven temperature. Primary y-axis, water content (%); secondary y-axis, water titrated (mg).
5.6
5.8
6
6.2
6.4
6.6
6.8
7
7.2
100 110 120 130 140 150 160 170
Isothermal oven temperature (oC)
Wat
er c
onte
nt (%
)
5.6
5.8
6
6.2
6.4
6.6
6.8
7
7.2
Wat
er ti
trate
d (m
g)
100 mg samples
ControlControl
AMS raw
AMS rawAMS clean
AMS clean
The selection of the optimum oven temperature of 150oC in the current study confirms the preliminary findings (Montalvo, Von Hoven, Cheuk, and Schindler, 2010). Furthermore, it was supported by in vitro near infrared reflectance (NIR) spectroscopy taken through the glass bottom of the sealed vials at each temperature investigated in Figure 2. No residual water remained in the cottons after oven processing at 150oC, 155oC or 160oC.
In this paper, the minimum extraction time setting was 270 sec. However, the actual time may have been exceeded 300 sec depending on the necessary end point voltage (250 mU) and stop criterion (20 µL/min).
The influence of the carrier gas type (air and nitrogen) was investigated with the three cottons at 150oC. In air, the heated fibers deteriorated and turned light brown in color. In nitrogen, there was no color change for any of the three cottons, even when the sample vials were reanalyzed two or three times by moving the processed vial to the next analysis position on the turntable (Cheuk et al., 2010).
Temperature variability in the sealed vial. The nitrogen gas was at ambient temperature when it entered the vial. The instrument manufacturer does not provide the option of preheating the nitrogen. Also, when the double wall needle is positioned in the
The flow of the cooler nitrogen gas in the empty vial depressed the rate of temperature change in the container. With the cotton samples, there was a larger difference between the container and oven temperatures. The AMS clean and AMS raw cotton samples showed the greatest effect. For example, at 100 sec into the run, the temperature difference between the inside of the vial and the 150oC oven temperature was: AMS clean cotton, -40oC and AMS raw cotton, -34oC. At 250 sec into the run, the temperature difference between inside the vial and the oven temperature was: AMS clean,
-22oC and AMS raw, -17oC. A reviewer of the paper pointed out that if the nitrogen gas had been preheated to the oven temperature, temperature equilibrium throughout the container would have been reached.
198MONTALVO ET AL.: REFERENCE METHOD FOR WATER IN COTTON LINT
For oven temperature settings from 110oC to 135oC, the observed water content increased in the order (Figure 2): AMS clean, AMS raw and control. Note that the temperature check curves inside the sealed vials follow the same order. At an oven temperature setting of 135oC, essentially all of the water in the control cotton had been titrated (Figure 2). At 150oC the relative water contents in the increasing order: AMS clean, control and AMS raw.
Selectivity. Volumetric KFT is sensitive to small amounts of water but is also sensitive to disturbances caused by chemical side reactions (Scholz, 1984). The non-aqueous volatiles in cotton may produce chemical interferences in the KFT reactions that consume additional iodine in the reagent. This would result in a positive bias and is designated Type I interference. The heating of the cotton in the KFT oven may produce chemical interferences that yield additional water. This also would result in a positive bias since more iodine is required (Type II interference). The non-aqueous volatiles in cotton may produce chemical interferences that oxidize iodide in the titration cell to iodine. This would be a negative bias because less iodine is consumed (Type III interference).
We have developed the technology to probe for the existence of any of the three side reactions based on pre-drying 100 mg cotton under nitrogen in a crimped KFT vial at 50oC and then analyzing the pre-dried specimen by KFT with 150oC oven evaporation of non-aqueous volatiles (Table 2). Complete removal of the moisture in cotton after drying for 24 hrs at the mild temperature of 50oC with nitrogen purge gas was confirmed by NIR spectroscopy observed through the glass vial. All selectivity studies were run after replacing the working medium in the titration cell with fresh medium.
KFT selectivity (S) to water in cotton, relative to the above interfering substances, was calculated by simple formulas, Equations 3 and 4. The equations were derived in order that all three types of interferences could be modeled and S measured by KFT analysis of moist (TWC) and pre-dried fibers (EWCI):
S = (TWC – EWCI)/EWCI (Type I, II) [Eq. 3]
and
S = (TWC + EWCI)/│EWCI│ (Type III) [Eq. 4]
where TWC = total water content (%) in cotton by KFT and EWCI = equivalent water content (%) of
interferences measured on the pre-dri ed fibers. The numerator in both formulas is the water content by KFT corrected for interferences and the denominator is the amount of interferences.
Note that EWCI is positive for Type I and II interferences but this bias is negative for Type III, since iodine is produced rather than consumed (the interferent converts iodide to I2). To make S values in both models (Eqs. 3 and 4) positive, the absolute value of EWCI is used in Eq. 4 (i.e., │- EWCI│= EWCI). Thus, the physical meaning of the formulas is that it is the ratio of corrected water content to interferences content expressed as the equivalent water content.
A report in the literature (Cedergren and Luan, 1998) expressed the discrimination factor between the Karl Fischer reaction and the interfering reaction as the ratio of rate expressions between the desired reaction and the interfering reaction. The discrimination factor was inversely proportional to the concentration of the interfering substance.
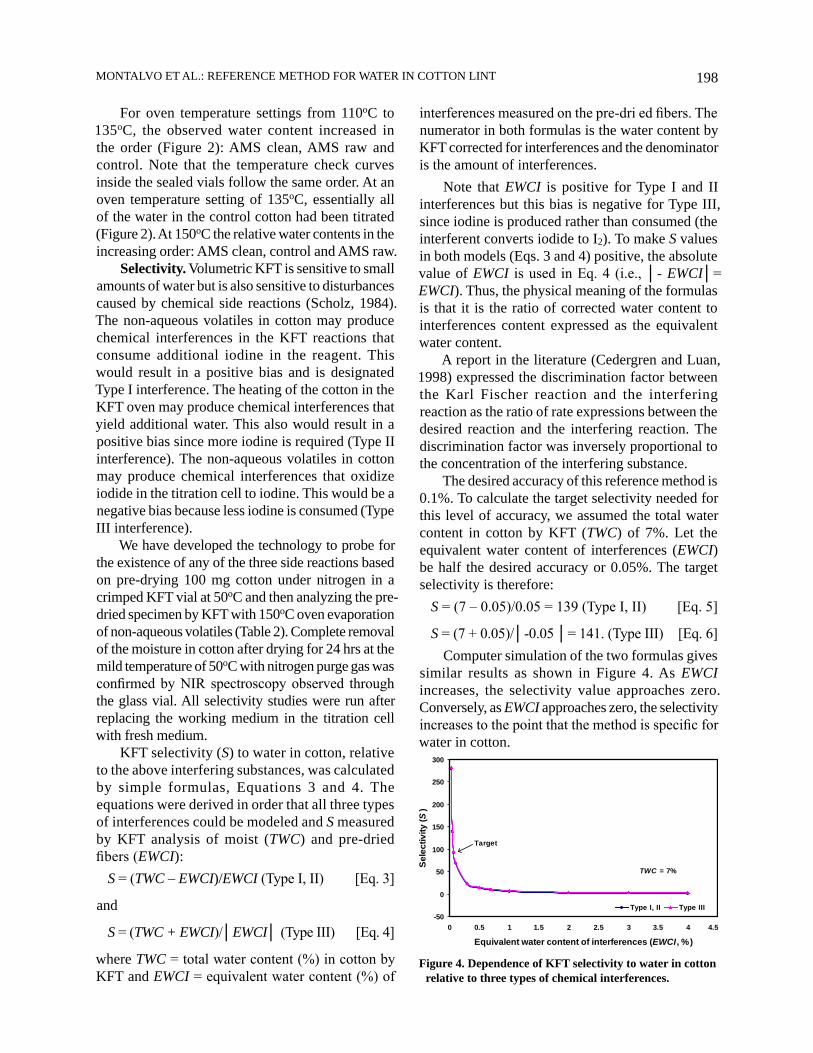
The desired accuracy of this reference method is 0.1%. To calculate the target selectivity needed for this level of accuracy, we assumed the total water content in cotton by KFT (TWC) of 7%. Let the equivalent water content of interferences (EWCI) be half the desired accuracy or 0.05%. The target selectivity is therefore:
S = (7 – 0.05)/0.05 = 139 (Type I, II) [Eq. 5]
S = (7 + 0.05)/│-0.05 │= 141. (Type III) [Eq. 6]Computer simulation of the two formulas gives
similar results as shown in Figure 4. As EWCI increases, the selectivity value approaches zero. Conversely, as EWCI approaches zero, the selectivity increases to the point that the method is specific for water in cotton.
Figure 4. Dependence of KFT selectivity to water in cotton relative to three types of chemical interferences.
-50
0
50
100
150
200
250
300
0 0.5 1 1.5 2 2.5 3 3.5 4 4.5
Equivalent water content of interferences (EWCI, %)
Sele
ctiv
ity (S
)
Type I, II Type III
TWC = 7%
Target
199JOURNAL OF COTTON SCIENCE, Volume 15, Issue 2, 2011
Selectivity results on the three cottons investigated are summarized in Table 5. The absence of non-aqueous materials that interfere with the Karl Fischer method was confirmed with the recommended 100 mg sample size. The two values reported for S (Type I , II interference) for the control cotton (S = 405, 407) were measured months apart and support the consistency of the experimental method to measure selectivity. Although S (Type I, II interference) is reduced for the AMS clean and AMS raw cottons relative to the control, the selectivity is still better than the target value of 140 and thus, the interferences do not significantly bias the reported water content by KFT. However, the fact that S (Type I, II interference) is less for the AMS raw cotton compared to the AMS clean cotton which had been mechanically cleaned, additional studies are needed to expand the selectivity database.
As to non-aqueous materials in the cottons that oxidize iodide in the titration cell to iodine, the S (Type III interference) results were all extremely large (Table 5). This specific interferent was checked with the pre-dried cottons by observing the difference in mL titrant of a blank run before and after KFT assay of a cotton sample (i.e., run blank1, cotton, blank2; Δ mL blank = blank2 – blank1). If there was a buildup of iodine in the titration cell from oxidation of iodide then blank2 < blank1 or Δ mL < 0. The normal mean blank value is 0.02 mL titrant corresponding to 0.1% water in cotton. After subtraction of each successive blank value from the blank run before the cotton, Δ mL was either very small or zero for all three cottons, indicating the absence of Type III interferences. The
results in Table 5 will be compared to the method of Margolis et al. (2002), using a special Karl Fischer reagent to measure substances that react with iodine but are not water, and reported elsewhere.
Matrix effect on the working medium in the titration cell. The Karl Fischer instrumental analysis system in this investigation has a 35 sample turntable. The working medium in the titration cell is always pumped out and replaced with fresh medium before the start of any run on sequential samples of cotton. Accurate analysis of a sample sequence using the same working medium is a function of the condition of the working medium. A matrix effect will change the end point and thus bias the results. The cause of this effect is the build up of cotton non-aqueous volatiles and/or Karl Fischer reaction products in the titration cell.
To determine the amount of cotton non-aqueous volatiles that may accumulate in the same working medium as a function of sequential sample number, we calculated averaged values from a prior study based on analyzing three cottons, 100 mg samples (Montalvo, Von Hoven, Cheuk, and Schindler, 2010). The averaged difference in weight of the sealed sample vials, before and after KFT, gave the averaged weight loss including total water content by KFT. Subtracting the averaged water content from the averaged weight loss gave the mean amount of non-aqueous volatiles: 0.7 mg. Thus, the calculated amount of cotton non-aqueous volatiles (mg) that would have accumulated in the same working medium as a function of sequential sample number is (sample #/mg): 1/0.7; 10/7; 20/14; 25/17.5 and 35/24.5.
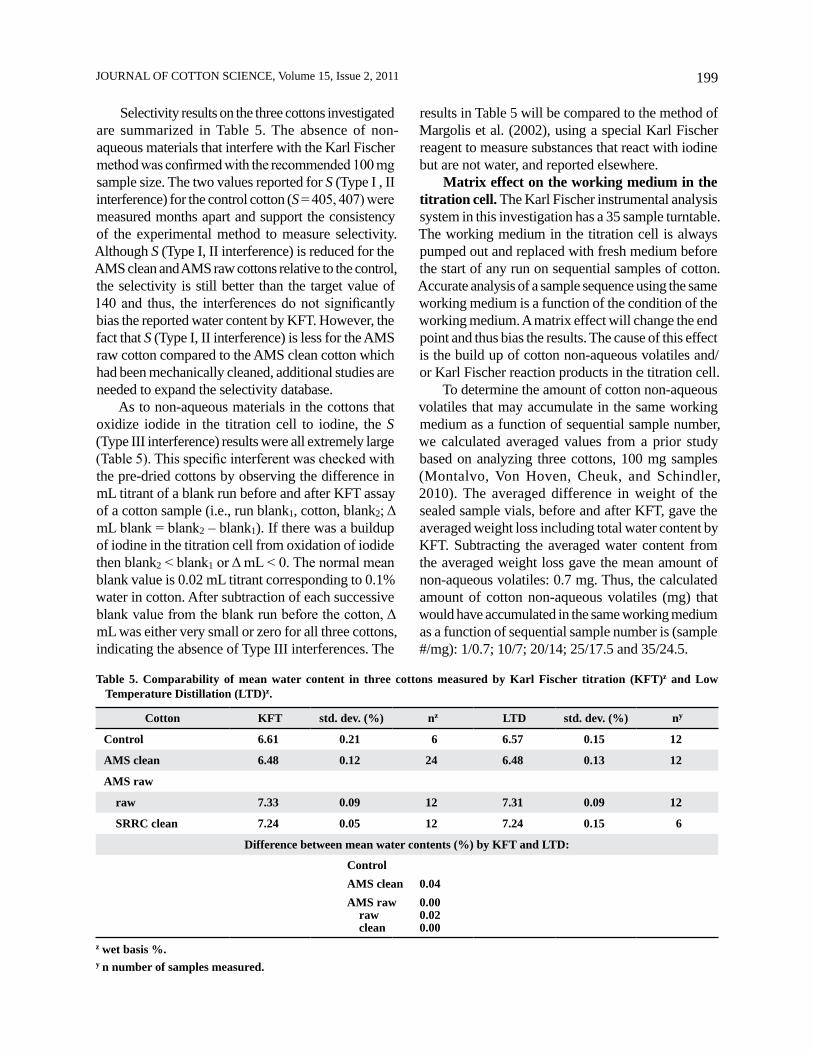
Table 5. Comparability of mean water content in three cottons measured by Karl Fischer titration (KFT)z and Low Temperature Distillation (LTD)z.
Cotton KFT std. dev. (%) nz LTD std. dev. (%) ny
Control 6.61 0.21 6 6.57 0.15 12
AMS clean 6.48 0.12 24 6.48 0.13 12
AMS raw
raw 7.33 0.09 12 7.31 0.09 12
SRRC clean 7.24 0.05 12 7.24 0.15 6
Difference between mean water contents (%) by KFT and LTD:
ControlAMS clean 0.04AMS raw 0.00 raw 0.02 clean 0.00
z wet basis %.y n number of samples measured.
200MONTALVO ET AL.: REFERENCE METHOD FOR WATER IN COTTON LINT
Other investigators have analyzed the spent working medium and found a change in cell solution pH, conductivity and polarity that resulted in noisy responses (Grunke, 2003). Replacing the spent cell solvent with fresh solution restored the correct readings.
In discussing this section of the paper, we note that sample position number on the turntable is not the same as sequential sample number. Sample positions number 1 to 12 were reserved for the analysis of four blank vials followed by eight titer determinations.
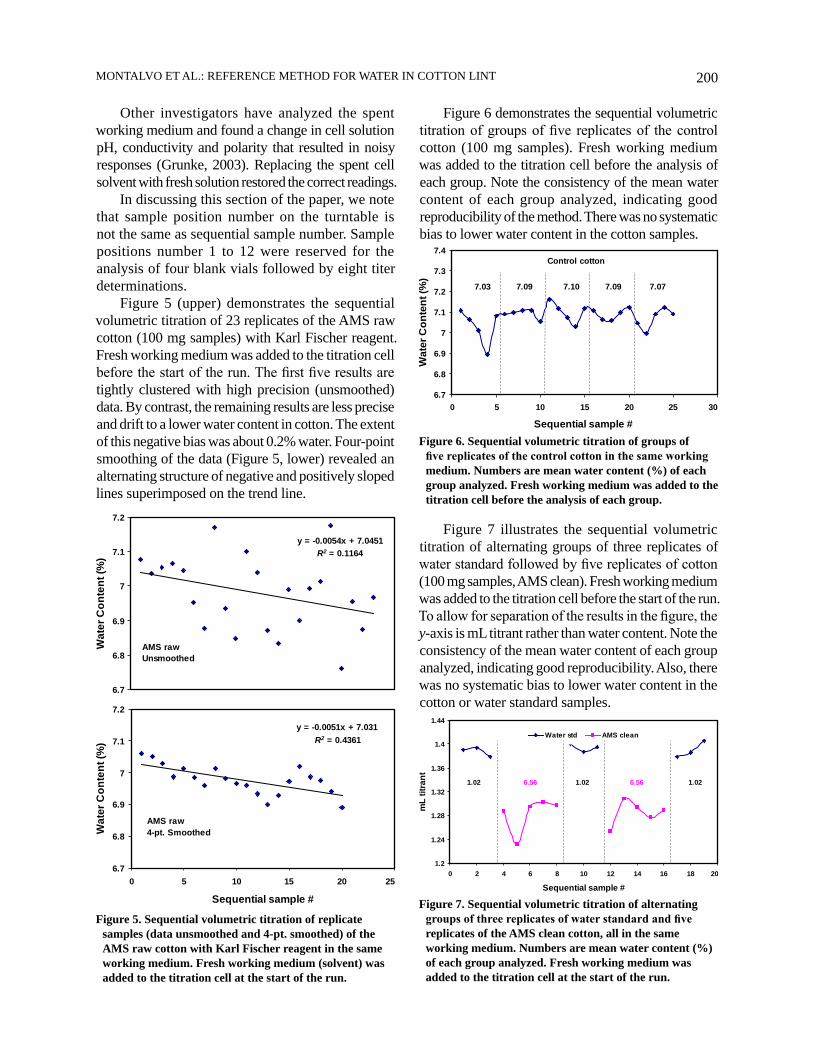
Figure 5 (upper) demonstrates the sequential volumetric titration of 23 replicates of the AMS raw cotton (100 mg samples) with Karl Fischer reagent. Fresh working medium was added to the titration cell before the start of the run. The first five results are tightly clustered with high precision (unsmoothed) data. By contrast, the remaining results are less precise and drift to a lower water content in cotton. The extent of this negative bias was about 0.2% water. Four-point smoothing of the data (Figure 5, lower) revealed an alternating structure of negative and positively sloped lines superimposed on the trend line.
Figure 6 demonstrates the sequential volumetric titration of groups of five replicates of the control cotton (100 mg samples). Fresh working medium was added to the titration cell before the analysis of each group. Note the consistency of the mean water content of each group analyzed, indicating good reproducibility of the method. There was no systematic bias to lower water content in the cotton samples.
Figure 5. Sequential volumetric titration of replicate samples (data unsmoothed and 4-pt. smoothed) of the AMS raw cotton with Karl Fischer reagent in the same working medium. Fresh working medium (solvent) was added to the titration cell at the start of the run.
y = -0.0054x + 7.0451R2 = 0.1164
6.7
6.8
6.9
7
7.1
7.2
Wat
er C
onte
nt (%
)
AMS rawUnsmoothed
y = -0.0051x + 7.031R2 = 0.4361
6.7
6.8
6.9
7
7.1
7.2
0 5 10 15 20 25
Sequential sample #
Wat
er C
onte
nt (%
)
AMS raw4-pt. Smoothed
Figure 6. Sequential volumetric titration of groups of five replicates of the control cotton in the same working medium. Numbers are mean water content (%) of each group analyzed. Fresh working medium was added to the titration cell before the analysis of each group.
6.7
6.8
6.9
7
7.1
7.2
7.3
7.4
0 5 10 15 20 25 30
Sequential sample # W
ater
Con
tent
(%)
7.03 7.09 7.10 7.09 7.07
Control cotton
1.2
1.24
1.28
1.32
1.36
1.4
1.44
0 2 4 6 8 10 12 14 16 18 20
Sequential sample #
mL
titra
nt
Water std AMS clean
1.02 6.56 1.02 6.56 1.02
Figure 7 illustrates the sequential volumetric titration of alternating groups of three replicates of water standard followed by five replicates of cotton (100 mg samples, AMS clean). Fresh working medium was added to the titration cell before the start of the run. To allow for separation of the results in the figure, the y-axis is mL titrant rather than water content. Note the consistency of the mean water content of each group analyzed, indicating good reproducibility. Also, there was no systematic bias to lower water content in the cotton or water standard samples.
Figure 7. Sequential volumetric titration of alternating groups of three replicates of water standard and five replicates of the AMS clean cotton, all in the same working medium. Numbers are mean water content (%) of each group analyzed. Fresh working medium was added to the titration cell at the start of the run.
201JOURNAL OF COTTON SCIENCE, Volume 15, Issue 2, 2011
The trials that successfully prevented the biased results with the control and AMS clean cottons prompted a reexamination of the AMS raw cotton. Would the observed bias (Figure 5) persist in a cleaned state? A hypothesis that the fundamental cause of the bias is chemical or physical processes in the working medium that have not reached equilibrium in the allotted five min for each sequential sample on the turntable was developed. These processes may include side chemical reactions or electrode absorption and desorption of cotton non-aqueous volatiles. Alternating groups of cotton replicates and one blank vial provided a simple way to test the hypothesis.
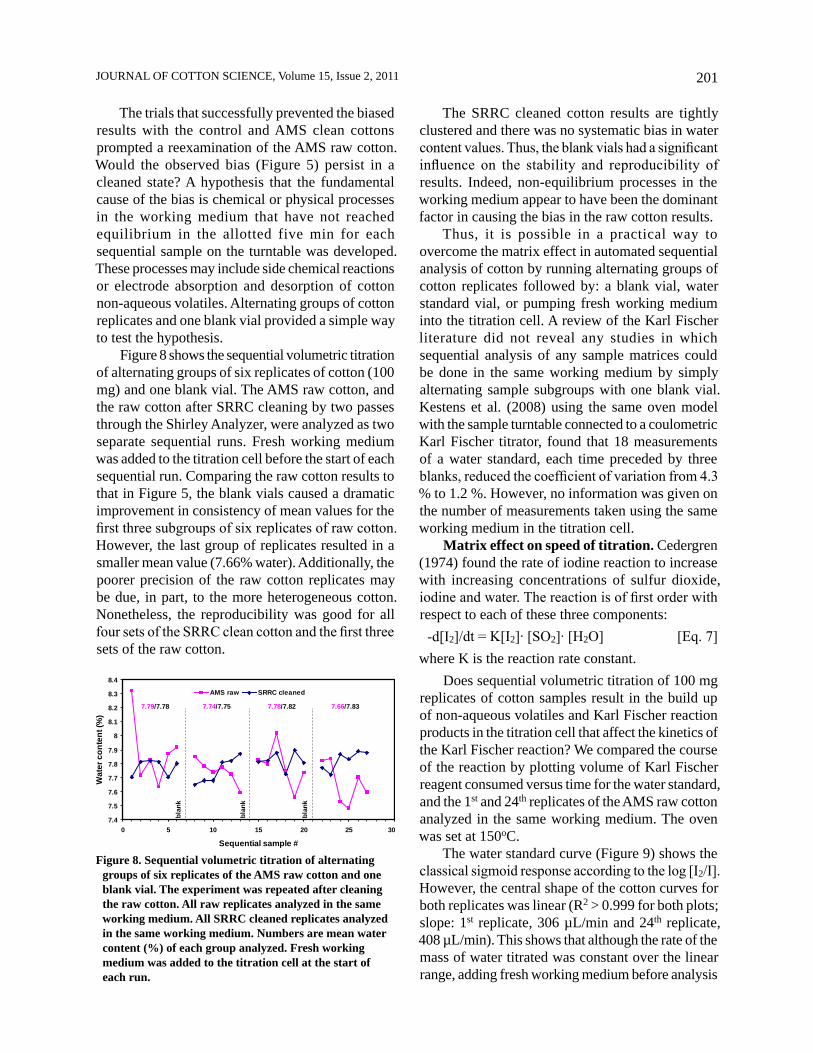
Figure 8 shows the sequential volumetric titration of alternating groups of six replicates of cotton (100 mg) and one blank vial. The AMS raw cotton, and the raw cotton after SRRC cleaning by two passes through the Shirley Analyzer, were analyzed as two separate sequential runs. Fresh working medium was added to the titration cell before the start of each sequential run. Comparing the raw cotton results to that in Figure 5, the blank vials caused a dramatic improvement in consistency of mean values for the first three subgroups of six replicates of raw cotton. However, the last group of replicates resulted in a smaller mean value (7.66% water). Additionally, the poorer precision of the raw cotton replicates may be due, in part, to the more heterogeneous cotton. Nonetheless, the reproducibility was good for all four sets of the SRRC clean cotton and the first three sets of the raw cotton.
The SRRC cleaned cotton results are tightly clustered and there was no systematic bias in water content values. Thus, the blank vials had a significant influence on the stability and reproducibility of results. Indeed, non-equilibrium processes in the working medium appear to have been the dominant factor in causing the bias in the raw cotton results.
Thus, it is possible in a practical way to overcome the matrix effect in automated sequential analysis of cotton by running alternating groups of cotton replicates followed by: a blank vial, water standard vial, or pumping fresh working medium into the titration cell. A review of the Karl Fischer literature did not reveal any studies in which sequential analysis of any sample matrices could be done in the same working medium by simply alternating sample subgroups with one blank vial. Kestens et al. (2008) using the same oven model with the sample turntable connected to a coulometric Karl Fischer titrator, found that 18 measurements of a water standard, each time preceded by three blanks, reduced the coefficient of variation from 4.3 % to 1.2 %. However, no information was given on the number of measurements taken using the same working medium in the titration cell.
Matrix effect on speed of titration. Cedergren (1974) found the rate of iodine reaction to increase with increasing concentrations of sulfur dioxide, iodine and water. The reaction is of first order with respect to each of these three components:
-d[I2]/dt = K[I2]∙ [SO2]∙ [H2O] [Eq. 7]where K is the reaction rate constant.
Does sequential volumetric titration of 100 mg replicates of cotton samples result in the build up of non-aqueous volatiles and Karl Fischer reaction products in the titration cell that affect the kinetics of the Karl Fischer reaction? We compared the course of the reaction by plotting volume of Karl Fischer reagent consumed versus time for the water standard, and the 1st and 24th replicates of the AMS raw cotton analyzed in the same working medium. The oven was set at 150oC.
The water standard curve (Figure 9) shows the classical sigmoid response according to the log [I2/I]. However, the central shape of the cotton curves for both replicates was linear (R2 > 0.999 for both plots; slope: 1st replicate, 306 µL/min and 24th replicate, 408 µL/min). This shows that although the rate of the mass of water titrated was constant over the linear range, adding fresh working medium before analysis
Figure 8. Sequential volumetric titration of alternating groups of six replicates of the AMS raw cotton and one blank vial. The experiment was repeated after cleaning the raw cotton. All raw replicates analyzed in the same working medium. All SRRC cleaned replicates analyzed in the same working medium. Numbers are mean water content (%) of each group analyzed. Fresh working medium was added to the titration cell at the start of each run.
7.4
7.5
7.6
7.7
7.8
7.9
8
8.1
8.2
8.3
8.4
0 5 10 15 20 25 30
Sequential sample #
Wat
er c
onte
nt (%
)
AMS raw SRRC cleaned
blan
k
blan
k
blan
k
7.79/7.78 7.66/7.837.78/7.827.74/7.75

202MONTALVO ET AL.: REFERENCE METHOD FOR WATER IN COTTON LINT
of the 1st replicate produced a lower rate of reagent consumption (306 µL/min) yet resulted in a higher reported water content in the cotton.
A reviewer of this paper suggested that the variation in titration speed of the cotton replicates (Figure 9) may be due to variability in the rate of diffusion of heat to the center of the cotton in the vial, since the cotton can be placed in a variety of positions. While this may account for some of the variability, it does not explain why this effect does not occur when fresh working medium is in the titration cell.
198.6 and 24th (lower), 234.9. Thus, after only 30 sec the 1st replicate was still consuming reagent at a low rate and the 24th replicate was in a high rate of consumption even though mU was close to the end point voltage. As the titration approached termination for the 1st replicate (upper), the fresh working medium resulted in a small rate of delivery of reagent, points b to c, and the end point mU gradually decreased to about 150 mU (points d to e). In contrast, the spent working medium resulted in a rapid or sharp cutoff of delivery of reagent for the 24th replicate (lower), points b to c, and the voltage rapidly dropped to about 150 mU and slowly began to rise, points d to e.
Figure 9. Comparability of progress of the Karl Fischer reaction to the water standard and the AMS raw cotton. The figure legend ‘AMS raw, #1’ refers to analysis of the first replicate of the cotton and ‘AMS raw, #24’ refers to sequential analysis of the 24th replicate of the cotton. All cotton replicates were analyzed in the same working medium. Fresh working medium was added to the titration cell at the start of the water standard and AMS raw runs.
-0.2
0
0.2
0.4
0.6
0.8
1
1.2
1.4
1.6
0 50 100 150 200 250 300 350
Extraction time (sec)
mL
titra
nt
Water stdAMS raw, # 1AMS raw, # 24
To help understand the difference in results between the two cotton replicates, we examined the Karl Fischer chemical reaction data with different primary and secondary y-axis plots versus extraction time (Figure 10). The primary y-axis is the derivative of the reagent consumption versus time (dV/dt, units are µL/min). The secondary y-axis is the measured voltage between the two platinum electrodes (mU, expressed in millivolts) with fixed polarization current of 60 µA. (Note that the predefined target end point is 250 mU. The titration termination at the end point takes place under drift-control, which was set at 20 µL/min or 3.33 µL/10 sec. Although many readings were taken by the software over the extraction period, the data was stored on hard disk at 10 sec intervals.)
In the Figure 10 plots at 30 sec (points a) into the titration, the measured values are: dV/dt (µL/min), 1st replicate (upper plot), 35.3 and 24th replicate (lower plot), 333.8; and mU (millivolts), 1st (upper),
0
50
100
150
200
250
300
350
400
450
500
Mic
rolit
ers/
min
(dV/
dt)
0
50
100
150
200
250
300
350
Mill
ivol
t (m
U)
dV/dt mU
AMS raw, # 1a
a
b
c
d
e
0
50
100
150
200
250
300
350
400
450
500
0 50 100 150 200 250 300 350
Extraction time (sec)
Mic
rolit
ers/
min
(dV/
dt)
0
50
100
150
200
250
300
350
Mill
ivol
t (m
U)
dV/dt mU
AMS raw, # 24
a
b
c
d
e
Figure 10. Comparability of rate of reagent addition and control voltage in sequential analysis of replicates of the AMS raw cotton. In the figure ‘AMS raw, #1’ refers to analysis of the first replicate of the cotton; ‘AMS raw, #24’ refers to sequential volumetric titration of the 24th replicate of the cotton. Primary y-axis, microliters/min (dV/dt); secondary y-axis, millivolt (mU). All replicates analyzed in the same working medium. Fresh working medium was added to the titration cell at the start of the run.
These observations are consistent with apparent depolarization of the electrodes caused by on-going chemical reactions in solution or material absorbed on the electrode surfaces. The overall effect was an abrupt and early end point indication with a larger than expected excess of iodine in the titration cell solution. This was confirmed by visual observation of the color of the solution. After KFT analysis of the 1st replicate, the resulting solution was very light
203JOURNAL OF COTTON SCIENCE, Volume 15, Issue 2, 2011
brown compared to intensive brown after sequential determination of 24 replicates of the AMS raw cotton in the same working medium.
To summarize, the non-aqueous volatiles in the AMS raw cotton influenced the water content values and the speed of titration in an extended sample sequence (24 replicates) in the same working medium. The increase in titration speed was continuous throughout the run, rather than at the end point of titration, where several types of interferences are largest (Cedergren and Oradd, 1994; Oradd and Cedergren, 1995). Biased results were easily avoided by alternating groups of raw cotton replicates with a blank vial and limiting the number of allowable sequential titrations in the same working medium. Perhaps the most direct way to minimize the matrix effect problems would be to preheat the nitrogen entering the sealed vials to match a lower oven temperature. This work is in progress.
KFT method validation. Method validation was based on comparing the independent KFT and LTD method results (Table 4). As can be seen in the table, the differences between the paired results are < 0.1% water, indicating accurate reference methods. Reproducibility of both methods is good. Furthermore, the small differences in results support the selectivity data.
CONCLUSIONS
A fully automated reference method to measure total water content (%) in lint cotton has been developed and validated. The method consists of rapid oven drying in a small oven in combination with volumetric Karl Fischer Titration (KFT) of the moisture released from the fiber matrix during the heating period. The instrumentation is commercially available.
Dry nitrogen carrier gas is used rather than air for water vapor transport from the sample container in the oven to the titration cell. The nitrogen prevents oxidative decomposition of the sample in the presence of oxygen.
In depth examination of the variables in the method led to an insight into the critical variables. For example, under estimation of water contents due to sequential titrations in the same working medium produced a trend (bias) that could be prevented in a practical way – by alternating groups of six cotton replicates and a blank vial . This trend is caused by non-equilibrium effects from accumulation of
cotton non-aqueous volatiles in the working medium. Alternating the sample type allows equilibrium to be established and produced consistent mean results with good reproducibility.
Fresh working medium was added to the titration cell before the start of the selectivity runs to prevent spent medium from confounding the selectivity results. The discrimination factor between the Karl Fischer reaction and side reactions was quite good, indicating no significant interferences. Furthermore, the KFT results were confirmed by Low Temperature Distillation (LTD), which dries the samples in nitrogen at a temperature below the boiling point of water to minimize generation of non-aqueous volatiles. Additionally, both KFT and LTD samples were checked for residual moisture by in vitro NIR.
For the first time, it may be possible to calibrate, package and distribute to collaborators standard reference cottons certified for total water content. A pilot study is in progress.
ACKNOWLEDGMENT
Laboratory assistance by Thomas North. Review of the draft manuscript by Brian Lang (NIST), Sam Margolis (NIST, ret.), Clif Boykin (ARS, Stoneville, MS), James Rodgers (SRRC), Alfred French (SRRC) and Chris Delhom (SRRC) is acknowledged. Financial support by The Cotton Foundation project # 5001-005-00; Cotton Incorporated Cooperative Agreement # 09-560; and the ARS Headquarters Funded Postdoc Program, Class of 2008, is greatly appreciated.
DISCLAIMER
Mention of a trade name, proprietary product, or specific equipment does not constitute a guarantee or warranty by the USDA and does not imply approval of a product to the exclusion of others that may be suitable.
APPENDIX: SPECIALIST TERMS AND THEIR MEANINGS
Reference methodsStandard Oven Drying (SOD): classic oven-
drying reference method (e.g., ASTM D 2495) to determine moisture content in cotton (wet or dry basis) at an oven temperature of 105oC to 110oC in air at standard textile testing conditions (ASTM D 1776)
204MONTALVO ET AL.: REFERENCE METHOD FOR WATER IN COTTON LINT
Volumetric Karl Fischer Titration (KFT): classic titration method applied to cotton samples to determine total water content (wet basis in this paper) by oven evaporation at 150oC in dry nitrogen combined with volumetric titration of the released water vapor using Karl Fischer reagent
Low Temperature Distillation (LTD): independent oven-drying reference method developed in this laboratory to determine total water content (wet basis in this paper) in cotton at a temperature of less than the boiling point of water (100oC) and in a dry nitrogen atmosphere
KFT selectivity and interferencesselectivity (S): discrimination factor between
the Karl Fischer reaction [Eq. 2] and the interfering reactions
equivalent water content of interferences (EWCI): extent to which the KFT method responds to the interfering volatiles in cotton pre-dried at 50oC and expressed as equivalent water content (%). Note that EWCI is positive for Type I and II interferences but negative for Type III, in which case it is denoted in Eq. 4 by the absolute value, │EWCI│
type I interference: non-aqueous volatiles in cotton that consume additional Karl Fischer regent (positive bias)
type II interference: non-aqueous volatiles in cotton that produce additional water (positive bias)
type III interference: non-aqueous volatiles in cotton that oxidize iodide in the titration cell to iodine (negative bias)
Karl Fischer solutions and vialsworking medium: specially formulated solution
or solvent in the titration cellfresh working medium: working medium
added to replace existing mediumspent working medium: a waste medium that
has become exhausted and is no longer usefultiter: strength of the Karl Fischer titrating reagent
expressed as equivalent mg water titrated/mL reagentblank vial: sealed, empty KFT sample vialtiter vial: sealed KFT vial containing
predetermined amount of a certified water standard to determine reagent titer by volumetric KFT
cotton sample vial: sealed KFT vial containing a weighed mass of cottonMoisture, bound, free and total water contents
bound water content: amount of water in the cotton test specimen that is hydrogen bonded to cellulose
free water content: amount of water in the cotton test specimen that is hydrogen bonded to other water in cellulose
total water content (TWC): specific measure of all or the total amount of water (free plus bound) in the test cotton specimen and expressed as a percentage of the mass of the specimen taken for analysis (wet basis in this paper)
moisture content: amount of weight loss by standard oven-drying methods including other volatile materials and expressed as a percentage of the mass of the specimen taken for analysis
water: the chemical compound H2O
APPENDIX: UNDERSTANDING KARL FISCHER CALIBRATION
EQUATIONS AND CALCULATIONS
It is instructive to examine the formulas used to compute percentage water in cotton by KFT. The basis of the calculations is the titer or strength of the Karl Fischer titrating reagent expressed as equivalent mg water titrated/mL reagent:
reagent.rated/mL water titmgtiter = [8]In this paper, the nominal titer of the reagent is
five mg water titrated per mL titrant. According to Eq. 2, one mole of water reacts stoichiometrically with one mole of I2 (molecular weights are, respectively, 18.016 and 253.82) or:
reagent./mLImg70.442 2
8.0165x253.82/1reagent water/mLmg5 ≡≡ [9]
Thus, the gravimetric relationship in the formu-lation of the reagent is one mg water to 14.088 mg I2.
A theoretical water equivalency of five mg water/mL is always reduced slightly by moisture in the at-mosphere. Additionally, the reagent has a finite shelf life. There is a need, therefore, to reestablish the actual titer value by analyzing a known water standard prior to analyzing cotton samples. This is done in this paper with a commercial water standard containing 10 mg water/mL standard. To permit weighing by difference as the measure of the amount of water standard used in the titer determination, the manufacturer has adjusted the density of the water standard to exactly 1 g = 1 mL at 20oC using a mixture of xylene, n-butanol and propylene carbonate. Thus, the gravimetric relation-ship for this standard is:
.010.0(g) wt.standardwater
(g)water wt.= [10]

205JOURNAL OF COTTON SCIENCE, Volume 15, Issue 2, 2011
Expressed in mg water:
10. x (g) wt.standard water (mg)water wt. = [11]Insertion of Eq. 11into Eq. 8 and correcting for
the atmospheric moisture in the sample container:
( ) .blankmL- titrant mL
10 x (g) wt.standardwater titrantmL
rated water titmgtiter == [12]
Water content (%) in cotton on a wet basis is calculated by:
cotton g10
10 x rated water titmg
cottong10 x rated water titg(%)content water
3
2
2
==
.cottong
0.1 x rated water titmg=
[13]
Substitution of Eq. 12 into Eq. 13 gives:
.cottong
0.1 x titer xblank)mL- titrant (mL(%)content water = [14]
The recommended cotton sample size to analyze by KFT is 0.1g or 100 mg (see below). Thus, for a 100 mg cotton sample:
rated. water titmg(%)content er cotton wat = [15]
REFERENCES
American Society for Testing and Materials. 2008. ASTM D1776 Practice for Conditioning Textiles for Testing. ASTM, West Conshohocken, PA.
American Society for Testing and Materials. 2001. ASTM D 2495 Standard Test Method for Moisture in Cotton by Oven-Drying. ASTM, West Conshohocken, PA.
Cedergren, A. 1974. Reaction rates between water and the Karl Fischer reagent. Talanta 21:265-271.
Cedergren, A., and L. Laun. 1998. Potentiometric determination of water using spent imidazole-buffered Karl Fischer reagents. Anal. Chem. 70:2174-2180.
Cedergren, A., and C. Oradd. 1994. Coulometric study of the influence of aldehydes and ketones on the Karl Fischer titration of water using standard pyridine/methanol reagents. Anal. Chem. 66:2010-2016.
Cheuk, S.Y., J. Montalvo, T. Von Hoven, and T. North. 2010. The effects of temperature and gas on moisture loss and regain of the 2001 CY cotton. p. 1436-1442. In Proc. Beltwide Cotton Conf., New Orleans, LA. 4-7 Jan. 2010. Natl. Cotton Counc. Am., Memphis, TN.
Grunke, S. 2003. The influence of conductivity on the Karl Fischer titration. Food Chemistry 82:99-105.
Kestens, V., P. Conneely, and A. Bernreuther. 2008. Vaporisation coulometric Karl Fischer titration: a perfect tool for water content determination of difficult matrix reference materials. Food Chemistry 106:1454-1459.
Margolis, S.A., J. Paulsen, and E. Park. 2002. A novel method for determining substances that interfere with the measurement of water in oils and other chemicals by the Karl Fischer method. Anal. Bioanal. Chem. 374:1274-1281.
Margolis, S.A., K. Valishnav, and J.R. Sieber. 2004. Measurement of water by oven evaporation using a novel oven design. 1. Water in water-saturated 1-octanal, coal, cement and refined oils. Anal. Bioanal. Chem. 380:556-562.
Margolis, S.A., K. Valishnav, and J.R. Sieber. 2004. Measurement of water by oven evaporation using a novel oven design. 2. Water in motor oils and motor oil additives. Anal. Bioanal. Chem. 380:843-852.
Montalvo, J.G., and T. Von Hoven. 2008. Review of standard test methods for moisture in lint cotton. J. Cotton Sci.12:33-47. [Online]. Available at http://www.cotton.org/journal/2008-12/1/33.cfm (verified 27 Jul 2010).
Montalvo, J., T. Von Hoven, S. Cheuk, and A. Schindler. 2010. Preliminary studies of non-aqueous volatiles in lint cotton moisture tests by thermal methods. Tex. Res. J. 80:1360-1376. DOI:10.1177/0040517510365949.
Montalvo, J., T.M. Von Hoven, T. North, and S.Y. Cheuk. 2010. Validation studies of the Karl Fischer reference method for moisture in cotton. p. 1378-1383. In Proc. Beltwide Cotton Conf., New Orleans, LA. 4-7 Jan. 2010. Natl. Cotton Counc. Am., Memphis, TN.
Oradd, C., and A. Cedergren. 1995. Coulometric study of recovery rates for Karl Fischer Titration of water in aldehydes and ketones using rapidly reacting methanolic and 2-methoxyethanolic reagents. Anal. Chem. 67:999-1004.
Pyper, J.W. 1985. The determination of moisture in solids. A selected review. Anal. Chim. Acta. 170:159-175.
Rodgers, J., J. Montalvo, G. Davidonis, and T. Von Hoven. 2010. Near infrared measurement of cotton fiber micronaire, maturity and fineness by off-the-shelf systems — a comparative investigation. Tex. Res. J. 80:780-793.
Scholz, E. Karl Fischer Titration. 1984. Springer-Verlag, New York, NY.