Embed Size (px)
Citation preview
COTTON DEVELOPMENT O
RGANISAT
ION
ANNUAL REPORT2009 – 2010
COTTON DEVELOPMENT ORGANISATION
II Annual Report 2009/2010
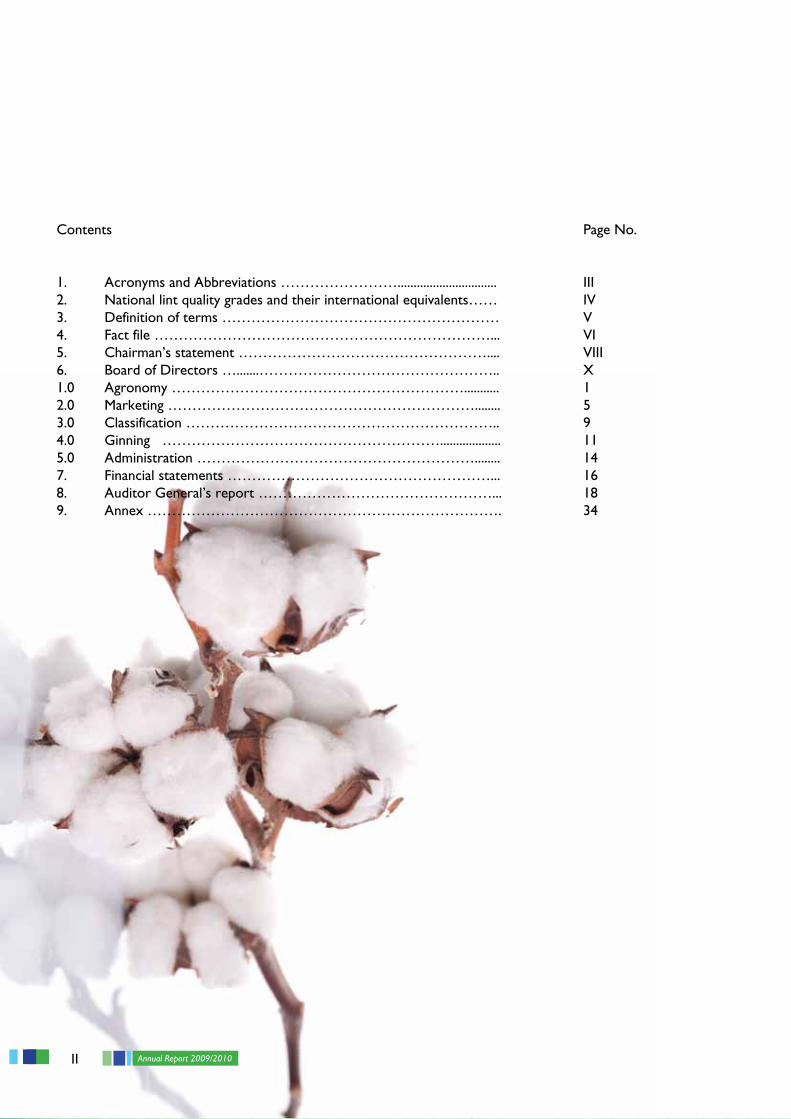
Contents Page No. 1. Acronyms and Abbreviations ……………………............................... III2. National lint quality grades and their international equivalents…… IV3. Definition of terms ………………………………………………… V4. Fact file ……………………………………………………………... VI5. Chairman’s statement …………………………………………….... VIII6. Board of Directors ….......………………………………………….. X1.0 Agronomy ……………………………………………………........... 12.0 Marketing ………………………………………………………........ 53.0 Classification ……………………………………………………….. 9 4.0 Ginning …………………………………………………................... 115.0 Administration …………………………………………………........ 14 7. Financial statements ………………………………………………... 168. Auditor General’s report …………………………………………... 189. Annex ………………………………………………………………. 34
IIIAnnual Report 2009/2010
ACRONYMS AND ABBREVIATIONS
4Rs - Runyankore, Rukiga, Runyoro, RutoroBPA - Bukalasa Pedigree AlbarCDO - Cotton Development OrganisationCFC - Common Fund for CommoditiesCSITC - Commercial Standardisation of Instrument Testing of CottonFEWs - Field Extension WorkersFICA - Farm Input Care CentreFOT - Free on TruckFY - Fiscal YearGOT - Ginning Outturn TestICAC - International Cotton Advisory CommitteeJITCO - Jinda Textiles CorporationLOFP - Lango Organic Farmers PromotionMAAIF - Ministry of Agriculture, Animal Industry and FisheriesMoFPED - Ministry of Finance, Planning and Economic DevelopmentMP - Member of ParliamentMT - Metric TonnesMTTI - Ministry of Tourism, Trade and IndustryNARO - National Agricultural Research OrganisationNaSARRI - National Semi-Arid Resources Research InstituteNBCC - North Bukedi Cotton CompanyPMIMO - Principal Market Information and Monitoring OfficerUGCEA - Uganda Ginners and Cotton Exporters AssociationUNACOFF - Uganda National Cotton Farmers’ FederationUSA - United States of AmericaWUCG - Western Uganda Cotton GinnersZARDI - Zonal Agriculture Research and Development Institute
IV Annual Report 2009/2010
NATIONAL LINT QUALITY GRADES AND THEIR INTERNATIONAL EQUIVALENTS
UCON - Good MiddlingUCOB - Strict MiddlingUCOP - Middling UCOA - Strict Low MiddlingUCOM - Low MiddlingUCOSA 1 - Strict MiddlingUCOSA 2 - Middling
VAnnual Report 2009/2010
DEFINITION OF TERMS
Certified planting seed Class of seed produced under a certification programme that is usually produced from registered seed growers.
Cess A levy on the value of sales ex-ginnery of all lint cotton.
Cotton classification The process of determining lint quality characteristics.
Cotton lint Ginned cotton which has been separated from cotton seed.
Cotton seed Seed produced from seed cotton after ginning.
Delinted seed Seed whose fuzz have been removed either mechanically or chemically.
Delinting out-turn The ratio of delinted seed to fuzzy seed.
Farm gate price The price received by cotton farmers.
Foundation seed Seed produced from breeders’ seed or seed produced under the control of NaSARRI Serere.
Fuzzy seed Cotton seed with fuzz still attached to the seed coat.
Ginning The process of separating cotton lint from cotton seed.
Ginning outturn The ratio of lint and/or seed produced from seed cotton ginned.
Indicative price Price determined from time to time by CDO and stakeholders to guide buyers and sellers of cotton seed, seed cotton and lint in arriving at what they consider fair price.
Organic cotton Organic cotton is cotton grown from non genetically modified plants, which is certified to be grown without the use of any synthetic agricultural chemicals such as fertilizers or pesticides.
Planting window The ideal/standard period of the year during which cotton is planted usually May – August.
Seed cotton Unginned cotton that contains both cotton lint and cotton seed.
Segregated area An isolated area established under provisions of the Cotton Development Act.
Fibre/Staple length The length of cotton lint fibres.
VI Annual Report 2009/2010
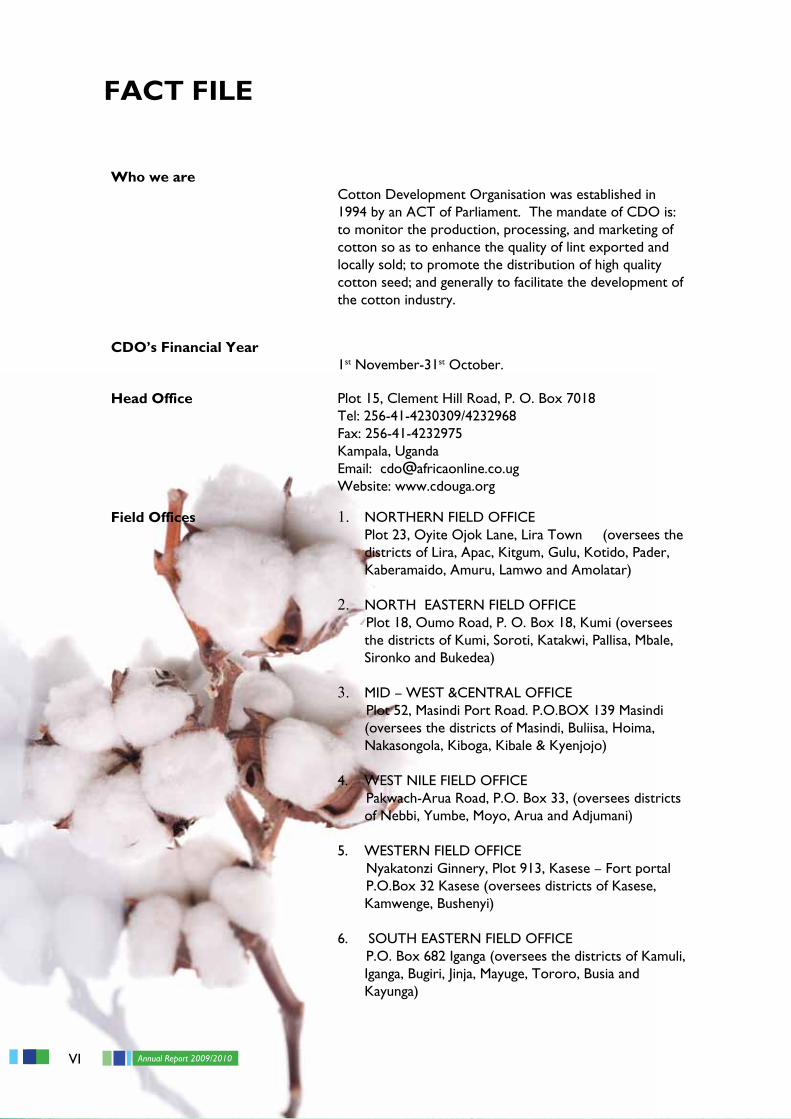
Who we are Cotton Development Organisation was established in 1994 by an ACT of Parliament. The mandate of CDO is: to monitor the production, processing, and marketing of cotton so as to enhance the quality of lint exported and locally sold; to promote the distribution of high quality cotton seed; and generally to facilitate the development of the cotton industry.
CDO’s Financial Year1st November-31st October.
Head Office Plot 15, Clement Hill Road, P. O. Box 7018Tel: 256-41-4230309/4232968Fax: 256-41-4232975Kampala, UgandaEmail: [email protected]: www.cdouga.org
Field Offices 1. NORTHERN FIELD OFFICE Plot 23, Oyite Ojok Lane, Lira Town (oversees the
districts of Lira, Apac, Kitgum, Gulu, Kotido, Pader, Kaberamaido, Amuru, Lamwo and Amolatar)
2. NORTH EASTERN FIELD OFFICE Plot 18, Oumo Road, P. O. Box 18, Kumi (oversees
the districts of Kumi, Soroti, Katakwi, Pallisa, Mbale, Sironko and Bukedea)
3. MID – WEST &CENTRAL OFFICE Plot 52, Masindi Port Road. P.O.BOX 139 Masindi
(oversees the districts of Masindi, Buliisa, Hoima, Nakasongola, Kiboga, Kibale & Kyenjojo)
4. WEST NILE FIELD OFFICE Pakwach-Arua Road, P.O. Box 33, (oversees districts
of Nebbi, Yumbe, Moyo, Arua and Adjumani)
5. WESTERN FIELD OFFICE Nyakatonzi Ginnery, Plot 913, Kasese – Fort portal P.O.Box 32 Kasese (oversees districts of Kasese,
Kamwenge, Bushenyi)
6. SOUTH EASTERN FIELD OFFICE P.O. Box 682 Iganga (oversees the districts of Kamuli,
Iganga, Bugiri, Jinja, Mayuge, Tororo, Busia and Kayunga)
FACT FILE
VIIAnnual Report 2009/2010
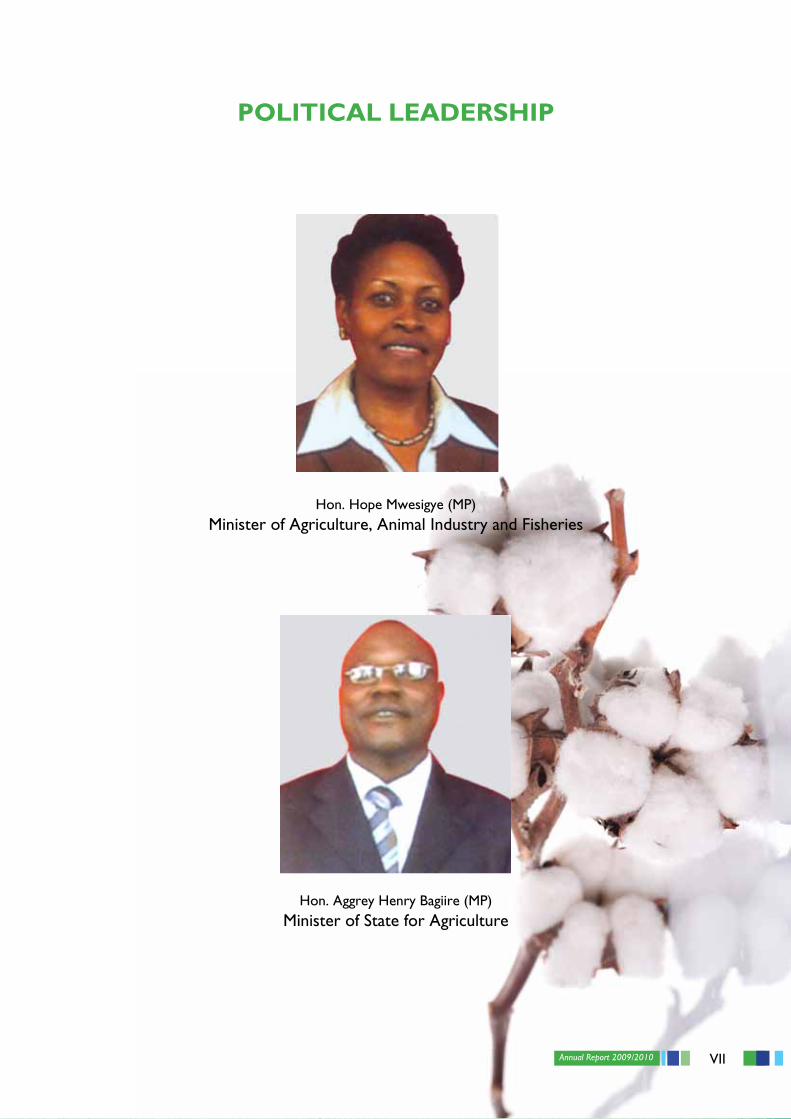
Hon. Hope Mwesigye (MP)Minister of Agriculture, Animal Industry and Fisheries
POLITICAL LEADERSHIP
Hon. Aggrey Henry Bagiire (MP)Minister of State for Agriculture
VIII Annual Report 2009/2010
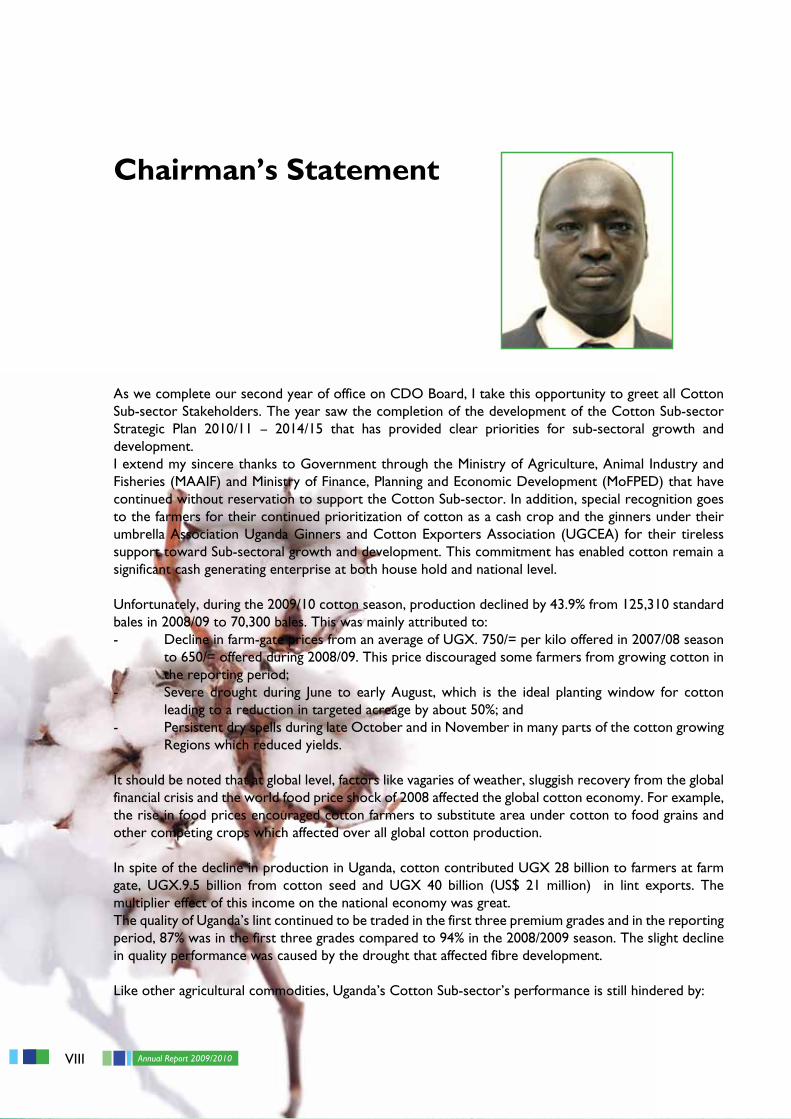
Chairman’s Statement
As we complete our second year of office on CDO Board, I take this opportunity to greet all Cotton Sub-sector Stakeholders. The year saw the completion of the development of the Cotton Sub-sector Strategic Plan 2010/11 – 2014/15 that has provided clear priorities for sub-sectoral growth and development.I extend my sincere thanks to Government through the Ministry of Agriculture, Animal Industry and Fisheries (MAAIF) and Ministry of Finance, Planning and Economic Development (MoFPED) that have continued without reservation to support the Cotton Sub-sector. In addition, special recognition goes to the farmers for their continued prioritization of cotton as a cash crop and the ginners under their umbrella Association Uganda Ginners and Cotton Exporters Association (UGCEA) for their tireless support toward Sub-sectoral growth and development. This commitment has enabled cotton remain a significant cash generating enterprise at both house hold and national level.
Unfortunately, during the 2009/10 cotton season, production declined by 43.9% from 125,310 standard bales in 2008/09 to 70,300 bales. This was mainly attributed to:- Decline in farm-gate prices from an average of UGX. 750/= per kilo offered in 2007/08 season
to 650/= offered during 2008/09. This price discouraged some farmers from growing cotton in the reporting period;
- Severe drought during June to early August, which is the ideal planting window for cotton leading to a reduction in targeted acreage by about 50%; and
- Persistent dry spells during late October and in November in many parts of the cotton growing Regions which reduced yields.
It should be noted that at global level, factors like vagaries of weather, sluggish recovery from the global financial crisis and the world food price shock of 2008 affected the global cotton economy. For example, the rise in food prices encouraged cotton farmers to substitute area under cotton to food grains and other competing crops which affected over all global cotton production.
In spite of the decline in production in Uganda, cotton contributed UGX 28 billion to farmers at farm gate, UGX.9.5 billion from cotton seed and UGX 40 billion (US$ 21 million) in lint exports. The multiplier effect of this income on the national economy was great.The quality of Uganda’s lint continued to be traded in the first three premium grades and in the reporting period, 87% was in the first three grades compared to 94% in the 2008/2009 season. The slight decline in quality performance was caused by the drought that affected fibre development.
Like other agricultural commodities, Uganda’s Cotton Sub-sector’s performance is still hindered by:
IXAnnual Report 2009/2010
i) Fluctuating Cotton prices which affect farmer’s morale,ii) Declining soil fertility,iii) Low rate of fertilizer use, iv) Erratic weather,v) Low level of domestic value addition that keeps Ugandan farmers at the mercy of global cotton prices, vi) Lack of sustainable input supply, and vii) Lack of adequate resources for more effective cotton targeted extension service delivery.
As a Board, while steering Sub-sector affairs, we made a deliberate effort to address some of the challenges which are within our reasonable control through the Sub-sector Strategic Plan 2010/11-2014/15. These include inter alia; farmer mobilization for cotton production, encouraging adoption of improved production practices such as timely planting and weeding, fertilizer and pesticide use through making them accessible and affordable and promotion of better marketing channels for farmers. We are expecting better results in the next reporting period due to a stakeholder wide cohesive focus.
I call upon all stakeholders to remain focused in their respective activities and strive for increased production and productivity in the forth coming cotton season. I also call upon Government and Private sector to seriously consider value addition to our cotton. Uganda exports still up to 95% of raw cotton (lint) with value addition and its multiplier accruing to those who add value to our cotton. If Uganda could add value to 50% of our lint produced annually through textiles manufacture, we would double cotton income to our economy.
Thank you for your commitment to the Cotton Sub-sector in Uganda.
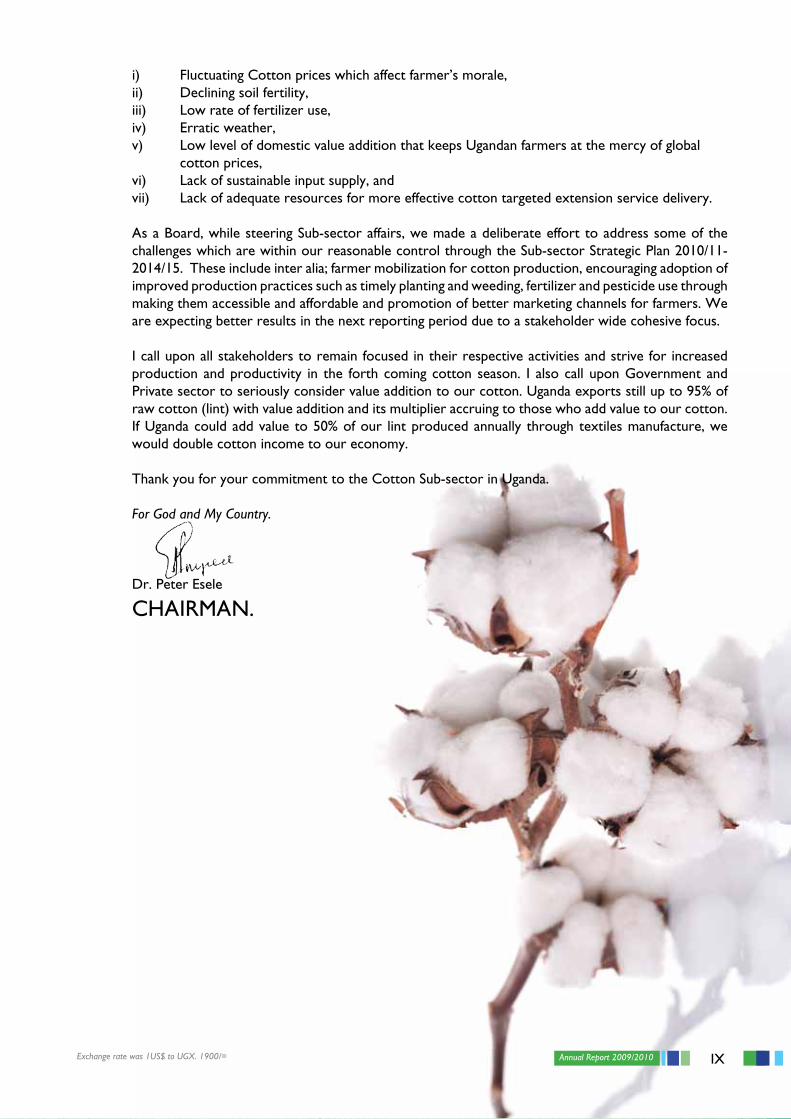
For God and My Country.
Dr. Peter Esele
CHAIRMAN.
Exchange rate was 1US$ to UGX. 1900/=
X Annual Report 2009/2010
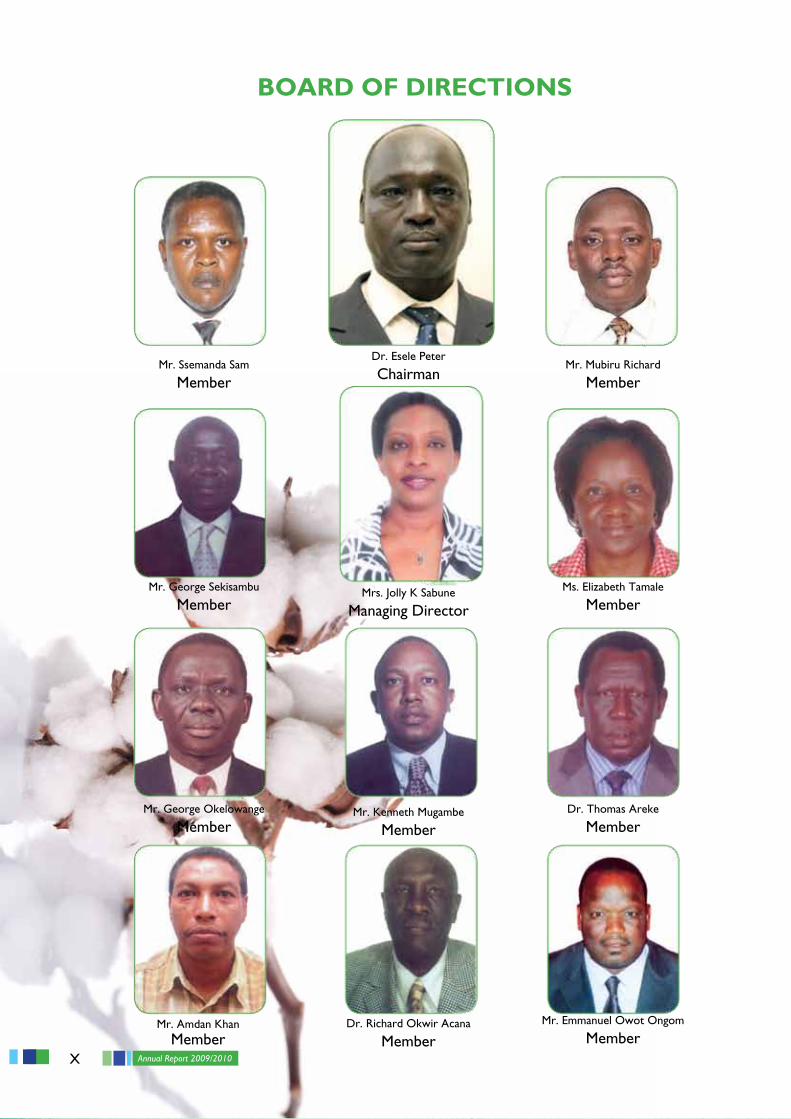
BOARD OF DIRECTIONS
Mr. Ssemanda Sam
Member
Mr. George Sekisambu
Member
Mr. George Okelowange
Member
Mr. Amdan KhanMember
Mr. Mubiru Richard
Member
Ms. Elizabeth Tamale
Member
Dr. Thomas Areke
Member
Mr. Emmanuel Owot Ongom
Member
Dr. Esele Peter
Chairman
Mrs. Jolly K Sabune
Managing Director
Mr. Kenneth Mugambe
Member
Dr. Richard Okwir Acana
Member
1Annual Report 2009/2010
1.0 Cotton production:
During the 2009/10 cotton season, production declined by 43.9% from 125,310 standard bales in 2008/09 to 70,300 bales. This was mainly attributed to:- Decline in farm-gate prices from an average of UGX. 750/= per kilo offered in 2007/08 season to 650/=
offered during 2008/09. This price discouraged some farmers from growing cotton in the reporting period.
- Severe drought during June to early August, which is the ideal planting window for cotton, affected crop establishment and reduced targeted acreage by about 50%.
- Furthermore, production was affected by persistent dry spells during late October and in November in many parts of the cotton growing Regions which resulted in shedding of flowers and bolls and premature opening of cotton.
1.1 Government support to cotton production during 2010:
The Cotton Sub-sector continued to receive Government support to cotton production as strategic crop. This support enabled Cotton Development Organisation to implement the following programs:• Provisionofcottonplantingseedtofarmers• Provisionofproductioninputs(pesticidesandspraypumps)• Provisionofcotton-extensionservices• Mobilizationandsensitizationoffarmersforcottonproduction• Establishmentofdemonstrationgardensforfarmertraining• Procurementofox-ploughsformechanizationoflandopening.
1.2 Provision of cotton planting seed to farmers:
A total of 4,661 Mt of fuzzy seed were procured from ginners and processed at the four Seed Dressing Stations at Ngetta (Lira), Masindi, Kachumbala (Bukedea) and Kasese to yield 3,744 Mt of delinted and graded seed representing a Delinting Outturn of 80%.
Seed dressing commenced in January 2010 and ended in July while seed distribution to farmers took place between April and July 2010 in Eastern, Northern, West Nile and Mid Western Regions and in August in Western Region. The exercise was undertaken in collaboration with ginners in all the regions.
There was high demand for seed especially in Pallisa, Acholi and Lango zones due to the need for re-planting and gap-filling precipitated by the erratic rainfall patterns. Planting of cotton was also affected by late harvesting of the first season crops and stiff competition from rice, cassava, groundnuts, sorghum and soya beans especially in Busoga, Teso, Acholi and Lango. Due to high pre-marketing cotton prices announced by CDO, planting continued up to September in most of the regions.
SECTION 1.0 AGRONOMY
2 Annual Report 2009/2010
1.3 Provision of production inputs:
1.3.1 Pesticides
Between May and October, 2010, a total of 319,077 units of Cypercal and Polytrin pesticides were supplied to all the cotton growing Regions. Out of that quantity, 252,920 units were issued to farmers at Sh.3,500 per unit for Polytrin and Sh.2,500 - 3,000 per unit for Cypercal. In Acholi sub-region, the pesticides continued to be issued free of charge to farmers in order to improve pest management following the rampant promotion of organic cotton production.
The demand for pesticides during the season was generally high mainly because of the good pre-marketing cotton prices announced during the season.
The segregated seed multiplication areas in Busitema (Busia District), Gogonyo (Pallisa District), Kasilo (Serere District), Amolator, Rhino Camp (Arua District), Buliisa and Bushenyi Districts also received free pesticides to improve pest management.
Major pests encountered in the season were Lygus and bollworm and their infestation was quite severe especially in Eastern, Lango, West Nile and Mid Western regions due to the growing of sorghum, Okra and maize (which are alternative hosts for the pests) in these areas.
1.3.2 Spray pumps
A total of 2,814 spray pumps from the previous season were availed to farmers at Sh.50,000 each. By end of October, 1,811 had already been issued out.
Acholi sub-region and all fertilizer demos received free pumps while credit was extended to creditworthy farmers and farmer groups.
1.3.3 Fertilizers
Two types of fertilizers; NPK and Urea were availed for demonstration purposes. A total of 8,750 Kg of NPK (17:17:17) and 3,500 Kg of Urea were supplied to the lead farmers targeting 350 half-acre demonstration plots in all cotton growing areas.
1.4 Provision of cotton-extension services:
Recruitment and training of 66 FEWs on aspects of crop establishment, pest identification and pest control was conducted in all Regions. The number of FEWs recruited was however not sufficient due to budgetary constraints and therefore effective coverage of all areas was not achieved.
In order to increase the spread of extension messages on crop management and pest control, radio announcements targeting farmers were broadcast on local FM Stations in over 10 local languages.
In Busoga, Tororo/Busia, Pallisa/Budaka, Teso, Bugisu, Mid Western, West Nile, Western and parts of Northern Region, some area ginners joined CDO to mobilize farmers for cotton production and selling of pesticides to farmers.
1.5 Mobilization of farmers for cotton production
By end of October, an estimated 200,000 acres had been planted to cotton by about 150,000 households as shown in Table 1.
3Annual Report 2009/2010
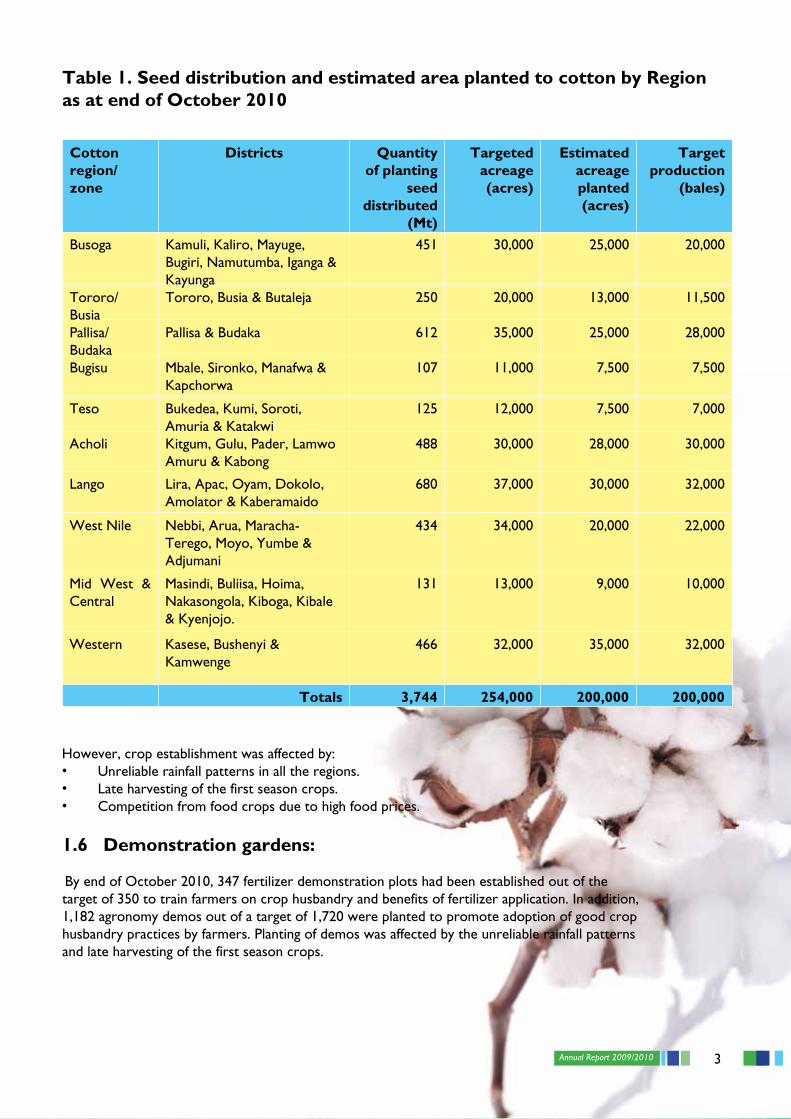
Table 1. Seed distribution and estimated area planted to cotton by Region as at end of October 2010
Cotton region/ zone
Districts Quantity of planting
seed distributed
(Mt)
Targeted acreage (acres)
Estimated acreage planted (acres)
Target production
(bales)
Busoga Kamuli, Kaliro, Mayuge, Bugiri, Namutumba, Iganga & Kayunga
451 30,000 25,000 20,000
Tororo/Busia
Tororo, Busia & Butaleja 250 20,000 13,000 11,500
Pallisa/Budaka
Pallisa & Budaka 612 35,000 25,000 28,000
Bugisu Mbale, Sironko, Manafwa & Kapchorwa
107 11,000 7,500 7,500
Teso Bukedea, Kumi, Soroti, Amuria & Katakwi
125 12,000 7,500 7,000
Acholi Kitgum, Gulu, Pader, Lamwo Amuru & Kabong
488 30,000 28,000 30,000
Lango Lira, Apac, Oyam, Dokolo, Amolator & Kaberamaido
680 37,000 30,000 32,000
West Nile Nebbi, Arua, Maracha-Terego, Moyo, Yumbe & Adjumani
434 34,000 20,000 22,000
Mid West & Central
Masindi, Buliisa, Hoima, Nakasongola, Kiboga, Kibale & Kyenjojo.
131 13,000 9,000 10,000
Western Kasese, Bushenyi & Kamwenge
466 32,000 35,000 32,000
Totals 3,744 254,000 200,000 200,000
However, crop establishment was affected by:• Unreliablerainfallpatternsinalltheregions.• Lateharvestingofthefirstseasoncrops.• Competitionfromfoodcropsduetohighfoodprices.
1.6 Demonstration gardens:
By end of October 2010, 347 fertilizer demonstration plots had been established out of the target of 350 to train farmers on crop husbandry and benefits of fertilizer application. In addition, 1,182 agronomy demos out of a target of 1,720 were planted to promote adoption of good crop husbandry practices by farmers. Planting of demos was affected by the unreliable rainfall patterns and late harvesting of the first season crops.
4 Annual Report 2009/2010
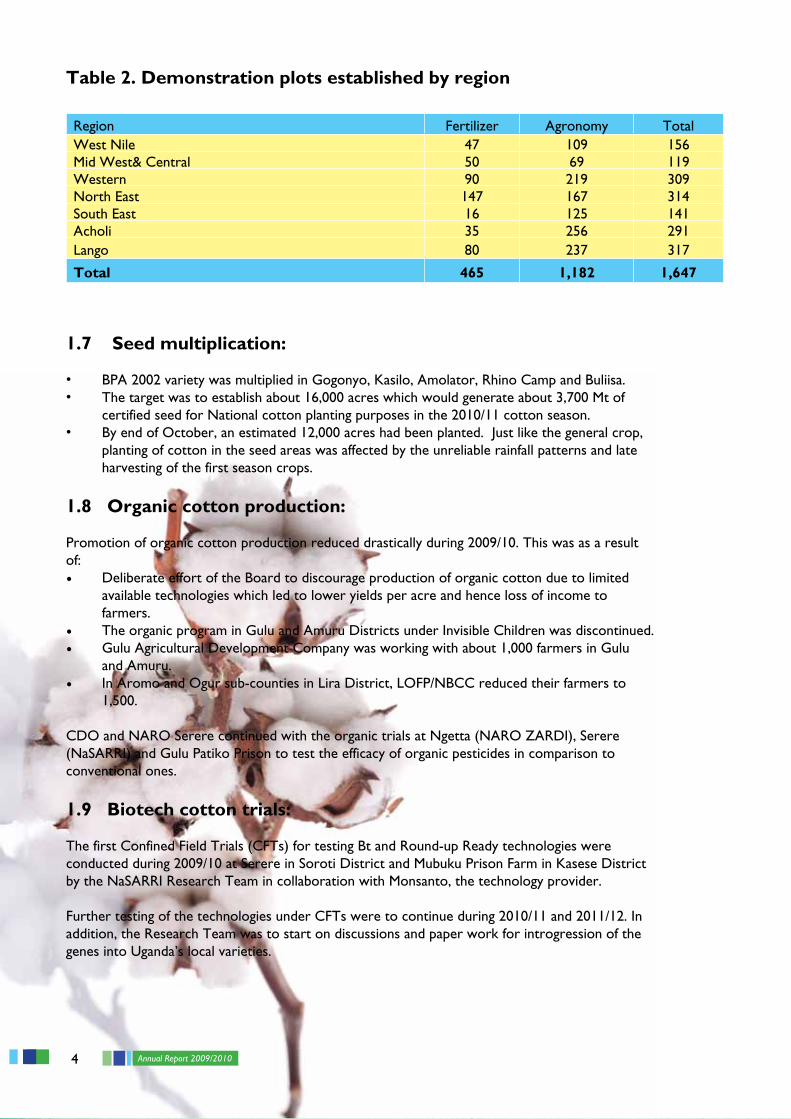
Table 2. Demonstration plots established by region
1.7 Seed multiplication:
• BPA2002varietywasmultipliedinGogonyo,Kasilo,Amolator,RhinoCampandBuliisa.• Thetargetwastoestablishabout16,000acreswhichwouldgenerateabout3,700Mtof
certified seed for National cotton planting purposes in the 2010/11 cotton season.• ByendofOctober,anestimated12,000acreshadbeenplanted.Justlikethegeneralcrop,
planting of cotton in the seed areas was affected by the unreliable rainfall patterns and late harvesting of the first season crops.
1.8 Organic cotton production:
Promotion of organic cotton production reduced drastically during 2009/10. This was as a result of: • Deliberate effort of the Board to discourage production of organic cotton due to limited
available technologies which led to lower yields per acre and hence loss of income to farmers.
• The organic program in Gulu and Amuru Districts under Invisible Children was discontinued.• Gulu Agricultural Development Company was working with about 1,000 farmers in Gulu
and Amuru.• In Aromo and Ogur sub-counties in Lira District, LOFP/NBCC reduced their farmers to
1,500.
CDO and NARO Serere continued with the organic trials at Ngetta (NARO ZARDI), Serere (NaSARRI) and Gulu Patiko Prison to test the efficacy of organic pesticides in comparison to conventional ones.
1.9 Biotech cotton trials:
The first Confined Field Trials (CFTs) for testing Bt and Round-up Ready technologies were conducted during 2009/10 at Serere in Soroti District and Mubuku Prison Farm in Kasese District by the NaSARRI Research Team in collaboration with Monsanto, the technology provider.
Further testing of the technologies under CFTs were to continue during 2010/11 and 2011/12. In addition, the Research Team was to start on discussions and paper work for introgression of the genes into Uganda’s local varieties.
Region Fertilizer Agronomy TotalWest Nile 47 109 156Mid West& Central 50 69 119Western 90 219 309North East 147 167 314South East 16 125 141Acholi 35 256 291Lango 80 237 317
Total 465 1,182 1,647
5Annual Report 2009/2010
2.1 Introduction:
The cotton marketing season officially opened on 2nd December, 2009 when the Indicative price for seed cotton was announced. By the end of marketing season in June 2010, a total of 37,160,673 Kg of seed cotton equivalent to 70,300 standard bales of lint (each 185 Kg) had been purchased by 26 ginners.
2.2 Cotton prices:
CDO announced a pre-season seed cotton indicative price of Sh.700 per Kg in September 2009, following advice from the International Cotton Advisory Committee (ICAC) on International price forecasts. By December 2009, prices had improved due to the increased demand for cotton yarn globally as well as the slight recovery in the World economy.
Prices paid to farmers remained fairly stable in all cotton growing regions and the average price paid was Sh.900 per Kg.
2.3 Lint sales:
2.3.1 Exports
By end of June 2010, a total of actual 64,648 bales of lint (equivalent to 12,755 Mt of lint) had been sold from the ginneries as shown in Table 3.
Table 3. Monthly lint sales for 2009/10 season.
Jan. 10 Feb. 10 Mar. 10 Apr. 10 May 10 Jun. 10 Totals
Quantity sold (actual bales)
5,796 14,245 15,105 16,197 12,026 1,279 64,648
Equivalent weight (MT)
1,152 2,870 2,906 3,130 2,457 240 12,755
SECTION 2.0 MARKETING
2 Each bale of lint is produced from an average of 528.6 kilograms of seed cotton.3 Quantity of actual bales as opposed to standard bales depends on the bale size produced at the ginnery. This varies between 170 to 220kg of lint.
6 Annual Report 2009/2010
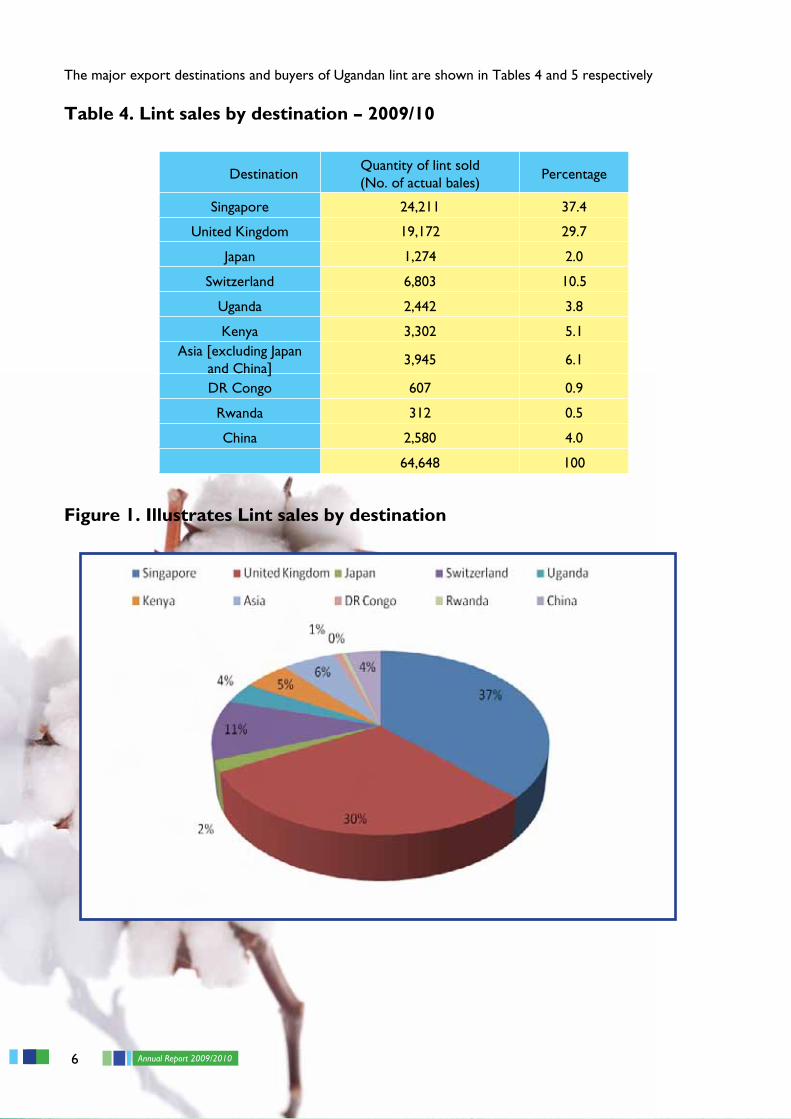
The major export destinations and buyers of Ugandan lint are shown in Tables 4 and 5 respectively
Table 4. Lint sales by destination – 2009/10
Figure 1. Illustrates Lint sales by destination
DestinationQuantity of lint sold (No. of actual bales)
Percentage
Singapore 24,211 37.4
United Kingdom 19,172 29.7
Japan 1,274 2.0
Switzerland 6,803 10.5
Uganda 2,442 3.8
Kenya 3,302 5.1Asia [excluding Japan
and China]3,945 6.1
DR Congo 607 0.9
Rwanda 312 0.5
China 2,580 4.0
64,648 100
7Annual Report 2009/2010
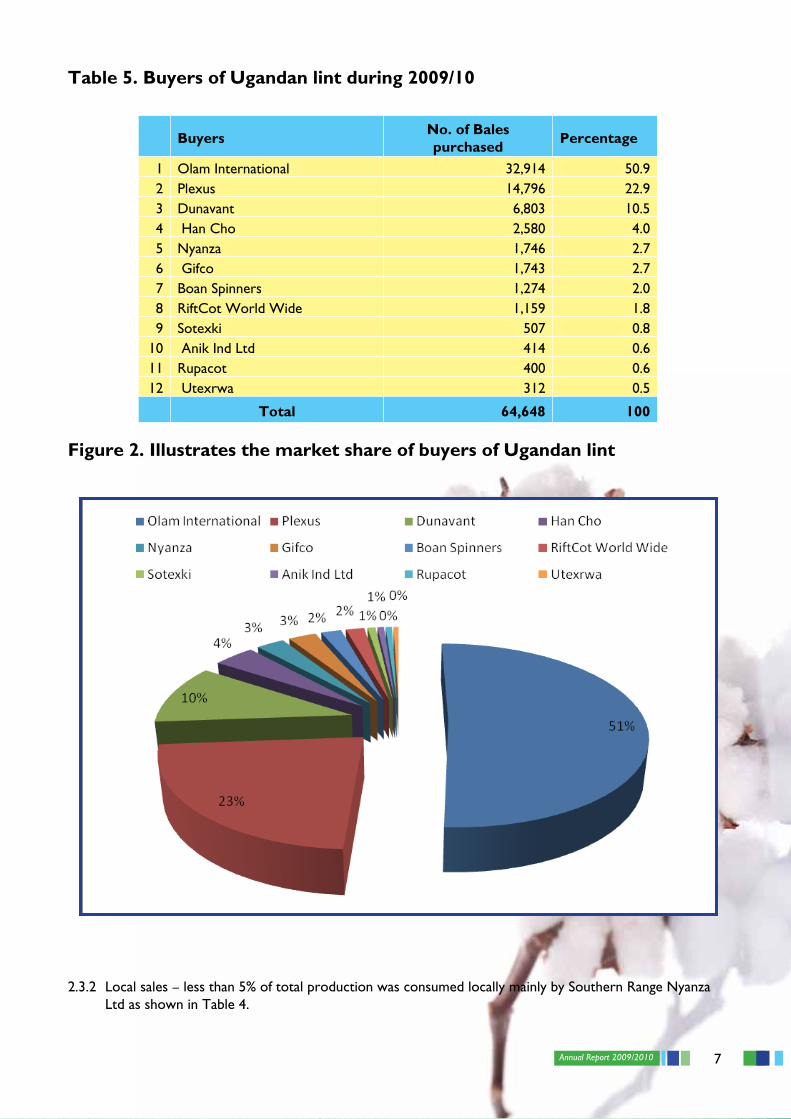
Table 5. Buyers of Ugandan lint during 2009/10
Figure 2. Illustrates the market share of buyers of Ugandan lint
2.3.2 Local sales – less than 5% of total production was consumed locally mainly by Southern Range Nyanza Ltd as shown in Table 4.
BuyersNo. of Bales purchased
Percentage
1 Olam International 32,914 50.92 Plexus 14,796 22.93 Dunavant 6,803 10.54 Han Cho 2,580 4.05 Nyanza 1,746 2.76 Gifco 1,743 2.77 Boan Spinners 1,274 2.08 RiftCot World Wide 1,159 1.89 Sotexki 507 0.8
10 Anik Ind Ltd 414 0.611 Rupacot 400 0.612 Utexrwa 312 0.5
Total 64,648 100
8 Annual Report 2009/2010
2.4 WORLD OUTLOOK :
2.4.1 Production and consumption
World cotton production declined from 23.3 million metric tons in 2008/09 to 22.1 million tons in 2009/10. This was largely attributed to the sluggish recovery from the global financial crisis and the world food price shock of 2008 which encouraged cotton farmers to substitute area under cotton to food grains and other competing crops.
On the other hand, World cotton consumption grew by 7.5% to 25.8 million tons in 2009/10 compared to 24 million tons in 2008/09 driven by the prospects of global economic rebound.
2.4.2 World Cotton trade
World cotton imports rose by 19% from 6.6 million tons in 2008/09 to 7.9 million tons in 2009/10, while exports rose by 18% from 6.5 million tons in 2008/09 to 7.7 million tons in 2009/10. This was attributed to the slight recovery in world financial markets which affected the demand for yarn.
Table 6. World Cotton Balance Sheet
2007/08 2008/09 2009/10
(millions of metric tons)
Beginning stocks 13.6 13.2 13.2
Production 26.1 23.3 22.1
Supply 39.6 36.5 35.5
Consumption 26.8 24.0 25.8
Ending stocks 13.2 13.2 9.6
Stocks/use ratio 49.3% 55.0% 37.4%
2.4.3 Price trends
The Cotlook ‘A’ Index reached 86 cents per pound on August 2, 2010 and averaged 129 cents per pound for the season. This was 66% higher than the previous season’s average of 77.5 cents per pound. This phenomenon was attributed to relatively low World stocks of cotton; limited supply, robust demand and a very low level of uncommitted cotton stocks.
4 Source: U.S. Cotton Market Monthly Economic Letter - May 13, 2011
9Annual Report 2009/2010
3.1 Introduction:
During the time of reporting, the section had classed samples equivalent to 65,745 (actual bales) of lint. The season recorded 100 % roller ginning.
3.2 Achievements:
During the season under review, the section had the following achievements:
i. Successfully prepared and presented the official national cotton standards to the International Cotton Association (Liverpool) and the Bremen Cotton Exchange. The standards were well defended and adopted by the above associations as the official cotton standards for Uganda and will be used for international trade, price determination, and establishment of value differences for the next two seasons until a new set will be presented in 2011/12 season.
ii. Successfully participated in the Commercial Standardization of Instrument Testing of Cotton (CSITC) round trials (tests) and received awards/certificates to that effect. These certificates bore testimony to the fact that our laboratory received recognition for good performance in comparison to other interna-tionally recognized cotton testing centres.
iii. In light of the above, CSITC agreed to co-fund improvements which the laboratory requested for, namely installation of an air management system. This will further enhance our performance.
3.3 Quality Performance:
(a) The overall results indicated a slight decline in the quality of lint. 87% of lint was in the first three grades of UCON, UCOB and UCOP compared to 94% for the previous season.
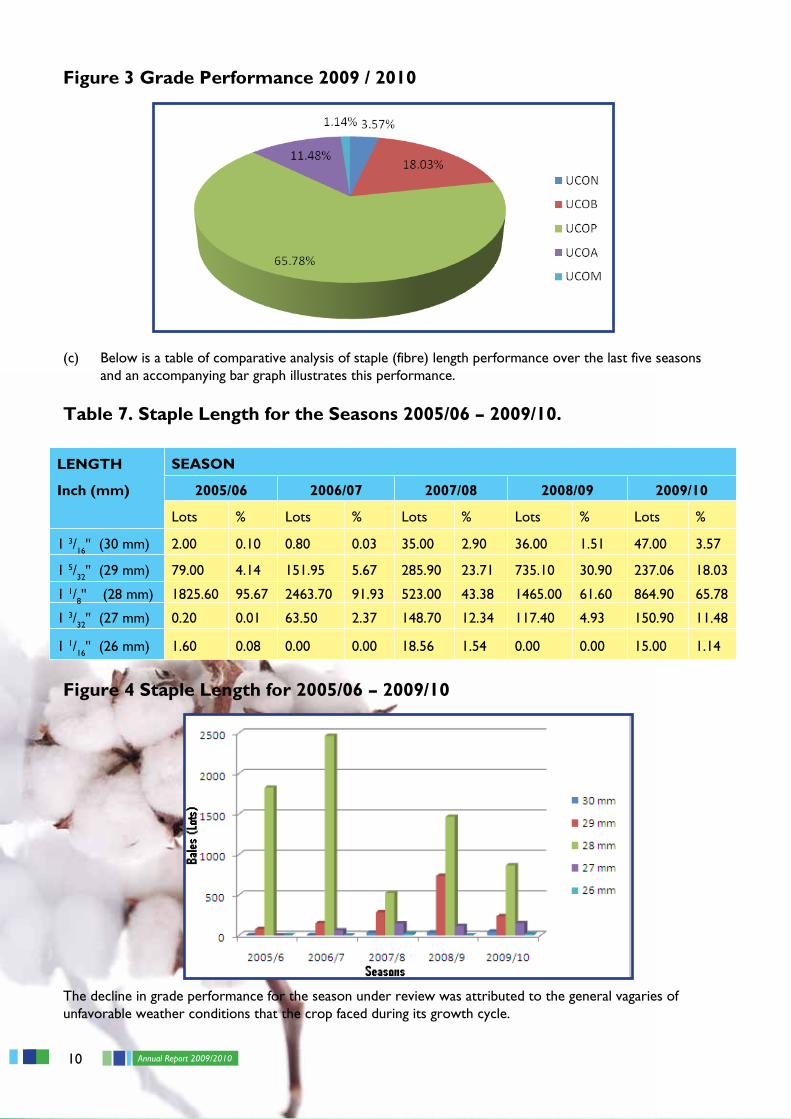
(b) The pie chart below gives an indication of the performance of cotton quality for the season under re-view.
SECTION 3.0: CLASSIFICATION
5 The number of bales indicated depends on the sampled lots classed by the classification laboratory.Each standard lot is 50 bales. However, some samples may represent lots with fewer bales than the standard 50 bales.
10 Annual Report 2009/2010
(c) Below is a table of comparative analysis of staple (fibre) length performance over the last five seasons and an accompanying bar graph illustrates this performance.
Table 7. Staple Length for the Seasons 2005/06 – 2009/10.
LENGTH SEASON
Inch (mm) 2005/06 2006/07 2007/08 2008/09 2009/10
Lots % Lots % Lots % Lots % Lots %
1 3/16'' (30 mm) 2.00 0.10 0.80 0.03 35.00 2.90 36.00 1.51 47.00 3.57
1 5/32'' (29 mm) 79.00 4.14 151.95 5.67 285.90 23.71 735.10 30.90 237.06 18.03
1 1/8'' (28 mm) 1825.60 95.67 2463.70 91.93 523.00 43.38 1465.00 61.60 864.90 65.78
1 3/32'' (27 mm) 0.20 0.01 63.50 2.37 148.70 12.34 117.40 4.93 150.90 11.48
1 1/16'' (26 mm) 1.60 0.08 0.00 0.00 18.56 1.54 0.00 0.00 15.00 1.14
Figure 4 Staple Length for 2005/06 – 2009/10
The decline in grade performance for the season under review was attributed to the general vagaries of unfavorable weather conditions that the crop faced during its growth cycle.
Figure 3 Grade Performance 2009 / 2010
11Annual Report 2009/2010
4.1 Operational Ginneries:
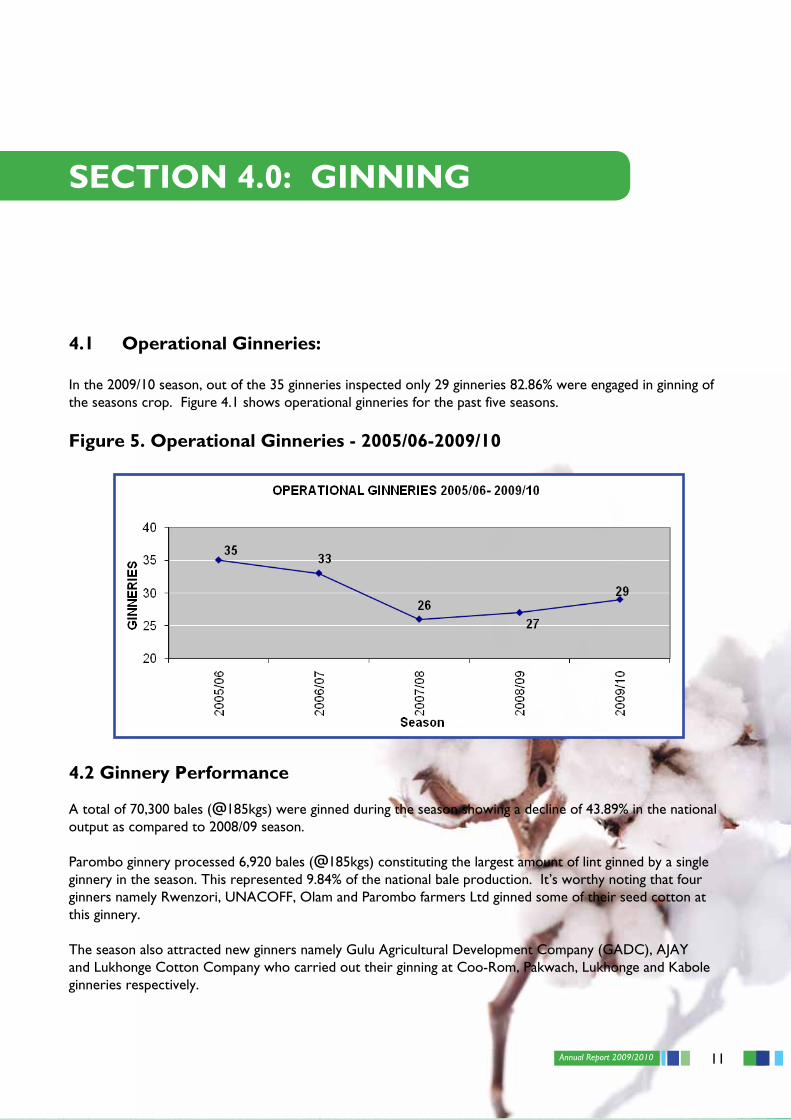
In the 2009/10 season, out of the 35 ginneries inspected only 29 ginneries 82.86% were engaged in ginning of the seasons crop. Figure 4.1 shows operational ginneries for the past five seasons.
Figure 5. Operational Ginneries - 2005/06-2009/10
4.2 Ginnery Performance
A total of 70,300 bales (@185kgs) were ginned during the season showing a decline of 43.89% in the national output as compared to 2008/09 season.
Parombo ginnery processed 6,920 bales (@185kgs) constituting the largest amount of lint ginned by a single ginnery in the season. This represented 9.84% of the national bale production. It’s worthy noting that four ginners namely Rwenzori, UNACOFF, Olam and Parombo farmers Ltd ginned some of their seed cotton at this ginnery.
The season also attracted new ginners namely Gulu Agricultural Development Company (GADC), AJAY and Lukhonge Cotton Company who carried out their ginning at Coo-Rom, Pakwach, Lukhonge and Kabole ginneries respectively.
SECTION 4.0: GINNING
12 Annual Report 2009/2010
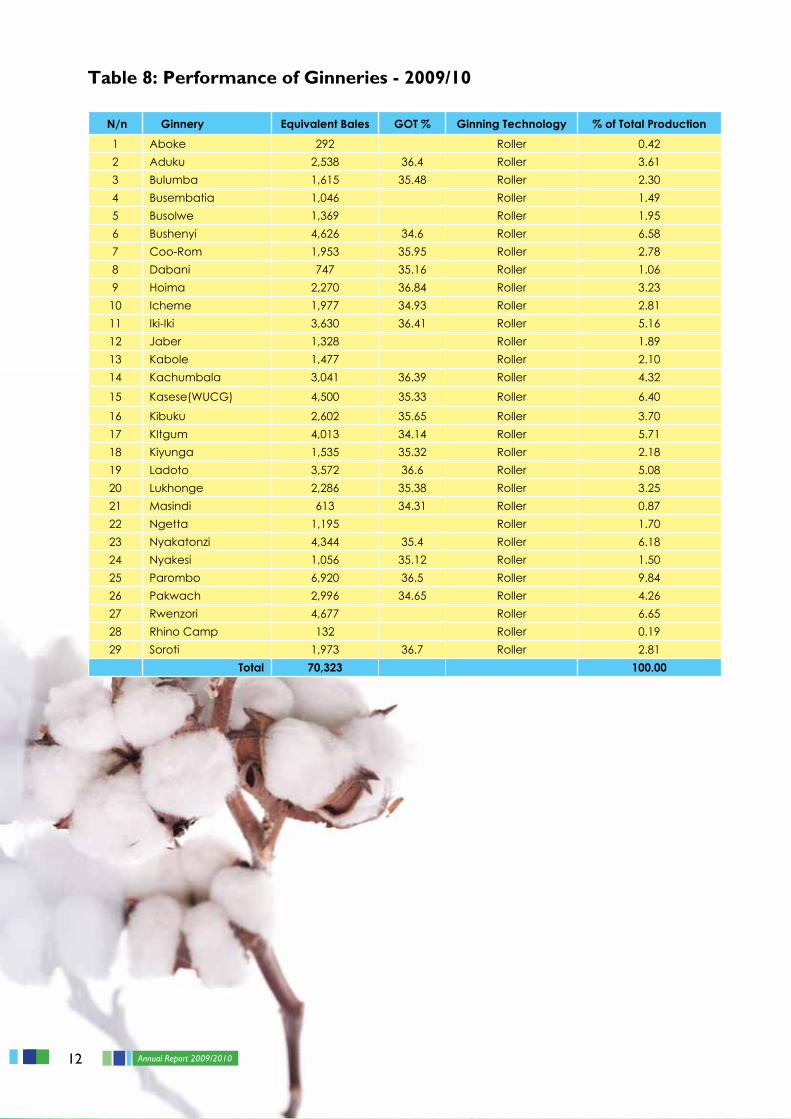
Table 8: Performance of Ginneries - 2009/10
N/n Ginnery Equivalent Bales GOT % Ginning Technology % of Total Production1 Aboke 292 Roller 0.422 Aduku 2,538 36.4 Roller 3.613 Bulumba 1,615 35.48 Roller 2.304 Busembatia 1,046 Roller 1.495 Busolwe 1,369 Roller 1.956 Bushenyi 4,626 34.6 Roller 6.587 Coo-Rom 1,953 35.95 Roller 2.788 Dabani 747 35.16 Roller 1.069 Hoima 2,270 36.84 Roller 3.2310 Icheme 1,977 34.93 Roller 2.8111 Iki-Iki 3,630 36.41 Roller 5.1612 Jaber 1,328 Roller 1.8913 Kabole 1,477 Roller 2.1014 Kachumbala 3,041 36.39 Roller 4.32
15 Kasese(WUCG) 4,500 35.33 Roller 6.40
16 Kibuku 2,602 35.65 Roller 3.7017 KItgum 4,013 34.14 Roller 5.7118 Kiyunga 1,535 35.32 Roller 2.1819 Ladoto 3,572 36.6 Roller 5.0820 Lukhonge 2,286 35.38 Roller 3.2521 Masindi 613 34.31 Roller 0.8722 Ngetta 1,195 Roller 1.7023 Nyakatonzi 4,344 35.4 Roller 6.1824 Nyakesi 1,056 35.12 Roller 1.5025 Parombo 6,920 36.5 Roller 9.8426 Pakwach 2,996 34.65 Roller 4.2627 Rwenzori 4,677 Roller 6.6528 Rhino Camp 132 Roller 0.1929 Soroti 1,973 36.7 Roller 2.81
Total 70,323 100.00
13Annual Report 2009/2010
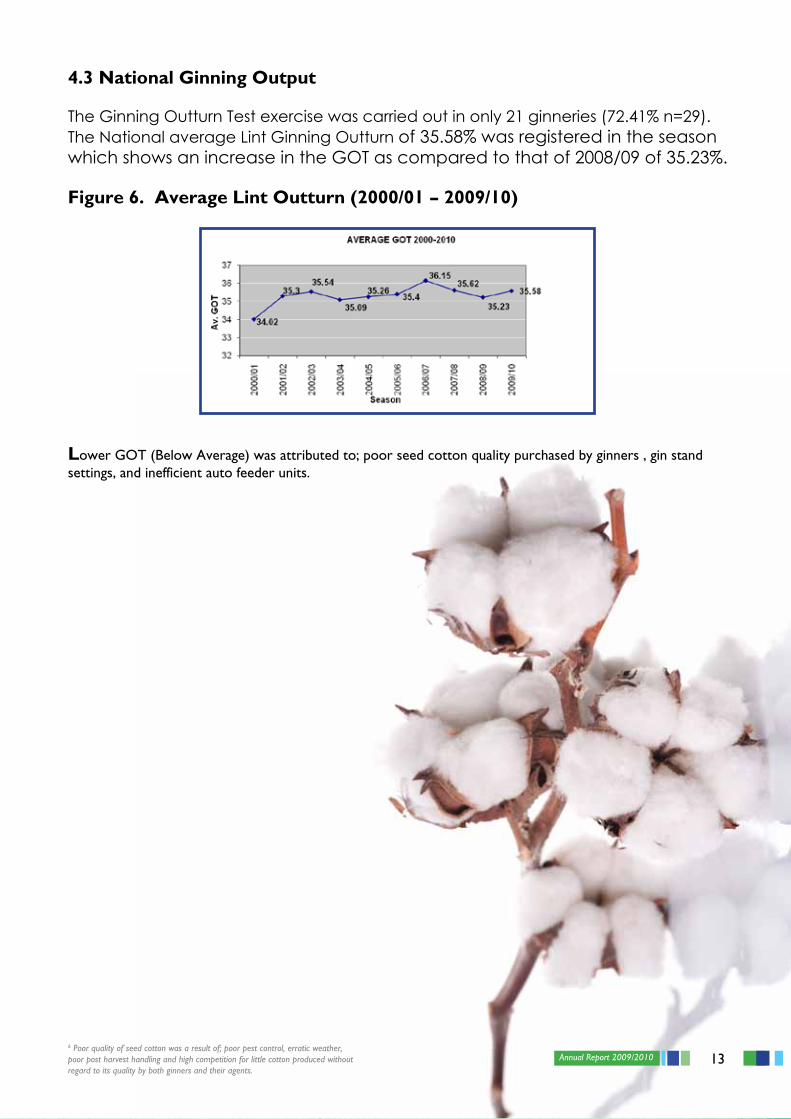
4.3 National Ginning Output
The Ginning Outturn Test exercise was carried out in only 21 ginneries (72.41% n=29). The National average Lint Ginning Outturn of 35.58% was registered in the season which shows an increase in the GOT as compared to that of 2008/09 of 35.23%.
Figure 6. Average Lint Outturn (2000/01 – 2009/10)
Lower GOT (Below Average) was attributed to; poor seed cotton quality purchased by ginners , gin stand settings, and inefficient auto feeder units.
6 Poor quality of seed cotton was a result of; poor pest control, erratic weather, poor post harvest handling and high competition for little cotton produced without regard to its quality by both ginners and their agents.
14 Annual Report 2009/2010
5.1 Organizational Governance.
The period under review was the current Board‘s second year in office. The Board steered the Sub- sector Stakeholders through development of the Cotton Sub-sector Strategic Plan 2010/11 – 2014/15. The plan prior-itized areas that the Sub-sector Stakeholders will focus on to increase the contribution of the Cotton Industry to national economic growth and development.
The Board adopted the following Strategic Vision, Mission, Values and Goals: i) Vision: Building a competitive and sustainable cotton sub-sector in Uganda.
ii) Mission: To promote and Monitor; Production, Processing and Marketing of high value cotton and it’s by – products for the welfare of our society.
iii) Values:
- Farmer empowerment; focusing on needs and issues of cotton farmers, giving farmers a voice in matters of research, development, extension and marketing.
- Staff empowerment; valuing Staff initiative, cooperation, communication, flexibility in work and quality of work life in the organization. Tooling and
re-tooling staff and staff participation in the areas of the organization.
- Accountability; providing the regulatory services in a professional, responsible and accountable manner.
- Integrity; encouraging dealing with each other and with Stakeholders on the basis of trust, Understanding and respect of different needs and interest, performing Sub-sector activities in a free and open manner.
- Professionalism; performing duties and producing our outputs to the best of our ability with optimum utilization of public resources and with focus on continuous improvement in quality, productivity and professional development.
- Responsiveness; endeavoring to provide high quality information and services to our Stakeholders within reasonable time frame.
- Equal employment opportunities; encouraging equity in employment, deployment, promotion and staff development.
5.0: ADMINISTRATION DEPARTMENT
15Annual Report 2009/2010
iv) Goals: - Increase quantity of cotton produced. - Improve quality of cotton produced. - Ensure availability of good quality planting seed. - Increase domestic value addition to bi-products. - Build a cotton team. - Create sustainable funding for cotton activities. - Promote sustainable use of natural resources. Developing the cotton Sub-sector Strategic Plan was a great milestone in the governance of the CottonIndustry and its successful implementation and realization remains a surmountable task.
5.2 Key Delegations
During the year, CDO received the following delegations:
• IndiandelegationonSouth-SouthCooperationunderWorldTradeOrganizationinMay2010.• InternationalTextileManufacturers’Federation(ITMF)SpinnersCommitteeinJuly2010.• CDOalsosentadelegationcomprisingoftheBoardSecretaryandtheAgronomisttoZimbabwe
and Tanzania in March and April 2010 respectively to benchmark best practices in planting seed production, sector regulation, financing and promotion of cotton production in general.
5.3 Staff
i. Cotton Development Organization maintained a highly, skilled and motivated work force of 37 staff members both at head Office and in the field promoting, regulating, and monitoring cotton production, processing and marketing.
ii. Further, a total of 66 temporary field staff were recruited and trained in cotton extension service delivery to increase extension coverage in the cotton growing areas.
iii. CDO continued to improve staff development through on job, local and foreign Training, Seminars and Workshops.
iv. During the period, Mrs. Aidah Mukasa joined the organization as a receptionist. On the other hand, Mrs. Namatovu Judith Kabali the Procurement and Disposal Officer left the organization in September 2010.
5.4 International training for staff
Several staff attended international training programmes on cotton research, production, processing, quality control and marketing. The salient programmes attended include the following:
i. Mr. Badru Adiga attended a training programme on Instrument Testing of Cotton for Laboratory Technicians at Regional Technical Centre for East and Southern Africa, Dar-es-salaam Tanzania from 30th November to 4th December 2009.
ii. Ms. Damalie Lubwama attended a training programme on increasing Cotton Production in Washington DC sponsored by the International Cotton Advisory Council (ICAC) from 3rd – 11th May 2010.
iii. Mr. Badiru Adiga and Ms. Colline Nahurira attended a training programme on New Varieties and Technologies of Cotton for developing Countries in China sponsored by the Peoples Republic of China and International Trade Centre from 1st September to 26th October 2010.
Annual Report 2009/2010
16 Annual Report 2009/2010
COTTON DEVELOPMENT ORGANISATIONFinancial statements for the year ended 31st october 2010
Together with the report and opinion thereon by the Auditor General
17COTTON DEVELOPMENT ORGANISATION (CDO)Financial Statements for the Year ended 31st October 2010
Table of Contents Page
Corporate Information 18
Report of the Directors 21
Statement of Directors Responsibilities 23
Statement of Financial Position 24
Statement of Financial Performance 25
Statement of Cash Flow 26
Statement of Changes in Equity 27
Notes to the Financial Statements 28 - 37
18 COTTON DEVELOPMENT ORGANISATION (CDO)Financial Statements for the Year ended 31st October 2010
19COTTON DEVELOPMENT ORGANISATION (CDO)Financial Statements for the Year ended 31st October 2010
20 COTTON DEVELOPMENT ORGANISATION (CDO)Financial Statements for the Year ended 31st October 2010
21COTTON DEVELOPMENT ORGANISATION (CDO)Financial Statements for the Year ended 31st October 2010
CORPORATE INFORMATION
DIRECTORS
The directors who held office during the year were:
Dr. Peter Esele ChairmanMrs. Jolly K Sabune Managing DirectorMr. Sam Ssemanda MemberDr. Thomas Areke MemberMr. George Ssekisambu MemberMrs. Elizabeth Tamale MemberMr. Amdan Khan MemberMr. Owot Ongom MemberMr. Richard Mubiru MemberMr. Kenneth Mugambe MemberMr. Hilary Magunda Board SecretaryMr. J.R. Okwir Acana MemberMr. Ubimo Okelowange Member
PRINCIPAL PLACE OF BUSINESS AND REGISTERED OFFICECotton House, 1st Floor,Plot 15, Clement Hill Road, Kampala,P O Box 7018,Kampala. Uganda
AUDITORSIn accordance with Section 29(2) of the Cotton Development Act Cap 30, the Financial Statements of the
Organisation shall be audited once every year by the Auditor General or an Auditor appointed on his behalf.
The Audit was conducted by the Office of the Auditor General.
PRINCIPAL BANKERSBank of Uganda,Plot 25/28 Kampala Road,P.O.Box 7120, Kampala. Uganda
Dfcu Bank Limited,24B Acacia Avenue,P.O.Box 70, Kampala. Uganda
LAWYERSBarya, Byamugisha and Co.Advocates,Colline House, 1st Floor (Middle Tower),Plot 4 Pilkington Road,P O Box 12031, Kampala. Uganda
22 COTTON DEVELOPMENT ORGANISATION (CDO)Financial Statements for the Year ended 31st October 2010
Report of the Directors
The directors present their report together with the audited financial statements for the year ended 31stOctober 2010, which disclose the state of affairs of Cotton Development Organisation (“the Organisation”).
Principal activities
The Organisation was established to monitor the production, processing, and marketing of cotton so as to enhance the quality of lint cotton exported and locally sold, to promote the distribution of high quality cotton seed for planting and generally to facilitate the development of the cotton industry.
General information
General information on the cotton sub-sector and detailed performance during the year is contained in the main body of the Annual Report 2009/2010.
The cotton sub-sector registered a fall of 44% in cotton production from 125,250bales in the 2008/2009 season to 70,300bales in the 2009/2010 season. This was mainly due to the severe drought which hit the major cotton growing areas from May to August 2009, which is the optimum cotton planting window. The average farm-gate price for the season was Shs 600/= per kg of seed cotton.
Results
The deficit for the year is U.Shs 1.352 billion. (U.Shs 2.218 billion for year 2008/09).The recurring deficit is due to insufficient funds (Funding gap).
By Order of the Board
………………………….. ……………………… Chairman Secretary
23COTTON DEVELOPMENT ORGANISATION (CDO)Financial Statements for the Year ended 31st October 2010
Statement of Directors’ ResponsibilitiesFor the year ended 31st October 2010
The Cotton Development Act requires the directors to prepare financial statements for each financial year that give a true and fair view of the state of affairs of the Organisation as at the end of the financial year and of its profit and loss. It also requires that the Organisation keep proper accounting records that disclose, with reasonable accuracy, the financial position of the Organisation. They are also responsible for safe guarding the assets of the Organisation.
The directors accept responsibility for the financial statements, which have been prepared using appropriate accounting policies supported by reasonable and prudent judgments and estimates, in conformity with International Financial Reporting Standards and the requirements of the Uganda Companies Act. The directors are of the opinion that the financial statements give a true and fair view of the financial affairs of the Organisation and of its profit for the year. The directors accept responsibility for the maintenance of accounting records that may be relied upon in the preparation of financial statements, as well as adequate systems of internal financial control.
Nothing has come to the attention of the directors to indicate that the Organisation will not remain a going concern for at least the twelve months from the date of this statement.
............................................................. ............................................................. Chairman, Board of Directors Managing Director
24 COTTON DEVELOPMENT ORGANISATION (CDO)Financial Statements for the Year ended 31st October 2010
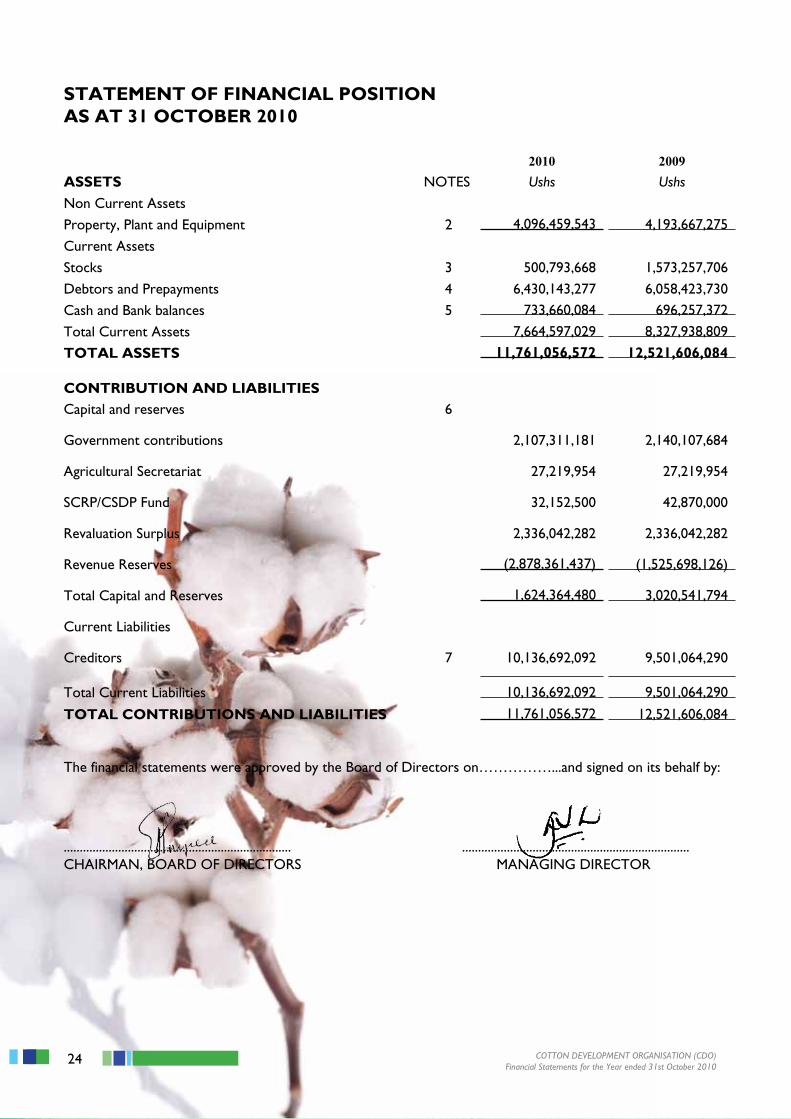
STATEMENT OF FINANCIAL POSITIONAS AT 31 OCTOBER 2010
2010 2009ASSETS NOTES Ushs Ushs
Non Current AssetsProperty, Plant and Equipment 2 4,096,459,543 4,193,667,275
Current AssetsStocks 3 500,793,668 1,573,257,706 Debtors and Prepayments 4 6,430,143,277 6,058,423,730 Cash and Bank balances 5 733,660,084 696,257,372
Total Current Assets 7,664,597,029 8,327,938,809
TOTAL ASSETS 11,761,056,572 12,521,606,084
CONTRIBUTION AND LIABILITIESCapital and reserves 6
Government contributions 2,107,311,181 2,140,107,684
Agricultural Secretariat
27,219,954
27,219,954
SCRP/CSDP Fund 32,152,500 42,870,000
Revaluation Surplus 2,336,042,282 2,336,042,282
Revenue Reserves (2,878,361,437) (1,525,698,126)
Total Capital and Reserves 1,624,364,480 3,020,541,794
Current Liabilities
Creditors 7 10,136,692,092 9,501,064,290
Total Current Liabilities 10,136,692,092 9,501,064,290
TOTAL CONTRIBUTIONS AND LIABILITIES 11,761,056,572 12,521,606,084
The financial statements were approved by the Board of Directors on……………...and signed on its behalf by:
....................................................................... .......................................................................CHAIRMAN, BOARD OF DIRECTORS MANAGING DIRECTOR
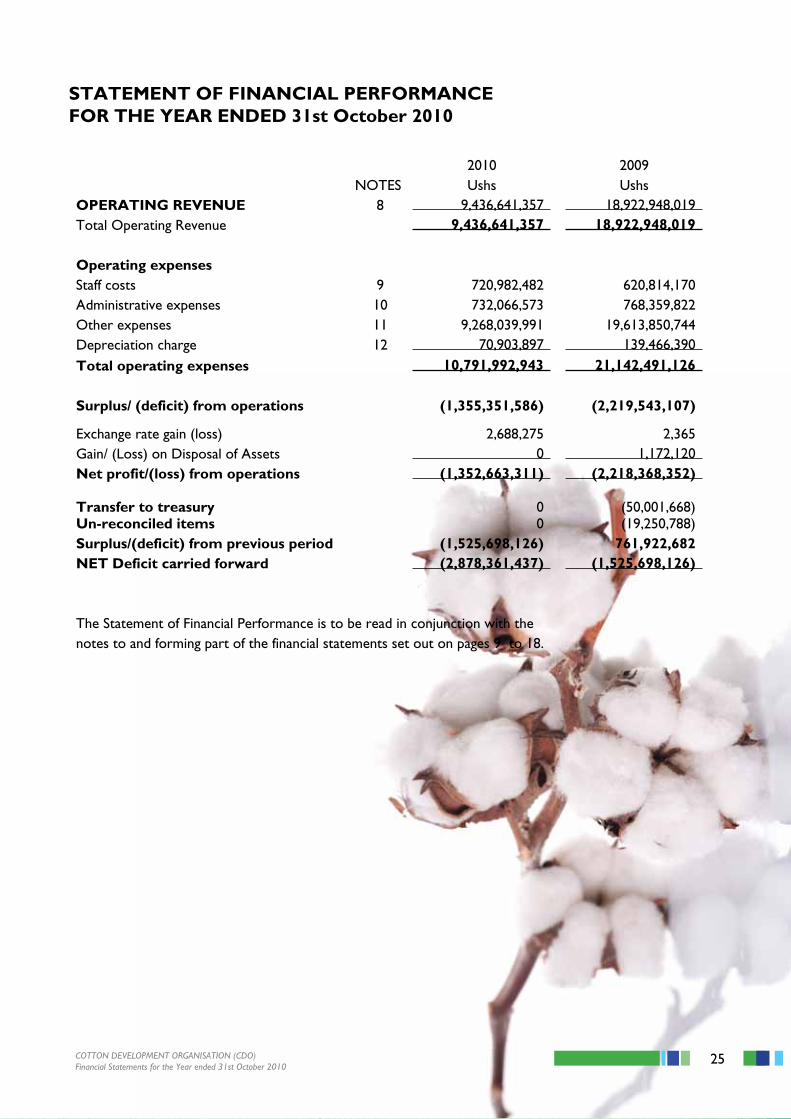
25COTTON DEVELOPMENT ORGANISATION (CDO)Financial Statements for the Year ended 31st October 2010
2010 2009NOTES Ushs Ushs
OPERATING REVENUE 8 9,436,641,357 18,922,948,019 Total Operating Revenue 9,436,641,357 18,922,948,019
Operating expensesStaff costs 9 720,982,482 620,814,170Administrative expenses 10 732,066,573 768,359,822Other expenses 11 9,268,039,991 19,613,850,744Depreciation charge 12 70,903,897 139,466,390Total operating expenses 10,791,992,943 21,142,491,126
Surplus/ (deficit) from operations (1,355,351,586) (2,219,543,107)
Exchange rate gain (loss) 2,688,275 2,365 Gain/ (Loss) on Disposal of Assets 0 1,172,120 Net profit/(loss) from operations (1,352,663,311) (2,218,368,352)
Transfer to treasury 0 (50,001,668)Un-reconciled items 0 (19,250,788)Surplus/(deficit) from previous period (1,525,698,126) 761,922,682NET Deficit carried forward (2,878,361,437) (1,525,698,126)
The Statement of Financial Performance is to be read in conjunction with thenotes to and forming part of the financial statements set out on pages 9 to 18.
STATEMENT OF FINANCIAL PERFORMANCEFOR THE YEAR ENDED 31st October 2010
26 COTTON DEVELOPMENT ORGANISATION (CDO)Financial Statements for the Year ended 31st October 2010
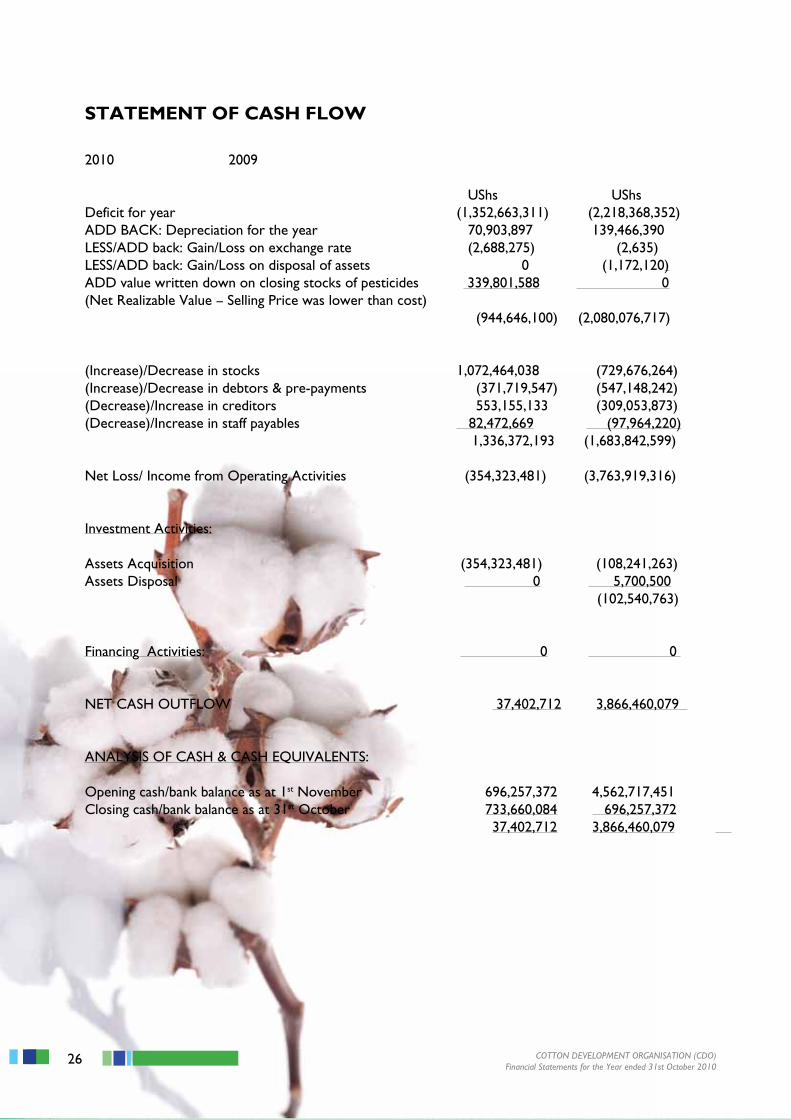
2010 2009
UShs UShsDeficit for year (1,352,663,311) (2,218,368,352)ADD BACK: Depreciation for the year 70,903,897 139,466,390LESS/ADD back: Gain/Loss on exchange rate (2,688,275) (2,635)LESS/ADD back: Gain/Loss on disposal of assets 0 (1,172,120)ADD value written down on closing stocks of pesticides 339,801,588 0(Net Realizable Value – Selling Price was lower than cost) (944,646,100) (2,080,076,717)
(Increase)/Decrease in stocks 1,072,464,038 (729,676,264)(Increase)/Decrease in debtors & pre-payments (371,719,547) (547,148,242)(Decrease)/Increase in creditors 553,155,133 (309,053,873)(Decrease)/Increase in staff payables 82,472,669 (97,964,220) 1,336,372,193 (1,683,842,599)
Net Loss/ Income from Operating Activities (354,323,481) (3,763,919,316)
Investment Activities:
Assets Acquisition (354,323,481) (108,241,263)Assets Disposal 0 5,700,500 (102,540,763)
Financing Activities: 0 0
NET CASH OUTFLOW 37,402,712 3,866,460,079
ANALYSIS OF CASH & CASH EQUIVALENTS:
Opening cash/bank balance as at 1st November 696,257,372 4,562,717,451Closing cash/bank balance as at 31st October 733,660,084 696,257,372 37,402,712 3,866,460,079
STATEMENT OF CASH FLOW
27COTTON DEVELOPMENT ORGANISATION (CDO)Financial Statements for the Year ended 31st October 2010
ST
AT
EM
EN
T O
F C
HA
NG
ES
IN
EQ
UIT
Y
GO
VE
RN
ME
NT
AG
RIC
UL
TU
RA
LS
CR
P/C
SD
PR
EV
AL
UA
TIO
NR
EV
EN
UE
TO
TA
L
CO
NT
RIB
UT
ION
SE
CR
ET
AR
IAT
FU
ND
SU
RP
LU
SR
ES
ER
VE
S
Ush
sU
shs
Ush
sU
shs
Ush
sU
shs
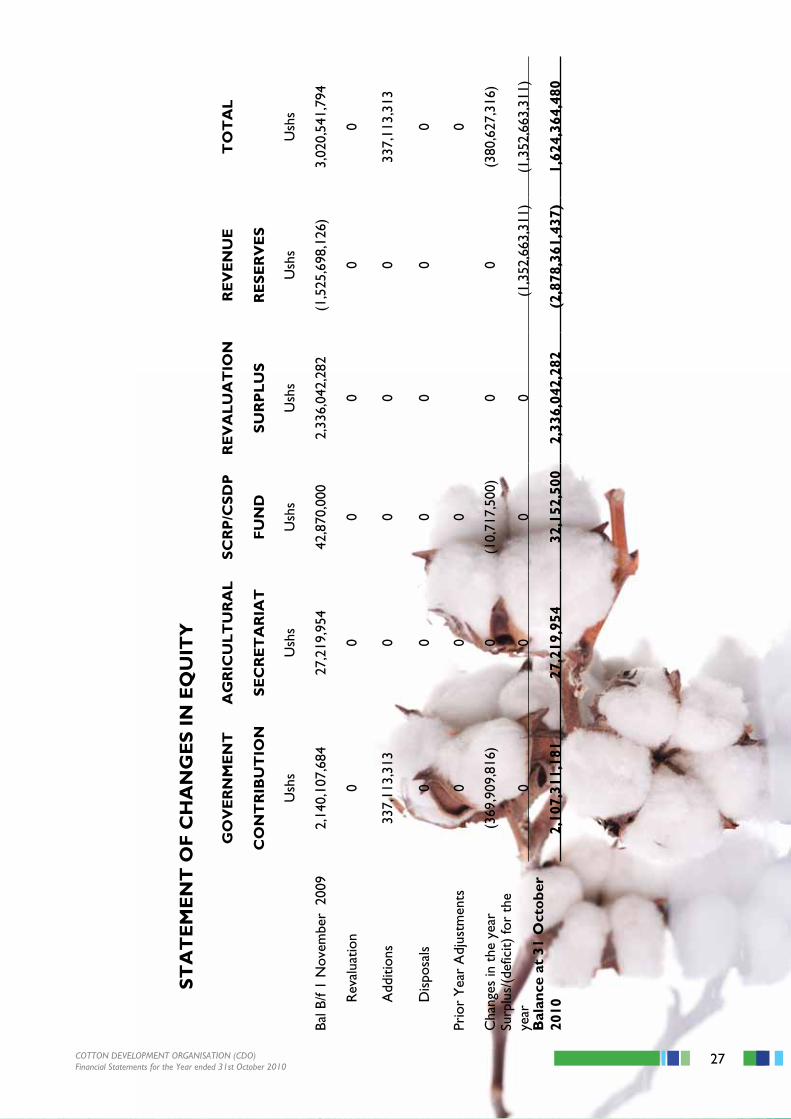
Bal B
/f 1
Nov
embe
r 2
009
2,14
0,10
7,68
427
,219
,954
42,8
70,0
00
2,33
6,04
2,28
2 (1
,525
,698
,126
)3,
020,
541,
794
Rev
alua
tion
00
00
00
Add
ition
s33
7,11
3,31
30
00
033
7,11
3,31
3
Dis
posa
ls0
00
00
0
Prio
r Y
ear
Adj
ustm
ents
00
00
Cha
nges
in t
he y
ear
(369
,909
,816
)0
(10,
717,
500)
00
(380
,627
,316
)Su
rplu
s/(d
efic
it) fo
r th
e ye
ar0
00
0(1
,352
,663
,311
) (1
,352
,663
,311
)
B
alan
ce a
t 31
Oct
obe
r
2010
2,10
7,31
1,18
127
,219
,954
3
2,15
2,50
0
2,33
6,04
2,28
2
(2,8
78,3
61,4
37)
1,62
4,36
4,48
0
28 COTTON DEVELOPMENT ORGANISATION (CDO)Financial Statements for the Year ended 31st October 2010
Notes to the Financial Statements
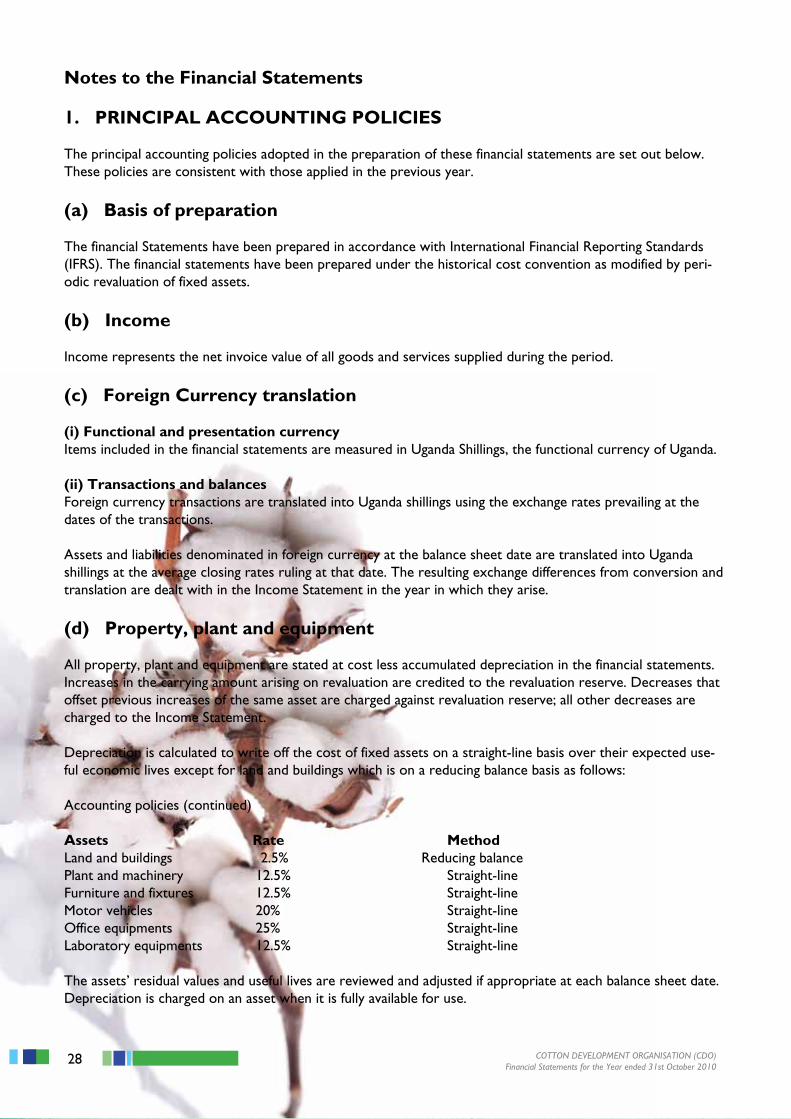
1. PRINCIPAL ACCOUNTING POLICIES
The principal accounting policies adopted in the preparation of these financial statements are set out below. These policies are consistent with those applied in the previous year.
(a) Basis of preparation
The financial Statements have been prepared in accordance with International Financial Reporting Standards (IFRS). The financial statements have been prepared under the historical cost convention as modified by peri-odic revaluation of fixed assets.
(b) Income
Income represents the net invoice value of all goods and services supplied during the period.
(c) Foreign Currency translation
(i) Functional and presentation currencyItems included in the financial statements are measured in Uganda Shillings, the functional currency of Uganda.
(ii) Transactions and balancesForeign currency transactions are translated into Uganda shillings using the exchange rates prevailing at the dates of the transactions.
Assets and liabilities denominated in foreign currency at the balance sheet date are translated into Uganda shillings at the average closing rates ruling at that date. The resulting exchange differences from conversion and translation are dealt with in the Income Statement in the year in which they arise.
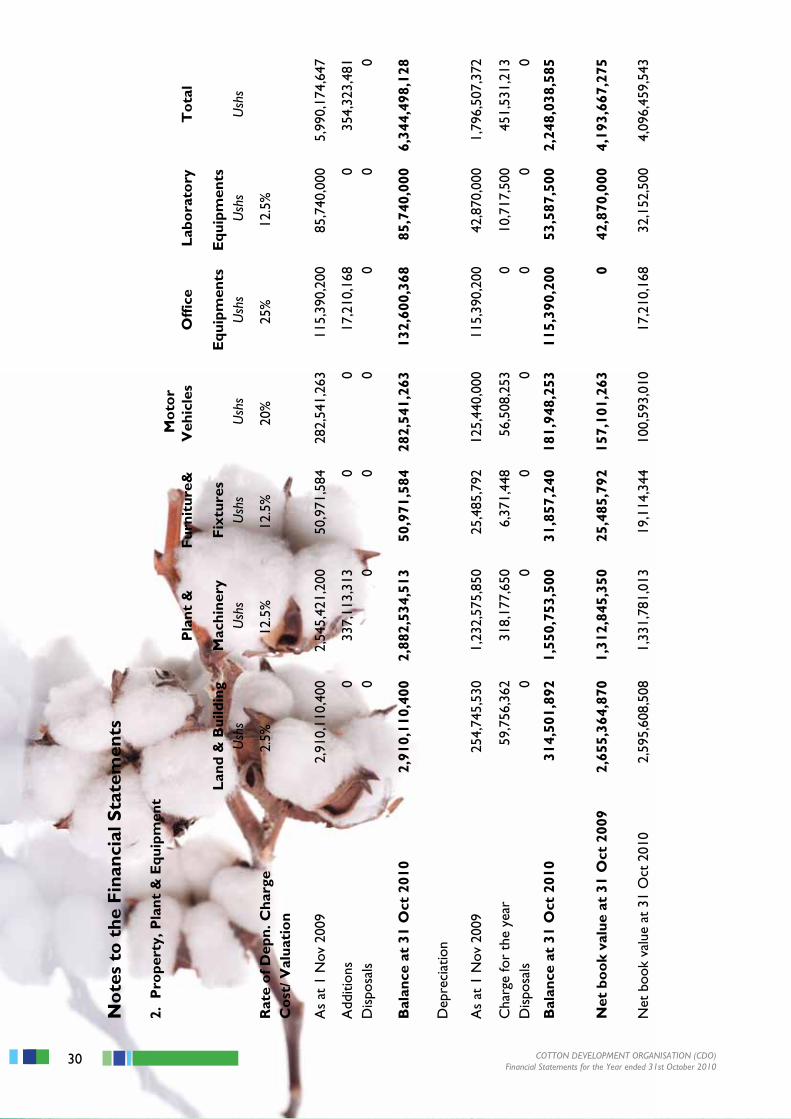
(d) Property, plant and equipment
All property, plant and equipment are stated at cost less accumulated depreciation in the financial statements. Increases in the carrying amount arising on revaluation are credited to the revaluation reserve. Decreases that offset previous increases of the same asset are charged against revaluation reserve; all other decreases are charged to the Income Statement.
Depreciation is calculated to write off the cost of fixed assets on a straight-line basis over their expected use-ful economic lives except for land and buildings which is on a reducing balance basis as follows:
Accounting policies (continued)
Assets Rate Method Land and buildings 2.5% Reducing balancePlant and machinery 12.5% Straight-lineFurniture and fixtures 12.5% Straight-lineMotor vehicles 20% Straight-lineOffice equipments 25% Straight-lineLaboratory equipments 12.5% Straight-line
The assets’ residual values and useful lives are reviewed and adjusted if appropriate at each balance sheet date. Depreciation is charged on an asset when it is fully available for use.
29COTTON DEVELOPMENT ORGANISATION (CDO)Financial Statements for the Year ended 31st October 2010
Gains and losses on disposals are determined by comparing the proceeds with the carrying amount and are recognized within other (losses)/gains – net, in the Income Statement.
When revalued items are sold, the amounts included in Other Reserves are transferred to Revenue Reserves.
(e) Stocks
Stocks are stated at the lower of cost and net realizable value. Cost is determined on a first in first out (FIFO) basis. Net realizable value is the price at which stock can be realized in the normal course of business after allowing for the costs of the realization and where approximate, of conversion from existing state to finalized condition.
(f) Cash and cash equivalents
Cash and cash equivalents include cash at hand, deposits held at call with banks, other short-term highly liquid investments and bank overdrafts. Bank overdrafts, where they arise, are shown within the current liabilities on the balance sheet.
30 COTTON DEVELOPMENT ORGANISATION (CDO)Financial Statements for the Year ended 31st October 2010
No
tes
to t
he F
inan
cial
Sta
tem
ents
2. P
rope
rty,
Pla
nt &
Equ
ipm
ent
P
lant
&
Fur
nitu
re&
M
oto
r V
ehic
les
Off
ice
Lab
ora
tory
T
ota
l
Lan
d &
Bui
ldin
g M
achi
nery
F
ixtu
res
Equ
ipm
ents
Equ
ipm
ents
U
shs
Ush
s U
shs
Ush
s U
shs
Ush
s U
shs
Rat
e o
f Dep
n. C
harg
e 2.
5%12
.5%
12.5
%20
%25
%12
.5%
Co
st/ V
alua
tio
n
As
at 1
Nov
200
9
2
,910
,110
,400
2,
545,
421,
200
50,9
71,5
84
282,
541,
263
115,
390,
200
85,7
40,0
00
5,99
0,17
4,64
7
Add
ition
s
0
33
7,11
3,31
3 0
0 17
,210
,168
0
354,
323,
481
Dis
posa
ls
0
0
0 0
0 0
0
Bal
ance
at
31 O
ct 2
010
2,
910,
110,
400
2,88
2,53
4,51
3 50
,971
,584
28
2,54
1,26
313
2,60
0,36
8 85
,740
,000
6,
344,
498,
128
Dep
reci
atio
n
As
at 1
Nov
200
9
2
54,7
45,5
30
1,
232,
575,
850
25,4
85,7
92
125,
440,
000
115,
390,
200
4
2,87
0,00
0 1
,796
,507
,372
Cha
rge
for
the
year
59,7
56,3
62
318,
177,
650
6,37
1,44
8 56
,508
,253
0 10
,717
,500
45
1,53
1,21
3 D
ispo
sals
0 0
0 0
0 0
0
Bal
ance
at
31 O
ct 2
010
314,
501,
892
1,55
0,75
3,50
031
,857
,240
181,
948,
253
115,
390,
200
53,5
87,5
002,
248,
038,
585
Net
bo
ok
valu
e at
31
Oct
200
92,
655,
364,
870
1,31
2,84
5,35
025
,485
,792
157,
101,
263
042
,870
,000
4,19
3,66
7,27
5
Net
boo
k va
lue
at 3
1 O
ct 2
010
2,59
5,60
8,50
81,
331,
781,
013
19,1
14,3
4410
0,59
3,01
017
,210
,168
32,1
52,5
004,
096,
459,
543
31COTTON DEVELOPMENT ORGANISATION (CDO)Financial Statements for the Year ended 31st October 2010
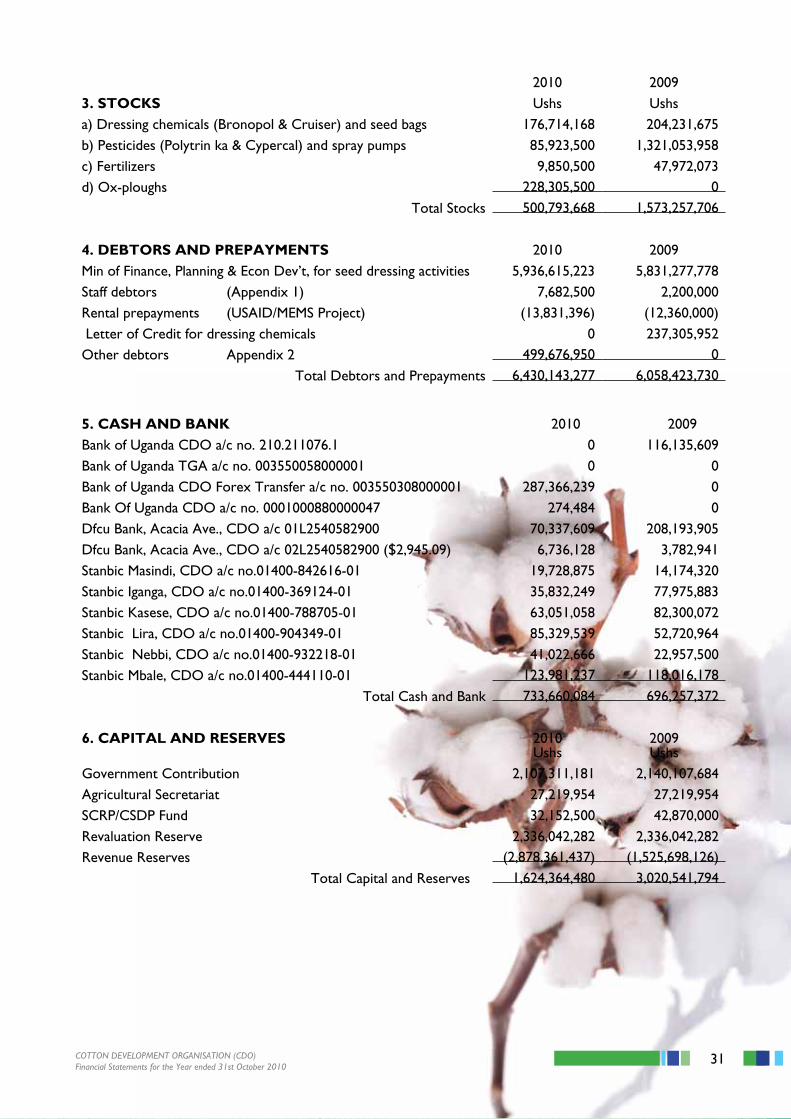
2010 20093. STOCKS Ushs Ushsa) Dressing chemicals (Bronopol & Cruiser) and seed bags 176,714,168 204,231,675 b) Pesticides (Polytrin ka & Cypercal) and spray pumps 85,923,500 1,321,053,958c) Fertilizers 9,850,500 47,972,073d) Ox-ploughs 228,305,500 0
Total Stocks 500,793,668 1,573,257,706
4. DEBTORS AND PREPAYMENTS 2010 2009Min of Finance, Planning & Econ Dev’t, for seed dressing activities 5,936,615,223 5,831,277,778Staff debtors (Appendix 1) 7,682,500 2,200,000Rental prepayments (USAID/MEMS Project) (13,831,396) (12,360,000) Letter of Credit for dressing chemicals 0 237,305,952Other debtors Appendix 2 499,676,950 0
Total Debtors and Prepayments 6,430,143,277 6,058,423,730
5. CASH AND BANK 2010 2009Bank of Uganda CDO a/c no. 210.211076.1 0 116,135,609Bank of Uganda TGA a/c no. 003550058000001 0 0Bank of Uganda CDO Forex Transfer a/c no. 003550308000001 287,366,239 0Bank Of Uganda CDO a/c no. 0001000880000047 274,484 0Dfcu Bank, Acacia Ave., CDO a/c 01L2540582900 70,337,609 208,193,905Dfcu Bank, Acacia Ave., CDO a/c 02L2540582900 ($2,945.09) 6,736,128 3,782,941Stanbic Masindi, CDO a/c no.01400-842616-01 19,728,875 14,174,320Stanbic Iganga, CDO a/c no.01400-369124-01 35,832,249 77,975,883Stanbic Kasese, CDO a/c no.01400-788705-01 63,051,058 82,300,072Stanbic Lira, CDO a/c no.01400-904349-01 85,329,539 52,720,964Stanbic Nebbi, CDO a/c no.01400-932218-01 41,022,666 22,957,500Stanbic Mbale, CDO a/c no.01400-444110-01 123,981,237 118,016,178
Total Cash and Bank 733,660,084 696,257,372
6. CAPITAL AND RESERVES 2010 2009Ushs Ushs
Government Contribution 2,107,311,181 2,140,107,684Agricultural Secretariat 27,219,954 27,219,954SCRP/CSDP Fund 32,152,500 42,870,000Revaluation Reserve 2,336,042,282 2,336,042,282Revenue Reserves (2,878,361,437) (1,525,698,126)
Total Capital and Reserves 1,624,364,480 3,020,541,794
32 COTTON DEVELOPMENT ORGANISATION (CDO)Financial Statements for the Year ended 31st October 2010
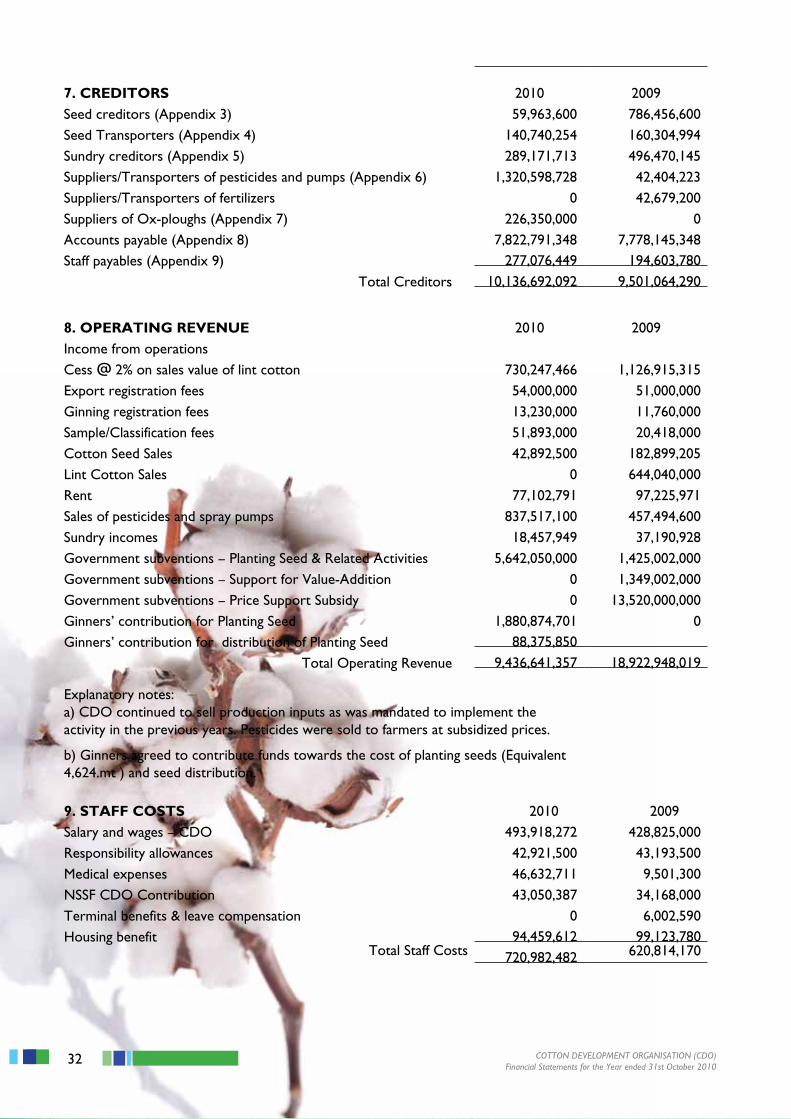
7. CREDITORS 2010 2009Seed creditors (Appendix 3) 59,963,600 786,456,600Seed Transporters (Appendix 4) 140,740,254 160,304,994 Sundry creditors (Appendix 5) 289,171,713 496,470,145 Suppliers/Transporters of pesticides and pumps (Appendix 6) 1,320,598,728 42,404,223Suppliers/Transporters of fertilizers 0 42,679,200Suppliers of Ox-ploughs (Appendix 7) 226,350,000 0Accounts payable (Appendix 8) 7,822,791,348 7,778,145,348Staff payables (Appendix 9) 277,076,449 194,603,780
Total Creditors 10,136,692,092 9,501,064,290
8. OPERATING REVENUE 2010 2009Income from operationsCess @ 2% on sales value of lint cotton 730,247,466 1,126,915,315Export registration fees 54,000,000 51,000,000Ginning registration fees 13,230,000 11,760,000Sample/Classification fees 51,893,000 20,418,000 Cotton Seed Sales 42,892,500 182,899,205 Lint Cotton Sales 0 644,040,000Rent 77,102,791 97,225,971 Sales of pesticides and spray pumps 837,517,100 457,494,600Sundry incomes 18,457,949 37,190,928Government subventions – Planting Seed & Related Activities 5,642,050,000 1,425,002,000Government subventions – Support for Value-Addition 0 1,349,002,000Government subventions – Price Support Subsidy 0 13,520,000,000Ginners’ contribution for Planting Seed 1,880,874,701 0Ginners’ contribution for distribution of Planting Seed 88,375,850
Total Operating Revenue 9,436,641,357 18,922,948,019
Explanatory notes:a) CDO continued to sell production inputs as was mandated to implement the activity in the previous years. Pesticides were sold to farmers at subsidized prices.
b) Ginners agreed to contribute funds towards the cost of planting seeds (Equivalent 4,624.mt ) and seed distribution.
9. STAFF COSTS 2010 2009Salary and wages – CDO 493,918,272 428,825,000Responsibility allowances 42,921,500 43,193,500Medical expenses 46,632,711 9,501,300NSSF CDO Contribution 43,050,387 34,168,000Terminal benefits & leave compensation 0 6,002,590Housing benefit 94,459,612 99,123,780
Total Staff Costs 720,982,482 620,814,170
33COTTON DEVELOPMENT ORGANISATION (CDO)Financial Statements for the Year ended 31st October 2010
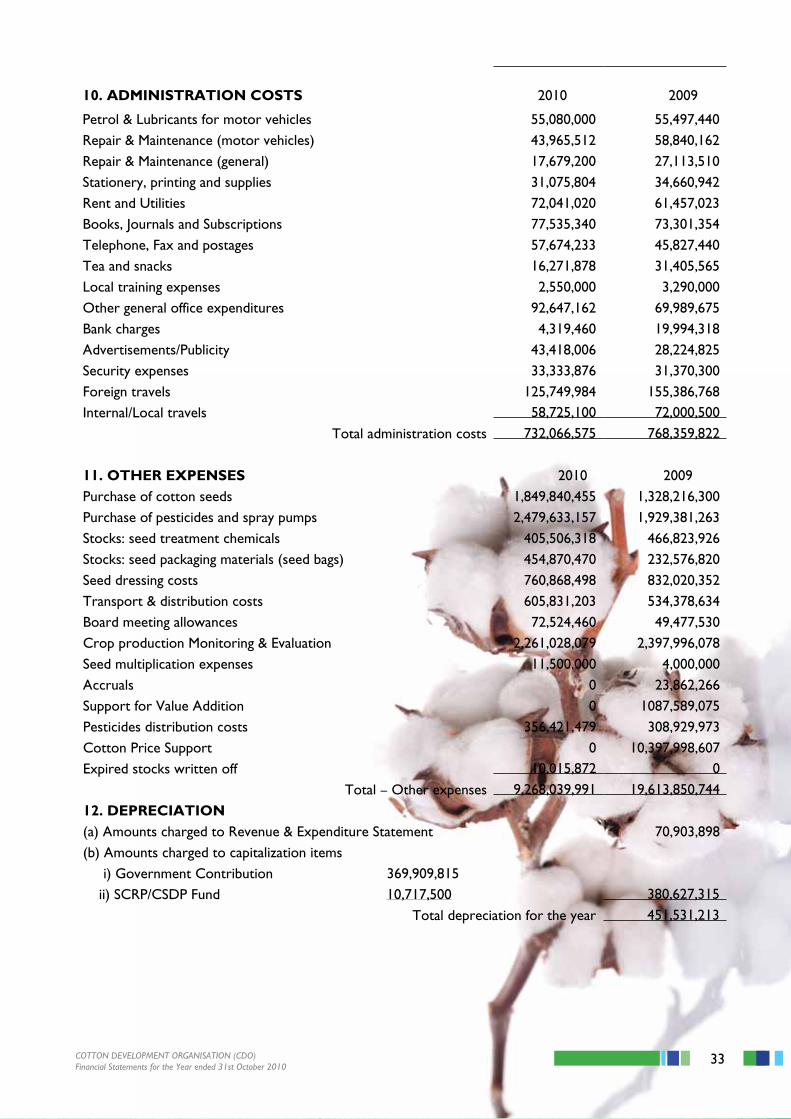
10. ADMINISTRATION COSTS 2010 2009
Petrol & Lubricants for motor vehicles 55,080,000 55,497,440Repair & Maintenance (motor vehicles) 43,965,512 58,840,162Repair & Maintenance (general) 17,679,200 27,113,510Stationery, printing and supplies 31,075,804 34,660,942Rent and Utilities 72,041,020 61,457,023Books, Journals and Subscriptions 77,535,340 73,301,354Telephone, Fax and postages 57,674,233 45,827,440Tea and snacks 16,271,878 31,405,565Local training expenses 2,550,000 3,290,000Other general office expenditures 92,647,162 69,989,675Bank charges 4,319,460 19,994,318Advertisements/Publicity 43,418,006 28,224,825Security expenses 33,333,876 31,370,300Foreign travels 125,749,984 155,386,768Internal/Local travels 58,725,100 72,000,500
Total administration costs 732,066,575 768,359,822
11. OTHER EXPENSES 2010 2009Purchase of cotton seeds 1,849,840,455 1,328,216,300Purchase of pesticides and spray pumps 2,479,633,157 1,929,381,263Stocks: seed treatment chemicals 405,506,318 466,823,926Stocks: seed packaging materials (seed bags) 454,870,470 232,576,820Seed dressing costs 760,868,498 832,020,352Transport & distribution costs 605,831,203 534,378,634Board meeting allowances 72,524,460 49,477,530Crop production Monitoring & Evaluation 2,261,028,079 2,397,996,078Seed multiplication expenses 11,500,000 4,000,000Accruals 0 23,862,266Support for Value Addition 0 1087,589,075Pesticides distribution costs 356,421,479 308,929,973Cotton Price Support 0 10,397,998,607Expired stocks written off 10,015,872 0
Total – Other expenses 9,268,039,991 19,613,850,74412. DEPRECIATION(a) Amounts charged to Revenue & Expenditure Statement 70,903,898(b) Amounts charged to capitalization items i) Government Contribution 369,909,815 ii) SCRP/CSDP Fund 10,717,500 380,627,315
Total depreciation for the year 451,531,213
34 COTTON DEVELOPMENT ORGANISATION (CDO)Financial Statements for the Year ended 31st October 2010
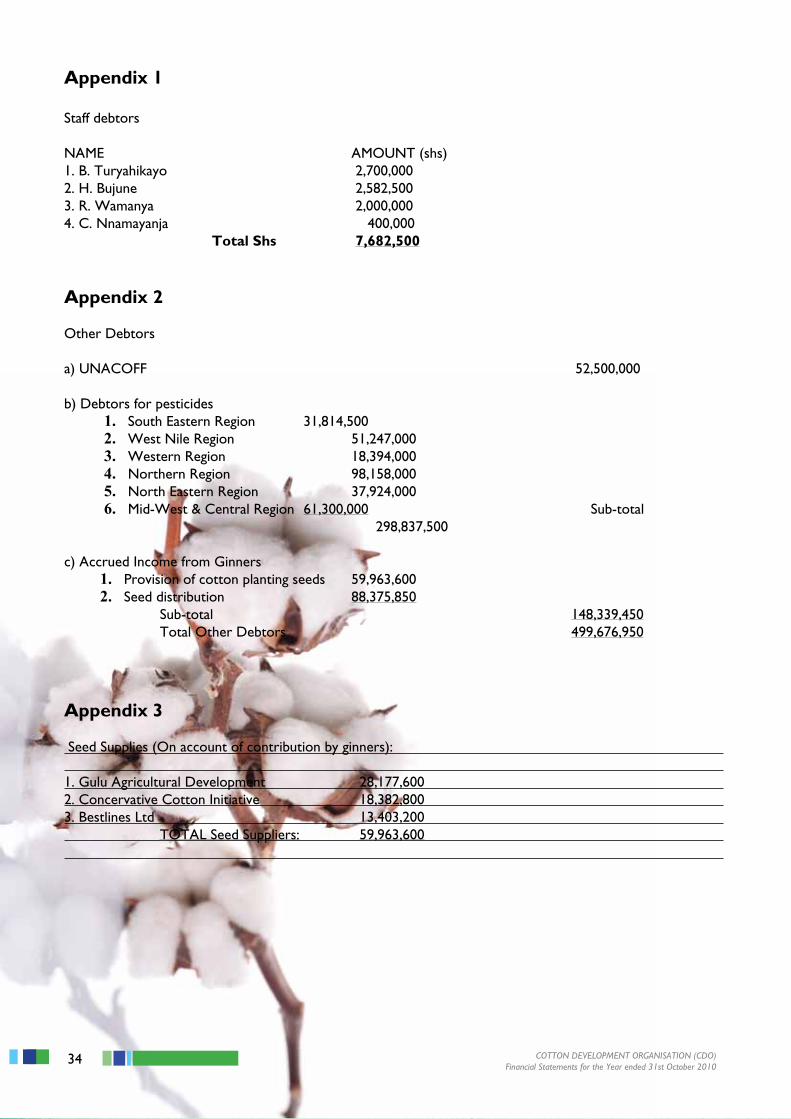
Appendix 1
Staff debtors
NAME AMOUNT (shs)1. B. Turyahikayo 2,700,0002. H. Bujune 2,582,5003. R. Wamanya 2,000,0004. C. Nnamayanja 400,000 Total Shs 7,682,500
Appendix 2
Other Debtors
a) UNACOFF 52,500,000
b) Debtors for pesticides 1. South Eastern Region 31,814,5002. West Nile Region 51,247,0003. Western Region 18,394,0004. Northern Region 98,158,0005. North Eastern Region 37,924,0006. Mid-West & Central Region 61,300,000 Sub-total
298,837,500
c) Accrued Income from Ginners 1. Provision of cotton planting seeds 59,963,6002. Seed distribution 88,375,850
Sub-total 148,339,450 Total Other Debtors 499,676,950
Appendix 3
Seed Supplies (On account of contribution by ginners):
1. Gulu Agricultural Development 28,177,6002. Concervative Cotton Initiative 18,382,8003. Bestlines Ltd 13,403,200 TOTAL Seed Suppliers: 59,963,600
35COTTON DEVELOPMENT ORGANISATION (CDO)Financial Statements for the Year ended 31st October 2010
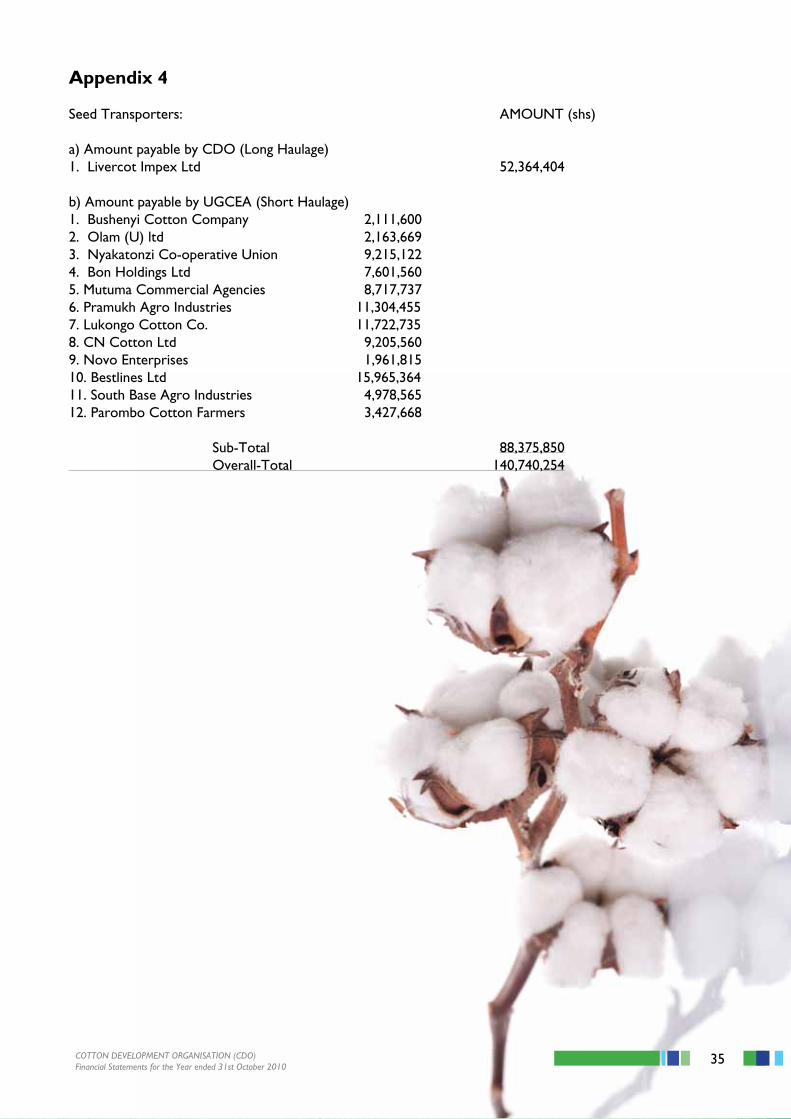
Appendix 4
Seed Transporters: AMOUNT (shs)
a) Amount payable by CDO (Long Haulage)1. Livercot Impex Ltd 52,364,404
b) Amount payable by UGCEA (Short Haulage)1. Bushenyi Cotton Company 2,111,6002. Olam (U) ltd 2,163,6693. Nyakatonzi Co-operative Union 9,215,1224. Bon Holdings Ltd 7,601,5605. Mutuma Commercial Agencies 8,717,7376. Pramukh Agro Industries 11,304,4557. Lukongo Cotton Co. 11,722,7358. CN Cotton Ltd 9,205,5609. Novo Enterprises 1,961,81510. Bestlines Ltd 15,965,36411. South Base Agro Industries 4,978,56512. Parombo Cotton Farmers 3,427,668 Sub-Total 88,375,850 Overall-Total 140,740,254
36 COTTON DEVELOPMENT ORGANISATION (CDO)Financial Statements for the Year ended 31st October 2010
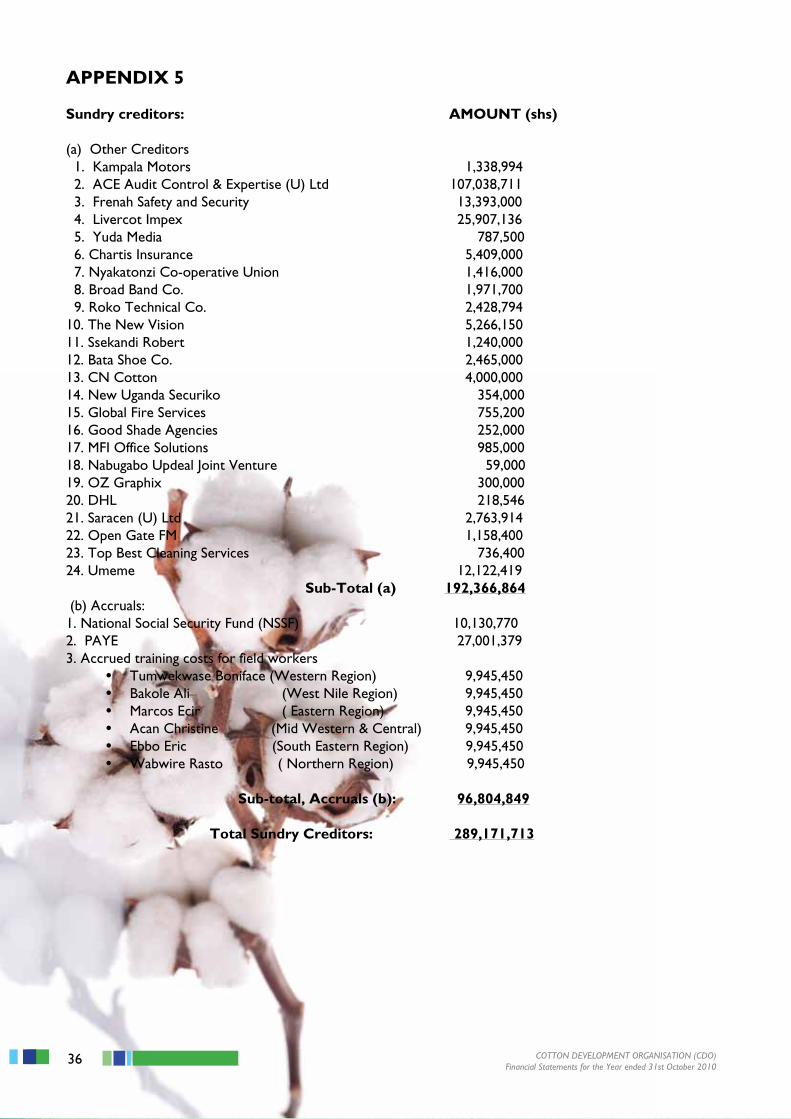
APPENDIX 5
Sundry creditors: AMOUNT (shs)
(a) Other Creditors 1. Kampala Motors 1,338,994 2. ACE Audit Control & Expertise (U) Ltd 107,038,711 3. Frenah Safety and Security 13,393,000 4. Livercot Impex 25,907,136 5. Yuda Media 787,500 6. Chartis Insurance 5,409,000 7. Nyakatonzi Co-operative Union 1,416,000 8. Broad Band Co. 1,971,700 9. Roko Technical Co. 2,428,79410. The New Vision 5,266,15011. Ssekandi Robert 1,240,00012. Bata Shoe Co. 2,465,00013. CN Cotton 4,000,00014. New Uganda Securiko 354,00015. Global Fire Services 755,20016. Good Shade Agencies 252,00017. MFI Office Solutions 985,00018. Nabugabo Updeal Joint Venture 59,00019. OZ Graphix 300,00020. DHL 218,54621. Saracen (U) Ltd 2,763,91422. Open Gate FM 1,158,40023. Top Best Cleaning Services 736,40024. Umeme 12,122,419 Sub-Total (a) 192,366,864 (b) Accruals:1. National Social Security Fund (NSSF) 10,130,7702. PAYE 27,001,3793. Accrued training costs for field workers
• Tumwekwase Boniface (Western Region) 9,945,450• Bakole Ali (West Nile Region) 9,945,450• Marcos Ecir ( Eastern Region) 9,945,450• Acan Christine (Mid Western & Central) 9,945,450• Ebbo Eric (South Eastern Region) 9,945,450• Wabwire Rasto ( Northern Region) 9,945,450
Sub-total, Accruals (b): 96,804,849 Total Sundry Creditors: 289,171,713
37COTTON DEVELOPMENT ORGANISATION (CDO)Financial Statements for the Year ended 31st October 2010
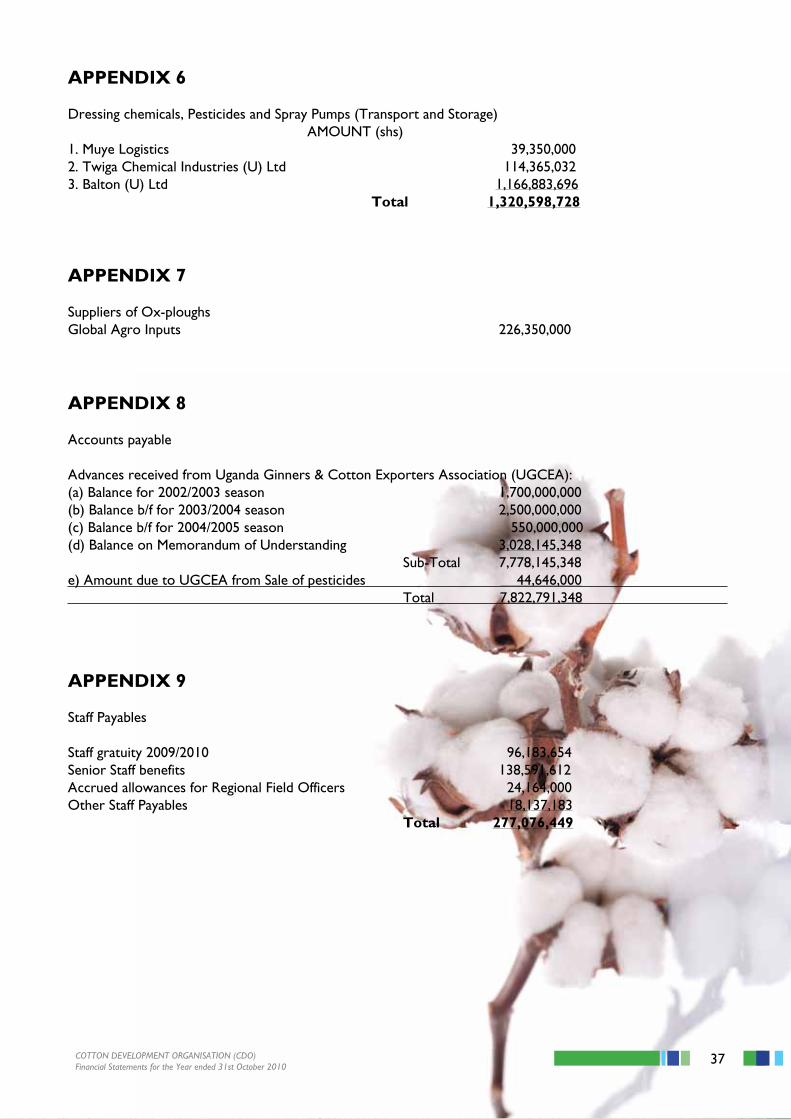
APPENDIX 6
Dressing chemicals, Pesticides and Spray Pumps (Transport and Storage) AMOUNT (shs)1. Muye Logistics 39,350,0002. Twiga Chemical Industries (U) Ltd 114,365,0323. Balton (U) Ltd 1,166,883,696 Total 1,320,598,728
APPENDIX 7
Suppliers of Ox-ploughsGlobal Agro Inputs 226,350,000
APPENDIX 8
Accounts payable
Advances received from Uganda Ginners & Cotton Exporters Association (UGCEA):(a) Balance for 2002/2003 season 1,700,000,000(b) Balance b/f for 2003/2004 season 2,500,000,000(c) Balance b/f for 2004/2005 season 550,000,000(d) Balance on Memorandum of Understanding 3,028,145,348 Sub-Total 7,778,145,348e) Amount due to UGCEA from Sale of pesticides 44,646,000 Total 7,822,791,348
APPENDIX 9
Staff Payables
Staff gratuity 2009/2010 96,183,654Senior Staff benefits 138,591,612Accrued allowances for Regional Field Officers 24,164,000Other Staff Payables 18,137,183 Total 277,076,449
38 Annual Report 2009/2010