Embed Size (px)
Citation preview
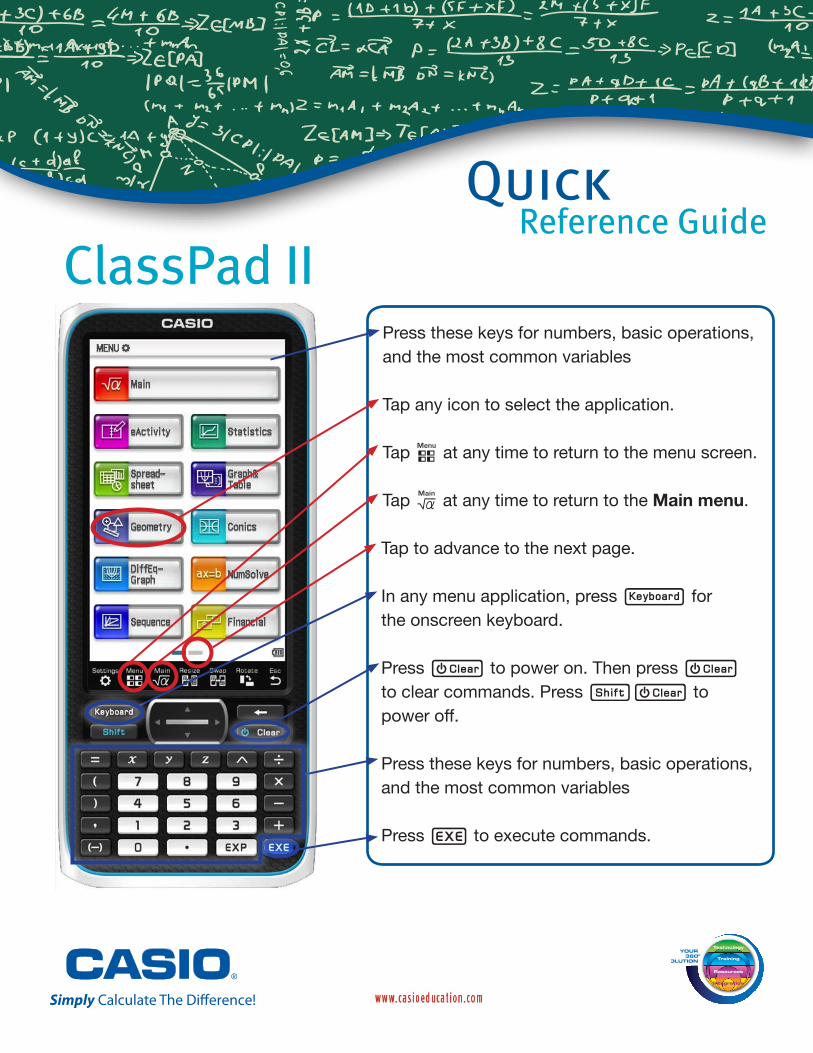
Press these keys for numbers, basic operations, and the most common variables
Tap any icon to select the application.
Tap m at any time to return to the menu screen.
Tap M at any time to return to the Main menu.
Tap to advance to the next page.
In any menu application, press k for the onscreen keyboard.
Press c to power on. Then press c to clear commands. Press Kc to power off.
Press these keys for numbers, basic operations, and the most common variables
Press E to execute commands.
ClassPad II
Quick Reference Guide
White gradient to 50% transparency.Note this logo is on separate layer from background
ClassPad II
Quick Reference Guide
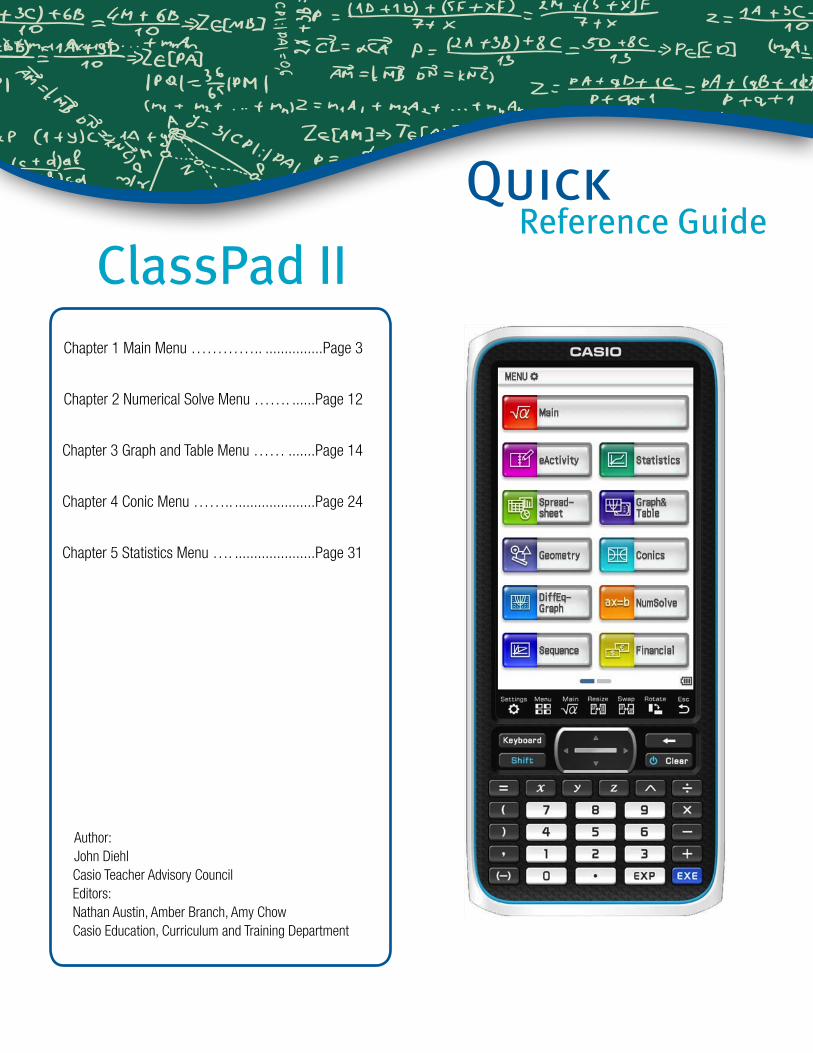
Author:John DiehlCasio Teacher Advisory CouncilEditors:Nathan Austin, Amber Branch, Amy ChowCasio Education, Curriculum and Training Department
Chapter 1 Main Menu ………….. ...............Page 3
Chapter 2 Numerical Solve Menu ……. ......Page 12
Chapter 3 Graph and Table Menu …… .......Page 14
Chapter 4 Conic Menu …….. .....................Page 24
Chapter 5 Statistics Menu …. .....................Page 31
If an object, such as a ball, is dropped from a initial height, c, the height, h, in feet, as a function of time, t, in seconds, can be modeled by h = -16t2 + c.
If the object is tossed upwards with an initial velocity, v, then the model becomes h = -16t2 + vt + c. These models ignore air resistance.
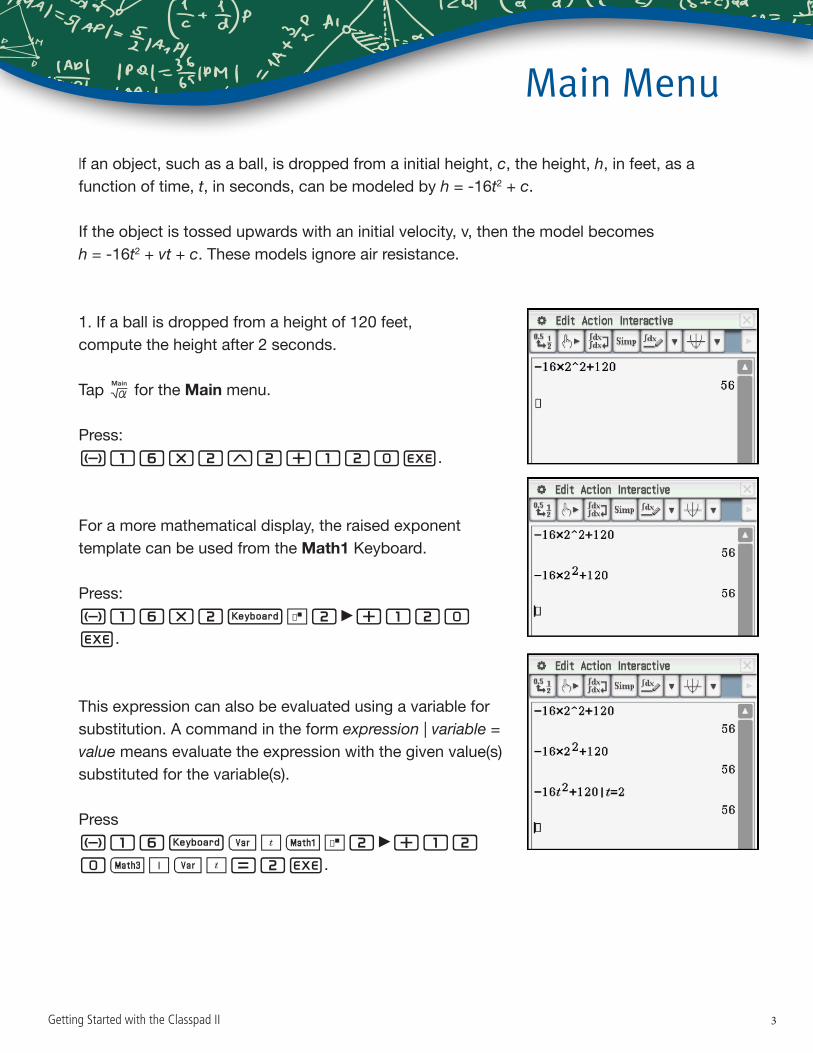
1. If a ball is dropped from a height of 120 feet, compute the height after 2 seconds.
Tap M for the Main menu.
Press: z16*2^2+120E.
For a more mathematical display, the raised exponent template can be used from the Math1 Keyboard.
Press:z16*2kO2:+120 E.
This expression can also be evaluated using a variable for substitution. A command in the form expression | variable = value means evaluate the expression with the given value(s) substituted for the variable(s).
Press z16k_[)O2:+12 0-U_[=2E.
Main Menu
Getting Started with the Classpad II 3
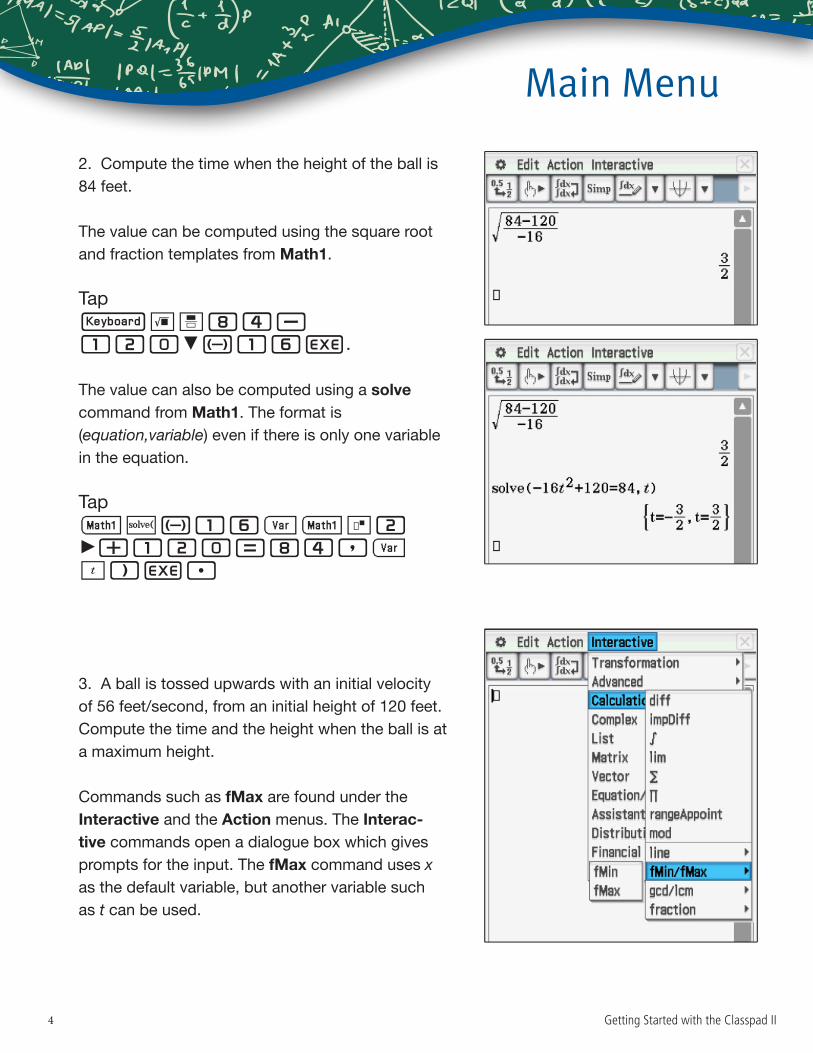
2. Compute the time when the height of the ball is 84 feet.
The value can be computed using the square root and fraction templates from Math1.
Tap k5N84-120Cz16E.
The value can also be computed using a solve command from Math1. The format is (equation,variable) even if there is only one variable in the equation.
Tap)`z16_)O2 :+120=84,_[)E.
3. A ball is tossed upwards with an initial velocity of 56 feet/second, from an initial height of 120 feet. Compute the time and the height when the ball is at a maximum height.
Commands such as fMax are found under the Interactive and the Action menus. The Interac-tive commands open a dialogue box which gives prompts for the input. The fMax command uses x as the default variable, but another variable such as t can be used.
Main Menu
Getting Started with the Classpad II4

Tap Interactive, Calculation, fMin/fMax, fMax and complete the inputs as shown. (Part of the first coefficient, -16, has scrolled off the screen.) Then tap OK.
4. Rewrite the expression from Question 3 in factored form.
Tap Interactive, Transformation, factor, factor.
Main Menu
Getting Started with the Classpad II 5
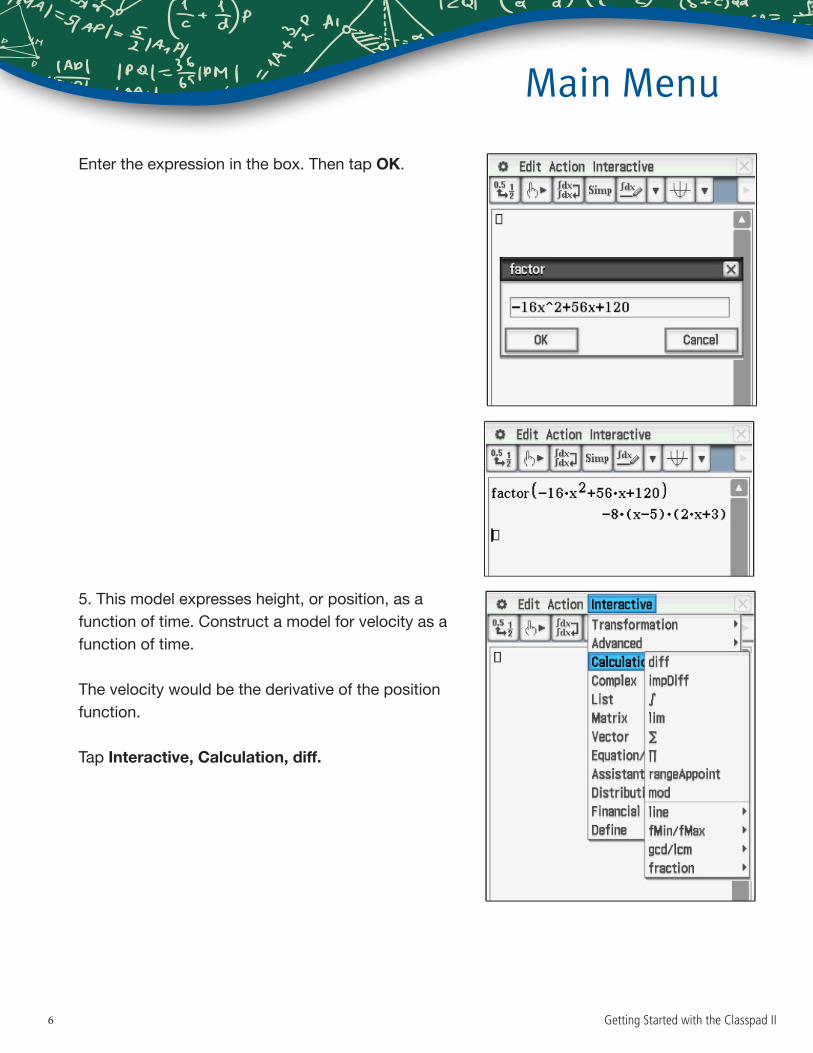
Enter the expression in the box. Then tap OK.
5. This model expresses height, or position, as a function of time. Construct a model for velocity as a function of time.
The velocity would be the derivative of the position function.
Tap Interactive, Calculation, diff.
Main Menu
Getting Started with the Classpad II6
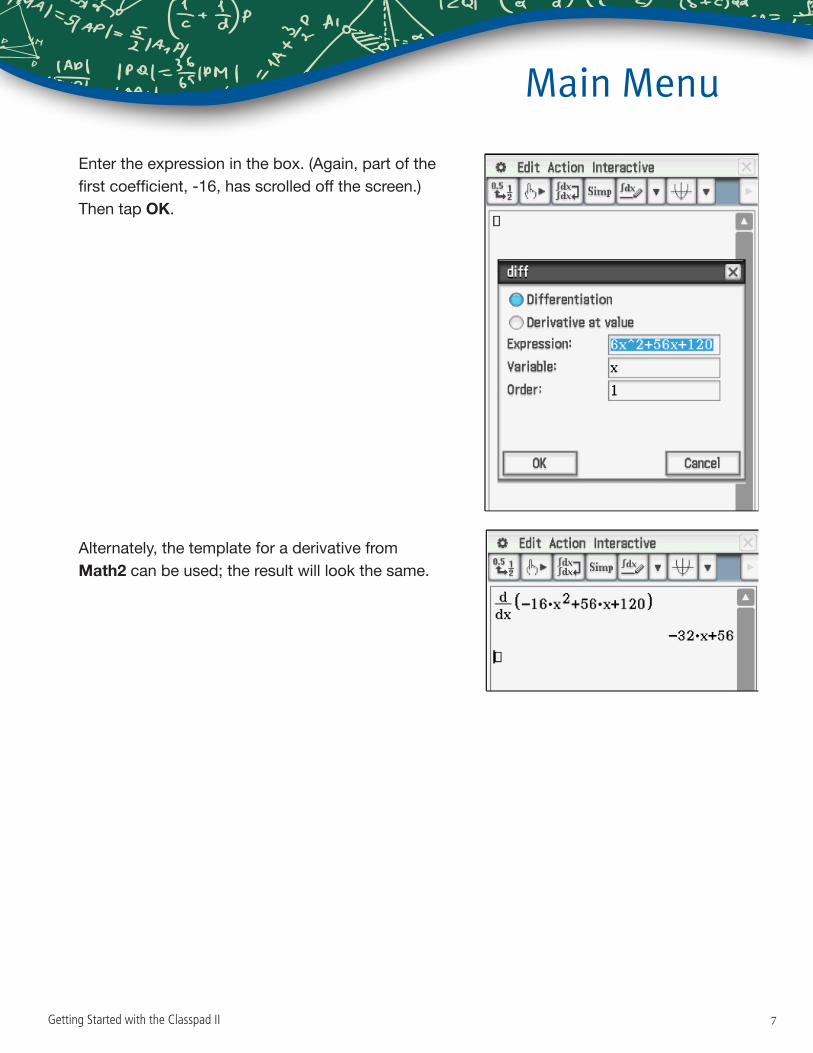
Enter the expression in the box. (Again, part of the first coefficient, -16, has scrolled off the screen.) Then tap OK.
Alternately, the template for a derivative from Math2 can be used; the result will look the same.
Main Menu
Getting Started with the Classpad II 7
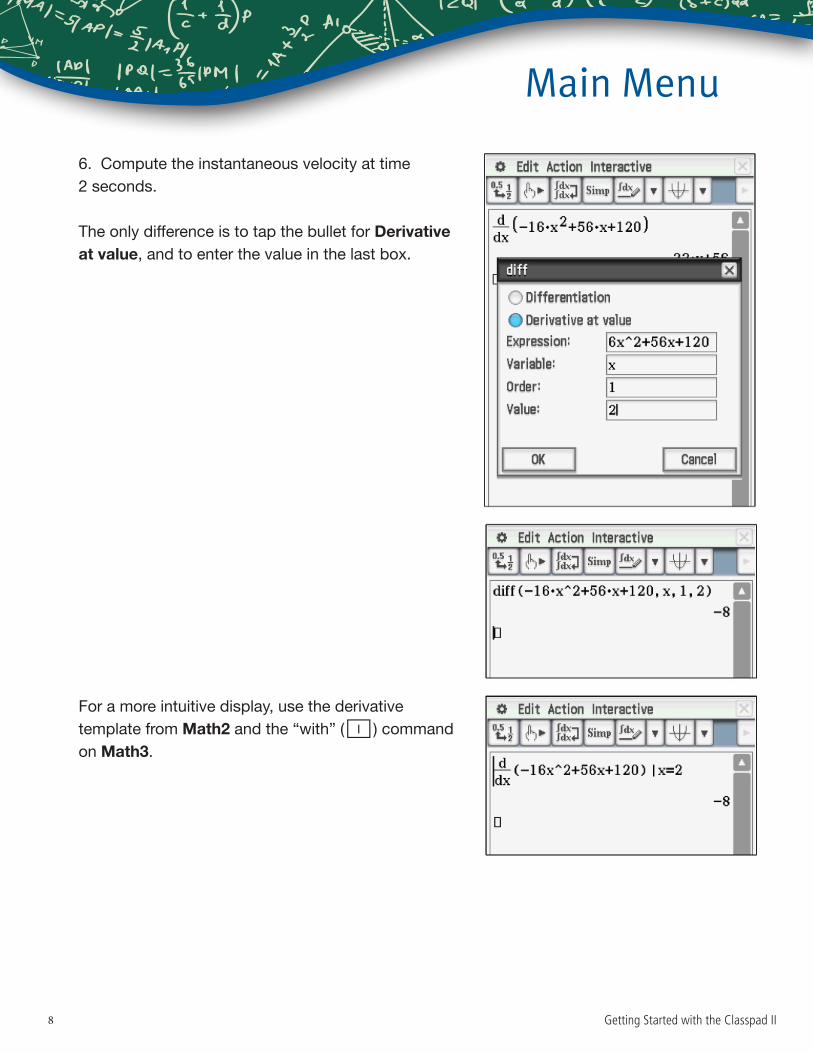
6. Compute the instantaneous velocity at time 2 seconds.
The only difference is to tap the bullet for Derivative at value, and to enter the value in the last box.
For a more intuitive display, use the derivative template from Math2 and the “with” (U) command on Math3.
Main Menu
Getting Started with the Classpad II8
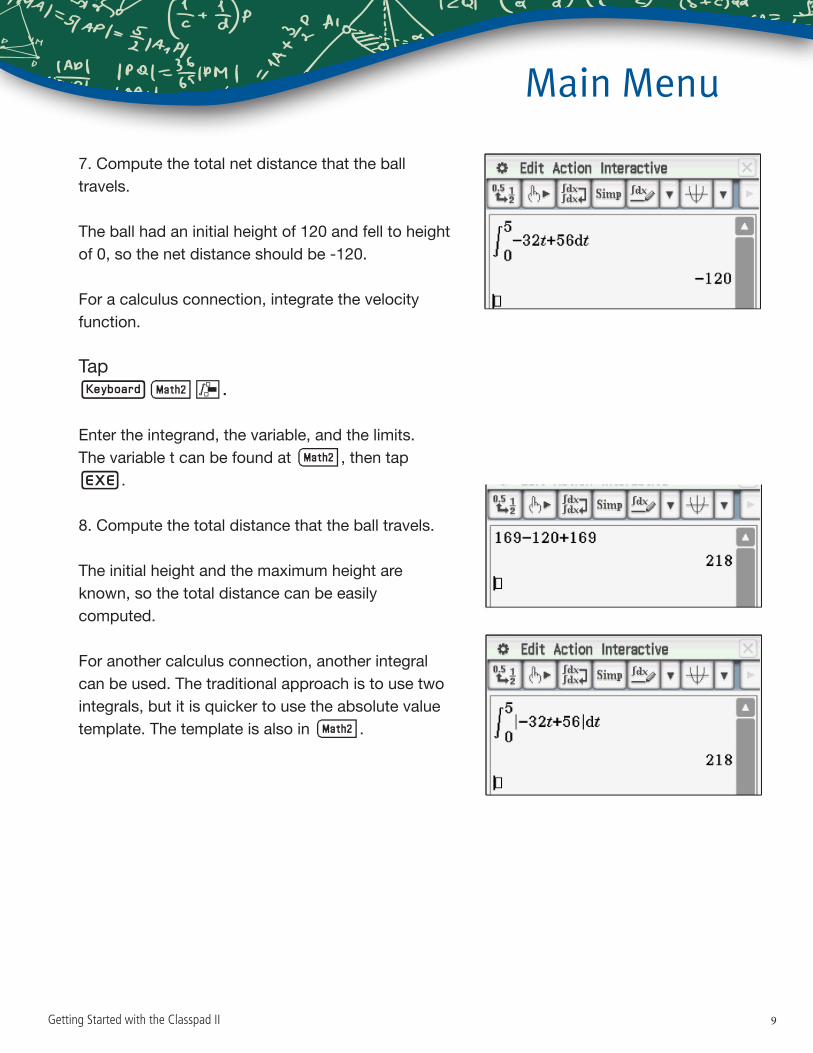
7. Compute the total net distance that the ball travels.
The ball had an initial height of 120 and fell to height of 0, so the net distance should be -120.
For a calculus connection, integrate the velocity function.
Tap k9P.
Enter the integrand, the variable, and the limits. The variable t can be found at 9, then tap E.
8. Compute the total distance that the ball travels.
The initial height and the maximum height are known, so the total distance can be easily computed.
For another calculus connection, another integral can be used. The traditional approach is to use two integrals, but it is quicker to use the absolute value template. The template is also in 9.
Main Menu
Getting Started with the Classpad II 9
The ClassPad has a symbolic algebra system, sometimes called a computer algebra system, or CAS. An important distinction is a calculator using symbolic algebra can manipulate unde-clared variables. The factoring example from Question 4 was an illustration. It is usually a good idea to tap Edit, then Clear All Variables to ensure that the variables do not have a value stored in memory. The next 2 questions illustrate additional symbolic algebra.
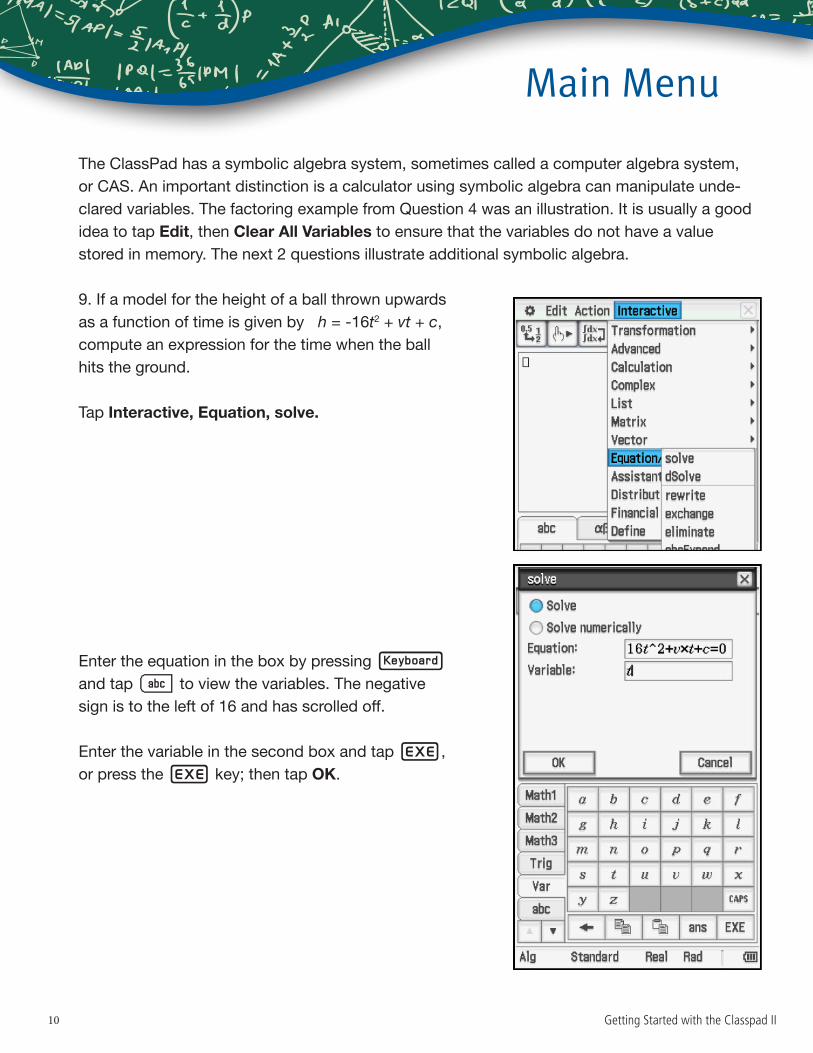
9. If a model for the height of a ball thrown upwards as a function of time is given by h = -16t2 + vt + c, compute an expression for the time when the ball hits the ground.
Tap Interactive, Equation, solve.
Enter the equation in the box by pressing k and tap 0 to view the variables. The negative sign is to the left of 16 and has scrolled off.
Enter the variable in the second box and tap E, or press the E key; then tap OK.
Main Menu
Getting Started with the Classpad II10
Main Menu
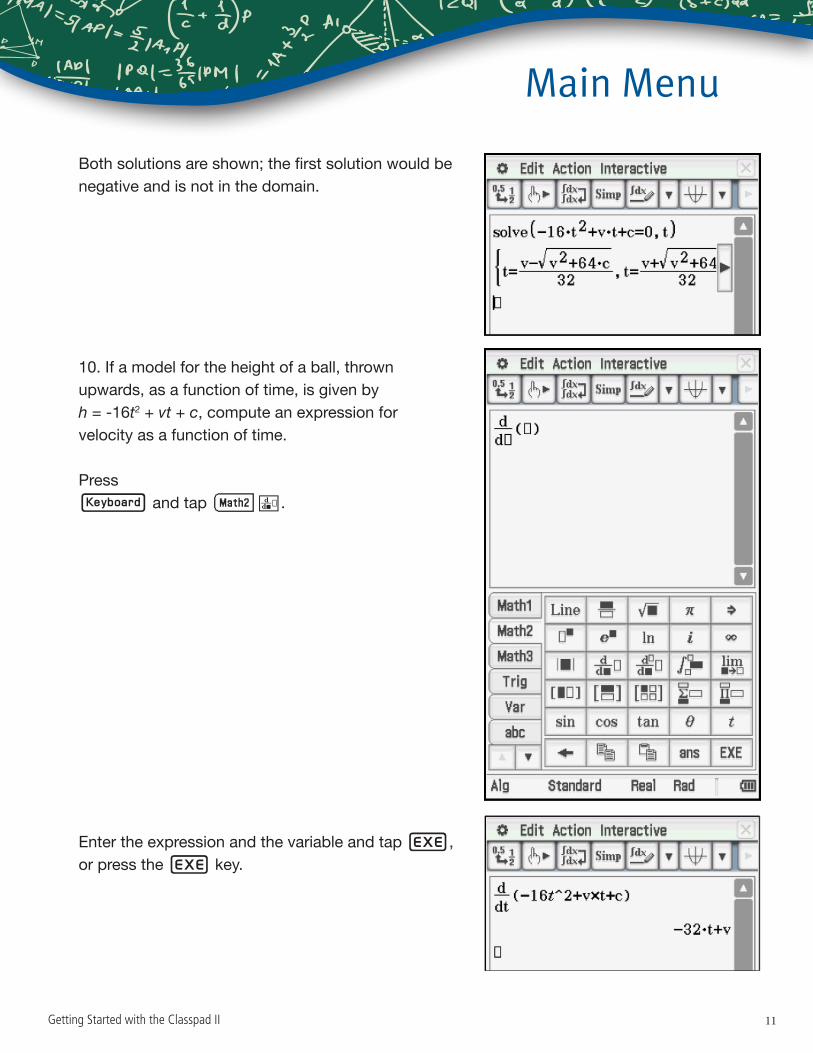
Both solutions are shown; the first solution would be negative and is not in the domain.
10. If a model for the height of a ball, thrown upwards, as a function of time, is given by h = -16t2 + vt + c, compute an expression for velocity as a function of time.
Press k and tap 9].
Enter the expression and the variable and tap E, or press the E key.
Getting Started with the Classpad II 11
Numerical Solve Menu
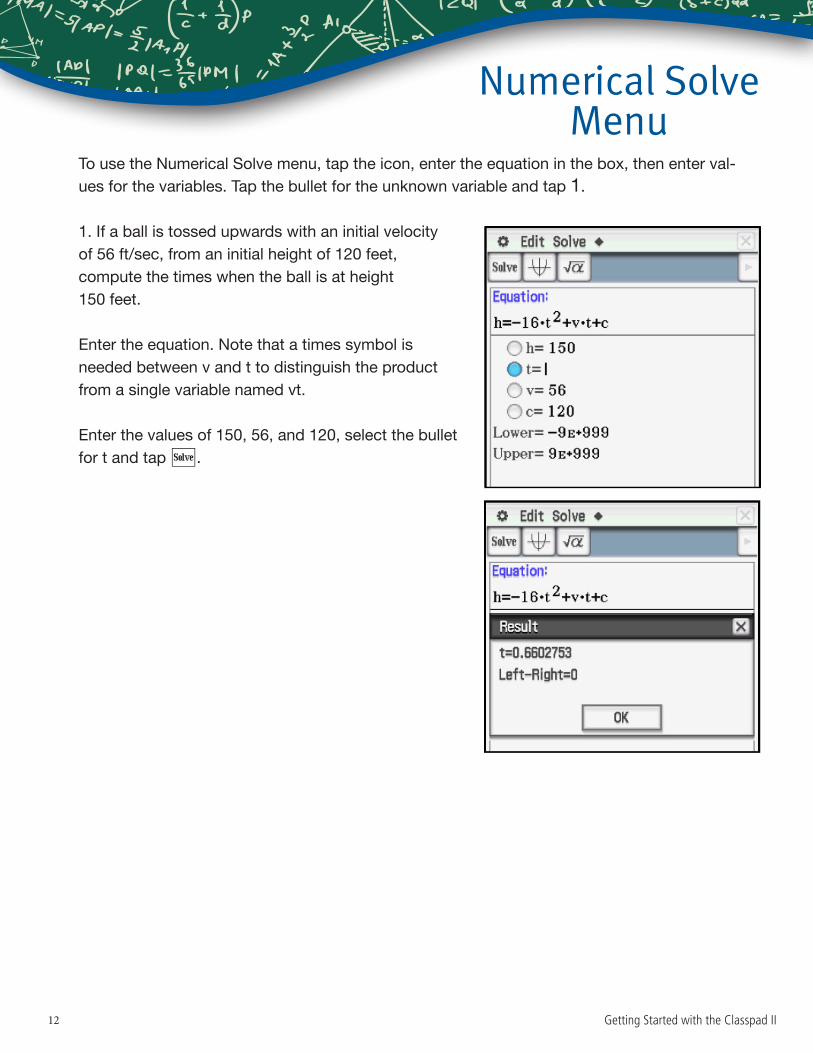
To use the Numerical Solve menu, tap the icon, enter the equation in the box, then enter val-ues for the variables. Tap the bullet for the unknown variable and tap 1.
1. If a ball is tossed upwards with an initial velocity of 56 ft/sec, from an initial height of 120 feet, compute the times when the ball is at height 150 feet.
Enter the equation. Note that a times symbol is needed between v and t to distinguish the product from a single variable named vt.
Enter the values of 150, 56, and 120, select the bullet for t and tap 1.
Getting Started with the Classpad II12
Numerical Solve Menu
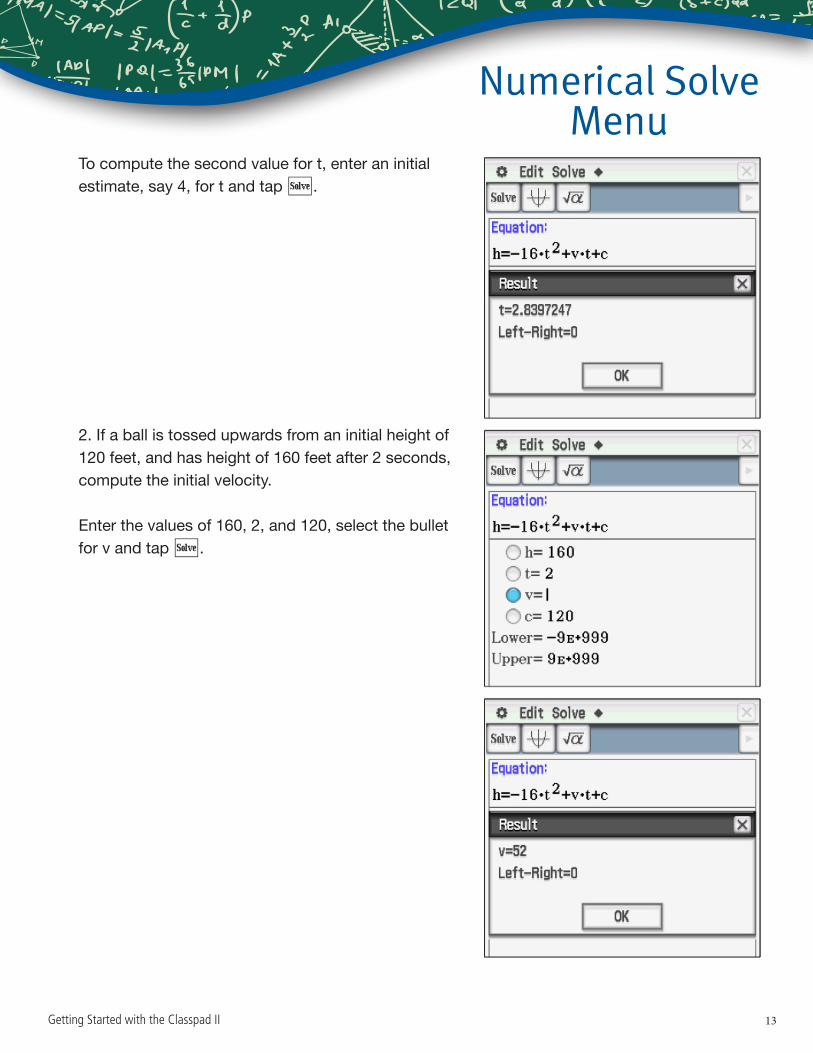
To compute the second value for t, enter an initial estimate, say 4, for t and tap 1.
2. If a ball is tossed upwards from an initial height of 120 feet, and has height of 160 feet after 2 seconds, compute the initial velocity.
Enter the values of 160, 2, and 120, select the bullet for v and tap 1.
Getting Started with the Classpad II 13
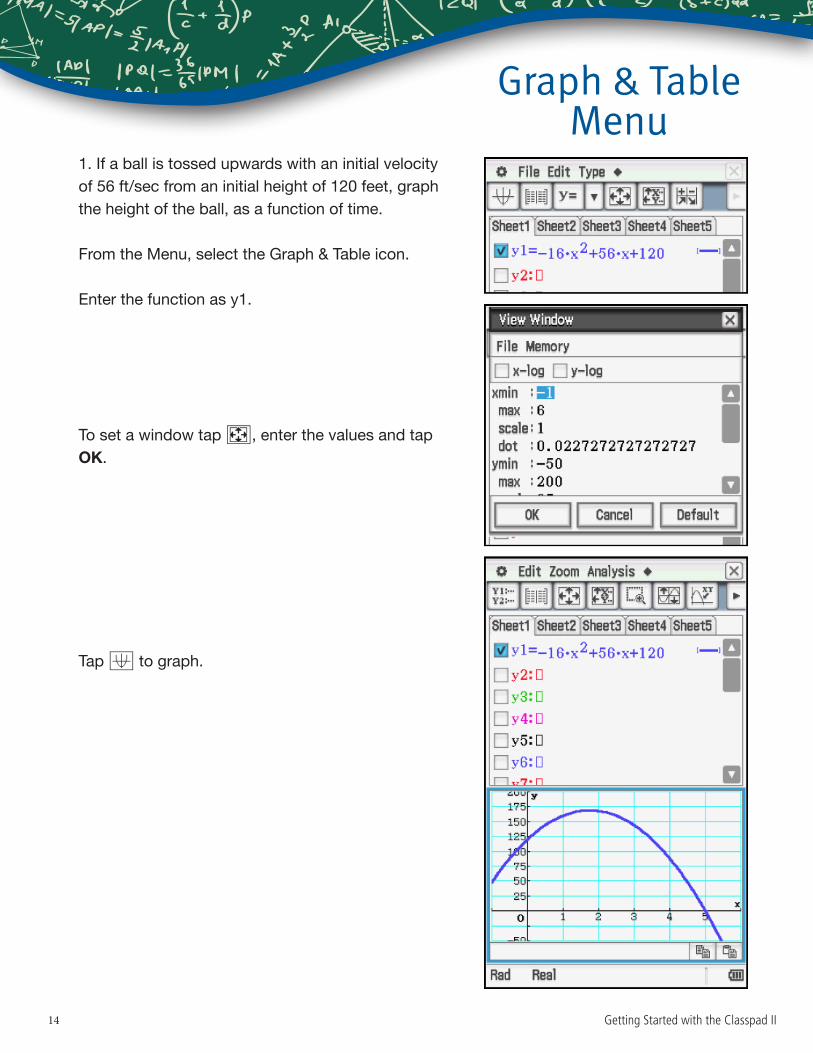
Graph & Table Menu
1. If a ball is tossed upwards with an initial velocity of 56 ft/sec from an initial height of 120 feet, graph the height of the ball, as a function of time.
From the Menu, select the Graph & Table icon.
Enter the function as y1.
To set a window tap 6, enter the values and tap OK.
Tap $ to graph.
Getting Started with the Classpad II14
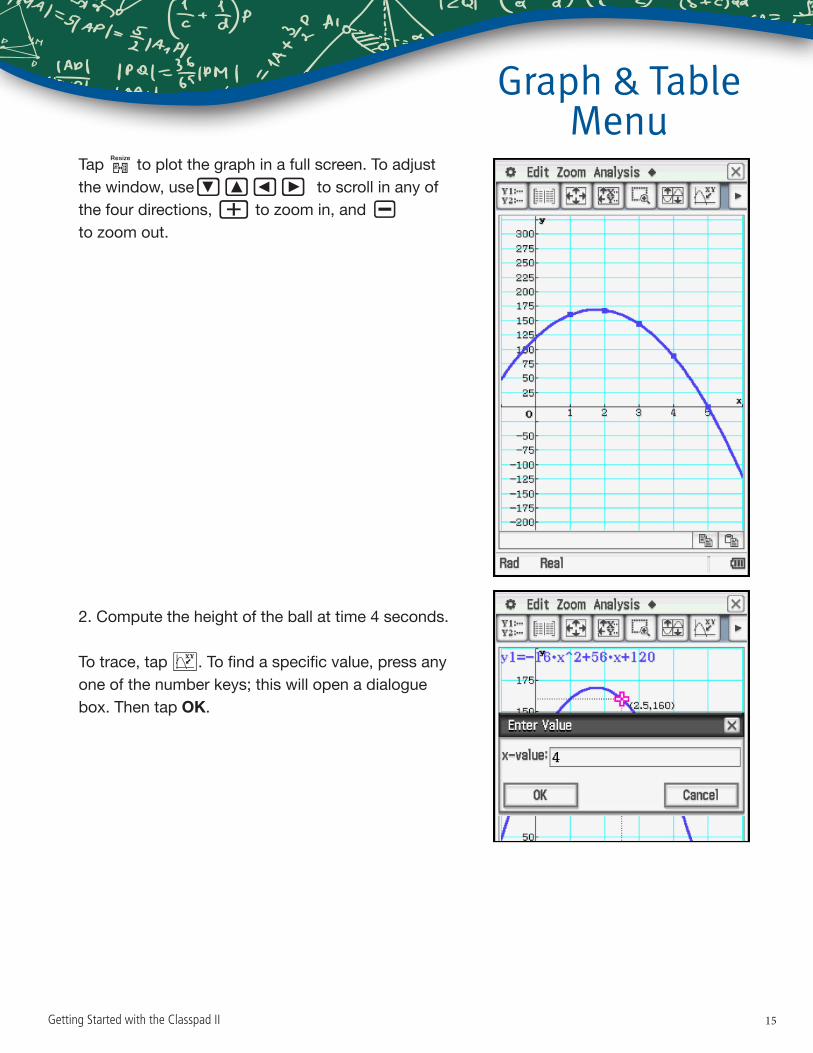
Graph & Table Menu
Tap r to plot the graph in a full screen. To adjust the window, use#"23 to scroll in any of the four directions, + to zoom in, and - to zoom out.
2. Compute the height of the ball at time 4 seconds.
To trace, tap =. To find a specific value, press any one of the number keys; this will open a dialogue box. Then tap OK.
Getting Started with the Classpad II 15
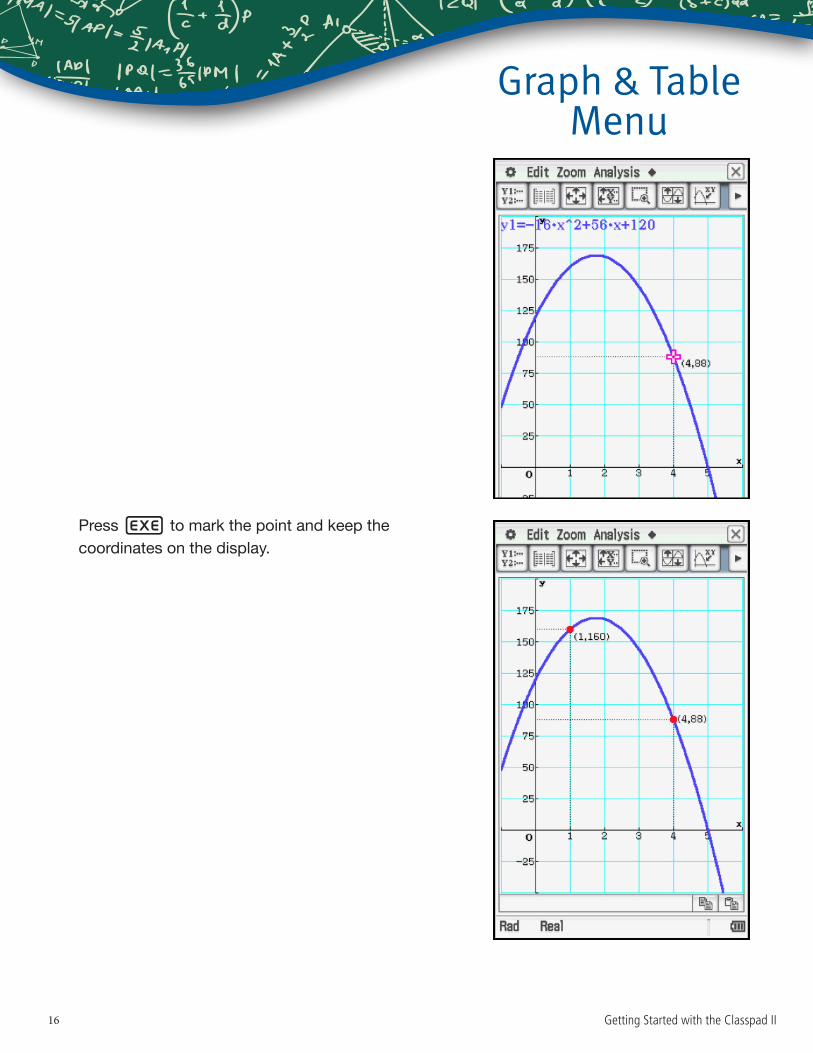
Graph & Table Menu
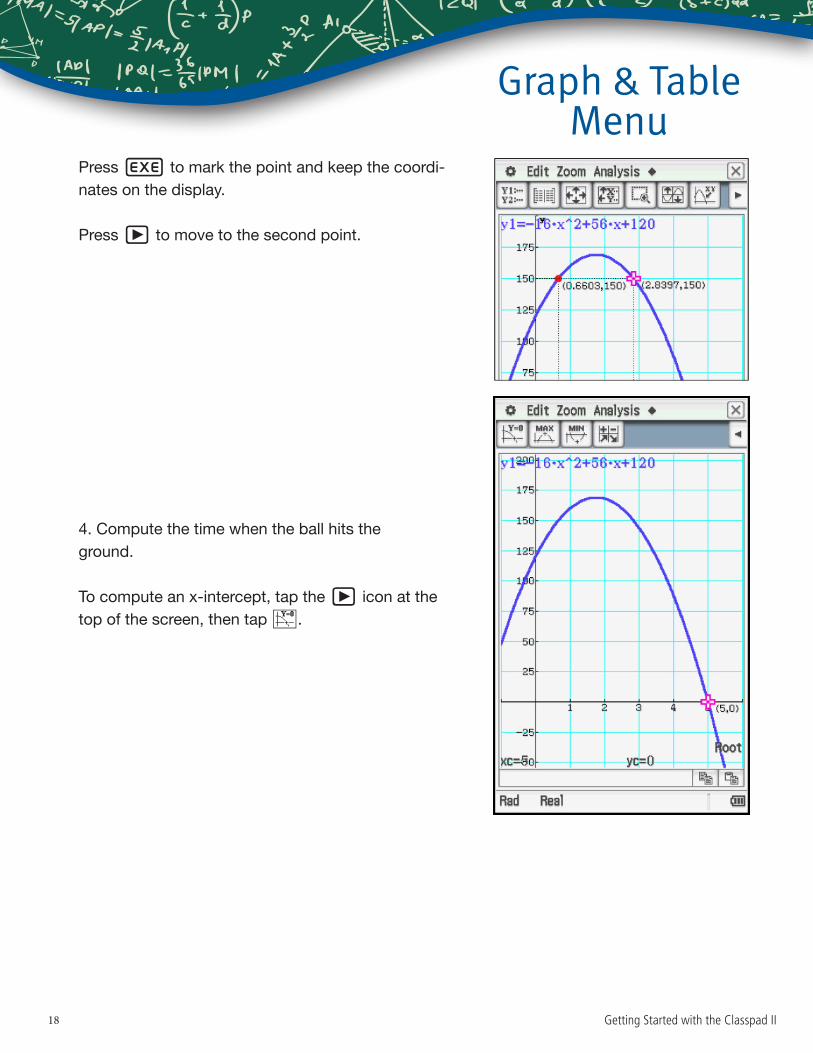
Press E to mark the point and keep the coordinates on the display.
Getting Started with the Classpad II16
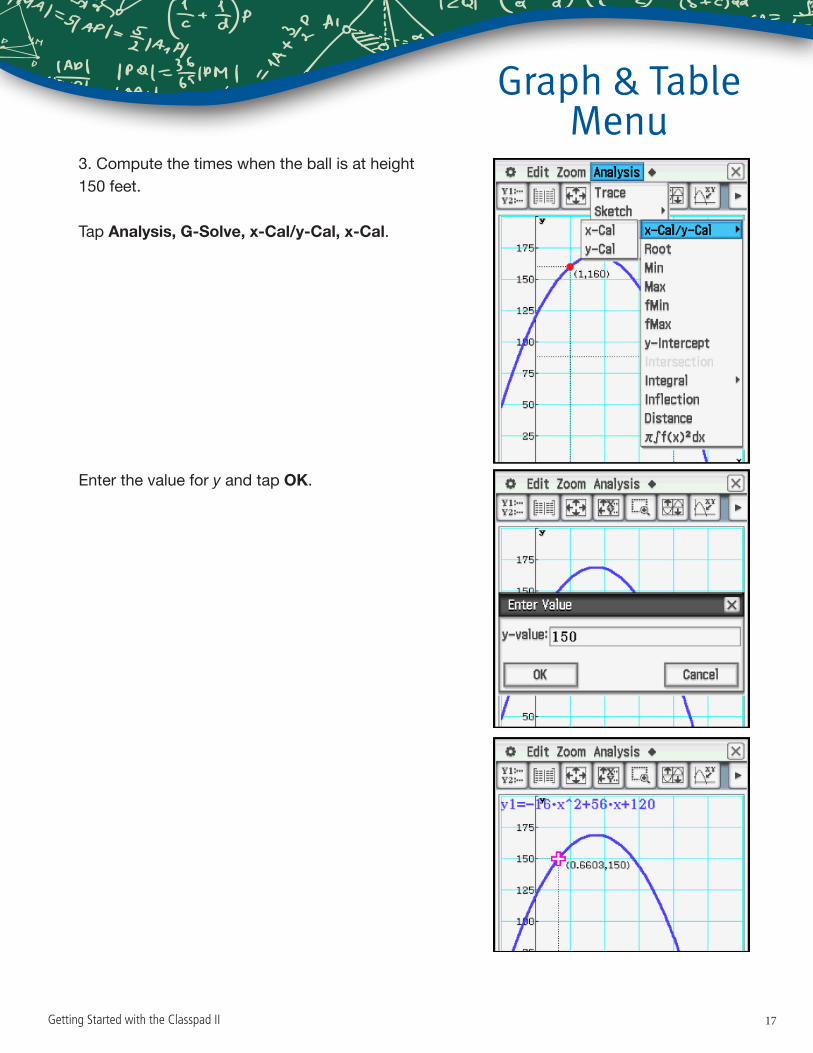
Graph & Table Menu
3. Compute the times when the ball is at height 150 feet.
Tap Analysis, G-Solve, x-Cal/y-Cal, x-Cal.
Enter the value for y and tap OK.
Getting Started with the Classpad II 17
Graph & Table Menu
Press E to mark the point and keep the coordi-nates on the display.
Press 3 to move to the second point.
4. Compute the time when the ball hits the ground.
To compute an x-intercept, tap the 3 icon at the top of the screen, then tap Y.
Getting Started with the Classpad II18
Graph & Table Menu
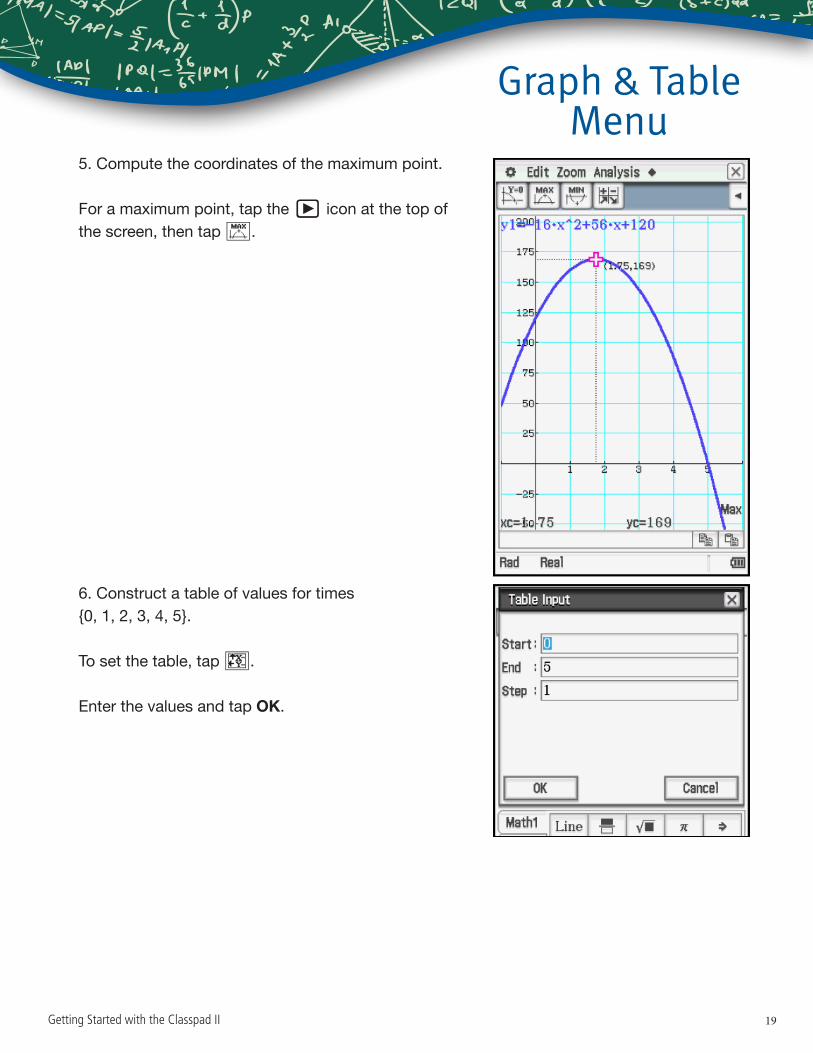
5. Compute the coordinates of the maximum point.
For a maximum point, tap the 3 icon at the top of the screen, then tap U.
6. Construct a table of values for times{0, 1, 2, 3, 4, 5}.
To set the table, tap 8.
Enter the values and tap OK.
Getting Started with the Classpad II 19
Graph & Table Menu
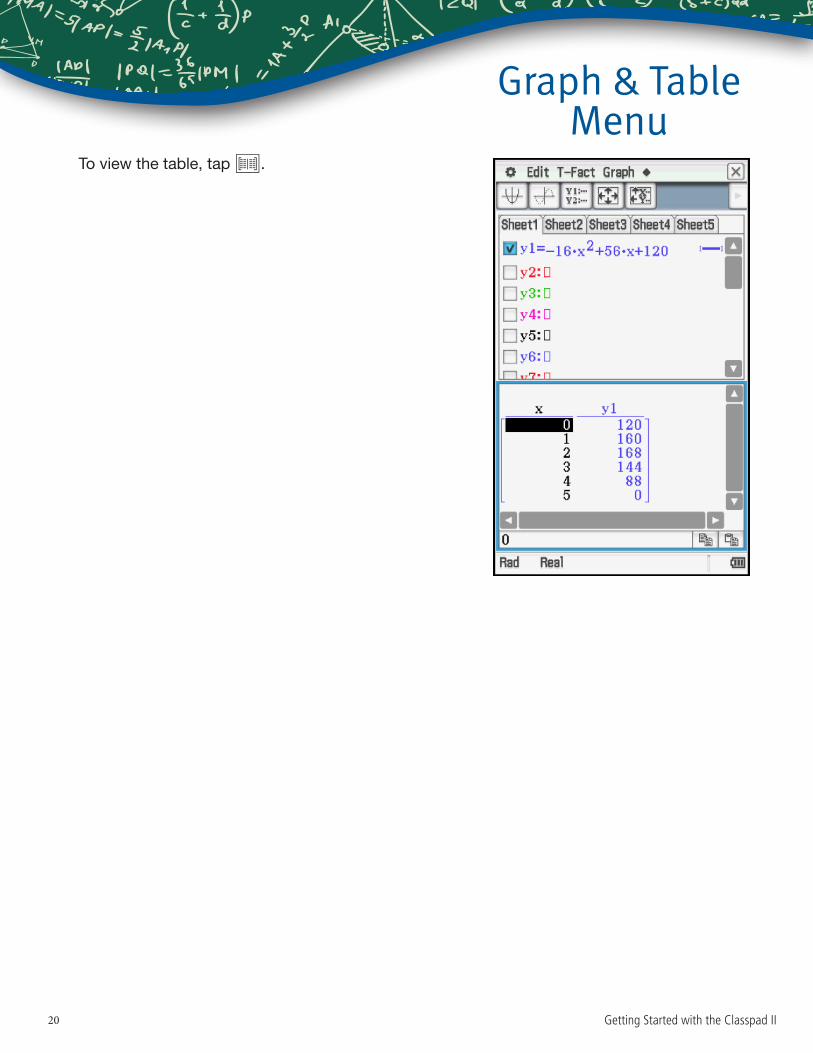
To view the table, tap #.
Getting Started with the Classpad II20
Graph & Table Menu
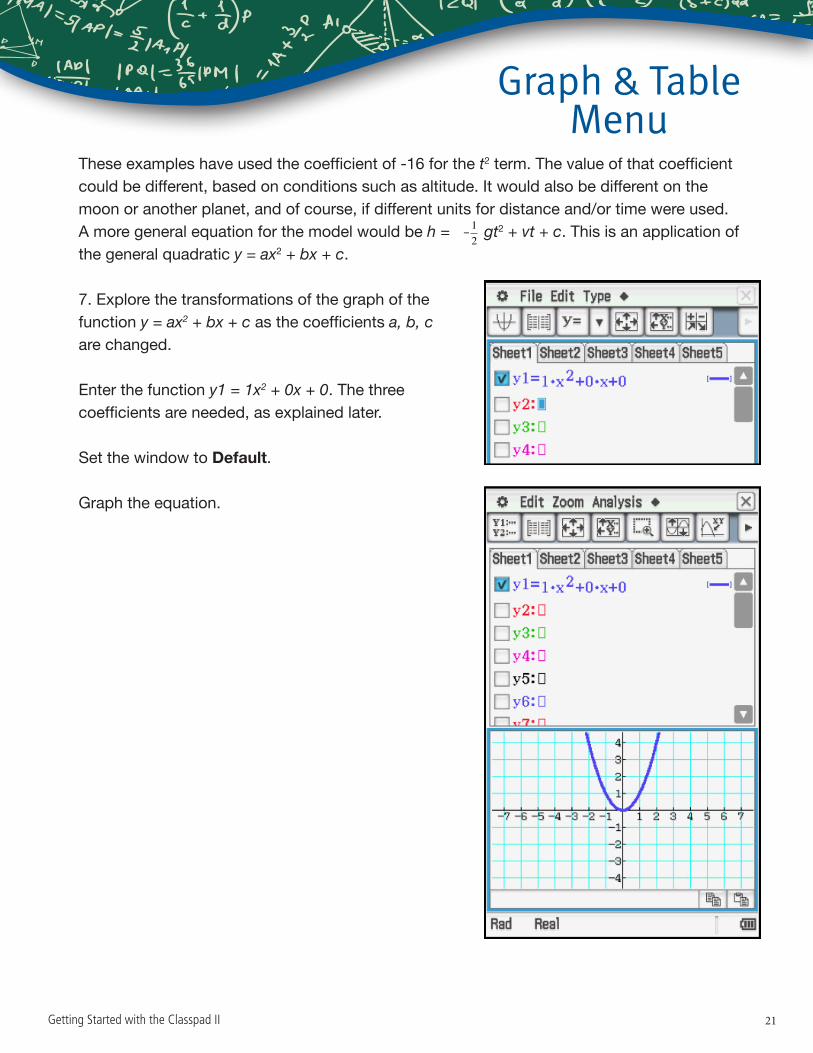
These examples have used the coefficient of -16 for the t2 term. The value of that coefficient could be different, based on conditions such as altitude. It would also be different on the moon or another planet, and of course, if different units for distance and/or time were used. A more general equation for the model would be h = −
12 gt2 + vt + c. This is an application of
the general quadratic y = ax2 + bx + c.
7. Explore the transformations of the graph of the function y = ax2 + bx + c as the coefficients a, b, c are changed.
Enter the function y1 = 1x2 + 0x + 0. The three coefficients are needed, as explained later.
Set the window to Default.
Graph the equation.
Getting Started with the Classpad II 21
Graph & Table Menu
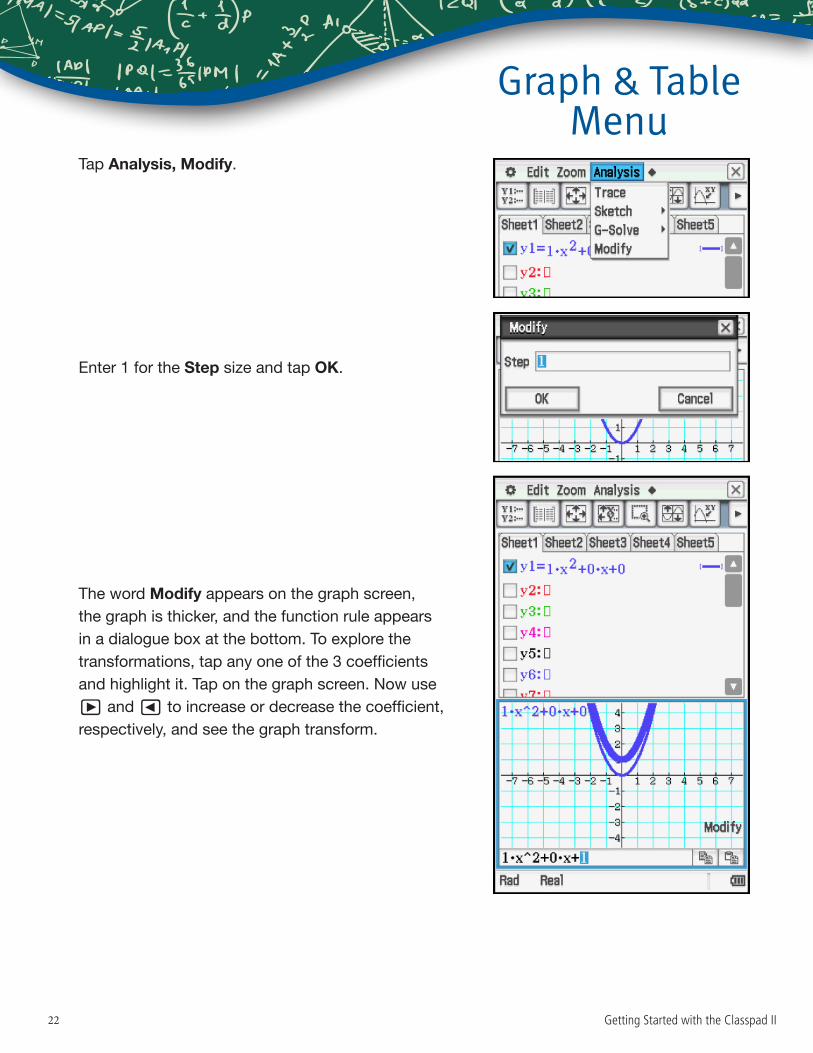
Tap Analysis, Modify.
Enter 1 for the Step size and tap OK.
The word Modify appears on the graph screen, the graph is thicker, and the function rule appears in a dialogue box at the bottom. To explore the transformations, tap any one of the 3 coefficients and highlight it. Tap on the graph screen. Now use 3 and 2 to increase or decrease the coefficient, respectively, and see the graph transform.
Getting Started with the Classpad II22
Graph & Table Menu
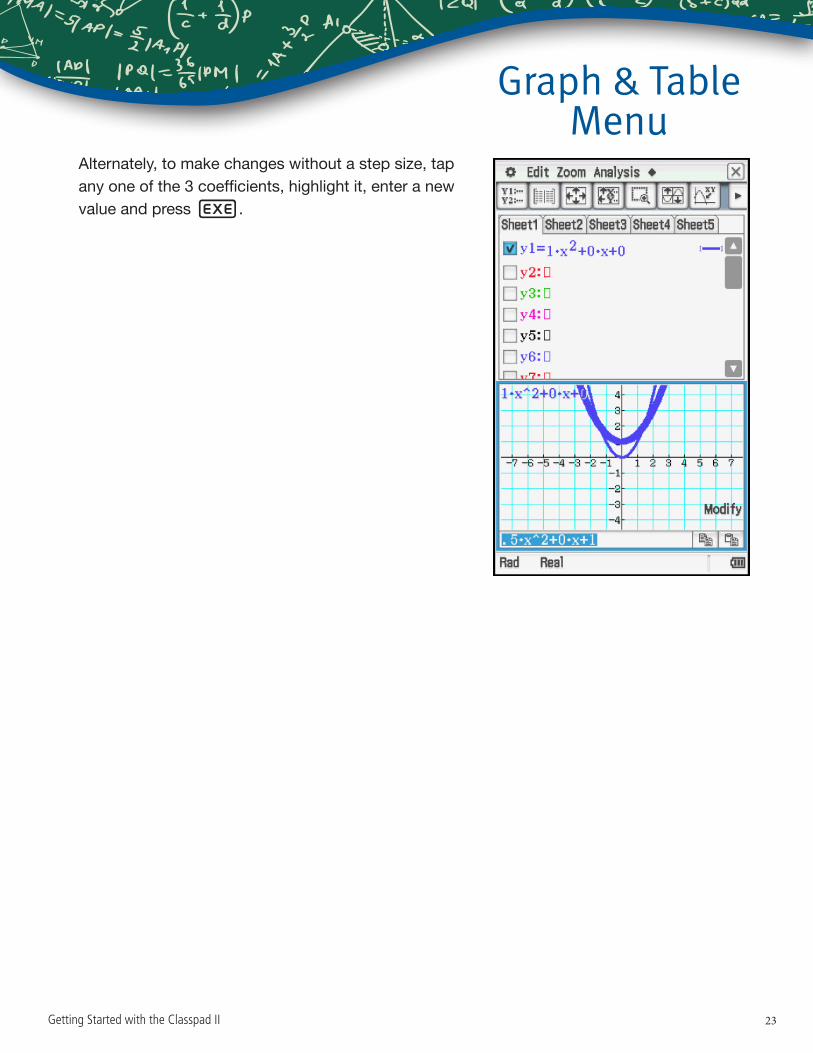
Alternately, to make changes without a step size, tap any one of the 3 coefficients, highlight it, enter a new value and press E.
Getting Started with the Classpad II 23
Conic Menu
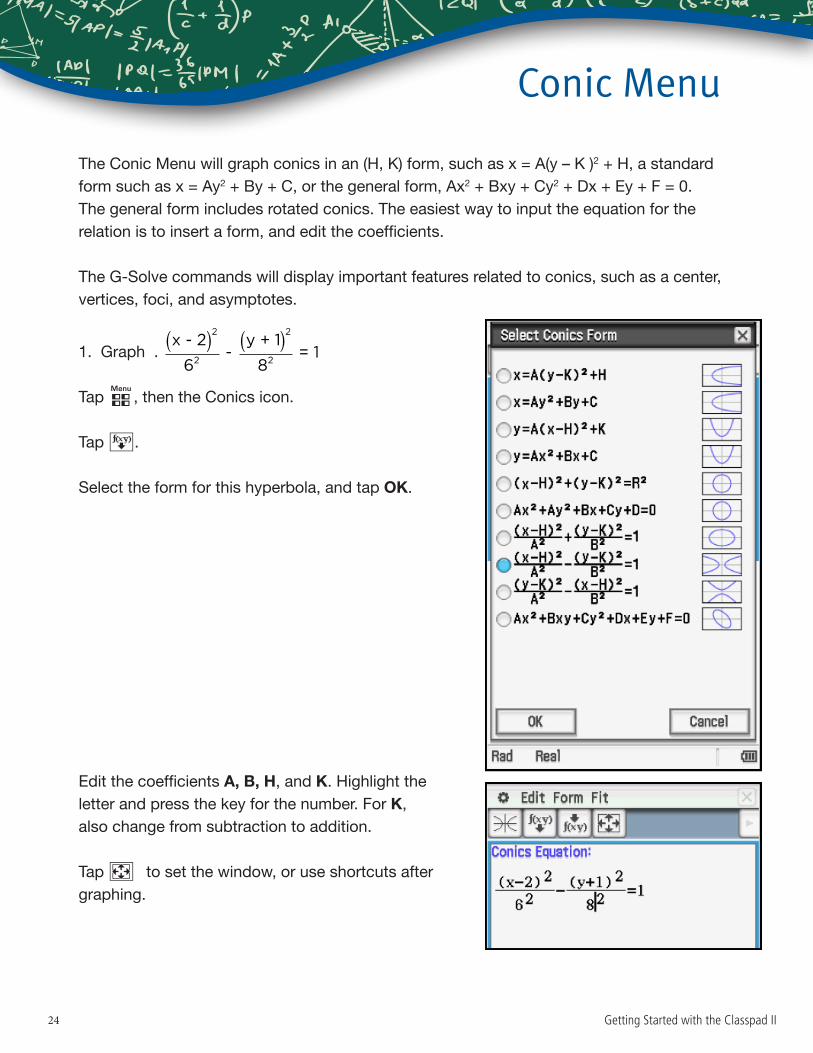
The Conic Menu will graph conics in an (H, K) form, such as x = A(y – K )2 + H, a standard form such as x = Ay2 + By + C, or the general form, Ax2 + Bxy + Cy2 + Dx + Ey + F = 0. The general form includes rotated conics. The easiest way to input the equation for the relation is to insert a form, and edit the coefficients.
The G-Solve commands will display important features related to conics, such as a center, vertices, foci, and asymptotes.
1. Graph .
Tap m, then the Conics icon.
Tap q.
Select the form for this hyperbola, and tap OK.
Edit the coefficients A, B, H, and K. Highlight the letter and press the key for the number. For K, also change from subtraction to addition.
Tap 6 to set the window, or use shortcuts after graphing.
Getting Started with the Classpad II24
Conic Menu
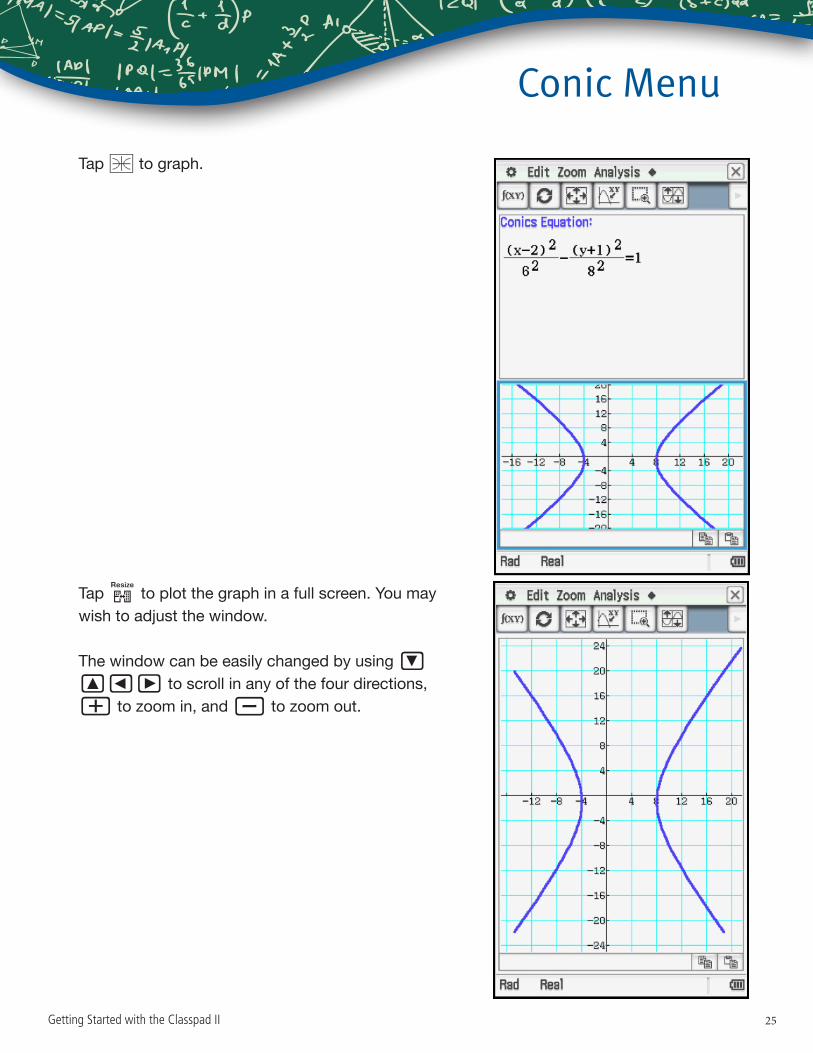
Tap ^ to graph.
Tap r to plot the graph in a full screen. You may wish to adjust the window.
The window can be easily changed by using # "23 to scroll in any of the four directions, + to zoom in, and - to zoom out.
Getting Started with the Classpad II 25
Conic Menu
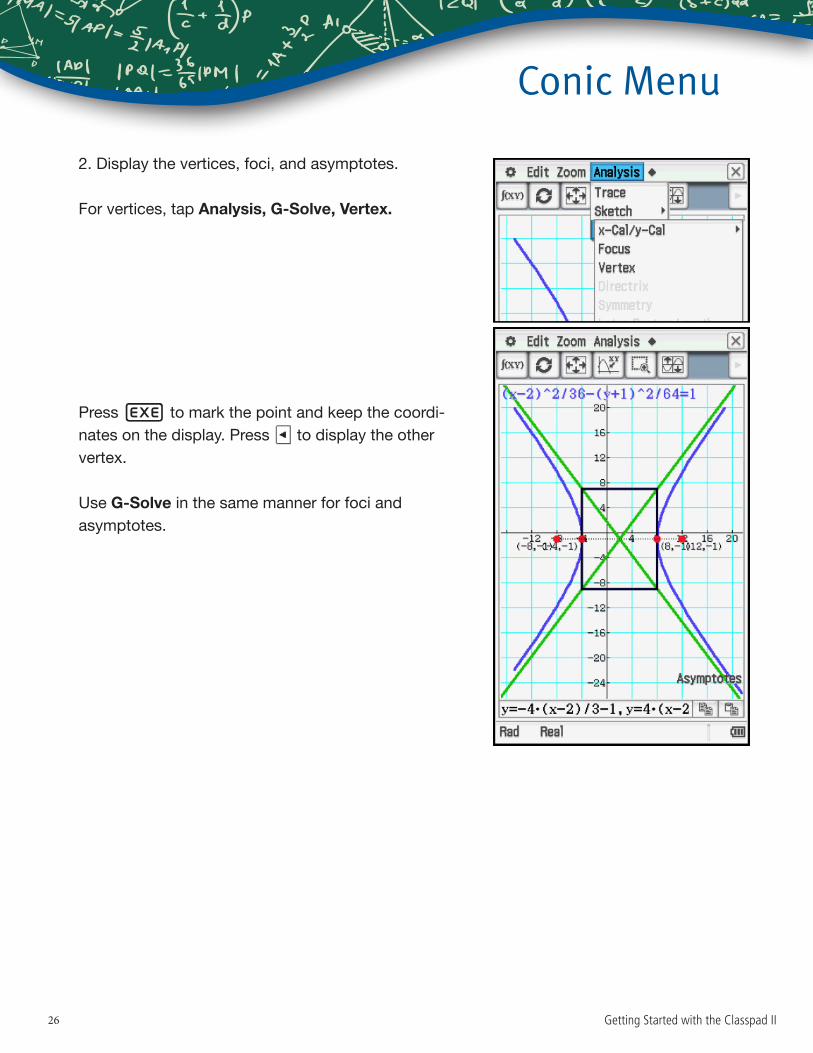
2. Display the vertices, foci, and asymptotes.
For vertices, tap Analysis, G-Solve, Vertex.
Press E to mark the point and keep the coordi-nates on the display. Press w to display the other vertex.
Use G-Solve in the same manner for foci and asymptotes.
Getting Started with the Classpad II26
Conic Menu
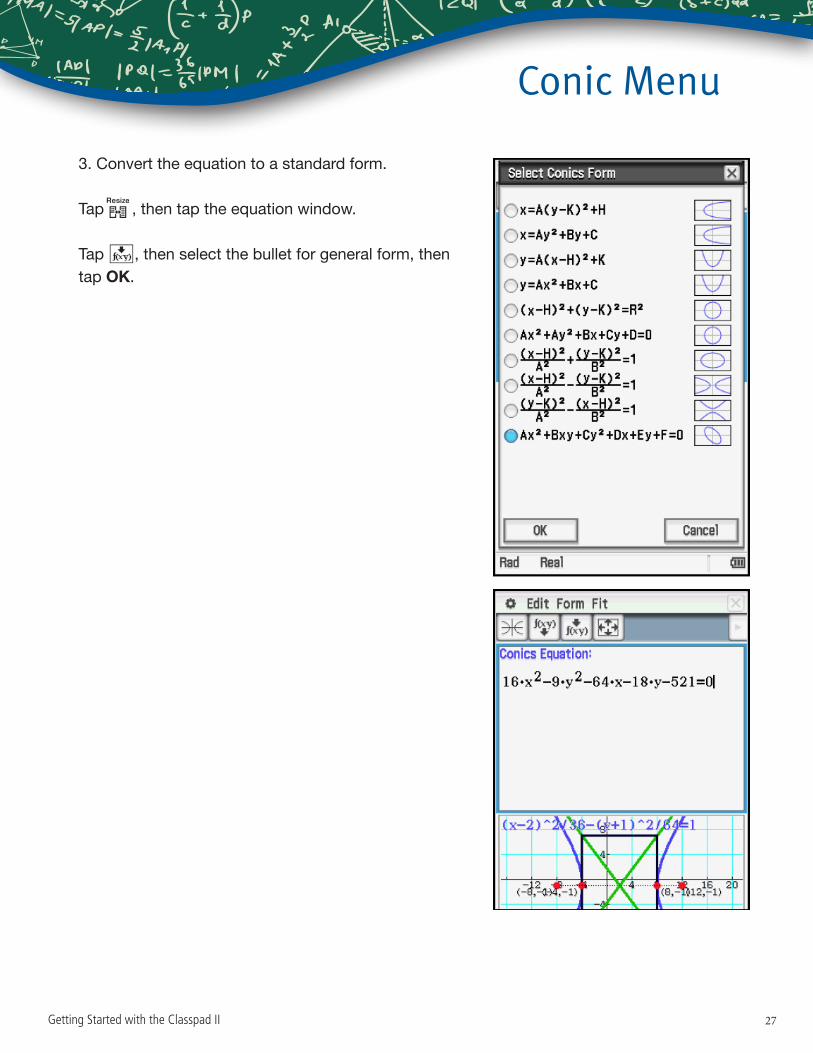
3. Convert the equation to a standard form.
Tapr, then tap the equation window.
Tap w, then select the bullet for general form, then tap OK.
Getting Started with the Classpad II 27
Conic Menu
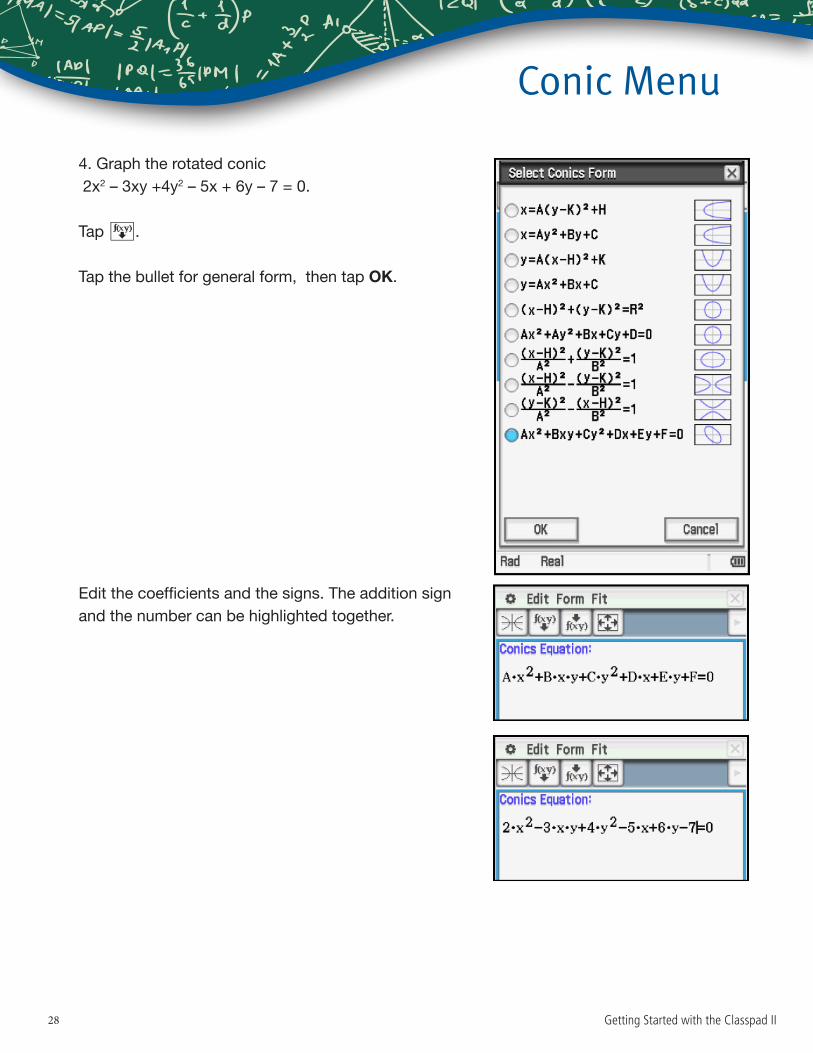
4. Graph the rotated conic 2x2 – 3xy +4y2 – 5x + 6y – 7 = 0.
Tap q.
Tap the bullet for general form, then tap OK.
Edit the coefficients and the signs. The addition sign and the number can be highlighted together.
Getting Started with the Classpad II28
Conic Menu
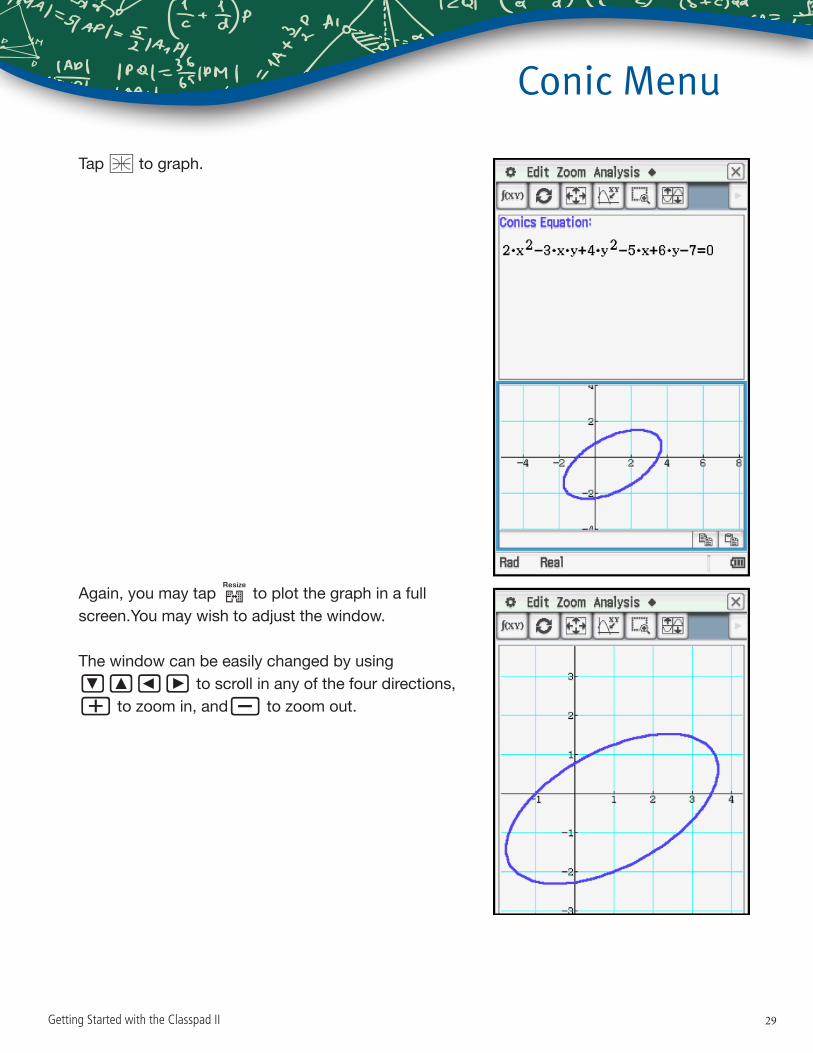
Tap ^ to graph.
Again, you may tap r to plot the graph in a full screen.You may wish to adjust the window.
The window can be easily changed by using #"23 to scroll in any of the four directions, + to zoom in, and- to zoom out.
Getting Started with the Classpad II 29
Conic Menu
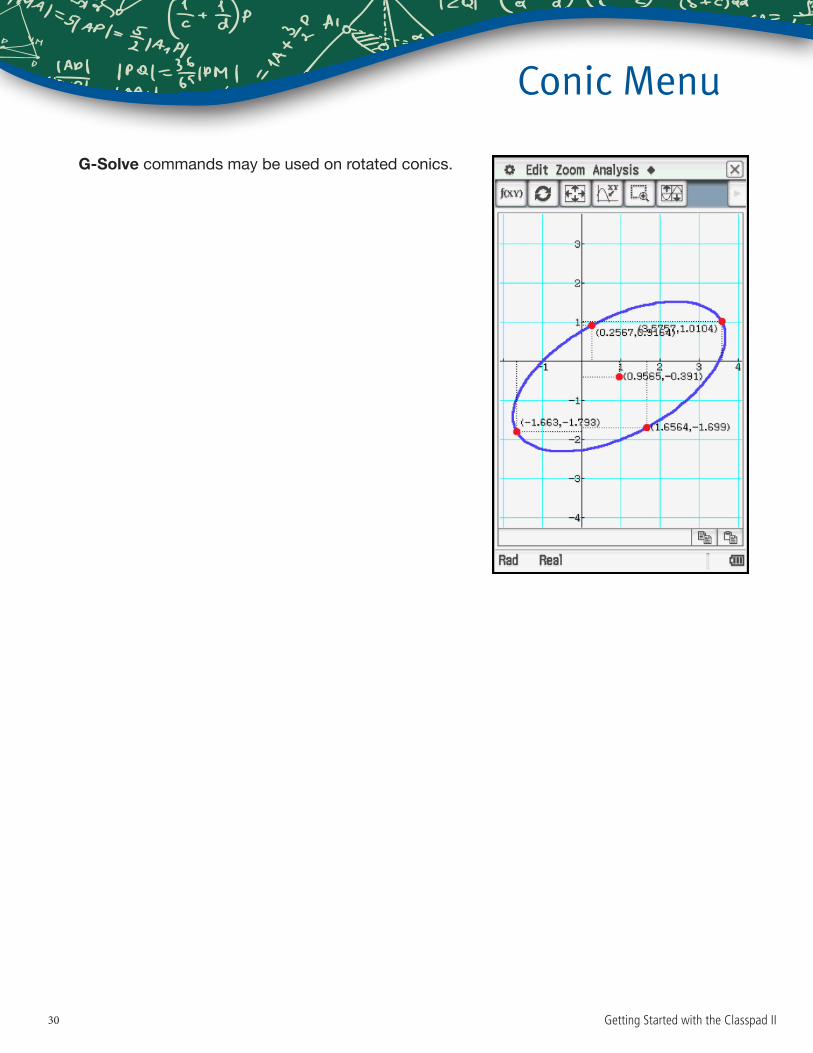
G-Solve commands may be used on rotated conics.
Getting Started with the Classpad II30
Statistics Menu
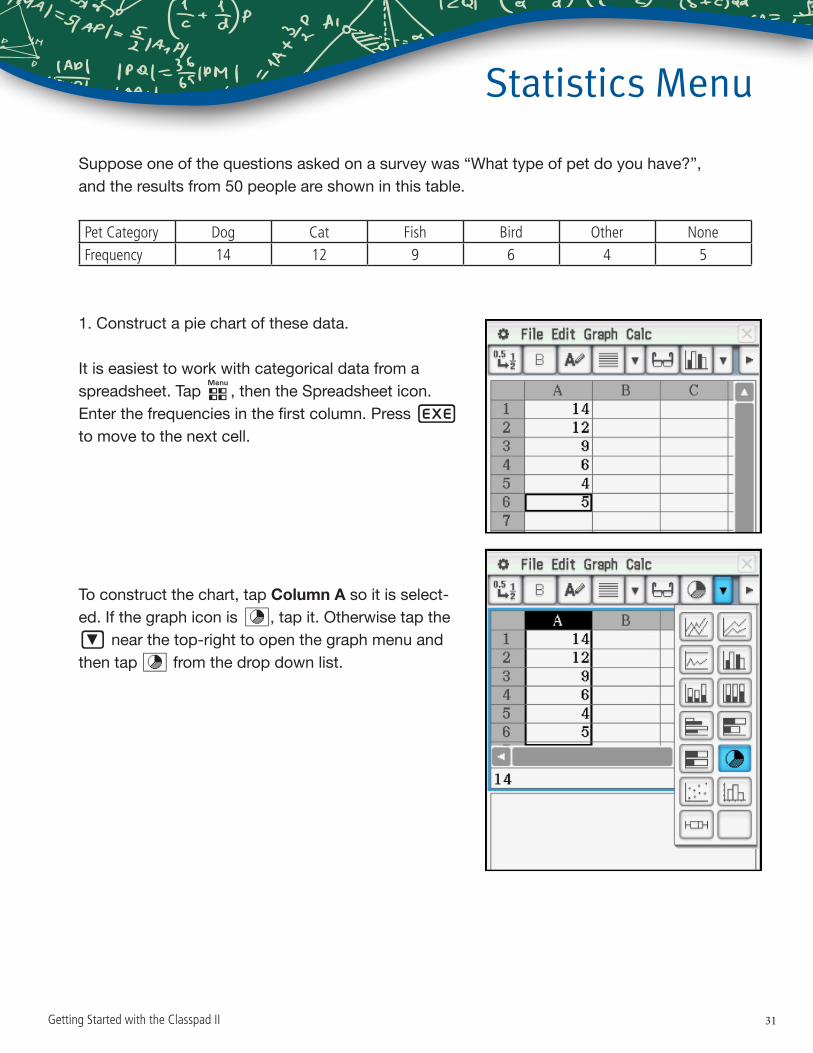
Suppose one of the questions asked on a survey was “What type of pet do you have?”, and the results from 50 people are shown in this table.
Pet Category Dog Cat Fish Bird Other NoneFrequency 14 12 9 6 4 5
1. Construct a pie chart of these data.
It is easiest to work with categorical data from a spreadsheet. Tap m, then the Spreadsheet icon. Enter the frequencies in the first column. Press E to move to the next cell.
To construct the chart, tap Column A so it is select-ed. If the graph icon is Z, tap it. Otherwise tap the # near the top-right to open the graph menu and then tap Z from the drop down list.
Getting Started with the Classpad II 31
Statistics Menu
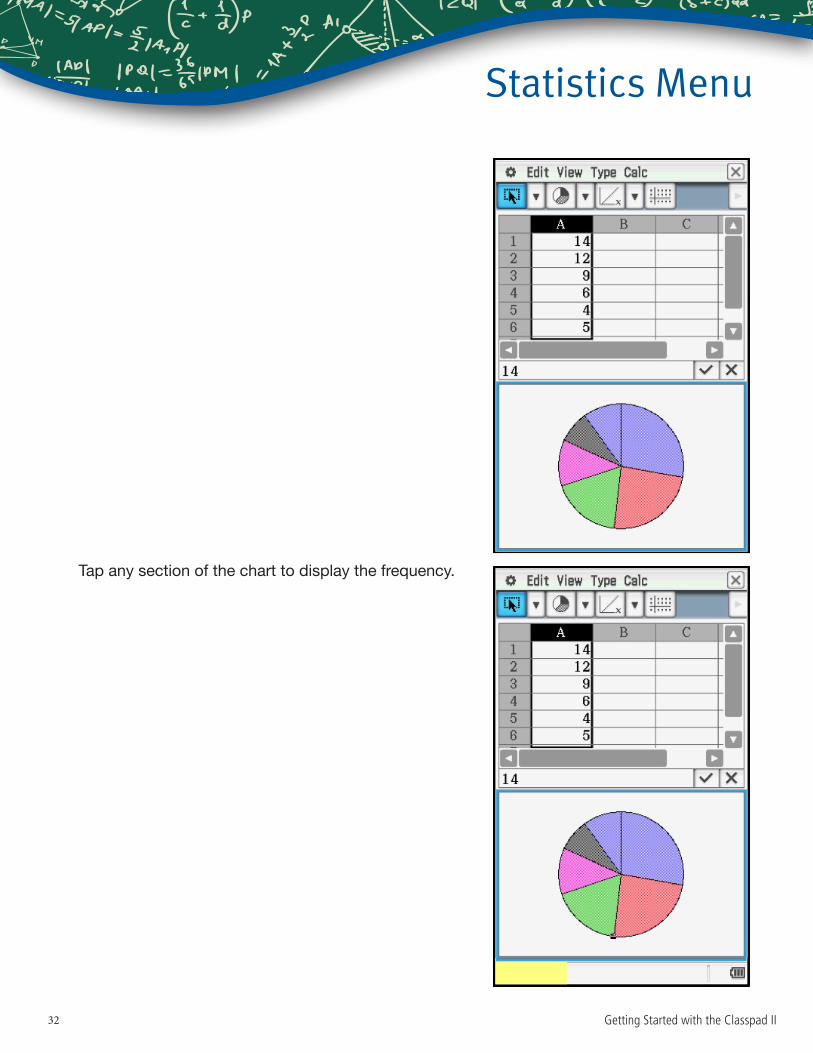
Tap any section of the chart to display the frequency.
Getting Started with the Classpad II32
Statistics Menu
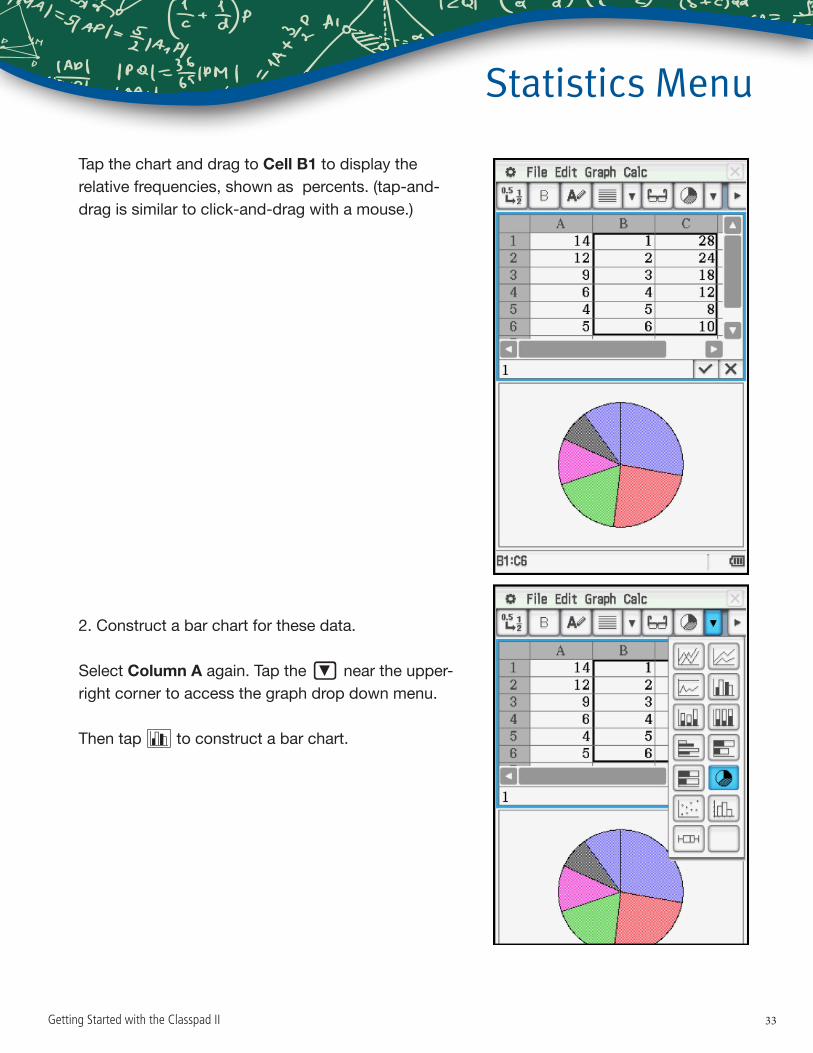
Tap the chart and drag to Cell B1 to display the relative frequencies, shown as percents. (tap-and-drag is similar to click-and-drag with a mouse.)
2. Construct a bar chart for these data.
Select Column A again. Tap the # near the upper-right corner to access the graph drop down menu.
Then tap H to construct a bar chart.
Getting Started with the Classpad II 33
Statistics Menu
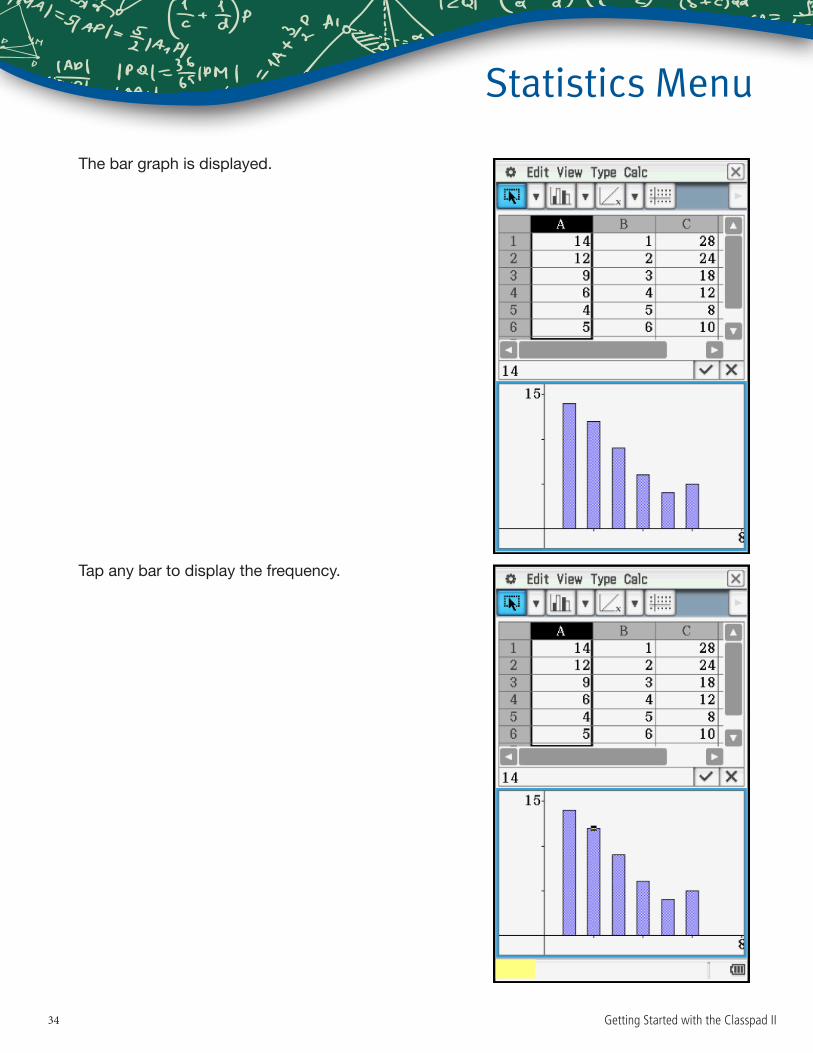
The bar graph is displayed.
Tap any bar to display the frequency.
Getting Started with the Classpad II34
Statistics Menu
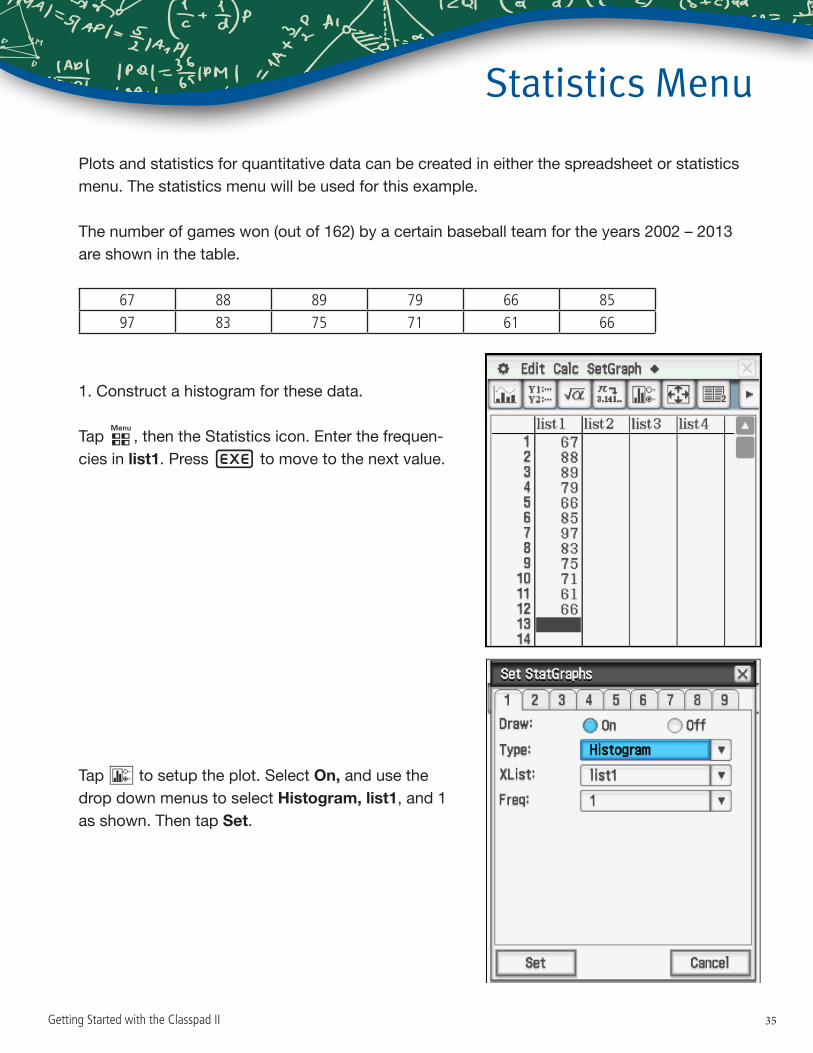
Plots and statistics for quantitative data can be created in either the spreadsheet or statistics menu. The statistics menu will be used for this example.
The number of games won (out of 162) by a certain baseball team for the years 2002 – 2013 are shown in the table.
67 88 89 79 66 8597 83 75 71 61 66
1. Construct a histogram for these data.
Tap m, then the Statistics icon. Enter the frequen-cies in list1. Press E to move to the next value.
Tap G to setup the plot. Select On, and use the drop down menus to select Histogram, list1, and 1 as shown. Then tap Set.
Getting Started with the Classpad II 35
Statistics Menu
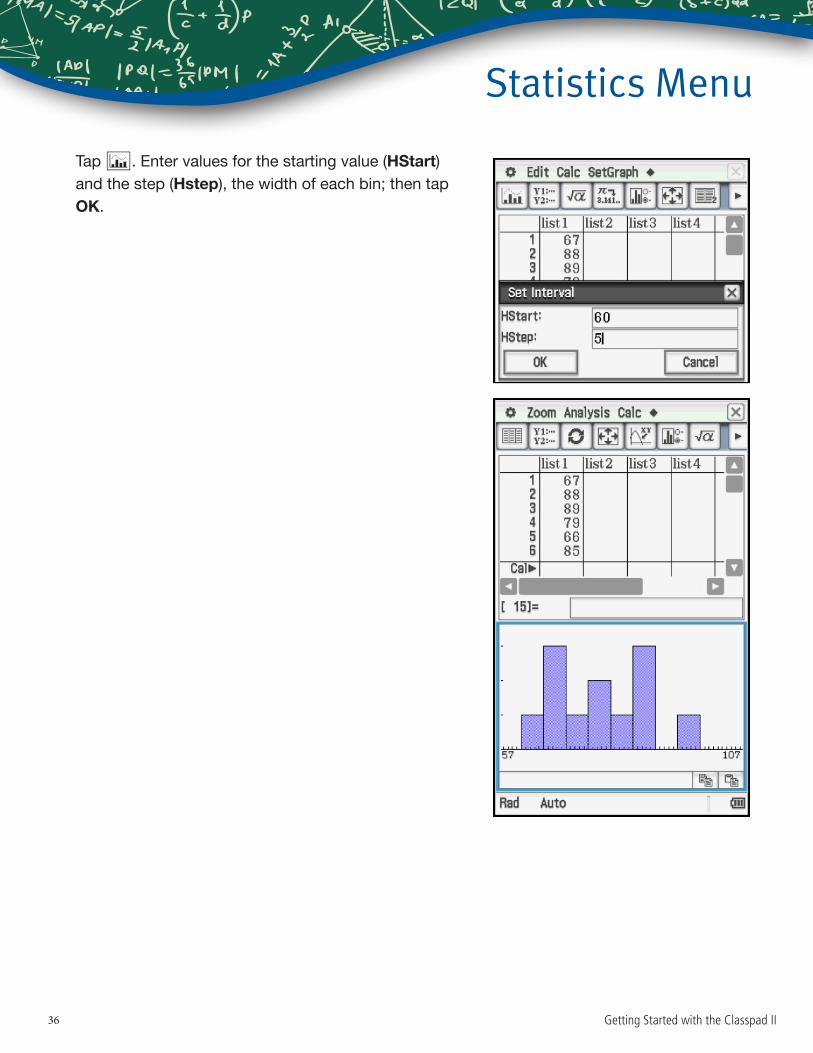
Tap y. Enter values for the starting value (HStart) and the step (Hstep), the width of each bin; then tap OK.
Getting Started with the Classpad II36

Statistics Menu
Tap Analysis, Trace to display the frequencies, using the directional pad to move through the data values.
Getting Started with the Classpad II 37
Statistics Menu
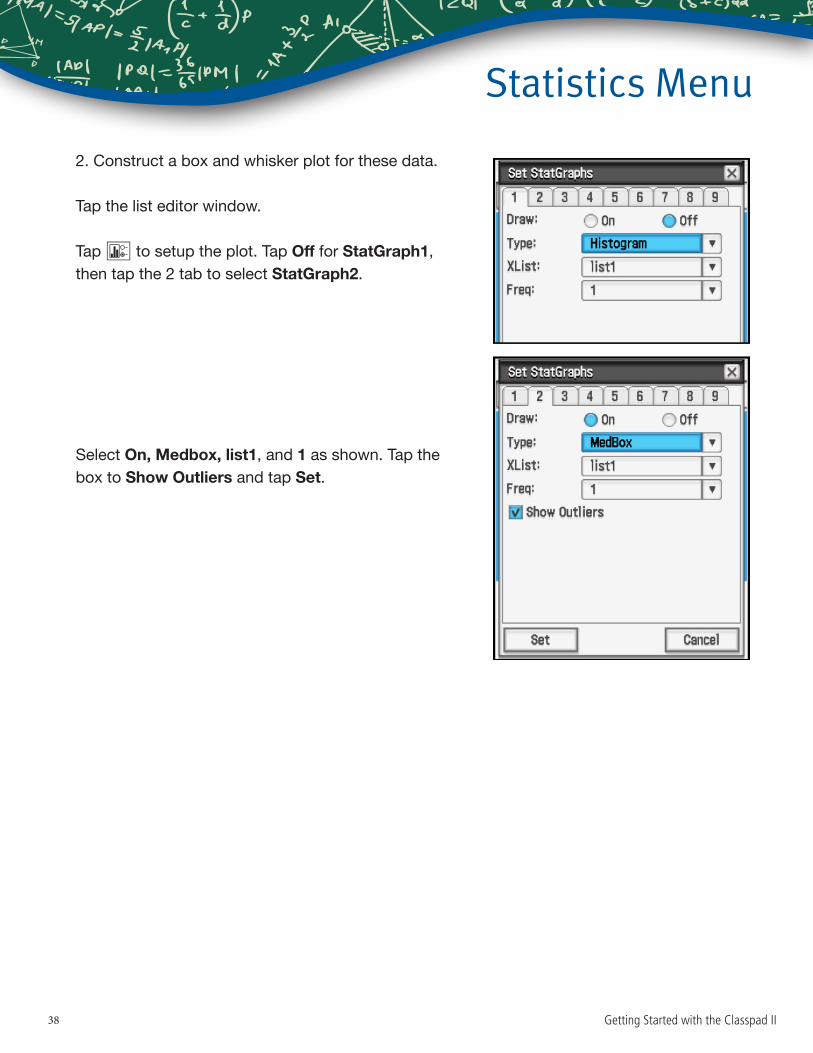
2. Construct a box and whisker plot for these data.
Tap the list editor window.
Tap G to setup the plot. Tap Off for StatGraph1, then tap the 2 tab to select StatGraph2.
Select On, Medbox, list1, and 1 as shown. Tap the box to Show Outliers and tap Set.
Getting Started with the Classpad II38
Statistics Menu
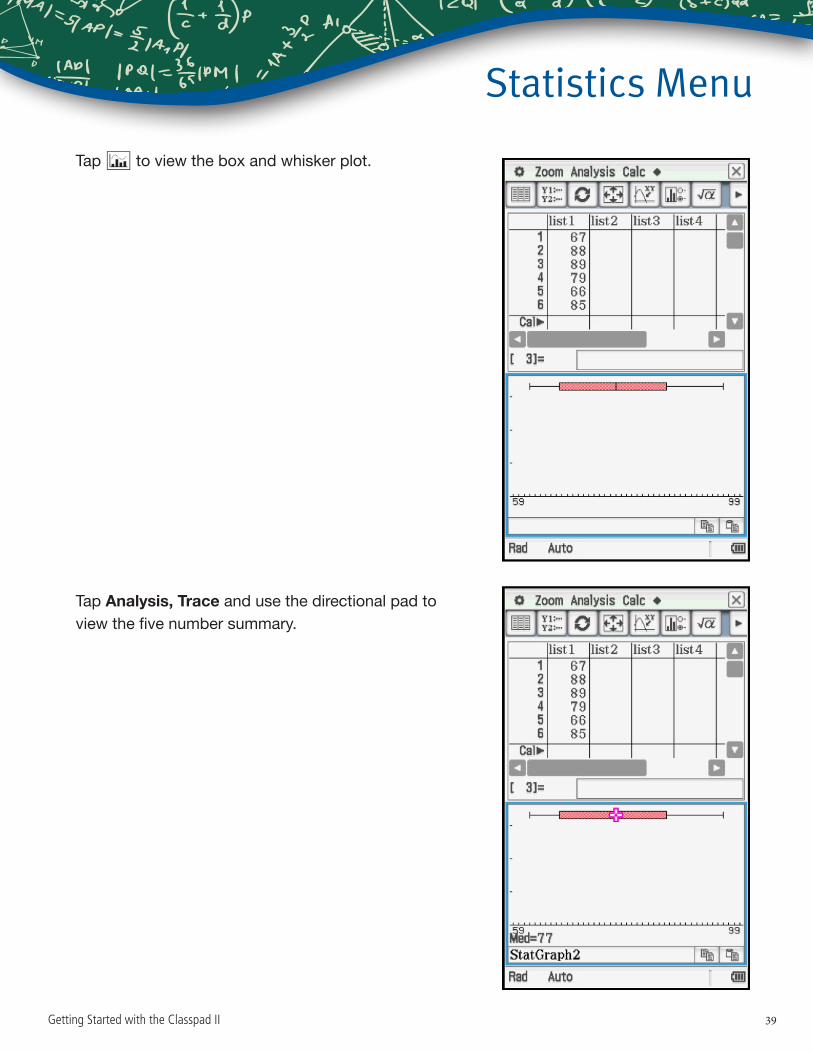
Tap y to view the box and whisker plot.
Tap Analysis, Trace and use the directional pad to view the five number summary.
Getting Started with the Classpad II 39
Statistics Menu
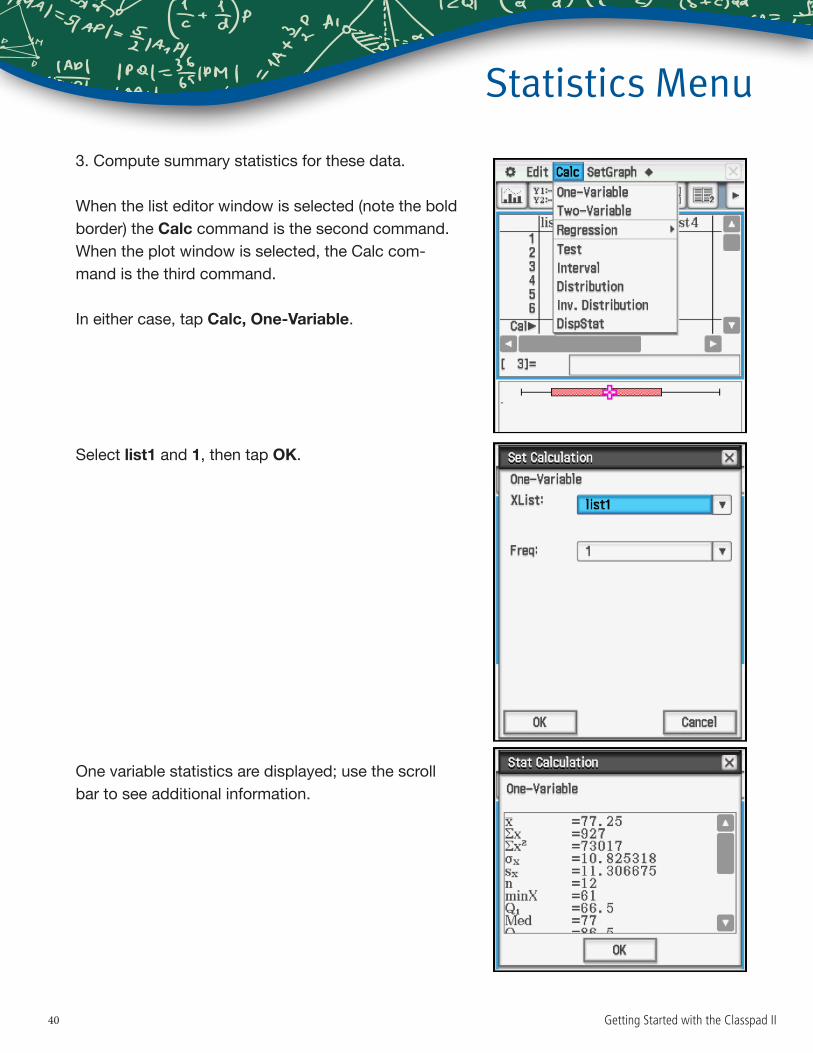
3. Compute summary statistics for these data.
When the list editor window is selected (note the bold border) the Calc command is the second command. When the plot window is selected, the Calc com-mand is the third command.
In either case, tap Calc, One-Variable.
Select list1 and 1, then tap OK.
One variable statistics are displayed; use the scroll bar to see additional information.
Getting Started with the Classpad II40

Notes
Getting Started with the Classpad II 41

Notes
Getting Started with the Classpad II42

Notes
Getting Started with the Classpad II 43

See the complete line of Casio calculators www.casioeducation.com
Getting Started with the ClasspadII CCL3/14