Embed Size (px)
Citation preview

1 | P a g e
Water Quality Model, Tool, and Calculator Basics
Reference Guide
April 2019

2 | P a g e
Contents Document Purpose ........................................................................................................................................ 4
Watershed Model Summary ......................................................................................................................... 4
Watershed Scale Models - Frequently Used: ............................................................................................ 4
HSPF (EPA/USGS/MPCA): ...................................................................................................................... 4
SWAT (USDA) – Soil and Water Assessment Tool: ................................................................................. 4
GSSHA (CORP) - Gridded Surface Subsurface Hydrologic Analysis (GSSHA): ......................................... 4
Zonation (University of Helsinki): .......................................................................................................... 5
SWMM (EPA): ........................................................................................................................................ 5
XP-SWMM (FEMA): ............................................................................................................................... 6
P-8 (W. Walker/MPCA/DNR): ................................................................................................................ 6
WinSLAMM (USGS): ............................................................................................................................... 6
Watershed Scale Models - Additional Models: .......................................................................................... 7
SPARROW- Spatially Referenced Regression on Watershed Attributes (USGS): ................................... 7
QUAL2K (Tufts University/EPA): ............................................................................................................ 7
BASINS (USDA): ...................................................................................................................................... 8
AGNPS, CONCEPTS (USDA): ................................................................................................................... 8
ADAPT and GLEAMS (USDA): ................................................................................................................. 9
BATHTUB (CORPS) and MINLEAP (MPCA): ............................................................................................ 9
APEX and EPIC (USDA):........................................................................................................................ 10
Hydraulic and Hydrologic Watershed Based Models.............................................................................. 10
GIS Based Tools and Interfaces – Frequently Used ................................................................................. 10
ACPF (USDA-ARS/ISU): ......................................................................................................................... 10
PTMApp (BWSR): ................................................................................................................................. 11
HSPF-SAM (MPCA): .............................................................................................................................. 11
WHAF (MN DNR): ................................................................................................................................ 12
GIS Based Tools and Interfaces – Additional Tools: ................................................................................. 12
GIS Based Terrain Analysis: .................................................................................................................. 12
Nutrient Tracking Tool (USDA-OEM) ................................................................................................... 13
Calculators and Estimators – Frequently Used: ....................................................................................... 13
BWSR Estimators (BWSR): ................................................................................................................... 13

3 | P a g e
MinnFARM (U of M): ........................................................................................................................... 13
MIDS (MPCA): ...................................................................................................................................... 14
MPCA Simple Method Estimator (MPCA): ........................................................................................... 15
SSIE - Septic System Improvement Estimator (U of M/MPCA): ........................................................... 15
RUSLE2 (USDA-ARS): ............................................................................................................................ 15
NBMP, PBMP, and NP-BMP (U of M/MPCA) – Watershed Nitrogen and Phosphorus BMP Assessment Tools .................................................................................................................................................... 17
Calculators and Estimators – Additional Calculators: .............................................................................. 17
WEPP (USDA-ARS) – Water Erosion Prediction Project ....................................................................... 17
WEPS (USDA-ARS): Wind Erosion Prediction System .......................................................................... 18
TR-20 (USDA): ...................................................................................................................................... 18
TR-55 (USDA): ...................................................................................................................................... 19
Minnesota Phosphorus (P) Index (U of M): ......................................................................................... 19
Rational Method (LMNO Engineering): ............................................................................................... 19
STEPL (US EPA): ................................................................................................................................... 20
General Water Quality Modeling Video Presentations: ............................................................................. 20
Appendix A: List of Acronyms ..................................................................................................................... 21

4 | P a g e
Document Purpose The purpose of this document is to provide a general understanding of how different water quality models, tools, and estimators work and when they are used. Information contained in this document has been sourced from Federal and State Government, Universities, private consulting firms, and watershed based organization websites. I would like to acknowledge Dave Johnson, formerly with BWSR; Dave Wall, MPCA; and Dr. Heidi Peterson, formerly with MDA, for providing a number of the summary descriptions for this background document. Additionally, other summaries were derived from the MN Stormwater Manual website at: http://stormwater.pca.state.mn.us/index.php/Available_stormwater_models_and_selecting_a_model .
Watershed Model Summary Watershed Scale Models - Frequently Used: HSPF (EPA/USGS/MPCA): The Hydrologic Simulation Program – Fortran (HSPF) is a watershed scale, lumped-parameter, process-based model for quantifying runoff and addressing water quality impairments associated with combined point and nonpoint sources. In an effort to support the development and implementation of total maximum daily load (TMDL) reports across the state and support watershed programmatic activities, the MPCA has invested in statewide expansion of the HSPF model at the major watershed scale. Load reductions established in the WRAPS use HSPF, and can be used in the One Watershed, One Plan planning process to set goals. Model results from HSPF, such as pollutant-loading maps, can be used in prioritizing, likely using geographic information system (GIS) analysis. HSPF is not capable of site-specific targeting.
Websites:
• Aqua Terra/RESPEC: http://www.aquaterra.com/resources/hspfsupport/index.php • USGS: https://water.usgs.gov/software/HSPF/ • US EPA: https://www.epa.gov/exposure-assessment-models/hspf
SWAT (USDA) – Soil and Water Assessment Tool: The Soil and Water Assessment Tool (SWAT) is a process-based, watershed-scale model with an agronomic focus, primarily used to predict and evaluate the effect of long-term land cover and land management practices on the quantity and quality of water that is exported from a watershed. This model can estimate the amount of water that contributes to stream flow and the relative sediment, nutrient, and pesticide losses under different agricultural field conditions and management scenarios. Output from this model can be used to identify critical portions of the landscape that may disproportionately contribute sediment or nutrients to waterways, which is essential for the effective and efficient implementation of agricultural management practices.
• Website: http://swat.tamu.edu/ GSSHA (CORP) - Gridded Surface Subsurface Hydrologic Analysis (GSSHA): Gridded Surface Subsurface Hydrologic Analysis (GSSHA) is a grid-based two-dimensional hydrologic and sediment transport model. The simulation of nutrients is under development. Features include 2D overland flow, 1D stream flow, 1D infiltration, 2D groundwater, and full coupling between the

5 | P a g e
groundwater, vadose zone, streams, and overland flow. GSSHA can run in both single event and long-term modes. The fully coupled groundwater to surface water interaction allows GSSHA to model both Hortonian and Non-Hortonian basins. GSSHA simulates surface water and groundwater hydrology, erosion, and sediment transport. The GSSHA model is used for hydraulic engineering and research and is on the Federal Emergency Management Agency (FEMA) list of hydrologic models accepted for use in the National Flood Insurance Program for flood hydrograph estimation. Input is facilitated by the Watershed Modeling System interface, which effectively links the model with (GIS). GSSHA uses a square-grid, constant grid-size representation of watershed topography and characteristics, similar to a digital elevation model representation. Relevant model parameters are assigned to the model grids using index maps. Index maps are often derived from soils, land use/land cover, vegetation, or other physiographic maps. The MN DNR has developed a Green & Ampt Infiltration spreadsheet that develops and populates values for the infiltration parameters for 1 or 3 soil layers and for various combinations of soil type and land cover. It is based on USDA WEPP Time-invariant Effective Hydraulic Conductivity methodology. Future efforts are planned for implementation of WEPP’s, Cropland Temporally-varying case. In addition University of Minnesota Super Computer (MSI) is in the process of collaborating with USACE Engineer Research and Development Center (ERDC) to recode the model for time efficiencies, enhance capabilities, and development of virtual simulation capabilities. Websites:
• USACE: http://www.erdc.usace.army.mil/Media/Fact-Sheets/Fact-Sheet-Article-View/Article/476714/gridded-surface-subsurface-hydrologic-analysis/
• YouTube Presentation, Jim Solstad, DNR (retired): https://www.youtube.com/watch?v=ik_BTRAAPgc
Zonation (University of Helsinki): Zonation, a value based model, provides the framework for large-scale spatial conservation planning by identifying priority areas based on habitat quality, connectivity, and biological value of sites. Features can be used in the model, such as biology, hydrology, water quality, geomorphology, and connectivity. Each feature can be weighted in the model to reflect stakeholder values. The resulting hierarchical list can then be outputted to GIS for further analysis. From here, sites can be prioritized for restoration or protection. Several environmental consultants have been trained in the Minnesota DNR’s approach to conservation planning using Zonation.
• YouTube Presentation, Paul Radomski and Kristin Carlson, DNR: https://www.youtube.com/watch?v=_5ilR1HlT1s
• Additional information: https://www.helsinki.fi/en/researchgroups/digital-geography-lab/software-developed-in-cbig
• Software download: https://github.com/cbig/zonation-core/releases
SWMM (EPA): The Storm Water Management Model (SWMM) is a hydraulic and hydrologic modeling system that also have a water quality component. The Storm Water Management Model (SWMM) was originally developed for the Environmental Protection Agency (EPA) in 1971. SWMM is a dynamic rainfall-runoff and water quality simulation model, primarily but not exclusively for urban areas, for single-event or
6 | P a g e
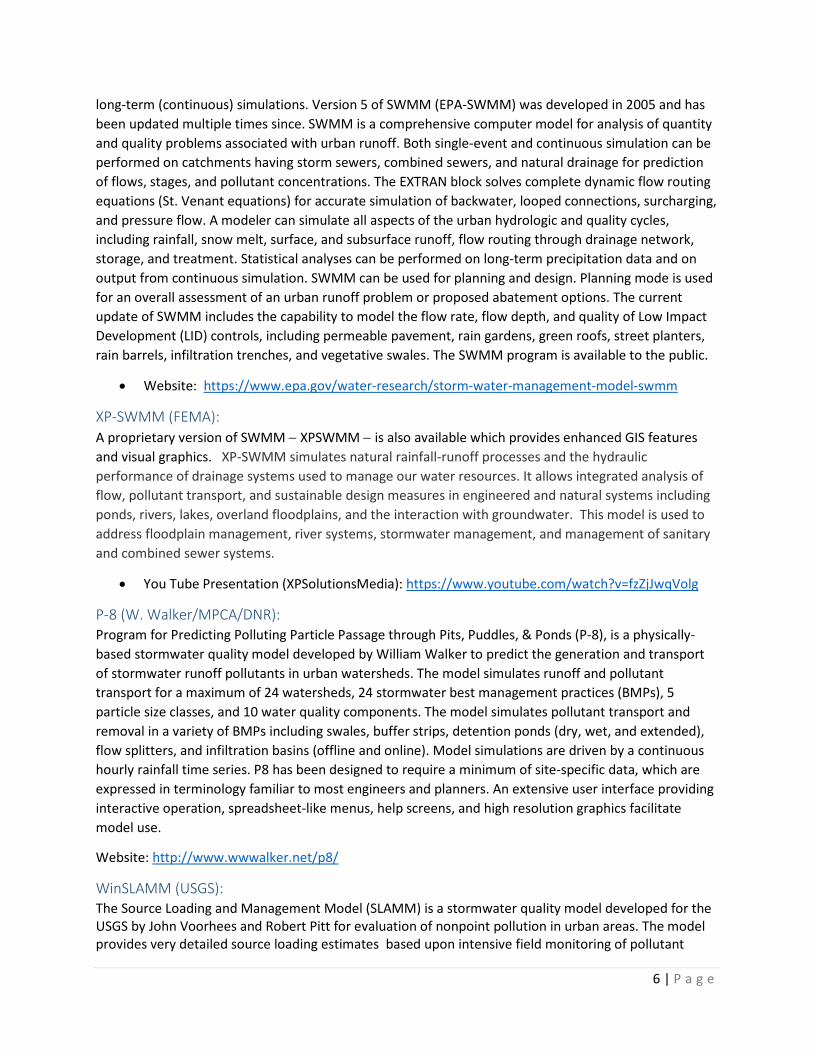
long-term (continuous) simulations. Version 5 of SWMM (EPA-SWMM) was developed in 2005 and has been updated multiple times since. SWMM is a comprehensive computer model for analysis of quantity and quality problems associated with urban runoff. Both single-event and continuous simulation can be performed on catchments having storm sewers, combined sewers, and natural drainage for prediction of flows, stages, and pollutant concentrations. The EXTRAN block solves complete dynamic flow routing equations (St. Venant equations) for accurate simulation of backwater, looped connections, surcharging, and pressure flow. A modeler can simulate all aspects of the urban hydrologic and quality cycles, including rainfall, snow melt, surface, and subsurface runoff, flow routing through drainage network, storage, and treatment. Statistical analyses can be performed on long-term precipitation data and on output from continuous simulation. SWMM can be used for planning and design. Planning mode is used for an overall assessment of an urban runoff problem or proposed abatement options. The current update of SWMM includes the capability to model the flow rate, flow depth, and quality of Low Impact Development (LID) controls, including permeable pavement, rain gardens, green roofs, street planters, rain barrels, infiltration trenches, and vegetative swales. The SWMM program is available to the public.
• Website: https://www.epa.gov/water-research/storm-water-management-model-swmm
XP-SWMM (FEMA): A proprietary version of SWMM − XPSWMM − is also available which provides enhanced GIS features and visual graphics. XP-SWMM simulates natural rainfall-runoff processes and the hydraulic performance of drainage systems used to manage our water resources. It allows integrated analysis of flow, pollutant transport, and sustainable design measures in engineered and natural systems including ponds, rivers, lakes, overland floodplains, and the interaction with groundwater. This model is used to address floodplain management, river systems, stormwater management, and management of sanitary and combined sewer systems.
• You Tube Presentation (XPSolutionsMedia): https://www.youtube.com/watch?v=fzZjJwqVolg
P-8 (W. Walker/MPCA/DNR): Program for Predicting Polluting Particle Passage through Pits, Puddles, & Ponds (P-8), is a physically-based stormwater quality model developed by William Walker to predict the generation and transport of stormwater runoff pollutants in urban watersheds. The model simulates runoff and pollutant transport for a maximum of 24 watersheds, 24 stormwater best management practices (BMPs), 5 particle size classes, and 10 water quality components. The model simulates pollutant transport and removal in a variety of BMPs including swales, buffer strips, detention ponds (dry, wet, and extended), flow splitters, and infiltration basins (offline and online). Model simulations are driven by a continuous hourly rainfall time series. P8 has been designed to require a minimum of site-specific data, which are expressed in terminology familiar to most engineers and planners. An extensive user interface providing interactive operation, spreadsheet-like menus, help screens, and high resolution graphics facilitate model use.
Website: http://www.wwwalker.net/p8/
WinSLAMM (USGS): The Source Loading and Management Model (SLAMM) is a stormwater quality model developed for the USGS by John Voorhees and Robert Pitt for evaluation of nonpoint pollution in urban areas. The model provides very detailed source loading estimates based upon intensive field monitoring of pollutant

7 | P a g e
source areas such as driveways, roofs, and streets as well as pollutant reduction estimates from various BMPs including grass swales, wet detention ponds, porous pavement, filter strips, cisterns and rain barrels, hydrodynamic settling devices, rain gardens/bio filters, and street sweeping. The focus of the model is on small storm hydrology and particulate wash off. The WinSLAMM model may be obtained from PV & Associates. Wisconsin data files for input into SLAMM may be obtained from the U.S. Geological Survey. The model provides an extensive set of rainfall, runoff, and particulate solids and other pollutant files developed from the National Stormwater Quality Data Base for most urban areas in the county. The graphical interface allows users to define both source area and drainage system stormwater control practices using a drag-and-drop interface. The program and web site provides extensive program help and stormwater quality references. Websites:
• http://winslamm.com/ • https://www.usgs.gov/software/winslamm
Watershed Scale Models - Additional Models: SPARROW- Spatially Referenced Regression on Watershed Attributes (USGS): The United States Geological Survey (USGS) SPAtially Referenced Regressions On Watershed attributes (SPARROW) watershed simulation model integrates water monitoring data with landscape information to predict long−term average constituent concentrations and loads that are delivered to downstream receiving waters. The SPARROW models are designed to provide information that describes the spatial distribution of water quality throughout a regional network of stream reaches. SPARROW utilizes a mass-balance approach with a spatially detailed digital network of streams and reservoirs to track the attenuation of nutrients during their downstream transport from each source. Models are developed by statistically relating measured stream nutrient loads with geographic characteristics observed in the watershed [Preston et al., 2011a]. A geographical information system is used to spatially describe pollutant sources and overland, stream, and reservoir transport. A unique feature of SPARROW is the ability to track pollutant loads from any source area to any downstream point. The SPARROW model has been used for Statewide Nutrient Reduction Strategy development across the United States.
• Website: http://water.usgs.gov/nawqa/sparrow/
QUAL2K (Tufts University/EPA): One-dimensional river and stream water quality eutrophication model intended to represent a well-mixed channel both vertically and laterally with steady state hydraulics, non-uniform steady flow, and diel heat budget and water-quality kinetics. QUAL2K is commonly used in wastewater waste load analysis and in low dissolved oxygen total maximum daily load studies. The models considers the following elements:
• One dimensional: The channel is well-mixed vertically and laterally. • Steady state hydraulics: Non-uniform, steady flow is simulated. • Diurnal heat budget: The heat budget and temperature are simulated as a function of
meteorology on a diurnal time scale. • Diurnal water-quality kinetics: All water quality variables are simulated on a diurnal time scale.

8 | P a g e
• Heat and mass inputs: Point and non-point loads and abstractions are simulated. • Sediment diagenesis − the interaction of dissolved oxygen and nutrients between the sediment
and overlying water column. • Simulates the effect of periphyton (bottom algae) upon dissolved oxygen concentrations. • Incorporates various forms of oxygen demanding substances (biological oxygen demand,
sediment oxygen demand, algal death and decay) as well as algal respiration upon dissolved oxygen concentrations.
Websites:
• https://cfpub.epa.gov/si/si_public_record_Report.cfm?dirEntryID=75862 • http://www.qual2k.com/
BASINS (USDA): The Better Assessment Science Integrating Point and Nonpoint Sources (BASINS) model is a multipurpose surface water environmental analysis system developed by the EPA’s Office of Water. The model was originally introduced in 1996 and has had subsequent releases in 1998 and 2001. BASINS allows for the assessment of large amounts of point and non-point source data in a format that is easy to use and understand. BASINS incorporates a number of model interfaces that it uses to assess water quality at selected stream sites or throughout the watershed. These model interfaces include:
• QUAL2E: A water quality and eutrophication model. • WinHSPF: A watershed scale model which estimates watershed and in-stream pollutant
concentrations resulting from loadings from point and non-point sources. • SWAT: A physical based, watershed scale model that was developed to predict the impacts of
land management practices on water, sediment, and agricultural chemical yields in large complex watersheds with varying soils, land uses, and management conditions over long periods of time.
• PLOAD: An urban pollutant loading model based upon the SIMPLE Method.
• Website: https://www.epa.gov/exposure-assessment-models/basins
AGNPS, CONCEPTS (USDA): Agricultural Non-Point Source Pollution Model (AGNPS) is a distributed–parameter watershed scale agricultural model capable of predicting hydrology, sediment, nutrient, and pesticide loadings from agricultural systems. AGNPS includes an explicit feedlot model and incorporates the DRAINMOD tile drainage algorithms. Nitrogen processes included in AGNPS are: plant uptake, nitrification, denitrification, volatilization, mineralization, immobilization, atmospheric nitrogen fixation, leaching, and composition of fresh residue. Special features include the ability to simulate gully erosion, riparian buffers, wetlands, and to perform source tracking of land or reach sources to a downstream point. AGNPS provides linkage to the CCHE1D stream channel model and the Conservation Channel Evolution and Pollutant Transport Model (CONCEPTS) geomorphological model.
Websites:
• http://www.nrcs.usda.gov/wps/portal/nrcs/detailfull/null/?cid=stelprdb1042468

9 | P a g e
• https://www.ars.usda.gov/southeast-area/oxford-ms/national-sedimentation-laboratory/watershed-physical-processes-research/docs/agnps/
ADAPT and GLEAMS (USDA): Agricultural Drainage and Pesticide Transport (ADAPT) is a field scale agricultural model which predicts the loss of surface and subsurface nitrate from an agricultural system. ADAPT features the merger of the Groundwater Loading Effects of Agricultural Management Systems (GLEAMS) surface water and root zone water quality model and the DRAINMOD subsurface drainage model. ADAPT can be used to simulate crop rotations and the associated tillage and residue, as well as edge of field and vadose zone water, sediment, pesticides, and nutrients under different management alternatives. Manure and fertilizer application, nitrogen fixation by legumes, and nitrogen crop uptake can be simulated. ADAPT simulates the response of vadose zone water and the water table to changes in surface hydrology and subsurface drainage. ADAPT also simulates denitrification as a function of soil temperature, water content, and active organic carbon. Additions to ADAPT include frost depth and snowmelt algorithms.
• Website: https://www.ars.usda.gov/plains-area/temple-tx/grassland-soil-and-water-research-laboratory/docs/gleams/
BATHTUB (CORPS) and MINLEAP (MPCA): BATHTUB is an empirical model of reservoir eutrophication developed by the U.S. Army Corps of Engineers. Single basins can be modeled in addition to a network of basins that interact with one another. The model uses steady-state water and nutrient balance calculations in a spatially segmented hydraulic network, which accounts for advective and diffusive transport and nutrient sedimentation. Eutrophication water quality conditions (expressed in terms of total phosphorus, total nitrogen, chlorophyll a, transparency organic nitrogen, nonortho−phosphorus, and hypolimnetic depletion rate) are predicted using empirical relationships developed for reservoir applications. Watershed loadings are routinely provided to BATHTUB by the companion FLUX monitoring data reduction program.
The Minnesota Lake Eutrophication Analysis Procedure (MINLEAP) was developed by MPCA staff based on an analysis of data collected from minimally-impacted lakes within each of Minnesota’s four ecoregions. The program is used as a starting point for lake water quality studies and is intended primarily as a screening tool for estimating lake conditions with minimal input data and for identifying "problem" lakes.
The program formulates water and phosphorus balances and uses a network of empirical (regression equations) models to predict lake phosphorus, chlorophyll-a, and transparency (Secchi) values based upon lake surface area, mean depth, watershed area, and the ecoregion in which the lake is located.
Program output includes:
• Statistical comparisons of observed and predicted phosphorus, chlorophyll-a, and transparency values.
• Uncertainty estimates. • Estimates of chlorophyll-a interval frequencies (nuisance frequencies) for observed and predicted
conditions.
10 | P a g e
The model should be used to approximate lake water quality expectations, acknowledging that individual lakes may deviate greatly from regionally defined patterns.
• Website (BATHTUB): http://www.wwwalker.net/bathtub/help/bathtubWebMain.html
APEX and EPIC (USDA): The Agricultural Policy / Environmental eXtender (APEX) model was developed to extend EPIC’s capabilities of simulating land management impacts for small-medium watersheds and heterogeneous farms. It can be configured for land management strategies such as irrigation, drainage, furrow diking, buffer strips, terraces, waterways, fertilization, manure management, lagoons, reservoirs, crop rotation and selection, pesticide application, grazing, and tillage. The routing of water, sediment, nutrient, and pesticide capabilities are some of the most comprehensive available in current landscape-scale models.
The Environmental Policy Integrated Climate (EPIC) model was developed to estimate soil productivity as affected by erosion and simulates approximately eighty crops with one crop growth model using unique parameter values for each crop. It can be configured for a wide range of crop rotations and other vegetative systems, tillage systems, and other management strategies. It predicts effects of management decisions on soil, water, nutrient and pesticide movements, and their combined impact on soil loss, water quality, and crop yields for areas with homogeneous soils and management.
Website: https://epicapex.tamu.edu/
Hydraulic and Hydrologic Watershed Based Models The US Army Corp of Engineers (USACE) Hydrologic Engineering Center (HEC) is the designated Center of Expertise for the U.S. Army Corps of Engineers in the technical areas of surface and groundwater hydrology, river hydraulics and sediment transport, hydrologic statistics and risk analysis, reservoir system analysis, planning analysis, real-time water control management, and a number of other closely associated technical subjects.
The USACE HEC has developed a suite of engineering tools that are used widely by Federal and State Government agencies, private industry, and academia. Many of their models, such as the HEC-RAS and HEC-HMS models are utilized in Minnesota in regards to river dynamics, flood plain analysis, and flood prediction.
Websites:
• USACE HEC main page: https://www.hec.usace.army.mil/ • Fact Sheet on the main HEC models:
https://www.hec.usace.army.mil/FactSheets/Software/HEC_FactSheet_Software.pdf
GIS Based Tools and Interfaces – Frequently Used ACPF (USDA-ARS/ISU): The Agricultural Conservation Planning Framework (ACPF) is a set of technical tools semi-automated with ArcGIS software which develops conservation planning scenarios that are matched to both landowner preferences and landscape-based risks. The basic backbone of ACPF is terrain analysis − a LiDAR based elevation analysis used to identify critical source areas which contribute disproportionate amounts of nutrients, sediment, or runoff water to a water body. For example, areas in the landscape

11 | P a g e
where the water table is close to the ground surface may be targeted for wetland restoration. After landscape-level targeting occurs, results from this tool can be used to narrow down from a landscape scale to a site-specific location. It also tailors management practices to the selected site. The ACPF website below was redesigned in 2018 and includes a number of video training modules on how to use the tool.
Websites:
• ACPF Main Website: https://acpf4watersheds.org/ • USDA: https://data.nal.usda.gov/dataset/agricultural-conservation-planning-framework-acpf-
toolbox • Iowa State University: https://www.extension.iastate.edu/waterquality/files/page/files/ACPF-
BigCr-WatershedAcademy.pdf
PTMApp (BWSR): The Prioritize, Target, and Measure Application (PTMApp) uses water quality related products derived from high resolution topographic data collected using Light Detection and Ranging (LiDAR) technology to inform the prioritization of resource concerns and target specific fields for the implementation of nonpoint source BMPs and conservation practices (CPs). The PTMApp will also "measure" the effectiveness of BMPs and CPs by cost and expected load reduction benefits at the resource of concern within the watershed. This application is also capable of incorporating model results from the statewide expansion of HSPF. BWSR is currently working to transition the maintence and development of PTMApp to the State of Minnesota. In 2018, additional enhancements will be made to the desktop application and the web application will be upgraded to increase speed and capabilities. Websites:
• Main website: http://www.rrbdin.org/prioritize-target-measure-application-ptmapp • Theory and Documentation:
http://ptmapp.rrbdin.org/files/04052016_PTMA_Theory_Report.pdf • Final Technical Memorandum: http://www.rrbdin.org/wp-
content/uploads/2015/02/MeasureMethods_Memo_Final.pdf
HSPF-SAM (MPCA): HSPF Scenario Application Manager (SAM) was designed to provide a user-friendly interface to the HSPF model. The HSPF-SAM is a tool with strong GIS components that interface with HSPF to simulate the transport and fate of pollutants at a watershed scale. The tool also includes a BMP database with adjustable efficiencies and costs. HSPF-SAM is designed to provide a desktop method for generating multiple implementation scenarios to test the impact of various BMPs in various sub watersheds, and compare the costs and benefits of the scenarios. Below is a summary of main points regarding HSPF-SAM:
• HSPF-SAM is linked to a calibrated water quality model. • HSPF-SAM allows the user to:

12 | P a g e
o Access model results and assess watershed conditions, o Create implementation scenarios optimized for cost effectiveness, o Scenarios can include land use conversions, climate change, BMPs, and CPs, and o Determine modeled measurable outcomes.
• HSPF-SAM prioritizes sub watersheds based on pollutants and targeted water bodies of concern. • Most effective used in tandem with a GIS targeting tool(s) and local resource manager
knowledge.
Website:
• https://www.respec.com/product/scenario-application-manager/
WHAF (MN DNR): The Watershed Health Assessment Framework (WHAF) provides a comprehensive overview of the ecological health of Minnesota's watersheds. With more than 35 watershed health scores organized by ecological component, the WHAF uses a web application to deliver maps and analytics that provide valuable insights into watershed conditions across hydrologic scales. In addition to the interactive map, the WHAF delivers PDF reports summarizing conditions for each Major Watershed (HUC8) in Minnesota. The Watershed Context Report contains maps, tables, and figures which characterize conditions that set the context for natural resource management (e.g., geology, land use, habitat, ownership, and climate). The Watershed Health Report Card contain maps and numeric summaries for each watershed health score.
• Website: http://www.dnr.state.mn.us/whaf/index.html o Watershed Health Report Cards link o Watershed Context Reports link
• YouTube Presentation: https://www.youtube.com/watch?v=B9zQ7g0oqMg
GIS Based Tools and Interfaces – Additional Tools: GIS Based Terrain Analysis: A digital terrain model is a topographic model of the bare earth – terrain relief - that can be manipulated by computer programs. The data files contain the spatial elevation data of the terrain in a digital format which is usually presented as a rectangular grid. Various indices of flow volume and power are developed from the slope and aspect data developed by a digital elevation model.
USDA NRCS has developed a series of Hydrology and Terrain analysis tools. A video from the University of Minnesota goes over the functions of some of those tools: https://www.wrc.umn.edu/sites/wrc.umn.edu/files/nrcs_hydrology_and_terrain_analysis.pdf
LiDAR is an active remote sensing technology that uses laser light to detect and measure surface features on the earth. LiDAR-derived high-resolution elevation data products are available for all of Minnesota.
Websites:
• MnTOPO Viewer: http://dnr.state.mn.us/maps/mntopo/index.html

13 | P a g e
• https://gisdata.mn.gov/ • http://www.lccmr.leg.mn/projects/2011/finals/2011_05d_rpt_digital-terrain-analysis-
manual.pdf • https://www.wrc.umn.edu/sites/wrc.umn.edu/files/terrain_analysis_workshop_exercises.pdf • http://www.dnr.state.mn.us/maps/lidar/index.html • Minnesota Department of Agriculture – Priority Management Zones and Terrain Analysis:
https://www.mda.state.mn.us/sites/default/files/inline-files/identifyingzones.pdf
Nutrient Tracking Tool (USDA-OEM) NTT is a web-based, site-specific application that estimates nutrient and sediment losses for crop and pasture at the field and/or watershed scales. Agricultural producers and land managers can define a number of management scenarios for any given field or area of interest (AOI). NTT will estimate nutrient (nitrogen and phosphorus) losses, sediment losses, and crop yields differences between the scenarios and present results in customizable reports. NTT estimates are made using the APEX (Agricultural Policy/Extender; Williams et al. 2010) (Version 0806) model (Williams et al. 2000). Results represent average nutrient and sediment losses from the field based on 35 years of simulated weather. NTT was developed by the Texas Institute for Applied Environmental Research (TIAER) at Tarleton State University with funding and technical support from USDA’s Office of Environmental Markets. Additional funding for development of NTT was provided by NIFA, the USDA Conservation Innovation Grants program, and various state governments.
Website: https://www.oem.usda.gov/nutrient-tracking-tool-ntt
Calculators and Estimators – Frequently Used: BWSR Estimators (BWSR): A spreadsheet model that calculates soil, sediment, and phosphorus loss for the following four areas of concern: sheet and rill erosion, gully erosion, streambank erosion, and filter strip implementation. The sheet and rill erosion and filter strip modules require RUSLE2 inputs.
• Website: http://www.bwsr.state.mn.us/outreach/eLINK/index.html
MinnFARM (U of M): Minnesota Feedlot Annualized Runoff Model (MinnFARM) was developed to calculate the annual pollutant loading from open lot feedlots in Minnesota. The model is based in part on algorithms from the Feedlot Evaluation Model (1982) developed by the Agricultural Research Service for prioritizing feedlot pollution potential based on a single 25 year, 24 hour event. With a limited number of inputs, MinnFARM estimates annual pollutant loadings for COD, phosphorus, nitrogen, BOD5, and fecal coliform at the end of a defined treatment area. In addition, the model predicts whether the feedlot is likely in compliance with the MPCA water quality standards. MinnFARM also requires input of the type of receiving water and distance to this water. The model uses this information, along with annual loadings of BOD5 and phosphorus and BOD5 concentration, to prioritize feedlots for state or federal cost share assistance to mitigate feedlot runoff.
• Website: https://extension.umn.edu/manure-management/manure-air-and-water-quality

14 | P a g e
MIDS (MPCA):
A Minimal Impact Design Standards (MIDS) BMP calculator was developed to assist designers and regulators in determining conformance to the MIDS performance goals. The MIDS BMP calculator is a tool used to determine stormwater runoff volume and pollutant reduction capabilities of various low impact development (LID) BMPs. The MIDS calculator estimates the stormwater runoff volume reductions for various BMPs based on the MIDS performance goal (1.1 inches of runoff off impervious surfaces) and annual pollutant load reductions for total phosphorus (including a breakdown between particulate and dissolved phosphorus) and total suspended solids (TSS).
The MIDS calculator is designed in Microsoft Excel with a graphical user interface (GUI), packaged as a windows application, which is used to organize input parameters. The Excel spreadsheet conducts the calculations and stores parameters, while the GUI provides a platform that allows the user to enter data and presents results in a user-friendly manner.
The MIDS calculator is divided into four main components: the “Site information” tab, “Schematic” tab, “BMP Properties” window, and “Results” tab. The “Site information” tab is where the user enters information for the entire site being studied. This includes information used to calculate annual precipitation for the study area, average pollutant concentrations in runoff from the entire site, as well as land use areas for the entire study area. The “Schematic” tab is where the user adds or removes BMPs to the site and provides a visual diagram of all BMPs and routing between BMPs. In the “BMP Properties” window the user enters land use areas, routing information, and design parameters specific to an individual BMP. Finally, in the “Results” tab, results are displayed for the entire site as well as individual BMPs. Results include pollutant removal rates and loads, annual volume reduction, as well as conformance to the MIDS performance goal. A detailed overview of individual input parameters and workflows is presented in the MIDS Calculator User Documentation. Below is a detailed discussion of the main objectives of the MIDS calculator and the calculations that take place to meet those objectives.
The calculator has five main objectives:
1. Calculates the stormwater runoff volume reduction performance goal for a site. 2. Calculates annual stormwater runoff volumes and pollutant loads (total suspended sediment,
dissolved phosphorus, and particulate phosphorus) from site. 3. Provides a method to add stormwater BMPs, input BMP specific parameters, and route overflow
stormwater and pollutants to downstream practices. 4. Calculate stormwater runoff volume reduction achieved toward the performance goal and
annual stormwater volume and pollutant load reductions for each individual BMP and the entire site.
5. Report results, including stormwater runoff volume reduction applied toward the performance goal, annual pollutant load reductions for TSS, dissolved phosphorus, and particulate phosphorus, as well as annual stormwater volume reduction for the entire site and individual BMPs.
• Website: https://www.pca.state.mn.us/water/minnesotas-stormwater-manual

15 | P a g e
MPCA Simple Method Estimator (MPCA): The MPCA Simple Estimator is a spreadsheet-based tool used to predict watershed-based loading of four (4) pollutants (Total phosphorus (TP), Total Suspended Solids (TSS), E. coli, and fecal coliform) and estimate pollutant removal at water quality BMPs. The spreadsheet tool was created by the MPCA specifically to assist Municipal Separate Storm Sewer System (MS4) Permittees in the completion of the Commissioner-approved TMDL Annual Reporting Form (TMDL Form).
Compared to the MIDS Calculator, the MPCA Simple Estimator is simplified in that it lacks a graphical user interface and uses a simplified approach for predicting pollutant removal at modeled BMPs.
• Model Download: https://stormwater.pca.state.mn.us/index.php?title=File:MPCA_Estimator-2.xlsx
• Model Documentation: https://stormwater.pca.state.mn.us/index.php?title=Guidance_and_examples_for_using_the_MPCA_Estimator
SSIE - Septic System Improvement Estimator (U of M/MPCA): The Septic System Improvement Estimator (SSIE) is a spreadsheet-based model that calculates annual pollutant loads from problematic septic systems and accounts for the benefits of a range of septic system improvement, educational efforts and programs to identify the problematic systems.
Websitehttp://www.bwsr.state.mn.us/outreach/eLINK/SSIE_Users_Guide.pdf
RUSLE2 (USDA-ARS): The Revised Universal Soil Loss Equation (RUSLE2) was developed primarily to guide conservation planning, inventory erosion rates, and estimate sediment delivery. Values computed by RUSLE2 are supported by accepted scientific knowledge and technical judgment, are consistent with sound principles of conservation planning, and result in good conservation plans. RUSLE2 is also based on additional analysis and knowledge that were not available when RUSLE1 was developed. RUSLE2 is based on science and judgment that is superior to that of RUSLE1.
RUSLE2 has evolved from a series of previous erosion prediction technologies. The Universal Soil Loss Equation (USLE) was entirely an empirically based equation and was limited in its application to conditions where experimental data were available for deriving factor values. A major advancement in RUSLE1 was the use of sub factor relationships to compute C factor values from basic features of cover-management systems. While RUSLE1 retained the basic structure of the USLE, process-based relationships were added where empirical data and relationships were inadequate, such as computing the effect of strip cropping for modern conservation tillage systems.
RUSLE2 is another major advancement over RUSLE1. While RUSLE2 uses the USLE basic formulation of the unit plot, the mathematics of RUSLE2 are on a daily basis. Improved cover-management sub factor relationships are used in RUSLE2, a new ridge sub factor has been added, and the deposition equations have been extended to consider sediment characteristics and how deposition changes these characteristics. It includes new relationships for handling residue, including resurfacing of residue by implements like field cultivators.
Equation:

16 | P a g e
a = r k l S c p
• a = net detachment (mass/unit area) • r = erosivity factor • k = soil erodibility factor • l = slope length factor • S = slope steepness factor • c = cover-management factor • p = supporting practices factor
Process:
Source: USDA-ARS
Source: USDA-ARS
• Website and software download: http://fargo.nserl.purdue.edu/rusle2_dataweb/RUSLE2_Index.htm

17 | P a g e
• Additional information from USDA-ARS https://www.ars.usda.gov/southeast-area/oxford-ms/national-sedimentation-laboratory/watershed-physical-processes-research/research/rusle2/revised-universal-soil-loss-equation-2-how-rusle2-computes-rill-and-interrill-erosion/
NBMP, PBMP, and NP-BMP (U of M/MPCA) – Watershed Nitrogen and Phosphorus BMP Assessment Tools Spreadsheet planning tools for nitrogen (NBMP) and phosphorus (PBMP) load reductions were developed to estimate nutrient reductions to surface waters from agricultural-land BMPs at various scales. The user enters BMP scenario adoption rates, and the tool compares the effectiveness and cost of potential BMPs that could be implemented to reduce loads entering surface waters from cropland in any specified watershed that is HUC10 or larger. Quick predictions can be made of watershed nutrient reductions resulting from various combinations of BMPs. Users can compare and optimize selection of BMPs for reducing nutrient loads. A variation of the tool that combines nitrogen and phosphorus practices into one scenario evaluation tool was also developed (NP-BMP). Websites:
• To download updated spreadsheet: http://z.umn.edu/nbmp • http://articles.extension.org/pages/67624/minnesota-watershed-nitrogen-reduction-planning-
tool
Calculators and Estimators – Additional Calculators: WEPP (USDA-ARS) – Water Erosion Prediction Project The Water Erosion Prediction Project (WEPP) model may be used in both hillslope and watershed applications. The model is a distributed parameter, continuous simulation, erosion prediction model, implemented as a set of computer programs. The distributed input parameters include rainfall amounts and intensity, soil textural qualities, plant growth parameters, residue decomposition parameters, effects of tillage implements on soil properties and residue amounts, slope shape, steepness, and orientation, and soil erodibility parameters. Continuous simulation means that the computer program simulates a number of years with each day having a different set of input climatic data. On each simulation day a rain storm may occur, which then may or may not cause a runoff event. If runoff is predicted to occur, the soil loss, sediment deposition, sediment delivery off-site, and the sediment enrichment for the event will be calculated and added to series of sum totals. At the end of the simulation period, average values for detachment, deposition, sediment delivery, and enrichment are determined by dividing by the time interval of choice. The entire set of parameters important when predicting erosion are updated on a daily basis, including soil roughness, surface residue cover, canopy height, canopy cover, soil moisture, etc. This continuous updating relieves the user of the difficult job of determining temporal distributions of important parameters, such as cover values. The original intention of WEPP was as a replacement to the Universal Soil Loss Equation. The NRCS has planned to replace RUSLE2 with WEPP.
Websites:
• Beta WEPP web interface: http://milford.nserl.purdue.edu/wepp/weppV1.html
18 | P a g e
• https://www.ars.usda.gov/midwest-area/west-lafayette-in/national-soil-erosion-research/docs/wepp/research/
• WEPP Model Technical Paper: http://digitalcommons.unl.edu/cgi/viewcontent.cgi?article=1026&context=biosysengfacpub
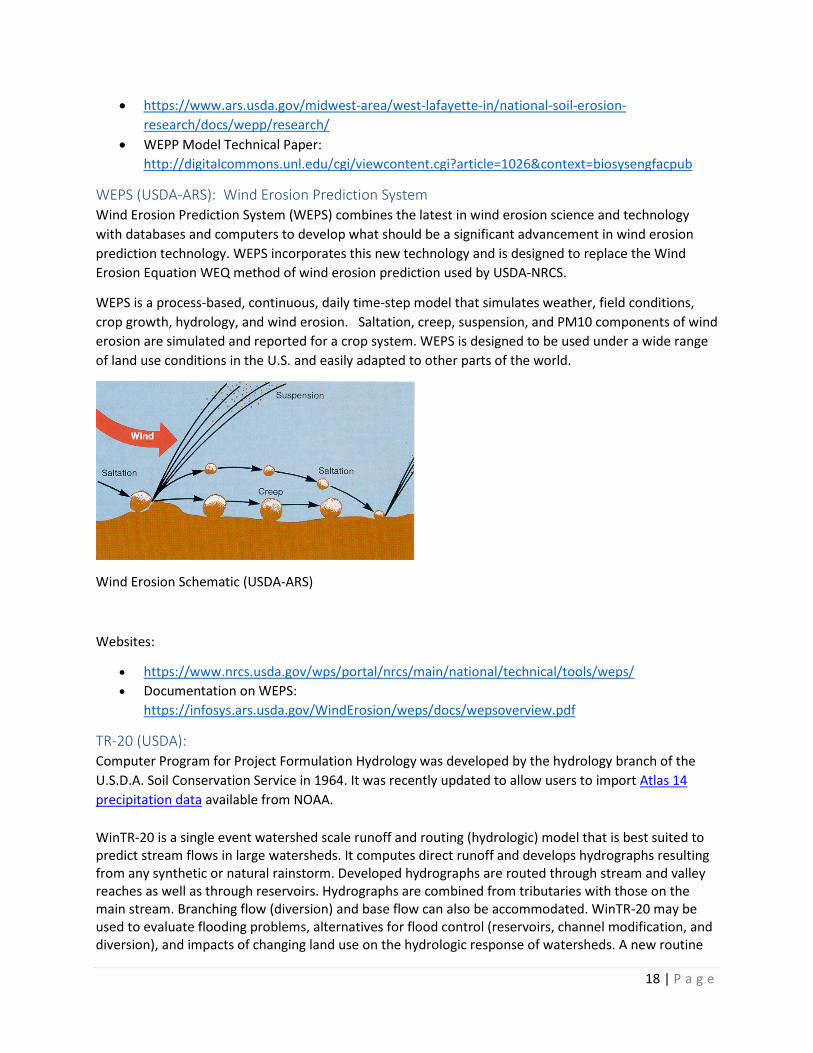
WEPS (USDA-ARS): Wind Erosion Prediction System Wind Erosion Prediction System (WEPS) combines the latest in wind erosion science and technology with databases and computers to develop what should be a significant advancement in wind erosion prediction technology. WEPS incorporates this new technology and is designed to replace the Wind Erosion Equation WEQ method of wind erosion prediction used by USDA-NRCS.
WEPS is a process-based, continuous, daily time-step model that simulates weather, field conditions, crop growth, hydrology, and wind erosion. Saltation, creep, suspension, and PM10 components of wind erosion are simulated and reported for a crop system. WEPS is designed to be used under a wide range of land use conditions in the U.S. and easily adapted to other parts of the world.
Wind Erosion Schematic (USDA-ARS)
Websites:
• https://www.nrcs.usda.gov/wps/portal/nrcs/main/national/technical/tools/weps/ • Documentation on WEPS:
https://infosys.ars.usda.gov/WindErosion/weps/docs/wepsoverview.pdf
TR-20 (USDA): Computer Program for Project Formulation Hydrology was developed by the hydrology branch of the U.S.D.A. Soil Conservation Service in 1964. It was recently updated to allow users to import Atlas 14 precipitation data available from NOAA.
WinTR-20 is a single event watershed scale runoff and routing (hydrologic) model that is best suited to predict stream flows in large watersheds. It computes direct runoff and develops hydrographs resulting from any synthetic or natural rainstorm. Developed hydrographs are routed through stream and valley reaches as well as through reservoirs. Hydrographs are combined from tributaries with those on the main stream. Branching flow (diversion) and base flow can also be accommodated. WinTR-20 may be used to evaluate flooding problems, alternatives for flood control (reservoirs, channel modification, and diversion), and impacts of changing land use on the hydrologic response of watersheds. A new routine

19 | P a g e
has been added to the program that allows the user to import NOAA Atlas 14 rainfall data for site-specific applications. The rainfall-frequency data will be used to develop site-specific rainfall distributions. The NOAA 14 text files for selected states are available in the Support Materials for downloading and use in WinTR-20 Version 1.11. The NOAA 14 text files and supporting GIS files are packaged in a zip file for each state.
• Website: http://www.nrcs.usda.gov/wps/portal/nrcs/detailfull/null/?cid=stelprdb1042793
TR-55 (USDA): TR-55 was developed by the U.S.D.A. Soil Conservation Service, now the Natural Resources Conservation Service (NRCS), in 1975 as a simplified version of TR−20 used to calculate storm runoff volume, peak rate of discharge, hydrographs and storage volumes in small urban watersheds. In 1998, Technical Release 55 and the computer software were revised to what is now called WinTR-55. The changes in this revised version of TR-55 include: upgraded source code to Visual Basic, changed philosophy of data input, development of a Windows interface and output post-processor, enhanced hydrograph-generation capability of the software, and flood routing hydrographs through stream reaches and reservoirs. WinTR-55 is a single-event rainfall-runoff small watershed hydrologic model. The model is an input/output interface which runs WinTR-20 in the background to generate, route, and add hydrographs. The WinTR-55 generates hydrographs from both urban and agricultural areas at selected points along the stream system. Hydrographs are routed downstream through channels and/or reservoirs. Multiple sub-areas can be modeled within the watershed. A rainfall-runoff analysis can be performed on up to ten sub-areas and up to ten reaches. The total drainage area modeled cannot exceed 25 square miles.
• Website: http://www.nrcs.usda.gov/wps/portal/nrcs/detailfull/national/water/?cid=stelprdb1042901
Minnesota Phosphorus (P) Index (U of M): The Minnesota Phosphorus Index (P Index) is a management tool to estimate the relative risk that phosphorus is being lost from an agricultural field and delivered to a nearby ditch, stream, or lake. It allows the user to evaluate management options that can reduce the risk.
• Website: https://extension.umn.edu/phosphorus-and-potassium/minnesota-phosphorus-index-assessing-risk-phosphorus-loss-cropland
Rational Method (LMNO Engineering): The Rational Method is a simple hydrologic calculation of peak flow based on drainage area, rainfall intensity, and a non-dimensional runoff coefficient. The peak flow is calculated as the average rainfall intensity in inches per hour over a duration equal to the time of concentration of the contributing area multiplied by the runoff coefficient and the drainage area in acres. The peak flow, Q, is calculated in cubic feet per second (cfs) as Q = CiA where C is the runoff coefficient, i is the rainfall intensity, and A is the drainage area. This method is best used only for simple approximations of peak flow from small watersheds.
• Website: http://www.lmnoeng.com/Hydrology/rational.php

20 | P a g e
STEPL (US EPA): Spreadsheet Tool for Estimating Pollutant Load (STEPL) employs simple algorithms to calculate nutrient and sediment loads from different land uses and the load reductions that would result from the implementation of various BMPs. STEPL provides a user-friendly Visual Basic (VB) interface to create a customized spreadsheet-based model in Microsoft (MS) Excel. It computes watershed surface runoff; nutrient loads, including nitrogen, phosphorus, and 5-day biological oxygen demand (BOD5); and sediment delivery based on various land uses and management practices. For each watershed, the annual nutrient loading is calculated based on the runoff volume and the pollutant concentrations in the runoff water as influenced by factors such as the land use distribution and management practices. The annual sediment load (sheet and rill erosion only) is calculated based on the Universal Soil Loss Equation (USLE) and the sediment delivery ratio. The sediment and pollutant load reductions that result from the implementation of BMPs are computed using the known BMP efficiencies.
Region 5 Model is an Excel workbook that provides a gross estimate of sediment and nutrient load reductions from the implementation of agricultural and urban BMPs. The algorithms for non-urban BMPs are based on the "Pollutants controlled: Calculation and documentation for Section 319 watersheds training manual" (Michigan Department of Environmental Quality, June 1999). The algorithms for urban BMPs are based on the data and calculations developed by Illinois EPA. Region 5 Model does not estimate pollutant load reductions for dissolved constituents.
Websites:
• http://it.tetratech-ffx.com/steplweb/ • http://dnr.wi.gov/topic/nonpoint/stepl.html
General Water Quality Modeling Video Presentations: • Overview of Water Quality Models (R. Srinivasan, Texas A&M University):
https://www.youtube.com/watch?v=LwDxt6gpvDg • Water Quality Modeling for Groundwater, Surface Water, and Watersheds - Basic Theory and
Applications (Dr. Ryan Bailey, Colorado State University): https://www.youtube.com/watch?v=LwDxt6gpvDg

21 | P a g e
Appendix A: List of Acronyms ACPF: Agricultural Conservation Planning Framework
ADAPT: Agricultural Drainage and Pesticide Transport
AGNPS: Agricultural Non-Point Source Pollution Model
APEX: Agricultural Policy / Environmental eXtender model
BASINS: Better Assessment Science Integrating Point and Nonpoint Sources
BWSR: Minnesota Board of Water and Soil Resources
CONCEPTS: Conservation Channel Evolution and Pollutant Transport model
CORPs or US ACE: United States Army Corps of Engineers
DEM: digital elevation model
DNR: Minnesota Department of Natural Resources
DRAINMOD: Drainage Water Table Management model
EBI/ERT: Ecological Benefits Index and Ecological Ranking Tool
EPA: United States Environmental Protection Agency
EPIC: Environmental Policy Integrated Climate model
GLEAMS: Groundwater Loading Effects of Agricultural Management Systems
hDEM: hydro-modified digital elevation model
HSPF: Hydrologic Simulation Program-Fortran
HSPF-SAM: Hydrologic Simulation Program-Fortran – Scenario Application Manager
MIDS: Minimal Impact Design Standards
MinnFARM: Minnesota Feedlot Annualized Runoff Model
MINNLEAP: Minnesota Lake Eutrophication Analysis Procedure
MPCA: Minnesota Pollution Control Agency
NBMP: Watershed Nitrogen Best Management Practice Assessment Tool
NTT: Nutrient Tracking Tool
P-8: Program for Predicting Polluting Particle Passage through Pits, Puddles, & Ponds
PTMApp: Prioritized, Targeted, Measurable Application
QUAL2K: Quality of Rivers and Streams 2000
RUSLE2: Revised Universal Soil Loss Equation

22 | P a g e
SPARROW: Spatially Referenced Regression on Watershed Attributes
SSIE: Septic System Improvement Estimator
STEPL: Spreadsheet Tool for Estimating Pollutant Load
SWAT: Soil and Water Assessment Tool
SWMM: Storm Water Management Model
USDA: United States Department of Agriculture
ARS: Agricultural Research Service
NRCS: Natural Resource Conservation Service
USGS: United States Geologic Survey
USLE: Universal Soil Loss Equation
WEPP: Water Erosion Prediction Project
WEPS: Wind Erosion Prediction System
WINSLAMM: Source Loading and Management Model
WHAF: Watershed Health Assessment Framework