Embed Size (px)
Citation preview

4P42 Section:
Reference :
Title:
10.5
21
Press Room Vent Emissions Sampling, Willamette Industries, Inc., Emerson, Louisianai Test Dates February 8-9, 1995, prepared for Willamette Industries, Inc., by Armstrong Environmental, Inc., Project W-I 653-95, February 20, 1995.
2002 supplement

... I . . . . .
I !
Press Room Vent Emission sampling Wamet te Industria, In% Emerson, LA
February 8-9,1995 Armstrong E n v i r o n m d s Lnc.
Project W-1653-95
. .
I
-
Report Prepared F e b w 20,1995 BY m t r o n g Enviromned Z~C.
7715 Soverdgn Row Dallas,Tews 75247
(214) 631-0021
1 . -
i
... .
/5f

I 1. 1 I I I I I I I' I I I I I.,
WILLAME'ITE INDUSTRIES, INC. MTEROFFICE COMMUMCATlON
Date: April 14.1995
To: Jedd Lee
From: KimCarW
R E vw Press Emission Tests o men on and Taylor Divisions
T ~ * to mmurc VOC emissions from pxssing operations were conducted at tbe h e m n Division on F e b w 8 and 9,1995, and at the Taylor Division on Much 14,1995. l l j s is to
the testing project and results.
ne Emerson plant operates hK0 identical 30spening presses, positioned side-byside,
rme, a d receives assembled plywood veneer directly off of the bundling station at the end of&e layup line. Each bundle is preprcsd for approximately four minutes prior to loading into & pss. ~0th presses always NO the same grade and dimension of plywood, tbus their produ~&n (=d emissipas) can k exptcced to be n d y identical
press arca is approximately 45-feet ~ q ~ a r r and k enclosed on the Oocib and cast rides by solid walls, and on the west side by a wall that extends approxhatcly 12-fcct down from wiling, leaving an opening of about IZfcct from the floor to tbe bonom of the wall above. n e
wall is similar to the west wall except that it does not extend as clox to the floor, 20 a 12. foot wide larp was hung along the bonom of the SOU& wall to help contain press emissions in press area.
n e press area is ventilated by four motor-driven box fans, two mounted at the top of the w a wall, and two at tbe top of the easi wall. For identification purposes. the fans on &e west mall are identified BS Norlhwcrt 0, and Southwefl (Sw). The fans on the a s i side arc identified as Noriheast (NE), and Southeast (SEI. None of the fw fans u e the same. Tbe NW and SW fans M both 5-feet in diameter. but an fined with different si= moton, and different size pulleys, so the a i flow fiom each are different. The NE fan is four-foot in diameter, and the SE fan is three feet in diameter.
The objective of the tests was to cmblish an emission factor for VCCs From pressing operations in terms of pounds of VOCs per 1000 q u a feet of plpvwd pressed. Tbc NE and SE fans sere hrmed off and scaled with heavy plastic shecling and duct tap. thus all emissions were vented through the NW and SW fans. Both the NW and SW fans discharge directly to the atmospkn without stacks, so temporacy testing rtackr were i n d c d on the discharge side of the W and SW fans. A SJ-fOa square plywccd box, 3.0-fect deep mar constructed, and mounted 00 tbe fM 6amc ofthe NW ud SW fans. On the face ofthe h parallel to tbe plane of tbe fan bladt, 1
10 feet span 'rhe press area is situated 10 the west of the north end of the layup
-
.

I
1 I I I I I I I : I I I I. I.
. .
foot diameter hole was sawn. In this Opening a 12 foot section of 36" sonotube was fined and sealed, thus creating a discharge stack. TWO h e - i n c h diameter hole were sawn w ' a p a 36. inches fiom the end of the sonotubc for insenion of the sampling prokt.
n e plan had origiially been to test one suck, and measure the a i flow in the other stack so that a total air flow could be determind, and based on the VOC emissions meazured in one stack, vm emissions could be assigned to the other stack h an amount proportionate to that stack's ak flow. mite the a c k s wen being installed, however, it was necessary to turn offthe fan, leaving only one fan IUMhg. 11 appcarrd, obxrving &om undernd, that one fan kept the press area ventiiatrd without emissions billowing out underneath the "current" walls on the wed
running, and the other lhre would be off and tdd with plastic sheeting. and south sides. So it was decided that during the 1% only the fan Wig t e n d would be <-
n e t e a began early the next morning (February 81, and because the tcmpcrature WIU very cool (uppr 30%), much more steam was visible from pressing than had bxn visible the day before when it was warmer. This allowed Us I O Ke (and Stop) seven1 leakc in the -1s we bad inmlled over the other fans, and it also made a situation when it would have been very obvious if any emissions werc billowing out under the bonom of the cumin walls.
On the second day, t e a Were done while pressing 3/4" plyvood, and tbrce ~ 1 ) s wen done while pressing 98" board. nw avenge results arc also tabulated io Table 1.
On the N" fan with the SW fan ofland scaled. Two were
I Table I Emenon Press Emission Test Results I
Table I shows VOC emissions calculated on a 318" R' basis and I surface f? basis. The reason for this is that Voc emissions v y as a function of the weight of board bciigprcsd (weight is directly conelated to 3/8" basis fi ), and surface ft2. The exrent lo which each factor flea, VW emission has not k e n determined but it is CICV thal011 either basis, a factor of 0.25, or 03 lb/1oOO $F is a conservative factor, meaning emissions would be over-cslimated
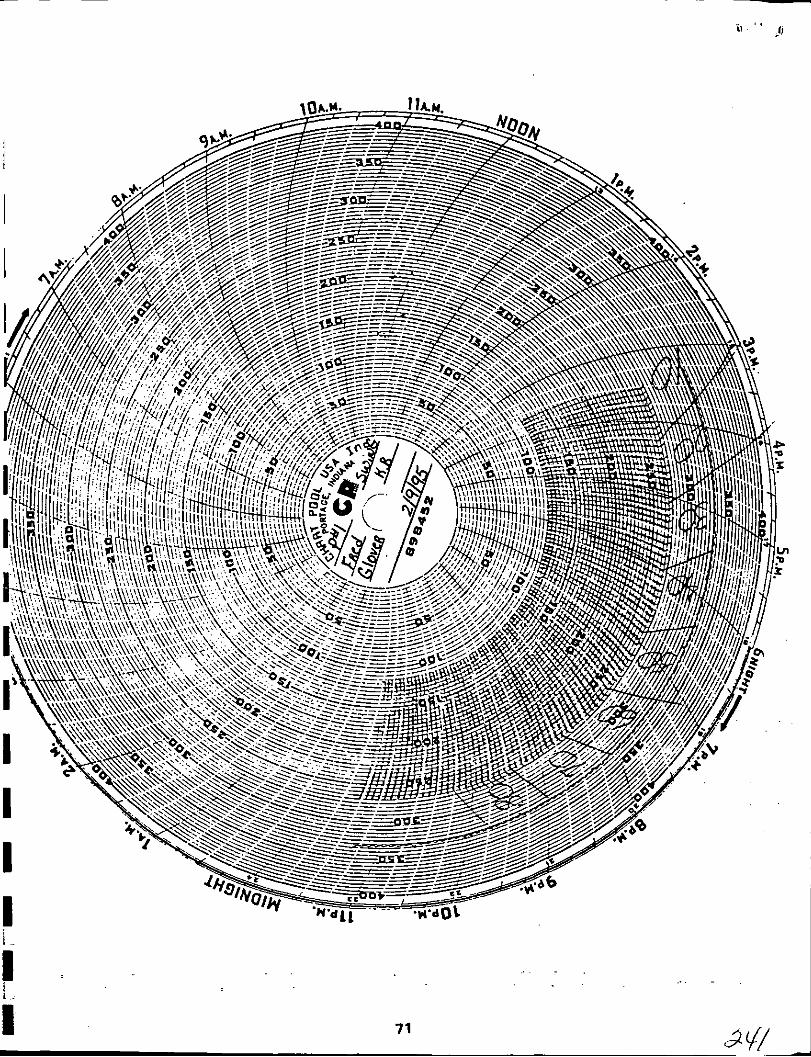
Figure 1 shows a typical press emission pancm during the lestr. The peaks conespmd to the = l e a a1 the completion of the press cycle. This is when a visible release of heat and n m from the boards MCUTS. Note that both the #1 and #2 prcts cyde releases appear as peaks. n e smaller peak is from the press hrrthen away from the vent being tested. Its peak is smatter & c a o ~ more dispersion has occurred by the time the emissions M dram into the ventilation vent

i I I I I I I I I I I I' I I I I I
FigW 1 vm Emission Lcvels Through Several Press Cycles - Emenon Division
ne purpose ofthe Taylor tests was the sane as at Emerson. to establish an emission factor for VOC~ produced during press operations. The Taylor Press area is approximately 65 feet by 40 f-t. n e presses M side by side, appmhately 20 feet apart. A cumin wall around the p e h eler ofthe press area contains h u t and s l ~ p r o d u d during pressing, and prevents its dissipation into the surrounding - Of the building. The press horizontally-mounted mof fans, numkred 1.2, and 3. The fans an fined with a cowling with 8 slf&sing damper that cloxs the opening when the fan k off.
is ventilated with
In W n m t to the Emerson tests, at Taylor only one vent was ksted, and no tea stack was install& Without a ~ c k , it is more difficult to actutately mwure ai :lev% s, although fw enginering purposes. the 10-15% error which mifit result in ai flow mesiurrment was actcptable for our purposes since this was not a compliance test
Another difference b the press area venting system is the air flows from the fans an much larger
the Emerson fans
As was done at Emerson. only the vent being tested was operating during the t e h Prior to kginning the tea it was c o n f i c d that the single fan war adequately venting the press area. No visible stcam was escaping the 'aic" in the press
the b e m n fans. 7be Taylor fans each discharge about a6000 rfm. ten times more thau -
Table 11 shows the results from the Taylor press tests.
I Table Il Taylor Press Emission Test Results I

. .
I' I I I I I I I* 11-
Figure 2 shows a portion ofthe VOC sh'p chM during the test. Again, both press cycle peaks
n e Taylor emission numbcn arc in g d agreement with those seen at Emerson, especially in the sense that for the numbers to a p e . the concentrations observed at Taylor would have to be less by a factor of at I w t IO (0 compensate for the air flows which were greater by a factor of
visible, the larger peak belonging to the press which is closer to the #2 vent fan.
10. This was, in fact, our observation .. . . -_ __-_.
1-- --_--
Figure 2 VOC Emission tcvels Through Several Presscycles - Taylor Division
i
1- '' i
. . .. . .
!

I
I I I ' I' I I I I I 1. 1, 1, I I
I. I 1
I. .. -
Armstrone Envlronmcntd, Inc
TABLE OF CONTENTS
L Introduction
IL sllmmiuy
IE Procedures
Iv. Appendices
A. ~dculation Summaries
B. AualytiCd Summaries
c. strip chart summaries
D. Field Data Sheets
E. Equipment Cdirations
F. Gas Standard Certifications
G. Production Data . .
. .
Page
1
2 - 5
6
7 - 1 4
1 5 - 25
26 - 44
45 - 5 2
5 3 - 60
61 - 63
64 - 72
I . . i
. .
. . .
~. - . . . .
/&3

Armslmae Eavimamcnul. Ins
I. INTRODUCTION
A series of tests were performed on two press room vents at the Willamette Industries Inc. fhcility m Emerson, AR on February 8 and 9,1995.
m e purpose of this test series was to quantify VOC emissions resulting fiom press operations
Testing followed procedures detailed in T'e 4 0 Code of Federal Regulations (40CFR).
Sampling was performed by Joe Barrera, Dan Barrera and Cody Jefferson OfArmstrong Environmental, Inc. using an Apex Method 5 sampling train and a TECO Model 51
I
I ' I I I I I
- continuousFlD.
Three repetitions were performed on the South West Pressvent #1 commencing at 1:27 PM and ending at 9 1 5 PM on February 8,1995 while manufhaUring 3/4' board. FNC repetitions were performed on the N o d West Press Vent #2 commencing at 823 AM and ending at 354 PM on February 9,1995 , the h two repetitions were performed for VOC only &e manufacturing 314' board, the following three repetitions wen performed for VOC and formaldehyde wMe manufacrUring 5/8" board
Present to witness testing was Tim Jackson from the Arkansas Department of Pollution Control and Ecology.
Submitted by: A m e o n g Environmental, Inc.
MarkPeterson . Environmental Coordinator
I t Joe Barren Projea Manager
. . . . . . .
. . . .
... . ,
.
I
I I I I I I I I I I I I I I I
i I
<.' ,I('
Annstrone Envlronmcntal, Inc.
II. SUMMARY
A series of tests were performed on two press room vents at the Willamette Industries, Inc. hcility m Emerson, AR on February 8 and 9, 1995.
Sampling was performed following procedures detailed m T i e 4 0 Code of Federal Regulations.
Results of this test series are
Emissions rates are as fonows:
* ed m Table 1-3.
Run # 1 2 3 Average South West Press Room Vent W1 3/4" board VOC as Carbon Emissions, Ibdu 2.134 2.111 2.558 2.268
Formaldehyde Emissions, I b h 0.005 0.010 0.012 0.009
North West Press Room Vent #2 3/4" board VOC as Carbon Emissions, l b h 3.745 3.252 NA 3.499
5/8"board VOC as Carbon Emissions, I b h 4.432 4.953 4.086 4.490
Formaldehyde Emissions, I b h 0.026 0.032 0.029 0.029
... .
~. .
2

I I I I I I I I I I I I I I I I I I I
I
SUMMARY OF EMISSIONS TEST DATA
Table : 1 Plant : Wllamene, Emerson, AR
Location : South West Press Vent, 3/4' Board Operator : D. Barrera, C. Jefferson, J. Barrera
Test Date : 8-Feb-95 Repetition : 1 2 3
STACK GAS Temperature, F Velocity, fps Volume flow, acfrn
scfm scfh
Moisture, % c02, % 02, %
81.5 7.56
3030.9 2954.7 177283 1.18%
0.50 20.50
89.3 6.98
2797.5
161229 1.22%
0.50 20.50
2687.1
83.5 7.49
3001.4 2860.4 171627 3.03%
0.00 20.00
SAMPLE Stan l ime, hrs:min 1 :27 PM 2:52 PM Finish Time, hrs:min 2:27 PM 3:52 PM
lsokinetic Ratio, % 99.68962 109.41 92 Sample Volume, scf 35.859 35.795
4:15 PM 5:15 PM
35.944 103.2196
FORMALDEHYDE Sample Weight, mg Concentration, ppm Emissions, Ibs/hr
0.43 0.340426 0.004705
0.88 0.696539 0.009627
1.06
0.01 1582 0.83798
VOC AS CARBON Concentration, ppm 386.4 382.2 Emissions, lbshr 2.134026 2.1 1083
. . , +
3
463.2 2.55818

I
I I I I I I I I I I I I I I I I I I
SUMMARY OF EMISSIONS TEST DATA
Table : 2 Plant : Wllamette, Emerson, AR
Location : North West Press Vent, 314' Board Operator : D. Barrera, C. Jefferson, J. Barrera
Test Date : 9-Feb-95 Repetition : 1
STACK GAS Temperature. F Velocity, fps Volume Flow, acfm
sdm S C f h
Moisture, % c02, % 02, %
SAMPLE Start Time, hrs:min Finish Time, hrs:min Sample Volume, scf
79.2 11.29
4527.1 4276.6 256596 4.12%
0.00 21 .oo
a m AM
21.678 9:23 AM
VOC AS CARBON Concentration. ppm 468.6 Emissions, Ibshr 3.745824
... .
2
83.3 10.62
4258.3 3924.3
235460 5.74%
0.00 21 .oo
9:3a AM io:3a AM
21.397
443.4 3.25243
4

SUMMARY OF EMISSIONS TEST DATA
I I I I I I I I I
I I I I
I
i
!
i ~-
Table : 3 Plant : Wllamette, Emerson, AR
Location : North West Press Vent, 518' Board Operator : D. Barrera, C. Jefferson, J. Barrera
Test Date : 9-Feb-95 Repetition : 1 2
STACK GAS Temperature, F Velocity, fps Volume now, acfm
scfm scfh
Moisrure. % c02, % 02. %
SAMPLE Stan lime, hrs:min Finish lime, hrs:min Sample Volume, scf lsokinetic Ratio. %
85.4 12.98
5204.1 4852.1 291 128 3.49%
0.00 21.00
85.8 13.65
5470.8 5073.0
304379 3.95%
0.00 21 .oo
12:19 PM 1 :40 PM 1:19 PM 2:40 PM 60.795 63.525
103.3771 103.317
FORMALDEHYDE Sample Weight, mg 2.47 3.07 Concentration. ppm 1.1 481 97 1.429849 Emissions, Ibshr 0.02606 . 0.032452
VOC AS CARBON Concentration, ppm Emissions, Ibshr
488.7 546.087 4.432215 4.952681
5
3
86.0
6 0.00
21 .oo
2:53 PM 3:54 PM
0.250 379.1958
2.73 1.269786 0.028819
450.558 4.08629

i I I I I I I I I I I I I I
I
!
I
i
Annstrone Environmental, Inc.
III. PROCEDURES
n e procedure for emissions sampling followed USEF'A test methods as detailed in Title 40: Code of Federal Regulations. 'Ihe fonowing methods were used:
Method Title 1
2
Sample and Velocity Traverses for Stationary Sources
Deterinkation of Stack Gas Velocity and Vohmetxic Flow Rate (Type S Pitot Tube)
Gas Analysis for C02,02 , Excess Air and Dry Molecular Weight
Determination of Moistwe Content m Stack Gas
Deterinkation of Total Gaseous Organic Concentration Using a Flame Ionization Analyzer
Sampling for Aldehyde and Ketone Emissions &om Stationary Sources
3
4
(- 25A
0011
0 2 and C 0 2 were determined using a F M e an-.
Formaldehyde was determined using an Apex Method 5 sampling train Sample was p d e d through a teflon lined heated probe, through a heated filter into a series of four impmgers, the fist two containing 100 mls DNPH each, the third empty and the fourth containing 200 grams silica geL Sample was extracted with a methylene chloride rinse.
performed 100% isokinetic, +/-lo%. . Samples were analyzed with a Dionex HPLC. All formaldehyde repetitions were
I < W O C as C3H8 was determined using a TECO Model 5 1 continuous FID. Sample was
drawn through a heated sample line, through a pump, mto a heated manifold to the back of the FID. The FID was spanned fiom the end of the sample line via tedlar gas bags with 816 ppm, 200 ppm, and 31.9 ppm EPA Protocol 1 C3H8 in N2standards
--
.. .
6

.I I 'I'
I I I I I I I I I I I I c I I I r i
APPENDM A
..

I
I I I I
I
I 1 I I I I i i
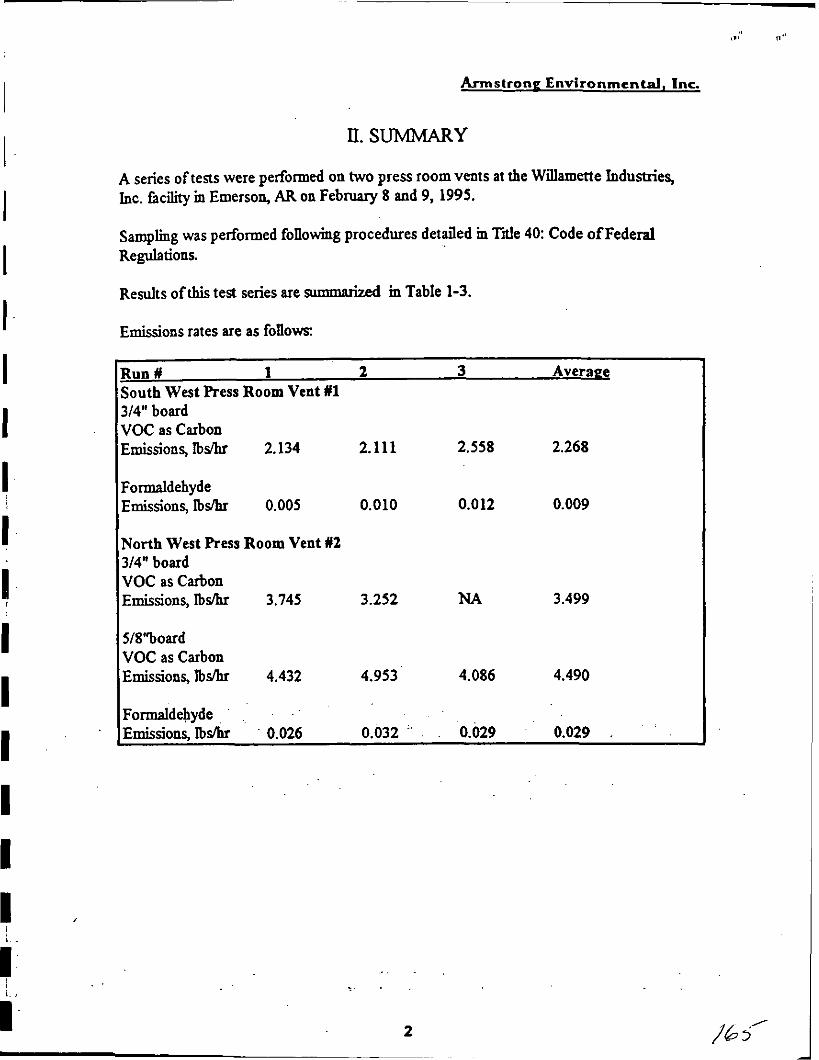
EMISSION TEST SUMMARY
& 0
FOR a R c w STACK
STACK AREA (%.RI :
FOR RECTANOVUR STNX STACK WETER rashk u SrmLENmlndu):
NozaE MEA ( f d E o.Co1358 SrmARE*(Sq.R): 0 6.681319 STAMWDm(indu) :
ENTER THE STAW AREA SHOWN A B O e 6.681319 - -_ FLOWS SAMPLEDVOCUME (STD. CU.Fr.): c35.aSsa-
VOLUME OF WATER VAPOR (STD. CU.Fr.): 0.- m c n o w M~STURE CONTENT% co.orrs,. '- ' E .
DRYBAS€ 79.owo
28.7713 MOLECULAR W l OF STACK GAS (DRY WSQ MOCECUUR WT. of STAW GAS (wtrr
STACK W YELOuTl (IVWCY
28scm
STmPRESSURE (inch Hg). c i % i ) 7 5607
ACTUAL STKK GAS FLOW RATE W): r m L STANDARD STACK GAS FLOW RATE (SCFH): i m m im
mm
1 2 3 4 S E 7 8 9
10 11 12 13 14 15 16 17 18 1s 20 21 P 2) 24
STAWT. DELTAP am^. WTAH drp F
Q 84 n 6n sb' n Q 84 81 62 M 62
0.01 0.01
0.01 0.02 0.m o m 0.m 0.01 0.04 0.02
0.04 0.02 0.02 0.m 0.02 0.04 0.04 0.01 0.01 0.01 0.01 0.01
aoi
o.m
0.1 ai ai ai
ai
0.14141 0.141Ql
0.14141 0.1 02
0.14141 O.lm05
0 2 0.14141 0.14141 0.14141 0.14141
0 2 0 2 0.1 0.1 0.1 0.1 ai
i.m
1.m
1.m 1.m
1.m 1.m 1.00 1.00 1.m 1.m 1.00 1.m
813 0.133s 1.oooo
METER 1. INLET
58 '57
59 59 .60 e1 62 g2 62 62 63 m
6o.m
7
METER T. MINT
n 51 n ss . .
METER T. AVERAGE
59.1661 59.m
/ 7 /

I I I I I I I I I I I I
I I I
I
as a0.S
0
FCR a R c w STACK
STACK AREA(sq.FLl :
FOR RECTANGVLAR STACK STACK DlAMmR (inch): 35 S T A c K L E N C i m i i l :
NOZZLE AREA (fed): o.mxes STACX AREA (ss.n) : 0 6.681339 STACKWIDlH(lnchw) :
EWEFC~~ESTACKAREASHOWNABOVE: 6.681339
FLOWS SAMPLU)VOLUME(SX). CU.FT.): 35.7945
0.4425 m c n o w MO~SNRE CCMENTW): o.orz.
DRYBASE: 7s.m 28.9000 28.7688
VOCUME OF WATER VAPOR (SlD. CUR.):
UOCECULAR WT. OF STACK GAS (DRY WSEk MOLECULAR WT. OF STACK GAS W ersE):
STACK PRESSURE Onch Hob 6.9783
2797.48156 161228710
ACNM STACK GAS ROW RATE (ACFM):
1 2 3 4 S E 7 8 Q
10 11 12 13 14 IS 16 17 18 19 20 21 72 P 24
90 aa 87 90 08' es 89 87 %3 s4 08 09
0.02 0.14141 0.01 0.1 0.01 ai 0.01 ai am, 0,14141 0.02 a14 i~v 0.01 a1 0.01 a 1
0.0) o . i m
0.01 0.1 0.m 0 . 1 m
0.04 0 1 0.01 0.1 0.02 0.14141 0.m 0.14141 0.02 0.14141 0.02 0.14141
0.01 0.1 0.01 ai
0.01 ai 0.01 ai
0.01 0.1
0.01 0.1 0.01 0.1
1.m 1.00 1.m 1.m 1.m 1.m
1.m 1.m 1.00 1.m. i.m
1 .a
€4 59 E1 E1 El E1 Q Q 63 E4 63 63
E1 61 60 E1 El 61 E1 '
E1 61 Q 63 62
METER 1. A M
8
I I I I I I I I I I I I I I I
I i
0 a0 0
FOR URCUUR STACK STACK M E T E R @€hi: 35 STACKWGM(lrrh.): STACX AREA (S4.R) :
FOR RECTANOUUR STACK
6.681339 sTAu(WDlWkh¶) : NOZZLE AREA (fsy: o.mifsb STM(AREA(%R): 0
ENTER THE STACK AREA M W N ABOVE
FLOWS
6.681338
SAMPLED VOiuME Ism. CU.Fr.t 35.9440 1.1254
FR*Ci loNu MUSNRE CO"l Dtlr 0.- VOLUME OF WATER VWOR (STD. W.FT.k
. . DRY LUISE: 8O.O0(30
28.woo 28,4722
MOLECULAR W. OF STACX GAS (DRY RASE): MOLECULAR WT. OF STACK GAS m RASE):
302707 7.4970
A C N N STACK & FL& RA+ (ACFM): 5001.38728 171626.7l7 STANDARD STACK W FLOW RAE 1-
PClNTs STACXT. OELTAP OVARR DELTAH MEERT. METERT. F INLET OVREl
1 2 3 4
, 5 . 6
7' 8 9
10 11 12 13 14 15 16 17 18 19 20 21 22 2)
24
118 08 a3 Q (Is e4 (Is Q a3 82 81 8O
83.5
0.m 0.14141 1.00 58 0.01 ai 1.00 r) 0.01 ai 1.00 60 0.07. 0.14141 1.00 60 0.m O.14M1 1.00 60 0.01 ai i .oo 60 0.m ' ai 1.00 60 0.01 0.1 1 00 60 0.m 0.14141 1.00 60 o.m o.imas 1.00 60 0.04 Of 1.00 59 0.04 Of 1.00 r) 0.01 0.1 0.02 0.14141 0.02 0.14141 0.m 0.14141 0.01 0.1 0.01 0.1 0.01 0. f 0 a1 a 1 ... . -. . 0.01 0.1 0.02 ai4141 0.m 0.1- 0.03 0.1-
9
58 58 59 98 58 58 58 sa sa 58 57 57
1.73
I I I I I I i I I
!
I I I I I I I
I
I 1
i I
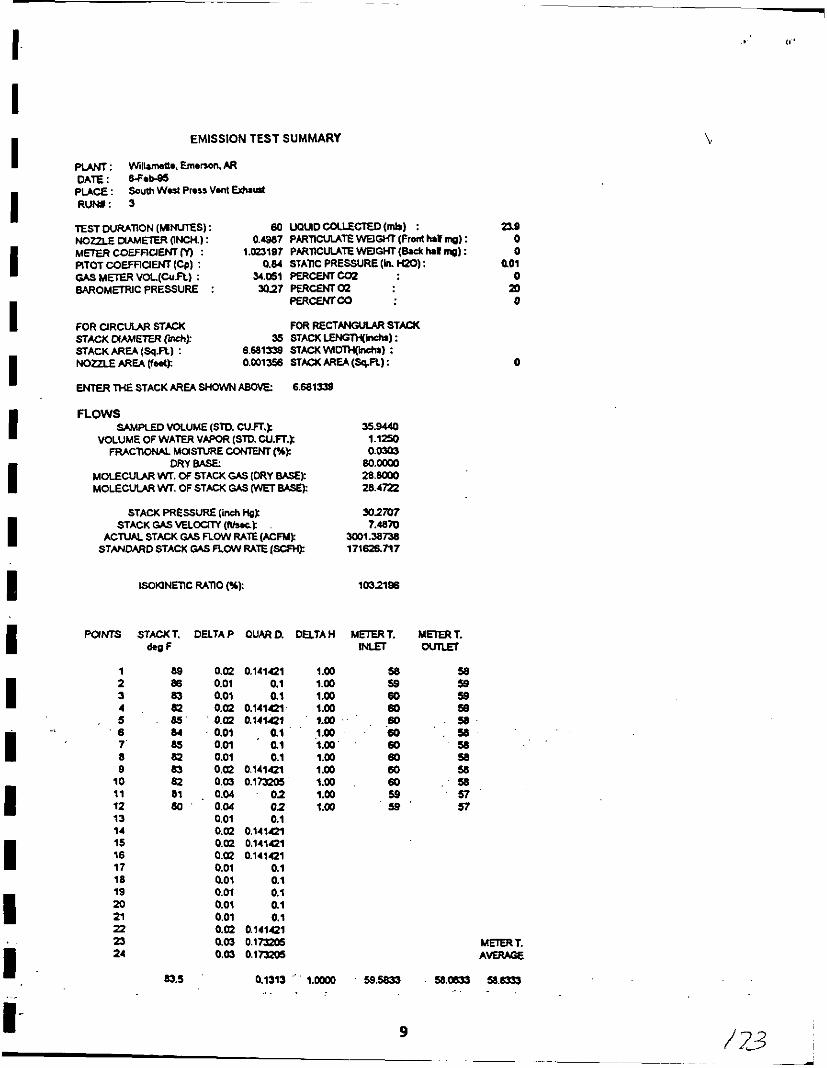
EMISSION TEST SUMMARY
PLANT : VvillrMa. Emenon. AR DATE: S-Feb-85 PLACE: R W : 1
Nonh Wsst PrauVa l , .?fC Botrd
TEST DURATION (MINUTES) : eo uauo COLLECTED (mh) : NOZZLE DIAMETER (INCH) : 0 PARTICUTE WEIGHT (Fm hrl mg) : METER COEFFICIENT m : 1.U23197 PARTICUTE WEIGHT @&Id ma) : FlTOT COEFFICIENT (Cp) : 0.W STAllC PRESSURE (ln. EO) : GAS METER VDL(Cu.Ft.) : Z9.W PERCWTCU2 BAROMETRIC PRESSURE : 3J.l PERCENT02
PERCENT CO
FOR RECTANGULAR STACK FOR CIRCULAR STACK STACK DIAMETER (inch): STACK A R U (Sq.R) : NOZZLE AREA (le&):
ENTER THE STACK AREA SHOWN ABOVE:
FLOWS
55 STACK LENGTH(inchr) : 6.681339 STACKWDTHfinchs) :
0 STACK AREA (Sq.R.):
6.681339
SAMPLED VOLUME (STO. CU.Fr.): G1,Ga VOLUME OF WATER VAPOR (STO. cU.Fr.):
MOLECUIAR WT. OF STACK GAS (Dm We: MOLECUL4R WT. OF STACK GAS WET EASE):
_0;9G20. FRACTIONAL MOISTURE CONTENT 06): r-om2.
om BASE: 79.woo 28.m 28.399
STACK PRESSURE (Inch HE): G.l~U29- STACK GAS VELocllY (Waoc): 112929
ACTUAL STACK GAS RCW RATE (ACFM): STANDARD STACK GAS FLOW RATE (SCFH):
C k 7 . f l . c 256598.131
WINTS STACKT. DELTAP aumo. DELTAH METERT. METERT. INLET OUTLEl
1 78 2 82 3 81 4 78 5 , ' 78
' 6 . . '78 7 " 8 9
10 11 12 13 14 15 16 17 18 19 20 21 22 23 24
79.166667 ... .
0.08 0.282&u 1 .50 0.11 0.3316Q 1.50 0.08 0.282843 1.50 0.06 0.244949 1.50 am ( ~ 1 4 1 ~ 1 1.50 0.01 . . ai . . 1.50 0.01 ai . 0.m 0.141QI 0.05 0.p3601 0.07 0.264575 0.08 0.umUs 0.08 0.244949 0.m 0.14141 0.01 0.1 0.01 0.1 0.01 0.1 0.01 0.1 0.01 0.1 ~~
0 . b O . l m 0 5 0.03 O . l m 0 5 0.04 02 0.06 0.244949 0.11 0.331662 0.12 O.*l
0.1980 1.m
4 4 44 4 46 43 47 43 48 U 48 44
19.8 0 0
0.04
& 0
0
METER T. AVERAGE
4.5.- 43.axy) 44.4167
10
I I I I I I I I I I 1 I I C I I I
EMISSION TEST SUMMARY
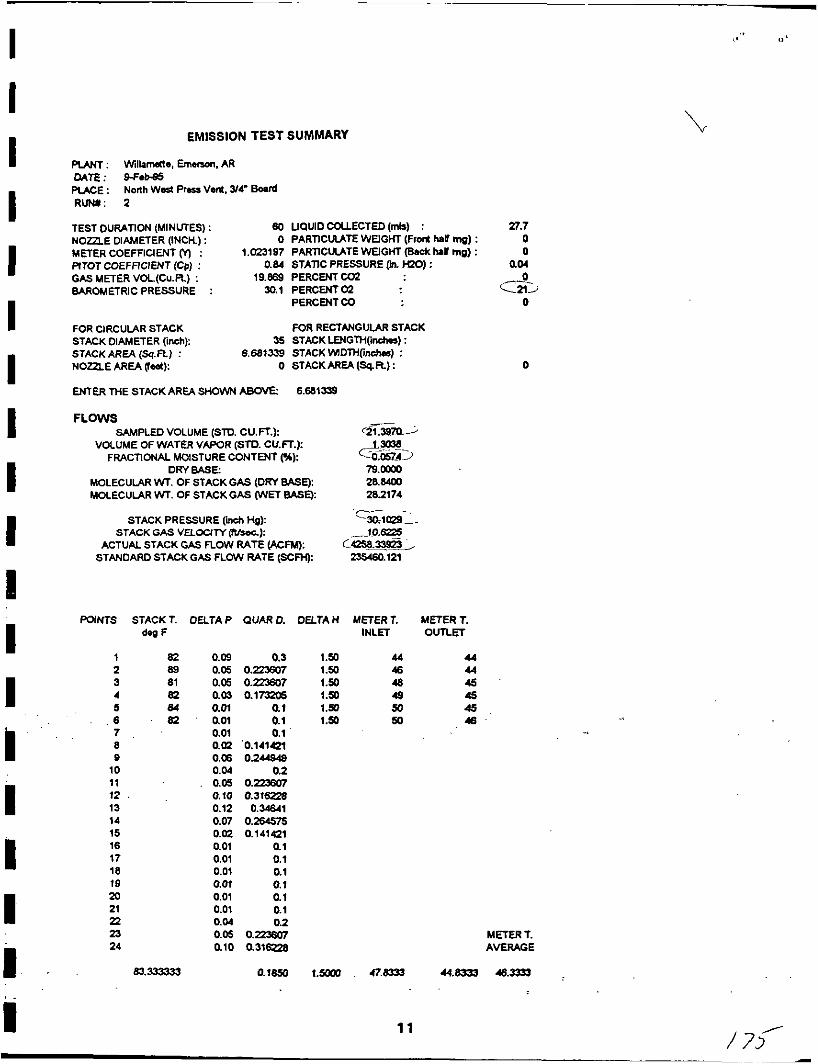
PLANT : Wtlbm&le, Ernenon. AR ME: 9-Fet-S PUCE : R V M : 2
TEST DURATION (MINUTES) : 60 UaUID COUECTED (mh) : NOZZLE DIAMETER (INCH.) : METER COEFFICIENT M : FlTOT COEFflClENT (Cp) : GAS METER VDL(Cu.R) : BAROMETRIC PRESSURE : 30.1 PERCENT02
PERCENTCO
FOR RECTANGULAR STACK
North Wed Pror Vud. 344. Borrd
0 PARTlCUATE WEIGHT (Fro* hal tng) : 1.023197 PARTICUATE WEIGHT (Back half mg) :
0.84 STAnC PRESSURE (h. +QO) : 19.889 PERCENTCU2
FOR CIRCULAR STACK STACK DIAMETER (inch): STACK AREA (Sq.R) : NOZZLE AREA E d ) : 0 STACKAREA(Sq.R):
ENTER THE STACK AREA SHOWN ABOVE
FLOWS
35 STACK LPIGTH(incha) : 8.681339 STACK WDTHOnsha) :
6.601339
SAMPLED VOLUME (STD. CU.FT.1: c21.m-- VOLUME OF WATER VAFiJR ISTD. cU.Fr.): A m
. .
~~
F m c n o w MOISTURE WNTENT w,I C.:O:&d'.:. DRV BASE: 79.oooo
28.m MOLECULAR VVT. OF STACK GAS (DRY BASE): MOLECULAR WT. OF STACK GAS (WET BASQ: 28.2174
STACK PRESSURE (inch Hp): Glme. STACK GAS V E L W N ps0c.j: -10.6pS
ACTUAL STACK GAS FLOW RATE (ACFM): STANDARD STACK GAS FLOW RATE (SCnt):
cwL=%L 235460.121
27.7 0 0
a04 0
0 ca;
0
JINTS STACKT. DELTAP d.0 F
I 62 0.09 2 89 0.05 3 81 0.05 4 62 0.03 5 84 0.01
7 0.01 8 0.02 9 0.06 10 0.04 11 0.05 12 0.10 13 0.12 14 0.07 15 0.07. 16 0.01 17 0.01 18 0.01 18 0.01 20 0.01 21 0.01 P 0.04 23 0.05 24 0.10
6 82 aoi
83.33335
OUARD. DUTAH
0.3 1.50 0.P3an 1.50 0.p3607 1.50 o . 1 m 1.50
0.1 1.Y) 0.1 1.50 ai
'0.1414Zl 0.2u948
0.2 0.- 0.316220 0.Wl
0.264515 0.14141
0.1 0.1 0.1 0.1
0.1 0.2
O . m w 7 0.316220
ai
0.1854 1.m
METER T. INLET
44 46 48 49 50 50
METER '. OWLET
44 44 45 45 45 46
METER T. AVERACE
47.8323 44.8333 48.335)
/ 73' 11

I I I I I I I I I I I I I I I I I i- I-
"I ' '0
EMISSION TEST SUMMARY
PLANT : Willamsue. Ememon. AR ME: %eMH PUCE : North we& Pnru vent, sa" Boud R U M : 3
TEST OURAllON IMlNLmSI. 37.9
0.84 STATIC PRESSURE Cn HZ01 : am GAS M m R V O L ( C i F i j : 29.85483 pERc€Nrcoz BAROMETRIC PRESSURE : 0 PERc€Nrm
pERENTC0
& 0
FOR CIRCULAR STACK
STACK AREA (Sq.FL) : 6.681333 STAWWOTH(incb) :
FOR RECTANGULAR STACK STACKMAMEER (inch): 35 sTAu(LENGlH(inchr):
NomE AREA (feet): 0.00135 sTAu(AREA(sq.Ft): 0
EMER THE STACK AREA SHOWN ABOM: 6.Mlf39
> FLOWS SAMPLED VOLUME (STD. CU.Fr..):
VOLUME OF WATER VAPOR (STD. CU.Fr.):
MOLECULAR WT. OF STACK GAS (DRY BASE): MOLECULAR WT. Of STACK GAS (WET BASD:
1.784- m c n o w MCHSTIJRE c o r n (%): 7
DRY BASE: 79.004) za.&Ux) 19.391 .. . .
STACK PRESSURE (inch Hg); ' ' 0 . m 5 ' &-.le%% .... STACK GAS VuoClTy (fth4: ,_'
ACTUAL STACK CAS FLOW RATE (ACFM): ..s?m4.=- '
STANOAR0 STACK WS FLOW RATE (SCFH): ss3578y
POINTS STACKT. DELTAP aum~. D ~ T A H MEIERT. METERT.
1 86 2 86 3 06 4 87 5 87 6 ea 7 85 8 84 9 85
10 84 11 85 .. ..
86 12 13 85 14 86 15 ea 16 87 17 89 18 ea 19 84 20 85 21 ea ~
P 86 23 85 24 84
86
0.11 0.U16B 0.12 0.34641 0.04 0.3 0.07 0- 0.06 0244949 0.05 0.223507 0.02 0.14142l 0.01 0.1 0.01 0.1 0.04 02 0.04 0.3 0.12 0.34641 0.14 0.374166 0.12 0.34641 0.14 0.374166 0.13 O.SCS55 0.08 02- 0.01 0.1 0.01 0.1 0.01 0.1 0.01 0.1 0.02 0.141421 0.04 02 0.05 0.223507
5.60 6.10 4.50 3.50 am 250 1.m as1 051 2m 4.60 8.10 7.10 8.10 7.10 6.60 4.10 0.51 0.51 0.51 0.51 1.m zm 250
3zss2
56 56 n 56 57 55 59 56 60 55 ., 60 -55 6l 55 60 56 61 56 60 56 6l 55 61 55 61 55 61 56 61 56 61 56 61 57 61 57 Q 57 62 57 Q 57 62 57 ~- .. 62 57 METERT. Q 57 AMRAGE
60.- : 56.0417 53-
12

I I I I I I I I I I I I I I I I I i i-
EMISSION TEST SUMMARY
W : Willamstt.. EmeMn. AQ DATE: 9-Feeb-95 p(AcE : RUNS: 2
North WeA Prsu Vent Ytr b a r d
TEST DURATION (MNLITES) : 60 UQUD COLLECTED (me) : 55.5 NOZZLE DIAM€ER (INCH.) : MEiERCOEFnUENTW : 1.053197 p m n c u m ~ w m ~ w ~ m s k w t w : 0 RTOT COEFFIUEM (CP) :
0.4976 PcIRTIWlAlE WOGM (Front bl mp) :
0.84 STAVC PRESSURE (In. WO) :
BAROMETRICPRESSURE : 2 9 . W PERCPTTOZ PERCEM co FOR RECTANGULAR STACK
0
0.02 GAS MEERVOL(CU.FL) : 60.u PERcEMu)2 C-2
0
FOR a R c u w STACK STACK aAMEiER (inch): STACKAREA(Sq.Ft) : 6.68133s STACKWIDTH(insha) :
35 STACK LENGTH(inch@s) :
NOZZLE AREA (leet): 0.00135 STACKAREA(Sq.R): 0.
ENTERTHESTACKAREASHOWNABOM: 6.681333
FLOWS SAMPLED VOLUME (STD. CU.FT.):
VOLUME OF WATER VAPOR ISTD. CU.Fl.k 26124 .. . ..-~ _. m c n o w MOISWRE c o m ( w ' ... 0:- ..
DRY BasE 79woo 28.8400 28.4118
MOLECULAR WI. OF STACK GAS (DRY W: MOLECUM WI. OF STACK GAS N %SEI:
STACK PRESSURE linsh Hok C%.sssJ./ . -~ ~ ~ - ,~ ~
STACK GAS VELOClM ((vYs5 ,.. 13.6470 c54p?F24 A C N M STACK GAS FLOW RATE (ACFM):
STANDARD STACK CAS FLOW RAE (SCFH): 304379.147
<.lW.3170 , - - - isormmc wno (u):
P a M S STACKT. DELTAP N A R D . DELTAH M-1. MEIERT. dsg F
1 81 2 e3 3 83 4 87 5 86 6 08 7 86 8 08 9 84
10 88 .. ~~
11 85 87 12 87 13
14 86 87 15
16 83 17 86 18 85 19 84 20 e6 .. ~~
21 08 22 87 23 85 24 82
85.E
0.12 0 . w 1 6.10 0.12 0.34641 6.10 0.10 0.316228 5.10 0.06 0.244949 3.00 0.05 0223607 250 0.02 0.141421 1.00 0.01 0.1 0.50 0.01 0.1 0.50 0.m 0 . 1 m 1.50 0.06 0244949 3.00 0.08 0282843 4.10 0.13 0.3€G5!jS 6.60
0.16 0.4 8.10 0.14 0.374166 7.10 0.14 0.374166 7.10 0.m 0.3 4.60 0.01 0.1 0.50 0.01 0.1 0.50 0.01 0.1 0.50 0.01 0.1 0.50 0.m O . l m 0 5 1.50 0.05 0223607 250 0.03 0.1- 1.50
0- '3.4167
0.15 0 . ~ 8 ~ 9 8 7.60
INLEI
52 54 58 59
-, 5s sa 60
60 60 60 60 60 60 60 60 60 60 61 61 E1 82 62 62
59.5833
60
OURET
Q Q 52 5-3 53 53 55 5-3 54 54 55 55 55 55 55 55 55 56 56 56 56 58 57 MEERT. 57 AVERAGE
54.5ooo 57.0417
13
.. . , " ' ' I

I I I I I I I I I
EMISSION TEST SUMMARY
PLANT : Wbmette. Emerson. AR ME: Web-% PUCE : RUM: 1
Norm West Preu Vent. 518' Bord
E S T WRATION ( M I N E S ) : 60 uauDCoUECTED(mh) : NOmE UAMETER (INCH.) : 0.49m P m n c u u E wmw ( F I ~ haf : METERCOEFFI~ENTM : Pmrr wmaGr (cpi : CLS METER VOL(Cu.Ft) : 57.567 PERCENTco2 BIRDMETRlCPRESSURE : 29- PERCENT-
PERCENT to
FOR RECTANCUUR STACK FOR QRCUUR STAM STACK W E E R (inch): 35 STACK LENGTHonsta) : STACK AREA (Sq.FL) : 6.681339 STACKWDTH(incb) : NO= AREA (feat): 0.00135 STACKAREA(Sq.Ft):
ENFER THE STACK AREA SHOWN AEOVE!
FLOWS _ _
6.681339
r . ~. SAMPLED VOLbME Isx). CU n t
VOLUME OF WATER VAWR (SlD CU m.). .607951__
21862 FRACnONU MaSNRE CO"ll.AI: CSi@> . . -~
DRY 79.Mxa 28.84m 28.4617
MOLECULAR WT. OF STACK GAS (DRY EASE): MOLECUUR WT. OF STACK GAS (WET BASE):
----_ STACK PRESSURE (Inch Hp):
STACK GAS MLoupl (fIkeC.1: 129817
%Tf27;6 ACNAL S T A M GAS FLOW RAE (ACFM):
STANDARD STACK GAS FLOW RATE (SCFH): m:w.,
I I I I I
i:
Pam STACKT. DELTAP QUMD. DELTAH METERT. INLET
1 2 3 4 5 6 7 8 9
10 11 12 13 14 15 16 17 18 19 20 21 22 23 24
dsp F
(15 e6 84 89 87 88 89 89 87 87 07 e6 87 ea 85 84 84 82 en 78 79 8)
87 88
(15.375
0.13 0.360155 0.11 0.331662 0.10 0.315228 - 0.06 0264918 0.04 02
. aoi 0.1 0.m 0.14141 0.04 0 2 0.07 0264575 0.08 02Ez843 0.09 0.3 0.03 0.1zJX)s 0.11 0.331662 0.09 0.3 0.07 0264575 0.04 02
0.01 0.1 0.01 0.1 0.01 0.1 0.m 0.14141 0.m 0.14141 0.10 0.316228 0.11 0.331662
. 02257
0.01 o.imo5
8.60
5.10 3.00
0.51
5.60
tm 1.00 200 3.50 4.10 4.60 1.50 5.60 4.60 3.50 203 1.50 0.51 0.51 0.51 1.00 1.00 5.10 5.60
29558
49 51 53 56 56 55 56 56 57 57 57 58 57 57 58 57 57 57 58 58 58 58 58 58
562917
METER T. MlTLET
M 50 50 51 51
' 51 .51 51 51 50 51 52 a 52 a 52 Q a 53
46.7 0 0
0.m
& 0
0
. .
53 53 53 53 METERT. 53 AvERAtE
51.8250 53.9583
I 1 4
APPENDIX B
. . . .
. .
. . . ... . .
,
1 ‘I1
I I I I I I I I I
I I 1 I I
i.
I 4
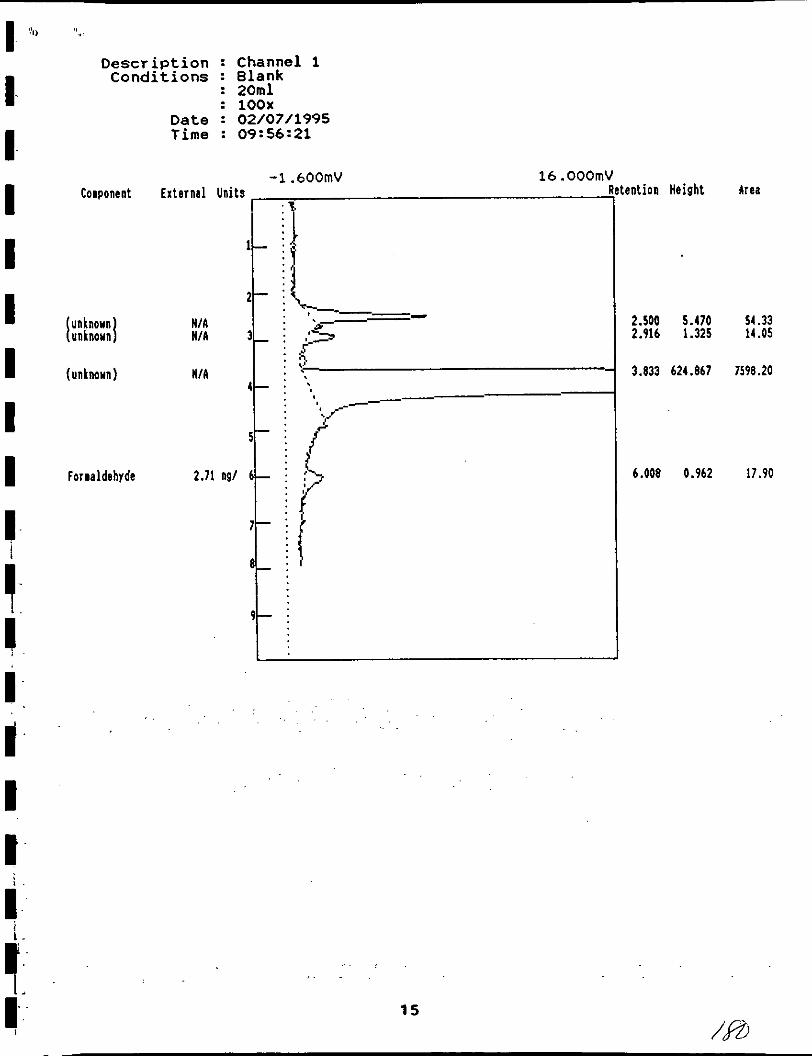
Descriplion : C h a n n e l 1 C o n d i t i o n s : B l a n k
: 201111 : l O O X
D a t e : 02/07/1995 T i m e : 09:56:21
Component
Forialdehyds
- 1 . 6 0 0 m V 1 6 . 0 0 0 m V External Units I
2.71 ngl 6 i
... . ... .
ent ion Height
2.500 5.170 2.916 1.325
3.833 6 2 1 . w
6.008 0.962
Area
54.33 14 .OS
1598.20
17.90
15

I I I I I I I I I I I I I I I I I I I
Description : Channel 1 Conditions : Willamet
: Blank 2\8\95 : 250 ml ext : zoox dil
Date : 02/11/1995 Time : 13:29:25
Component
(unknown)
(unknown)
External
16
:ention Height Area
2.125 1.256
3 . 7 4 119.156
15.25
1371.50

,"I1 I - I I I I I I I I I I I I
I I I
i
i
I
Description : Channel 1 Conditions : Willamet
: Formaldehyde Std 753 ns/ml Date : 02/11/1995 Time : 13:37:47
Cowonent
(unknown) (unknoun) (unknown)
(unknown)
(unknown)
Formaldehyde
(unknown)
(unknown)
-51.200mV 512.000mV External Units
NIA
NIA
NIA
N l A
NlA
153.13
NIA
NIA
1-
2-
3-
4-
5-
b- nglil
7-
8-
9-
ention Height
2.141 3.355
2.725 6.863
3.208 6.134
3.133 18.919
4.541 2.888
5.733 226.897
7.333 14.470
8.033 2.230
17
Area
39.69
133.32
64.17
220.03
54.68
4130.72
251 SO
42.92

I I I I I I I I I I I i
I I
I- i
i
I
I I
I 1
-
Description : Channel 1
Component (unknown)
(unknown)
(unknown)
(unknown)
(unknown)
(unknown)
Forialdehrde
int ion Height 0.000 1.900
2.141 1.665
2.116 1.563
3.133 4.510
4.400 0.900
5.008 8.400
5.141 25.121
I , '
Area 12.15
20.01
23.10
50.50 n 10.45 n
296.55 n 4 9 . 3 8 II
18

I I I I I I I I I I
I I I
I I I
I
I
1.
Description : Channel 1 Conditions : Willamet
: Formaldehyde S t d 7.4 n g h l Date : 02/11/1995 Time : 13:58:47
toaponent
(unknown)
Forialdehyde
intion Height
2.108
5.125
0.786
3.300
Area
13.72
5 . 2 5
. . . . . . .
. . .
19

I I I I I I I I I I
I I
b i
I' I I I
Description : Channel 1 conditions : Willamete Emerson AR
: sw Press Vent Ct: Imps & Line Wash
: 200 Ml : 2 0 0 x Dil
Date : 02/11/1995 Time : 14:09:19
-1.600mV 16.000mi toiponcnt
(unknown)
(unknown)
forialdehrde
ent ion Height
2.716 1.155
3.733 149.821
5.741 4.135
20
A M
14.62
1734.00
68.28
... .
I I I I I I I I I I.
I
i
i ,
I I
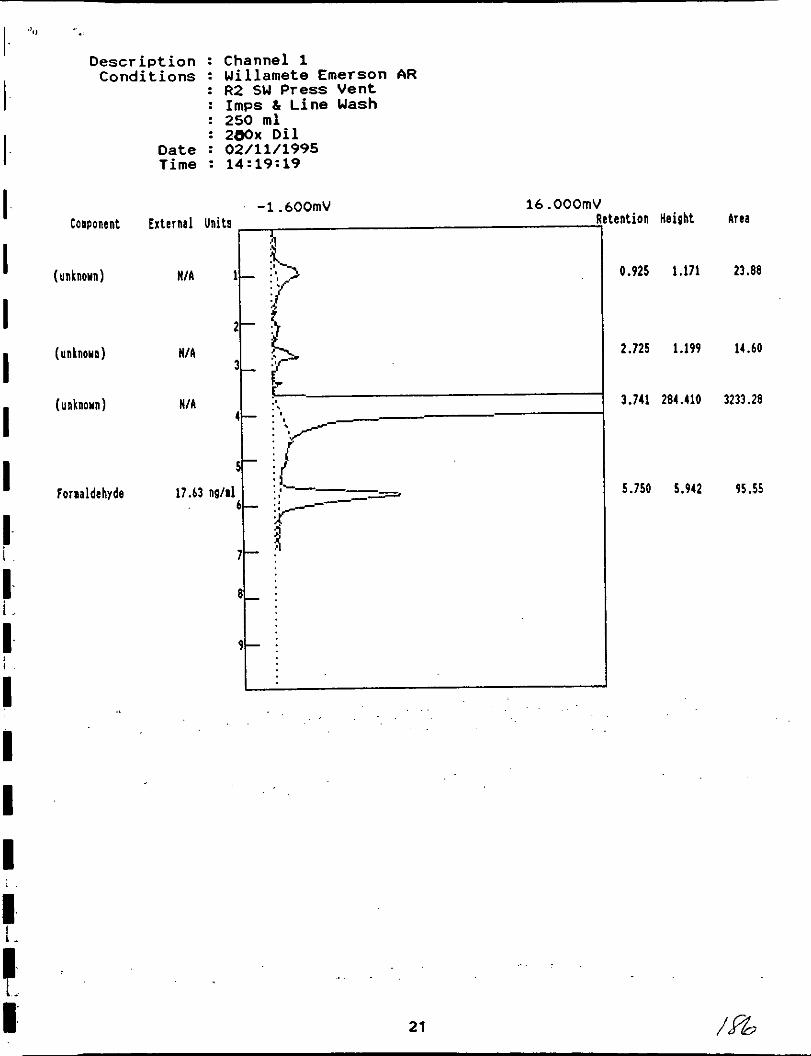
Description : Channel 1 Conditions : Willamete Emerson AR
: R2 SW Press Vent : Imps & Line Wash : 250 mi : 2Wx Dil
Date : 02/11/1995 Time : 14:19:19
Component
(unknown)
(unknown)
(unknown)
forialdehyde
I .
-1 .600mV 16.000m ention Height
0.925 1.171
2.725 1.199
3.741 284.110
5.750 5.942
Area
23.88
14.60
3233.28
95.55
21

I- I I I I I. I I I
8- i
9- 1
I
I
!
I-
I
Description : Channel 1 Conditions : Willamete Emerson AR
: R3 sw Press Vent : Imps b Line Wash : 250 ml : 2 8 0 x Dil
~~~
Date : 02/11/1995 Time : 14:27:12
st-
22
ention Height Arca 0.166 1.924 36.40
2.958 0.824 19.68
3.141 204.191 2361.55
5.133 6.100 108.55
R 7

I I I I I I I I I i
I I I I
Description : Conditions : .
. Date : Time :
Component (unkaoua)
(unknown)
E: t e r nal NIA
“I
Channel 1 Willamete Emerson AR R 3 NW Press Vents2 Imps b Line Wash 250 ml 200x dil 02/11/1995 14: 35 :02
Forialdehyde 49.36 n g h l
-1.600mV 16. OOOml
. . . . . . . .
ent ion Height area 0.200 1.745 35.33
3.741 176.222 2052.10
5.733 13.361 210.88
23

Description : Channel 1 Conditions : Willamete Emerson AR
: R4 NW Press Vents2 : Imps 8, Line Wash : 275 ml : 20ox d i l
Date : 02/11/1995 Time : 14:44:05
-1 .600mV 1 6 . 0 0 0 m \ Component
(unknown)
(unknown)
(unknown)
Formaldehyde
(unknown)
(unknown 1
1 4
WIA
WIA ?=
!ntion Height
1.800 2.105
2.725 1.147
3.141 170.851
5.741 14.589
1.316 5.544
8.050 1.894
Area
56.70
13.15
2004.15
234.95
106.30
36.48
i I
24

I I I I I I I I I
I I I I I I I I
I
i
i
I I
:-
Description : Channel 1 Conditions : Willamete Emerson AR
: R3-5 Boiler : Imps & Line Wash : 425 m l
Component
(unknown )
(unknown)
(unknown)
(unknown)
Formaldehyde
(unknown)
(unknown)
: 2 0 O x dil Date : 02/11/1995 Time : 14:53:57
- 1 . 6 0 0 m V 1 6 . 0 0 0 m V External U n i t s .. N/A . .
't N/A
25
ention Height
0.291 0.534
1.000 1.465
2.133 1.100
3.733 170.663
5.116 9.230
1.308 3.624
8.008 1.11k
Area
11.85
32.40
12.50
2007.41
148.18
68.45
22.95
I- I I I I
I. I
I- I I
1
APPENDIX c
I

. . . - . . . . . . . .

7 . - I / I '


. . . . . . . . . . . . . . . .
. . . 8 , : : i j . f 1. : ' : . . . . . . . . - - - - - - - .. - ! . i .. -
. . . . . . . . . ....... . . . . . . . . . . . . . . . . . . .
I I ! \ : . : ' ' ! I I I . . . - .-- .
.............. 7.
I. ...... . . . . . . . . . . i: . .

.

I "'

-_
. . . . . . . . . . . . . . . . . . . . . e r r . ( r r r r * r r a a . a

. - . L . . . . . . i i ; ' i L . . . 2. . L 4 i i i i i ' i i I I I I I I 1 , , . . . . . . - . . -.,. . . . .... . .. .- .- _.., "2 * . ._: ,.:. . ........,. . ,.. , . ,.. ,. . ... .._. .._ ,-.. :-:- .
.. . . . . . . , , . . .' " ",. .. .:.3 4 ... ' '
. .

- .
. . . . ; A ; T~ i . . - . . . . . . . . . . . . ... . . . . ........ .................... ......... ............... . . . . . . . . . . ..... . . . . . . . . . s .~ . __. . . .
35 . .
. .
:-. . . I. . I . .


I:
. . ! : . . i . . . . . . . . . .. . . : : * . j . . I : :. i '
.......... . . . . . . . . . . . . . . . . . . .............. ... . . . , . : . . . . . . ........ ..:_. . . .... .. . . , . . . 37.: . . . .
- - - _ - - - - ~ . ~. ..


. . . . . . . I /;)res, \(e?+ 2 z I:---- . . -.,- ........... ... ...
J/L&&L 4 ..6*. 4 . ... . . - . . . 2 .-. . . . . . . . . . . . . ..... . . . . . . . . . - - .. , . . . . . . . .
. . . . . . . . - . -. . . . . . .
. . . . . . . . . * ! I I ! : , f @ S , t 1 : I : : , 1 1 1 ! ! L l I , . . . ! ! I ! ! . . I . . : . , . i , , , : : r : . . .
. . . . . . . . . . . .. . . . . . . . . . . . . . . . . . . . ......... :_. .... .. ..
. . mJ;’

'., I "
I I ! I I I I ! I I I I I I I I : . I .i ,I I I I ' I ~ I I ; ! I I i 1 I I 1 ' 1 I I i . . . . . . . . . . . . . . . . . . . ..
1..
. . . . . . . . . . . . . . . . . . . . . . . . . . . . . . . . . . . . . . . . . . . . . . . . . . . . . . . . . .-._
. . . .
... . _. . . . . . . . . . . . . . . . . . . . . . . . . . . . . . . . . . . . . . . . . . . . . . . . . . . . . . . ....... . . . . . . .
. .
I , :
. . . . . . : . . I:.. .. ; . ,

... - . ! .
41 ! I I . . . . . . . . . . . . . . . . . . . . . . . . .. .... 2 0 .' " _c.
. . . . .... . i . , ._ -

I
,

. .
. . . . . . . . . . . . . . . . . . . . . . . . . . . . . . . . . . . . . . . . .. :. . . . ... . i . $- i . . . .
. . . . . .
.. . .. ~
.:. . .
. . . . . . . . t-'.'. . : ! : :. , . 1 . . ! ' :. i . , ~
... .. . Y . ,, ,. . . . . . .
. . ... . . . . .: e.. _ _ .... ..... . . . . . . . . . . . . . . . . . . . . . . . . . . . . . . . . . . 4 3 ......... :.: . . . . . . : . . . . . . . . . . . . . . .. . . . . - . :.. . . . . . . . . . .
287 . . . . . . I:..:.. . . :..:.. . .
~~~~ ~ -


I I I I I I I I I C C I] li I' I, I I I I
APPENDIX D
. .
I <' ,
I I I I I I I
I -
II b I' 1, I I i i
i
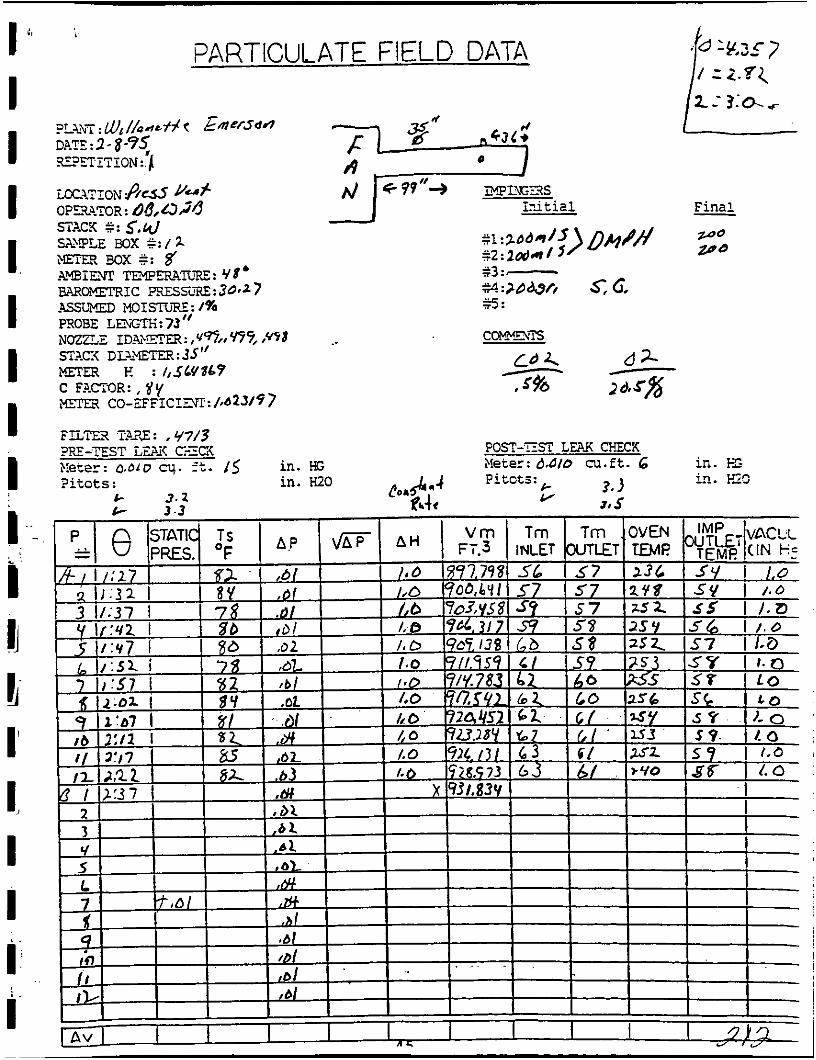
PARTICULATE FIELD DATA
I
..

I I I- I I I I I i
I E
i
PARTICULATE FIELD DATA
.-
POST-EST LE?J OECX Heter: b,&b cu.ft. (. in. E- Pitots:- in. E O
Ir 2.r .b L-

I I I I I I I I I.. '.
PARTICULATE FIELD DATA
MpIhGmS I n i t i a l
POST-FST LEPX CHECK Neter: o.ai0 cu.ft . L ir.. E- I

I I I I - I I I I I 1. I IJ 1. I, 1, I I I I
PARTICULATE FIELD DATA
POST-=.ST L"& CHIC'& Heter: cLl.ft. ir,. E. P i t o t s : is. >ZG

?ARTICULATE FIELD DATA
X t o t s : in. H20 P 3, a

I I I I I. I I I 1 i. i :
i I. I I I i s t
X I
?ARTICULATE FIELD DATA c ”’ ;i’ -
POST-ZST LUX CFECX Metsr: Cu.ft. 6 in. kZ Pitots: 1s. L 3 . .-
y 3.3

I I I I I I. I I I
i
PARTICULATE FIELD DATA
M P X - S S Ini t ia l
$3 fl
C m T S

1 I I I I I I I I I.
?ARTICULATE FIELD DATA
.
/I I " I I I I I I I I I I I I I I I I
APPENDIX E
I

I I I I I I I I I I I I I I I I I i
I I
METER BOX NUMBER: 8 CALIBRATION DATE:2/6/95 CALIBRATED BY:Dan Barrera BAROMETRIC PRESSURE: 29.8
**t**ttt*t*tt****ttt****t*ttttt*tt*tt*t*t**t**t*tttttt* * t t DELTA H = ORFICE PRESSDRg t t VW = VOLUME OF WET GAS METER t
TW = AVERAGED TEMPERA= OF WET METER t * M = VOLUME OF DRY GAS METER * t TD = AVERAGED TEMPERATDRE OF DRY GAS METER *
TIME = DURATION OF EACH POINT RUN t t t t * * * * * t * t * * * * t * t t * t * * ~ t * * t * * t t t * t ~ ~ ~ ~ * * * t * t t * ~ t ~ t t * * t t t
POINT 1 DELTA H = .5 VW = 5 TW = 65.5 VD = 4.762 TD = 63 TIME = 11.75 TEST METER Y = .9701 METER BOX Y = 1.01249 METER BOX H = 1.550931
POINT 2 DELTA H = 1 VW = 5 TW = 66 VD = 4.739 TD = 65.5 TIME = 8.310001 TEST METER Y = .9701 METER BOX Y = 1.020039 METER BOX H = 1.547048
POINT 3 DELTA H = 1.5 VW = 10 TW = 66 VD = 9.497 TD = 67.5 TIME = 13.64 TEST METER Y = .9701 METER BOX Y = 1.020616 METER BOX H = 1.557084
POINT 4 DELTA H = 2 VW = 10 TW = 66 W = 9.479 TD = 69.25 TIME = 11.97 TEST METEX Y = .9701 METER BOX Y =' 1.024687 METER BOX H = 1.593573
POINT 5 DELTA H = 3 VW = 10 TW = 66.5 W = 9.425999 TD = 70.25 TIME = 9.72 TEST METER Y = .9701 METER BOX Y = 1.028889 METER BOX H = 1.576206
POINT 6 DELTA H = 4 VW = 10 TW = 67 VD = 9.387999 TD = 71.75 TIME = 8.390001 TEST METER Y = .9701 METER BOX Y = 1.032464 METER BOX H = 1.564374
AVERAGE Y = 1.023197 AVERAGE H = 1.564869
r.

I I I I I I I I I I I I I I I I
!
M e k fcx Cal ib ra t i cn
i ..
i
I ... .
54 ~

-I I ARMS T RO NG ENVI RONMEN T A L ; I N C .

I ' *
I I I I I I I I i
I
Meter #
P1
p",
P3
PI
P2
P3
I
56
I I I I I c I I I I I I I I I I I i I
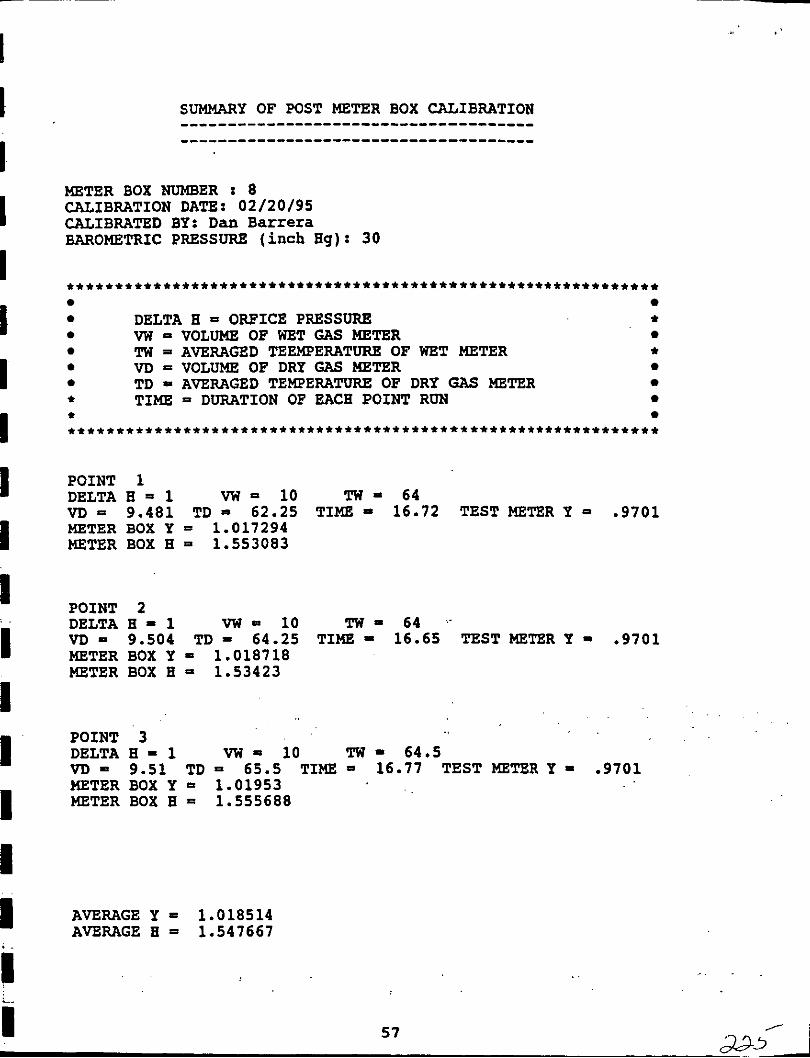
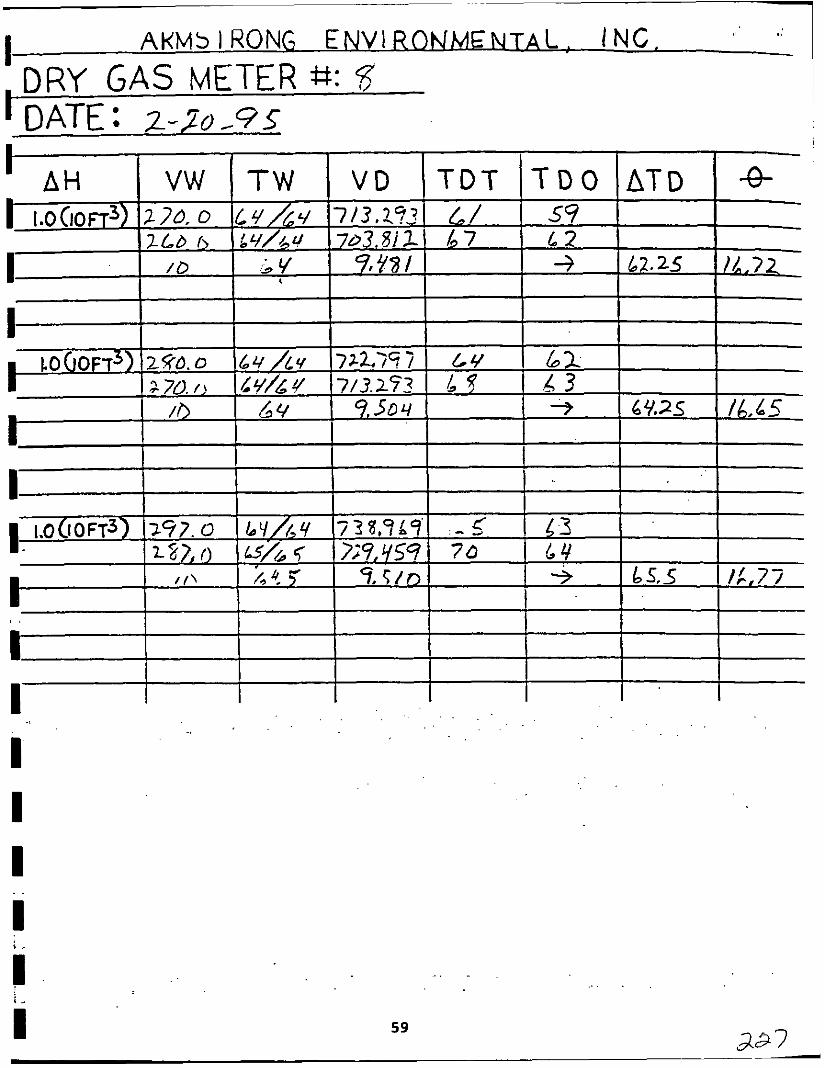
METER BOX NUMBER : 8 CALIBRATION DATE: 02/20/95 CALIBRATED BY: D a n Barrera BAROMETRIC PRESSURE (inch Hg): 30
***********t************tt*******t******~****tt*********~***~*
DELTA H = ORFICE PRESSURE * VW = VOLUME OF WET GAS METER TW = AVERAGED TEEMPERATDRg OF WET METER * VD 5 VOLUME O F DRY GAS METER TD AVERAGED TEMPERATURE OF DRY GAS METER
t TIME = DURATION OF EACH POINT RUN t ***t**************t***********t*~**t********~*****************
POINT 1 DELTA H = 1 vw = 10 TW - 64
METER BOX Y = 1.017294 METER BOX H - 1.553083
VD 9.481 TD 62.25 TIME 16.72 TEST METER Y 0 - 9 7 0 1
POINT 2 DELTA H = 1 vw = 10 T W - 64 . VD = 9.504 TD = 64.25 TIME 16.65 TEST METER Y . 9701 METER BOX Y - 1.018718 METER BOX H * 1.53423
POINT 3 DELTA H = 1 vw - 10 TW = 64.5 VD = 9 . 5 1 TD = 65.5 TIME - 16.77 TEST METER Y .9701 KETER BOX Y - 1.01953 METER BOX H = 1.555688
AVERAGE Y = 1.018514 AVERAGE H = 1.547667
57

I I I I I I- I I I I I
P o s : -Test Meter Box C a l i b r a t i o n
Dry Gas Meter # : $ C a 1 i b r a t e d b y : 000 b / / r / v D a t e : 2-20-95 Barometr ic P i e s s u i e : J b , d
V F + 1160) ) = w bEz ('d F + AH) ( T w + 460
"n
'd ( bar 1cT6 0.0317 AH
AHQ ' p ( T d + G O ) bzs . . - I 62sometric P r e s s u r e bar P
i .
58
1 I AKMb I RONG ENVI RONMENTA L, I N G .
I I I 1
I 1 I I I I I I
I I I
' _
59

?l 32Fi460-492B
P2 112F-460-6723
I; PI I
iJ2
P3 1 - I
I
60

APPENDIX F
. . . .
I
I - I I I
I I I t I I
I t
i I i.
I W'I
.
L
5 e
c - i
-

A B PRODUCTS 4822 INDUSTRY LA.?.? DUFfHAM,NC 27713
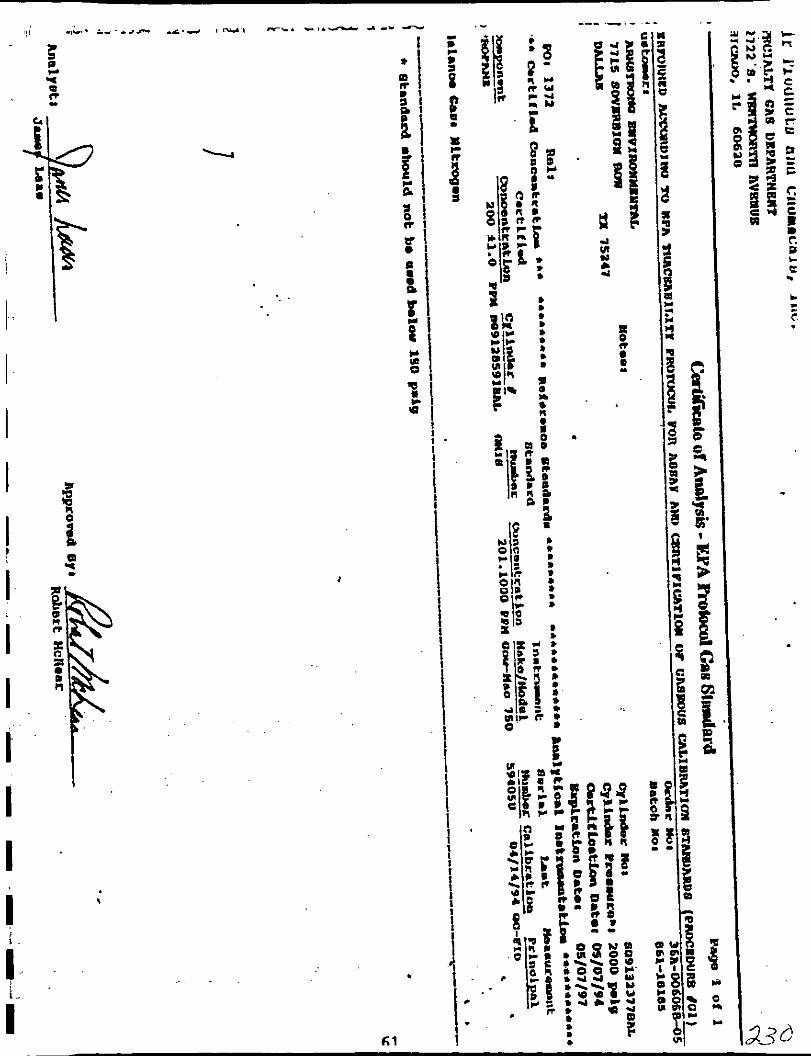
C E R m C A T E OF ANALYSIS-EPA PROTOCOL m s REFEFZXCE #: 88-23474 ' (=yLINDER #SG9113709 CYL. PRESSURE: 2000PSIG
EXPlRATION DATE:4-7-96 LAST ANALXSIS DATE: 4-7-93 BATCIM 05868
C u S T o m k AIR PRODUCTS P.0.B DALLAS.TX. 75233 METHOD EFA PROTOCOL # 1 3.0.4. Gl
STANDARD:
sm#: 264.6
cn #: FF27134
CONC.: 1001 PPM VALD DA'E27-18-92 EXPIR. DA'JE7-18-96
INSTRZWNT:
COMPONENT. B E C W "€IC
MODEL #: 400
SERLG #: 1003052 i I I
LAST CAL.: 4-2-93
REPLICATE CONC. DATE: .<
corn: C3H8 MEAN CONC: 816 PPM DATE: 4-7-93 '
816 PPM 817 P P M 815 P P M
corn: MEAV CONC:
I REPLICATE CONC. DATE: DATE:
corn: 1 MEAN CONC: I .
REPLICATE CONC. DATE: DATE:
I i .
BALANCEGAS: NITROGEN
62

I I I I I I.
I I I I
!
1
I I
m sc
m
a n D
& 0 N 0.
5 0 C
&
m
I-
2
P n
C m m &
P F E I- 111 0
x G
I
I
63
H a n

APPENDIX G

I I- I I I I I I i
Production Calculations
Buo 1.2.3 3/4' P m
u 8.5 press cycleslhr [see attached charts] x 2 presses x 30 panelslpress = 510 panelfir.
510 panelfir x 61.3 i f , 3/8' basislpanel = 31263 rta/hr
a I s i /
CG.-
Bun 1.2 314' Plmood F e b r u m
8 press cycleslhr [see attached charts] x 2 presses x 30 panelslpress = 480 panelslhr.
480 panelslhr x 61.3 f?, 318' basidpanel = 29424 rta//hr nx, I ,/ 7, j-
-1 c-4 .$
BUO 1.2.3 98' Plywood Febn~ary 9.1995
11.5 press cycleshr [see attached charts] x 2 presses x 30 panelslpress 690 panelslhr. b
T > .I /
?E\\ I
690 panelshr x 50.7 f?, 3/8' basislpanel = 34983 rta//hr
I I I I i

65

i
.

1. 67 2-37


I
69

i : i
71

I
... .
7 2