Embed Size (px)
Citation preview

Reduction of periodic motion artifacts inphotoplethysmographyCitation for published version (APA):Wijshoff, R. W. C. G. R., Mischi, M., & Aarts, R. M. (2017). Reduction of periodic motion artifacts inphotoplethysmography. IEEE Transactions on Biomedical Engineering, 64(1), 196-207.https://doi.org/10.1109/TBME.2016.2553060
DOI:10.1109/TBME.2016.2553060
Document status and date:Published: 01/01/2017
Document Version:Accepted manuscript including changes made at the peer-review stage
Please check the document version of this publication:
• A submitted manuscript is the version of the article upon submission and before peer-review. There can beimportant differences between the submitted version and the official published version of record. Peopleinterested in the research are advised to contact the author for the final version of the publication, or visit theDOI to the publisher's website.• The final author version and the galley proof are versions of the publication after peer review.• The final published version features the final layout of the paper including the volume, issue and pagenumbers.Link to publication
General rightsCopyright and moral rights for the publications made accessible in the public portal are retained by the authors and/or other copyright ownersand it is a condition of accessing publications that users recognise and abide by the legal requirements associated with these rights.
• Users may download and print one copy of any publication from the public portal for the purpose of private study or research. • You may not further distribute the material or use it for any profit-making activity or commercial gain • You may freely distribute the URL identifying the publication in the public portal.
If the publication is distributed under the terms of Article 25fa of the Dutch Copyright Act, indicated by the “Taverne” license above, pleasefollow below link for the End User Agreement:www.tue.nl/taverne
Take down policyIf you believe that this document breaches copyright please contact us at:[email protected] details and we will investigate your claim.
Download date: 25. Apr. 2020
IEEE TRANSACTIONS ON BIOMEDICAL ENGINEERING 1
Reduction of periodic motion artifactsin photoplethysmography
Ralph W.C.G.R. Wijshoff, Massimo Mischi, Senior Member, IEEE, and Ronald M. Aarts, Fellow, IEEE
Abstract—Periodic motion artifacts affect photoplethysmogra-phy (PPG) signals in activities of daily living (ADL), cardiopul-monary exercise testing (CPX), and cardiopulmonary resuscita-tion (CPR). This hampers measurement of inter-beat-intervals(IBIs) and oxygen saturation (SpO2). Our objective was todevelop a generic algorithm to remove periodic motion artifacts,recovering artifact-reduced PPG signals for beat-to-beat analysis.Methods: The algorithm was retrospectively evaluated on fore-head PPG signals measured while walking on a treadmill. Thestep rate was tracked in a motion reference signal via a second-order generalized-integrator with a frequency-locked loop. Tworeference signals were compared: sensor motion relative to theskin (∆x[n]) measured via self-mixing interferometry, and headmotion (av[n]) measured via accelerometry. The step rate wasused in a quadrature harmonic model to estimate the artifacts.Quadrature components need only two coefficients per frequencyleading to a short filter, and prevent undesired frequency-shifted components in the artifact estimate. Subtracting theestimate from the measured signal reduced the artifacts. Results:Compared to ∆x[n], av[n] had a better signal-to-noise ratioand more consistently contained a component at the step rate.Artifact reduction was effective for distinct step rate and pulserate, since the artifact-reduced signals provided more stable IBIand SpO2 measurements. Conclusion: Accelerometry provided amore reliable motion reference signal. The proposed algorithmcan be of significance for monitoring in ADL, CPX or CPR,by providing artifact-reduced PPG signals for improved IBI andSpO2 measurements during periodic motion.
Index Terms—Accelerometry, correlation cancellation,frequency-locked loop, harmonic model, inter-beat interval, leastmean-squares, motion artifact reduction, oxygen saturation,photoplethysmography, pulse rate, quadrature components,second-order generalized integrator, self-mixing interferometry.
I. INTRODUCTION
PHOTOPLETHYSMOGRAPHY (PPG) is a non-invasiveeasy-to-use optical technology, widely applied to monitor
the cardiovascular and respiratory systems [1]–[5]. PPG mea-sures local changes in microvascular blood volume by emittinglight through tissue [6]. PPG can be used to measure cardiacpulse rate (PR) and peripheral arterial functional-hemoglobinoxygen-saturation (SpO2) [1], [3], [5], [7]. PR can be derivedfrom the cardiac-induced variations in a PPG signal, either inthe time [8] or frequency domain [9]. An empirical calibration
R. Wijshoff and R. Aarts are with the Electrical Engineering Depart-ment, Eindhoven University of Technology, and with Philips Research,Eindhoven, the Netherlands (e-mail: {r.w.c.g.r.wijshoff, r.m.aarts}@tue.nl,{ralph.wijshoff, ronald.m.aarts}@philips.com).
M. Mischi is with the Electrical Engineering Department, Eindhoven Uni-versity of Technology, Eindhoven, the Netherlands (e-mail: [email protected]).
Copyright c© 2016 IEEE. Personal use of this material is permitted.However, permission to use this material for any other purposes must beobtained from the IEEE by sending an email to [email protected].
relates SpO2 to the ratio of the baseline-normalized cardiac-induced variations in two PPG signals obtained at differentwavelengths, typically red and near-infrared [7], [10]–[14].
PPG signals are highly susceptible to motion which hamperstheir use in, e.g., activities of daily living (ADL) [1], [5],[15], cardiopulmonary exercise testing (CPX) [16], [17], orcardiopulmonary resuscitation (CPR) [18], [19]. In ADL, theuse of PPG is for instance researched to detect PR changes inpatients with epilepsy [20], as this can indicate seizures [21].Susceptibility to motion hampers beat-to-beat analysis, e.g.,to obtain pulse rate variability (PRV) [22], or to detect atrialfibrillation [23]. Motion can also affect SpO2 measurements,e.g., causing false positive desaturations during CPX [16],[17]. During CPR, motion artifacts due to chest compressionscomplicate detection of a cardiac pulse in the signal [18],[19]. In this paper, we will focus on quasi-periodic motionartifacts, which is one type of motion artifact that can occur inADL, CPX and CPR. Quasi-periodic artifacts are furthermorerelevant because algorithms may confuse them with a PRcomponent [24].
Removal of motion artifacts to recover artifact-reducedPPG signals has been researched extensively. Various genericapproaches exist for removal of additive periodic motionartifacts using correlation cancelation with an accelerometer asa motion reference [24]–[29]. In these approaches the artifactis estimated by applying a finite impulse response (FIR) filterto a single reference signal and updating all FIR-coefficientsover time. However, quadrature reference signals would bepreferred here, because then only two coefficients are neededper frequency and undesired frequency-shifted componentscancel in the estimate [30], [31]. Wavelength-independentmultiplicative optical-coupling artifacts can be removed from aPPG signal by normalization by a second PPG signal obtainedat a different wavelength [32]–[34]. However, this requires arevised calibration for SpO2. Artifact-reduced PPG signals canalso be recovered using a synthetic reference for the cardiacpulse waveform [35], deriving artifact references from themeasured PPG signals [36], [37], applying a signal decomposi-tion method [38], [39], or averaging several consecutive pulses[40]. However, the approaches without an additional motionmeasurement provide a segmented recovery of the artifact-reduced PPG signal, require a reliable PR measurement priorto artifact removal, or need to detect the individual cardiacpulses in the corrupted PPG signal.
Methods have also been developed focussing on the ex-traction of averaged physiological parameters from motion-corrupted PPG signals. PR has been determined from the PPGsignal frequency spectrum using an accelerometer to identify
IEEE TRANSACTIONS ON BIOMEDICAL ENGINEERING 2
the motion frequencies [41]–[44]. In [44], an artifact-reducedPPG time-trace is also reconstructed, but the reconstruction iswindow-based, and uses per window a single PR selected fromthe PPG frequency spectrum. PR has also been determinedfrom the PPG signal frequency spectrum after artifact removalwith a notch filter at the motion frequency as measured viathe photodiode with the LEDs switched off [45]. Motion-robust SpO2 measurements have been obtained by discrim-inating cardiac-induced arterial and motion-induced venouscomponents based on their different amplitude ratios in thered and near-infrared PPG signals [46], [47]. PR and SpO2
can also be measured more reliably by using the smoothedpseudo Wigner-Ville distribution [48].
In this paper, we focus on a generic approach to removeperiodic motion artifacts to recover artifact-reduced PPG sig-nals for beat-to-beat analysis. We determined the fundamentalmotion frequency from a motion reference signal via a second-order generalized integrator (SOGI) with a frequency-lockedloop (FLL) [49]. We described the motion artifact by aharmonic model of quadrature components with frequenciesrelated to the fundamental motion frequency. With quadraturecomponents only two coefficients need to be estimated perfrequency component, leading to a short filter. We estimatedthe coefficients via a least mean-squares (LMS) algorithm.Quadrature components also prevent undesired frequency-shifted components in the artifact estimate. The motion artifactwas removed by subtracting the harmonic model from themeasured PPG signal. Furthermore, we compare two motionreference signals: sensor motion relative to the skin andbody motion. Motion relative to the skin is an origin ofartifacts in PPG [1], [7], [26], [32], [33], [35]. We measuredrelative sensor motion with a laser diode attached to the PPGsensor using self-mixing interferometry (SMI) [50]–[52]. Theobjective was to gain insight in the amount of relative sensormotion. We measured body motion with an accelerometer.Red and infrared (IR) PPG signals were measured on theforehead while walking on a treadmill to generate periodicmotion artifacts. We used a reflective PPG sensor, becausemeasurement of relative motion is more convenient comparedto a transmissive sensor. Furthermore, a reflective sensor ismore widely applicable than a transmissive sensor [5], [11],[53], [54]. We performed a preliminary validation of thealgorithm only, using a limited data set of thirty measurementsobtained from six healthy volunteers.
II. METHODS A: EXPERIMENT AND MEASUREMENTS
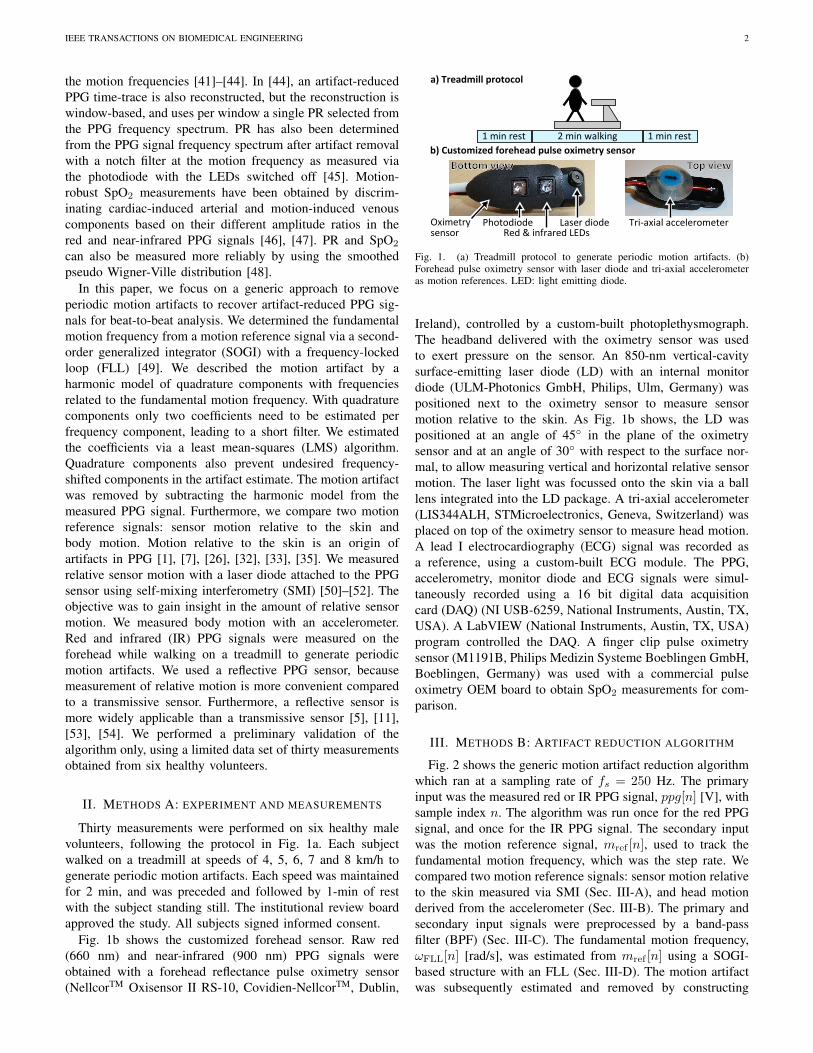
Thirty measurements were performed on six healthy malevolunteers, following the protocol in Fig. 1a. Each subjectwalked on a treadmill at speeds of 4, 5, 6, 7 and 8 km/h togenerate periodic motion artifacts. Each speed was maintainedfor 2 min, and was preceded and followed by 1-min of restwith the subject standing still. The institutional review boardapproved the study. All subjects signed informed consent.
Fig. 1b shows the customized forehead sensor. Raw red(660 nm) and near-infrared (900 nm) PPG signals wereobtained with a forehead reflectance pulse oximetry sensor(NellcorTM Oxisensor II RS-10, Covidien-NellcorTM, Dublin,
a) Treadmill protocol
1 min rest 2 min walking 1 min rest
b) Customized forehead pulse oximetry sensor
Laser diodeOximetry sensor
Tri-axial accelerometer
Top viewBottom view
PhotodiodeRed & infrared LEDs
Fig. 1. (a) Treadmill protocol to generate periodic motion artifacts. (b)Forehead pulse oximetry sensor with laser diode and tri-axial accelerometeras motion references. LED: light emitting diode.
Ireland), controlled by a custom-built photoplethysmograph.The headband delivered with the oximetry sensor was usedto exert pressure on the sensor. An 850-nm vertical-cavitysurface-emitting laser diode (LD) with an internal monitordiode (ULM-Photonics GmbH, Philips, Ulm, Germany) waspositioned next to the oximetry sensor to measure sensormotion relative to the skin. As Fig. 1b shows, the LD waspositioned at an angle of 45◦ in the plane of the oximetrysensor and at an angle of 30◦ with respect to the surface nor-mal, to allow measuring vertical and horizontal relative sensormotion. The laser light was focussed onto the skin via a balllens integrated into the LD package. A tri-axial accelerometer(LIS344ALH, STMicroelectronics, Geneva, Switzerland) wasplaced on top of the oximetry sensor to measure head motion.A lead I electrocardiography (ECG) signal was recorded asa reference, using a custom-built ECG module. The PPG,accelerometry, monitor diode and ECG signals were simul-taneously recorded using a 16 bit digital data acquisitioncard (DAQ) (NI USB-6259, National Instruments, Austin, TX,USA). A LabVIEW (National Instruments, Austin, TX, USA)program controlled the DAQ. A finger clip pulse oximetrysensor (M1191B, Philips Medizin Systeme Boeblingen GmbH,Boeblingen, Germany) was used with a commercial pulseoximetry OEM board to obtain SpO2 measurements for com-parison.
III. METHODS B: ARTIFACT REDUCTION ALGORITHM
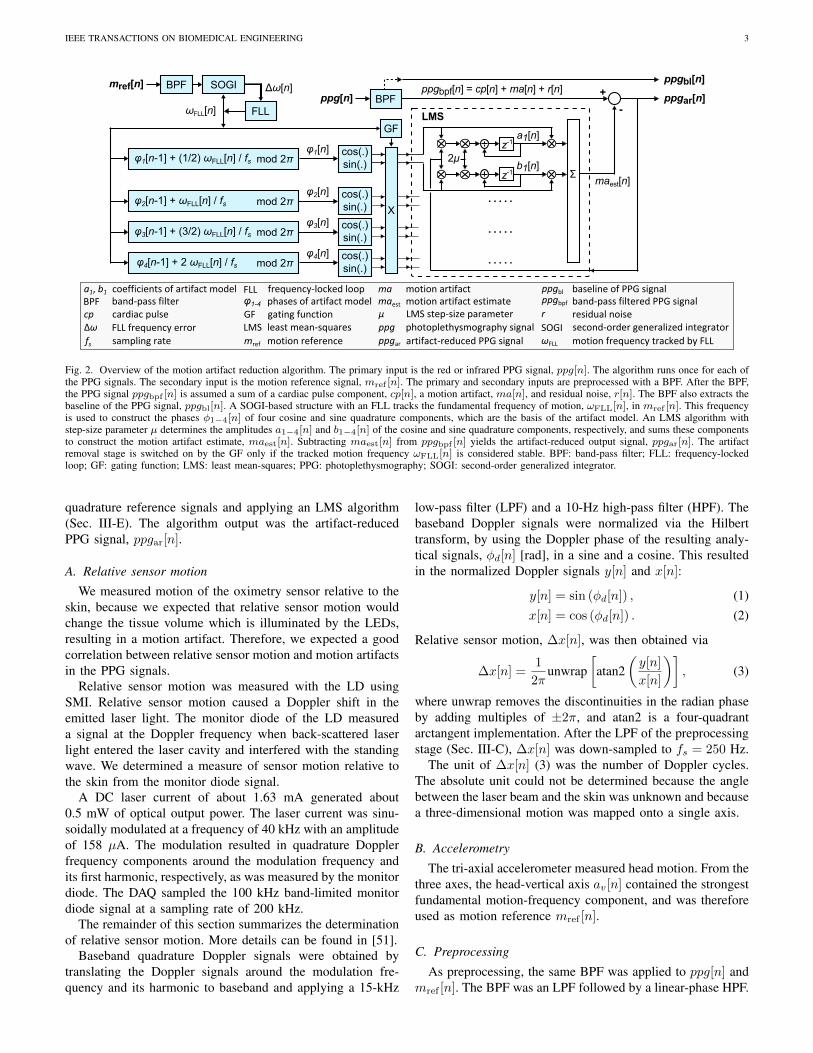
Fig. 2 shows the generic motion artifact reduction algorithmwhich ran at a sampling rate of fs = 250 Hz. The primaryinput was the measured red or IR PPG signal, ppg[n] [V], withsample index n. The algorithm was run once for the red PPGsignal, and once for the IR PPG signal. The secondary inputwas the motion reference signal, mref [n], used to track thefundamental motion frequency, which was the step rate. Wecompared two motion reference signals: sensor motion relativeto the skin measured via SMI (Sec. III-A), and head motionderived from the accelerometer (Sec. III-B). The primary andsecondary input signals were preprocessed by a band-passfilter (BPF) (Sec. III-C). The fundamental motion frequency,ωFLL[n] [rad/s], was estimated from mref [n] using a SOGI-based structure with an FLL (Sec. III-D). The motion artifactwas subsequently estimated and removed by constructing
IEEE TRANSACTIONS ON BIOMEDICAL ENGINEERING 3
φ4[n-1]S+S2SωFLL[n]S/Sfs
φ3[n-1]S+S(3/2)SωFLL[n]S/Sfs
φ2[n-1]S+SωFLL[n]S/Sfs
φ1[n-1]S+S(1/2)SωFLL[n]S/Sfs
FLL
ppgbpf[n]S=Scp[n]S+Sma[n]S+Sr[n]ppgar[n]
LMS
2μz-1
a1[n]
b1[n]z-1
.....
.....
Σ
+
-
maest[n]
ppgbl[n]
ppg[n] BPF
GF
ωFLL[n]
.....
φ1[n]
φ2[n]
φ3[n]
φ4[n]
cos(.)sin(.)
X
cos(.)sin(.)
cos(.)sin(.)
cos(.)sin(.)
modS2π
modS2π
modS2π
modS2π
SOGI Δω[n]mref[n] BPF
ppgar artifact-reducedIPPGIsignal
μ LMSIstep-sizeIparameter
ma motionIartifact
ppg photoplethysmographyIsignal
maest motionIartifactIestimate
motionIfrequencyItrackedIbyIFLLωFLL
residualInoiser
baselineIofIPPGIsignalppgbl
second-orderIgeneralizedIintegratorSOGI
ppgbpf band-passIfilteredIPPGIsignal
fs samplingIrate
cp cardiacIpulse
a1,Ib1 coefficientsIofIartifactImodel
Δω FLLIfrequencyIerror
BPF band-passIfilter
mref motionIreference
GF gatingIfunction
FLL frequency-lockedIloop
LMS leastImean-squares
φ1-4 phasesIofIartifactImodel
Fig. 2. Overview of the motion artifact reduction algorithm. The primary input is the red or infrared PPG signal, ppg[n]. The algorithm runs once for each ofthe PPG signals. The secondary input is the motion reference signal, mref [n]. The primary and secondary inputs are preprocessed with a BPF. After the BPF,the PPG signal ppgbpf [n] is assumed a sum of a cardiac pulse component, cp[n], a motion artifact, ma[n], and residual noise, r[n]. The BPF also extracts thebaseline of the PPG signal, ppgbl[n]. A SOGI-based structure with an FLL tracks the fundamental frequency of motion, ωFLL[n], in mref [n]. This frequencyis used to construct the phases φ1−4[n] of four cosine and sine quadrature components, which are the basis of the artifact model. An LMS algorithm withstep-size parameter µ determines the amplitudes a1−4[n] and b1−4[n] of the cosine and sine quadrature components, respectively, and sums these componentsto construct the motion artifact estimate, maest[n]. Subtracting maest[n] from ppgbpf [n] yields the artifact-reduced output signal, ppgar[n]. The artifactremoval stage is switched on by the GF only if the tracked motion frequency ωFLL[n] is considered stable. BPF: band-pass filter; FLL: frequency-lockedloop; GF: gating function; LMS: least mean-squares; PPG: photoplethysmography; SOGI: second-order generalized integrator.
quadrature reference signals and applying an LMS algorithm(Sec. III-E). The algorithm output was the artifact-reducedPPG signal, ppgar[n].
A. Relative sensor motion
We measured motion of the oximetry sensor relative to theskin, because we expected that relative sensor motion wouldchange the tissue volume which is illuminated by the LEDs,resulting in a motion artifact. Therefore, we expected a goodcorrelation between relative sensor motion and motion artifactsin the PPG signals.
Relative sensor motion was measured with the LD usingSMI. Relative sensor motion caused a Doppler shift in theemitted laser light. The monitor diode of the LD measureda signal at the Doppler frequency when back-scattered laserlight entered the laser cavity and interfered with the standingwave. We determined a measure of sensor motion relative tothe skin from the monitor diode signal.
A DC laser current of about 1.63 mA generated about0.5 mW of optical output power. The laser current was sinu-soidally modulated at a frequency of 40 kHz with an amplitudeof 158 µA. The modulation resulted in quadrature Dopplerfrequency components around the modulation frequency andits first harmonic, respectively, as was measured by the monitordiode. The DAQ sampled the 100 kHz band-limited monitordiode signal at a sampling rate of 200 kHz.
The remainder of this section summarizes the determinationof relative sensor motion. More details can be found in [51].
Baseband quadrature Doppler signals were obtained bytranslating the Doppler signals around the modulation fre-quency and its harmonic to baseband and applying a 15-kHz
low-pass filter (LPF) and a 10-Hz high-pass filter (HPF). Thebaseband Doppler signals were normalized via the Hilberttransform, by using the Doppler phase of the resulting analy-tical signals, φd[n] [rad], in a sine and a cosine. This resultedin the normalized Doppler signals y[n] and x[n]:
y[n] = sin (φd[n]) , (1)x[n] = cos (φd[n]) . (2)
Relative sensor motion, ∆x[n], was then obtained via
∆x[n] =1
2πunwrap
[atan2
(y[n]
x[n]
)], (3)
where unwrap removes the discontinuities in the radian phaseby adding multiples of ±2π, and atan2 is a four-quadrantarctangent implementation. After the LPF of the preprocessingstage (Sec. III-C), ∆x[n] was down-sampled to fs = 250 Hz.
The unit of ∆x[n] (3) was the number of Doppler cycles.The absolute unit could not be determined because the anglebetween the laser beam and the skin was unknown and becausea three-dimensional motion was mapped onto a single axis.
B. Accelerometry
The tri-axial accelerometer measured head motion. From thethree axes, the head-vertical axis av[n] contained the strongestfundamental motion-frequency component, and was thereforeused as motion reference mref [n].
C. Preprocessing
As preprocessing, the same BPF was applied to ppg[n] andmref [n]. The BPF was an LPF followed by a linear-phase HPF.
IEEE TRANSACTIONS ON BIOMEDICAL ENGINEERING 4
-Γmi2[n] + mq
2[n]
1ωFLL[n]z-1+
+
FLL
Hint(z)
Hint(z)
2/τSOGI
+
-
+mref[n] mi[n]
mq[n]
-e[n]
Δω[n]
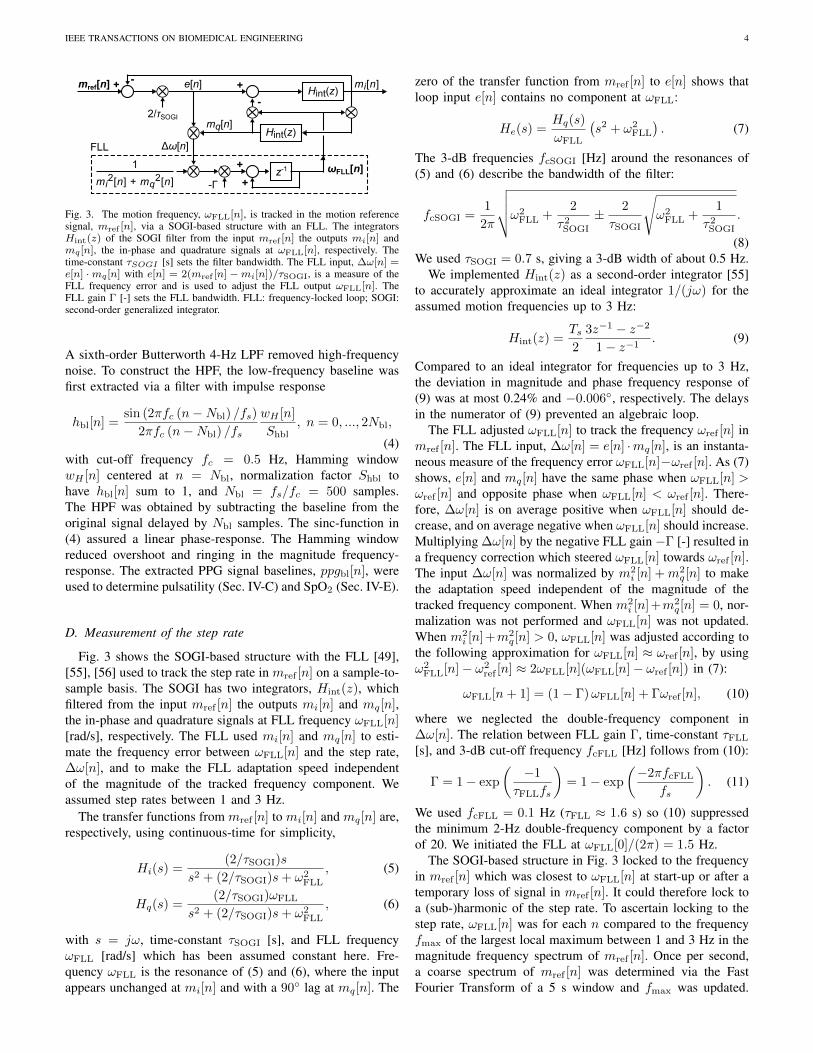
Fig. 3. The motion frequency, ωFLL[n], is tracked in the motion referencesignal, mref [n], via a SOGI-based structure with an FLL. The integratorsHint(z) of the SOGI filter from the input mref [n] the outputs mi[n] andmq [n], the in-phase and quadrature signals at ωFLL[n], respectively. Thetime-constant τSOGI [s] sets the filter bandwidth. The FLL input, ∆ω[n] =e[n] ·mq [n] with e[n] = 2(mref [n] −mi[n])/τSOGI, is a measure of theFLL frequency error and is used to adjust the FLL output ωFLL[n]. TheFLL gain Γ [-] sets the FLL bandwidth. FLL: frequency-locked loop; SOGI:second-order generalized integrator.
A sixth-order Butterworth 4-Hz LPF removed high-frequencynoise. To construct the HPF, the low-frequency baseline wasfirst extracted via a filter with impulse response
hbl[n] =sin (2πfc (n−Nbl) /fs)
2πfc (n−Nbl) /fs
wH [n]
Shbl, n = 0, ..., 2Nbl,
(4)with cut-off frequency fc = 0.5 Hz, Hamming windowwH [n] centered at n = Nbl, normalization factor Shbl tohave hbl[n] sum to 1, and Nbl = fs/fc = 500 samples.The HPF was obtained by subtracting the baseline from theoriginal signal delayed by Nbl samples. The sinc-function in(4) assured a linear phase-response. The Hamming windowreduced overshoot and ringing in the magnitude frequency-response. The extracted PPG signal baselines, ppgbl[n], wereused to determine pulsatility (Sec. IV-C) and SpO2 (Sec. IV-E).
D. Measurement of the step rate
Fig. 3 shows the SOGI-based structure with the FLL [49],[55], [56] used to track the step rate in mref [n] on a sample-to-sample basis. The SOGI has two integrators, Hint(z), whichfiltered from the input mref [n] the outputs mi[n] and mq[n],the in-phase and quadrature signals at FLL frequency ωFLL[n][rad/s], respectively. The FLL used mi[n] and mq[n] to esti-mate the frequency error between ωFLL[n] and the step rate,∆ω[n], and to make the FLL adaptation speed independentof the magnitude of the tracked frequency component. Weassumed step rates between 1 and 3 Hz.
The transfer functions from mref [n] to mi[n] and mq[n] are,respectively, using continuous-time for simplicity,
Hi(s) =(2/τSOGI)s
s2 + (2/τSOGI)s+ ω2FLL
, (5)
Hq(s) =(2/τSOGI)ωFLL
s2 + (2/τSOGI)s+ ω2FLL
, (6)
with s = jω, time-constant τSOGI [s], and FLL frequencyωFLL [rad/s] which has been assumed constant here. Fre-quency ωFLL is the resonance of (5) and (6), where the inputappears unchanged at mi[n] and with a 90◦ lag at mq[n]. The
zero of the transfer function from mref [n] to e[n] shows thatloop input e[n] contains no component at ωFLL:
He(s) =Hq(s)
ωFLL
(s2 + ω2
FLL
). (7)
The 3-dB frequencies fcSOGI [Hz] around the resonances of(5) and (6) describe the bandwidth of the filter:
fcSOGI =1
2π
√√√√ω2FLL +
2
τ2SOGI
± 2
τSOGI
√ω2FLL +
1
τ2SOGI
.
(8)We used τSOGI = 0.7 s, giving a 3-dB width of about 0.5 Hz.
We implemented Hint(z) as a second-order integrator [55]to accurately approximate an ideal integrator 1/(jω) for theassumed motion frequencies up to 3 Hz:
Hint(z) =Ts2
3z−1 − z−2
1− z−1. (9)
Compared to an ideal integrator for frequencies up to 3 Hz,the deviation in magnitude and phase frequency response of(9) was at most 0.24% and −0.006◦, respectively. The delaysin the numerator of (9) prevented an algebraic loop.
The FLL adjusted ωFLL[n] to track the frequency ωref [n] inmref [n]. The FLL input, ∆ω[n] = e[n] ·mq[n], is an instanta-neous measure of the frequency error ωFLL[n]−ωref [n]. As (7)shows, e[n] and mq[n] have the same phase when ωFLL[n] >ωref [n] and opposite phase when ωFLL[n] < ωref [n]. There-fore, ∆ω[n] is on average positive when ωFLL[n] should de-crease, and on average negative when ωFLL[n] should increase.Multiplying ∆ω[n] by the negative FLL gain −Γ [-] resulted ina frequency correction which steered ωFLL[n] towards ωref [n].The input ∆ω[n] was normalized by m2
i [n] +m2q[n] to make
the adaptation speed independent of the magnitude of thetracked frequency component. When m2
i [n]+m2q[n] = 0, nor-
malization was not performed and ωFLL[n] was not updated.When m2
i [n]+m2q[n] > 0, ωFLL[n] was adjusted according to
the following approximation for ωFLL[n] ≈ ωref [n], by usingω2FLL[n]− ω2
ref [n] ≈ 2ωFLL[n](ωFLL[n]− ωref [n]) in (7):
ωFLL[n+ 1] = (1− Γ)ωFLL[n] + Γωref [n], (10)
where we neglected the double-frequency component in∆ω[n]. The relation between FLL gain Γ, time-constant τFLL[s], and 3-dB cut-off frequency fcFLL [Hz] follows from (10):
Γ = 1− exp
(−1
τFLLfs
)= 1− exp
(−2πfcFLL
fs
). (11)
We used fcFLL = 0.1 Hz (τFLL ≈ 1.6 s) so (10) suppressedthe minimum 2-Hz double-frequency component by a factorof 20. We initiated the FLL at ωFLL[0]/(2π) = 1.5 Hz.
The SOGI-based structure in Fig. 3 locked to the frequencyin mref [n] which was closest to ωFLL[n] at start-up or after atemporary loss of signal in mref [n]. It could therefore lock toa (sub-)harmonic of the step rate. To ascertain locking to thestep rate, ωFLL[n] was for each n compared to the frequencyfmax of the largest local maximum between 1 and 3 Hz in themagnitude frequency spectrum of mref [n]. Once per second,a coarse spectrum of mref [n] was determined via the FastFourier Transform of a 5 s window and fmax was updated.
IEEE TRANSACTIONS ON BIOMEDICAL ENGINEERING 5
If ωFLL[n]/(2π) deviated by more than 0.5 Hz from fmax,then ωFLL[n] was replaced by 2πfmax to lock to the step rate,otherwise ωFLL[n] remained unchanged. Frequency fmax wasupdated as unavailable if no local maximum was found, andthen ωFLL[n] remained unchanged too.
E. Estimation and reduction of motion artifacts
We described the band-pass filtered signal, ppgbpf [n], ob-tained by applying the BPF in Sec. III-C to the measuredsignal ppg[n], as a sum of a cardiac pulse component, cp[n],a motion artifact, ma[n], and residual noise, r[n]:
ppgbpf [n] = cp[n] +ma[n] + r[n]. (12)
We chose an additive model, because spectral analysis ofppgbpf [n] showed that walking introduced components at thestep rate and its (sub-)harmonics in ppgbpf [n] in additionto components at the PR and its harmonics. Subtracting themotion artifact estimate maest[n] from ppgbpf [n] gave theartifact-reduced signal ppgar[n]:
ppgar[n] = ppgbpf [n]−maest[n]. (13)
We obtained maest[n] via a quadrature harmonic model:
maest[n] = G[n]
4∑k=1
[ak[n] cos (φk[n]) + bk[n] sin (φk[n])] ,
(14)with gating function G[n] [-], amplitudes ak[n] and bk[n][V] and motion phases φk[n] [rad]. Motion artifact maest[n]was separately estimated for the red and IR PPG signal.G[n] assessed the stability of ωFLL[n]. G[n] was one whenωFLL[n] was considered stable, and zero otherwise. G[n]forced maest[n] to zero when no stable motion frequency wasdetected. We determined G[n] via hysteresis detection:
dfFLL[n] =fs2πHG(z) |ωFLL[n]− ωFLL[n− 1]| , (15)
Gh[n] =
{0→ 1 if dfFLL[n] < 0.1 Hz/s1→ 0 if dfFLL[n] > 0.5 Hz/s , (16)
G[n] = HG(z)Gh[n], (17)
HG(z) =1− exp(−1/(τGfs))
z − exp(−1/(τGfs)), (18)
with τG = 0.2 s. HG(z) tracked the envelope in (15) andsmoothed in (17). We initialized Gh[n] at 0. The phases φk[n][rad] were determined as:
φk[n] = φk[n− 1] +kωFLL[n]
2fsmod 2π, k = 1, 2, 3, 4, (19)
where mod is the modulo operation. Phases were reset toφk[n] = 0 when G[n] < 0.005. The amplitudes ak[n] andbk[n] were estimated via an LMS algorithm [30], [57]:
ak[n+ 1] = ak[n] + 2µG[n]ppgar[n] cos (φk[n]) , (20)bk[n+ 1] = bk[n] + 2µG[n]ppgar[n] sin (φk[n]) , (21)
with step-size parameter µ. Coefficients were reset to ak[n] =0 and bk[n] = 0 when G[n] < 0.005. The LMS-filter transfer-function between ppgbpf [n] and ppgar[n] can be approximated
by a cascade of notch filters at (k/2)ωFLL [30], [57], whereeach notch has a 3-dB bandwidth W [Hz] of about [30]
W ≈ µfsπ. (22)
Furthermore, µ determined the convergence time Tcv [s] to afraction 0 < v < 1 of the targeted values for ak and bk via
Tcv =1
fs
ln(1− v)
ln(1− µ). (23)
Removal of pulses with a PR close to the step rate was limitedto ranges of about (kωFLL)/(4π) ± 1/24 Hz by using µ =0.001, so W ≈ 0.08 Hz ≈ 4.8 min−1, and Tc0.95 ≈ 12 s.
IV. METHODS C: PERFORMANCE EVALUATION
The performance of the artifact reduction was assessed forboth relative sensor motion ∆x[n] and head motion av[n]. Theadequacy as motion reference was assessed by the signal-to-noise ratio (SNR) and the stability of the extracted motionfrequency (section IV-A). The artifact-reduced PPG signalwas assessed for accuracy of the inter-beat intervals (IBIs)compared to the ECG R-peak intervals (sections IV-B, IV-Cand IV-D), and for accuracy of SpO2 (section IV-E).
A. Motion references
The SNR of the motion references was determined as theratio of the root mean square (RMS) amplitude during walkingand rest. The RMS amplitude was determined from ∆xbpf [n]and av bpf [n], as obtained by applying the BPF in Sec. III-Cto ∆x[n] and av[n], respectively. Episodes with outliers in∆xbpf [n] and av bpf [n], caused by touching the head band,were excluded. The stability of fFLL = ωFLL/(2π) wasassessed for ∆x[n] and av[n] in each 2 min walking period bythe standard deviation (SD) of fFLL excluding the first 10 s,and the mean and SD of dfFLL[n] and G[n].
B. R-peak detection
As a reference for the IBIs we used the R-peak to R-peak intervals (RRIs) in the ECG signal, which was sam-pled at 250 Hz and band-limited to 0.5-20 Hz. We detectedthe steepest ascent and descent of the QR and RS slopes,respectively, by applying positive and negative thresholds tothe ECG signal time-derivative. The initial R-peak was foundas the maximum in the ECG signal between the QR andRS slopes. The time instant of the ith R-peak, tR[i], wasfound by interpolating the initial R-peak and its neighbouringsamples with a second-order polynomial. All detected R-peakswere visually inspected. The RRI was determined from theinterpolated time instants as RRI[i] = tR[i]− tR[i− 1].
C. Pulse detection
Pulses were detected in the red and IR band-pass filteredsignal ppgbpf [n] and artifact-reduced signal ppgar[n]. In thefollowing list we use ppgbp[n] to represent one of these foursignals. Pulse detection comprised of the following steps:
• The index of the systolic slope nsl was found as thepositive-to-negative zero-crossing in ppgbp[n].
IEEE TRANSACTIONS ON BIOMEDICAL ENGINEERING 6
• The index of the diastolic level ndias was found as thepositive-to-negative zero-crossing in the time-derivativeof ppgbp[n] directly preceding nsl.
• The index of the systolic level nsys was found as thenegative-to-positive zero-crossing in the time-derivativeof ppgbp[n] directly following nsl.
• A set of pulse candidates was formed for all nsl whichhad both an associated ndias and nsys.
• Pulse candidates with a pulsatility plt smaller than athreshold pltthr were omitted. For each pulse, we defined
plt = 103 ·(ppgbp[ndias]
ppgbl[ndias]− ppgbp[nsys]
ppgbl[nsys]
). (24)
The threshold pltthr was empirically chosen as 70% ofthe average pulsatility of all pulse candidates detectedin the 10 s prior to the walking period, i.e., pltthr wasadapted to each individual measurement.
• From the remaining pulse candidates we only kept pairsof red and IR pulses which we could associate with anR-peak. We associated a pulse pair with an R-peak attime instant tR[i], if the time instants of their diastoliclevels were between tR[i] and tR[i + 1]. If multiple redor IR pulses occurred between tR[i] and tR[i+1], the oneclosest to tR[i] was selected and the others were omitted.An R-peak at tR[i] had no associated pulse pair if the redor IR pulse was missing between tR[i] and tR[i+ 1].
• The systolic and diastolic levels and their time instants ofthe pulses associated with R-peaks were finally found byinterpolating the initial detections and their neighbouringsamples with a second-order polynomial.
We assessed pulse detection during walking by the percent-age pA of initial pulse candidates that was associated with anR-peak. We compared pA before and after artifact reduction.
D. Inter-beat intervals
The artifact-reduced signal ppgar[n] was assessed for IBIaccuracy. IBIs were determined as the time difference betweenthe interpolated systolic points of subsequent IR PPG pulseswhich were associated with R-peaks. For R-peaks withoutassociated pulse pair, the involved IBIs were ignored. The IBIaccuracy was determined as the difference with the associatedRRI:
∆IBI[i] = IBI[i]−RRI[i], (25)
with i referring to the ith IBI. We assessed the algorithmperformance by the 10th to 90th percentile of ∆IBI for eachmeasurement during rest, walking, and after artifact reduction.The interpolation in the R-peak and pulse detection assuredthat ∆IBI was not restricted to integer multiples of 4 ms.
E. Oxygen saturation
The artifact-reduced signal ppgar[n] was also assessed forSpO2 accuracy. For pulse pairs associated with an R-peak,SpO2 was obtained via the calibration curve of the oximetrysensor:
SpO2 = aρ2 + bρ+ c, (26)
with calibration coefficients a [%], b [%] and c [%], and ratio-of-ratios ρ [-]. The ratio-of-ratios was determined as
ρ = (ACrd/DCrd) / (ACir/DCir) , (27)
in which pulse magnitude AC [V] was the difference betweenthe interpolated diastolic and systolic levels, pulse mean DC[V] was the average of ppgbl[n] between the interpolated timeinstants of the diastolic and systolic points, and subscripts rdand ir refer to the red and IR PPG signal, respectively. An 0.1change in ρ corresponded to a 3-4% change in SpO2.
We assessed the algorithm performance by the 10th to 90th
percentile range of SpO2 during rest, walking, and after artifactreduction. We compared the median SpO2 obtained from (26)during rest and after artifact reduction to the median SpO2
obtained during rest with the commercial device. No beat-to-beat comparison was made, because of differences in bloodflow time from the lungs to the forehead and the finger, andbecause of low-pass filtering in the commercial device.
V. RESULTS
A. Motion artifact references
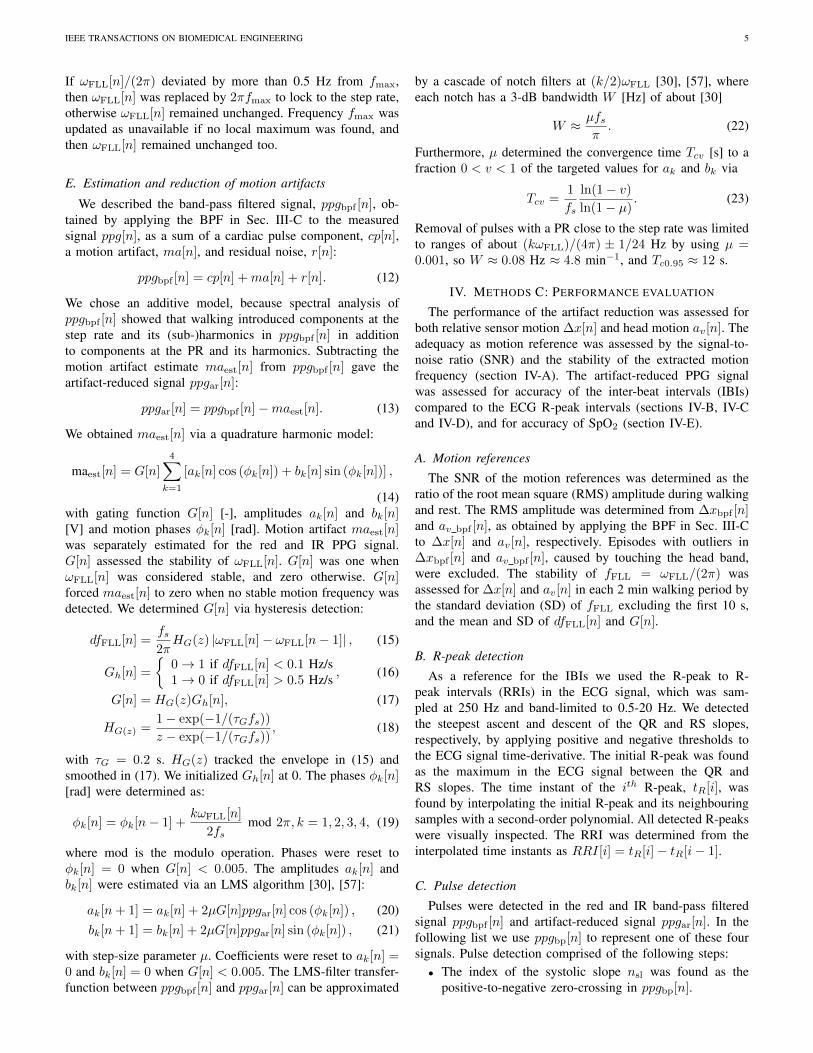
The relative sensor motion ∆x[n] and the head motion av[n]are evaluated in Fig. 4 and Table I. Fig. 4a and b show theRMS-amplitudes of ∆xbpf [n] and av bpf [n], respectively, foreach measurement during rest (dots) and walking (circles).Across the subjects, av bpf [n] behaved more consistently than∆xbpf [n], and av bpf [n] had a better SNR than ∆xbpf [n].Table I quantifies the SNR as the ratio of the RMS-amplitudeduring walking and rest. The average ratio was about 82 forav bpf [n], and about 6 for ∆xbpf [n].
Fig. 4c and d show the mean (open triangle / square) and SD(filled triangle / square) of dfFLL[n] (15) for ∆x[n] and av[n],respectively. These are smaller and more consistent for av[n].Table I shows the fFLL SD. This is also smaller and moreconsistent for av[n]. The mean fFLL SD was about 2 min−1
for av[n] and about 17 min−1 for ∆x[n]. The FLL thus trackedthe step rate more steadily in av[n] than in ∆x[n].
Fig. 4e and f show the mean (open triangle / square) andSD (filled triangle / square) of G[n] for ∆x[n] and av[n],respectively. The mean was consistently about 1 for av[n],whereas it fluctuated for ∆x[n]. For ∆x[n], a decrease inmean and an increase in SD of G[n] was due to unstabletracking of the step rate, as shown by an increase in dfFLL[n].In these cases, the most prominent spectral component overtime in ∆x[n] did not occur at the step rate. Instead, the mostprominent spectral component varied between the step rate andits (sub)harmonic, or the spectral activity was unstructured.
Table I also shows for av[n] that subject 3 has an ap-proximately twofold fFLL SD compared to the other subjects,indicating a larger step rate variation for subject 3.
B. Motion artifact reduction
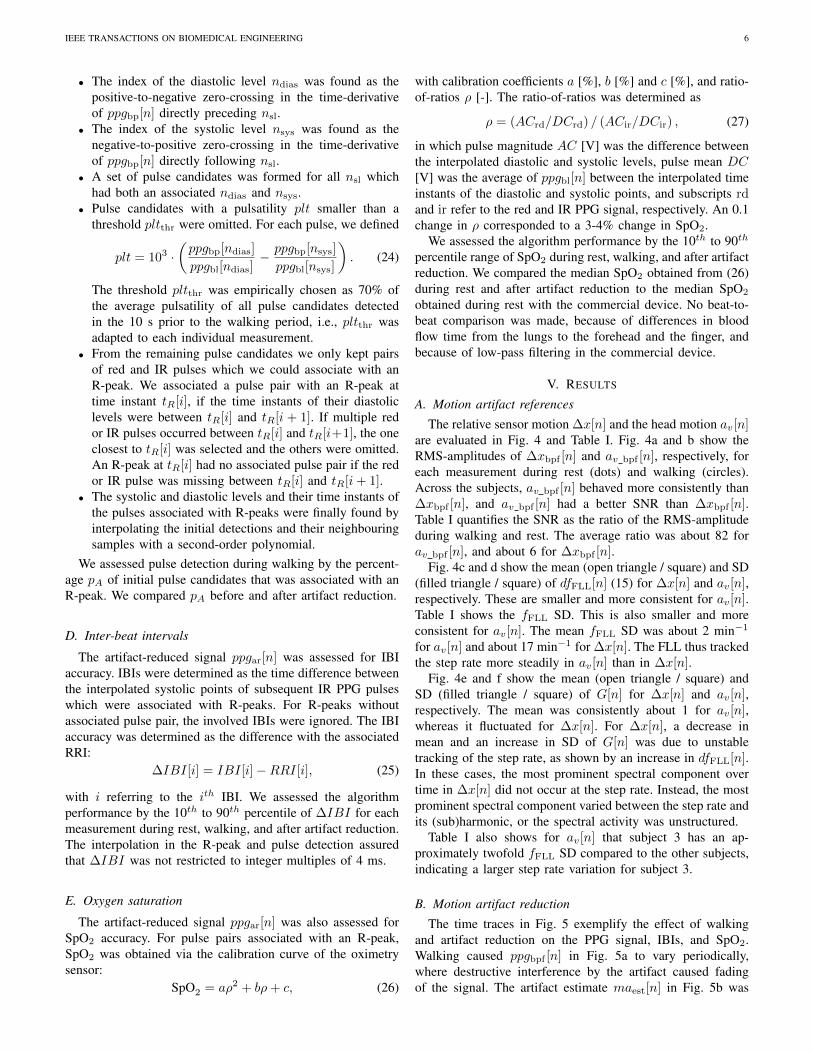
The time traces in Fig. 5 exemplify the effect of walkingand artifact reduction on the PPG signal, IBIs, and SpO2.Walking caused ppgbpf [n] in Fig. 5a to vary periodically,where destructive interference by the artifact caused fadingof the signal. The artifact estimate maest[n] in Fig. 5b was
IEEE TRANSACTIONS ON BIOMEDICAL ENGINEERING 7
0
50
100Rest Walking
0
0-2
0-4 Rest Walking
0
0-5
1-0Mean SD
0
0-2
0-4 Mean SD
00-5
11-5 Mean SD
4 5 6 7 8 4 5 6 7 8 4 5 6 7 8 4 5 6 7 8 4 5 6 7 8 4 5 6 7 80
0-51
1-5 Mean SD
Walkinguspeedu[km/h]
Subjectu1 Subjectu2 Subjectu3 Subjectu4 Subjectu5 Subjectu6a
b
c
d
e
RMSuΔxbpf[n][cycles]
dfFLL[n]uforuav[n][Hz/s]
RMSuav_bpf[n][m/s2]
G[n]uforuΔx[n][_]
dfFLL[n]uforuΔx[n][Hz/s]
G[n]uforuav[n][_]
f
Fig. 4. (a) RMS-amplitude of relative sensor motion ∆xbpf [n] during rest (dots) and walking (circles). (b) RMS-amplitude of head motion av bpf [n] duringrest and walking. (c) Mean (open triangle) and SD (filled triangle) of FLL-frequency time-derivative dfFLL[n] during walking for ∆x[n]. (d) Mean and SDof dfFLL[n] during walking for av [n]. (e) Mean and SD of gating function G[n] during walking for ∆x[n]. (f) Mean and SD of G[n] during walking forav [n]. bpf: band-pass filtered; FLL: frequency-locked loop; RMS: root mean square; SD: standard deviation.
obtained via head motion av[n]. Subtracting maest[n] fromppgbpf [n] gave the stable-amplitude artifact-reduced signalppgar[n] in Fig. 5c. Fig. 5d and e respectively show that theIBIs and SpO2 derived from the motion-affected signals variedperiodically (diamonds). The IBIs and SpO2 after artifactreduction (squares) did not show this variation any longer,and were closer to the ECG-derived IBIs (crosses in Fig. 5d)and commercial device SpO2 (crosses in Fig. 5e), respectively.The exclusion of pulses with too small pulsatility (24) causedthe gaps in the IBIs and SpO2 before artifact reduction. Afterartifact reduction, no pulses were excluded in Figs. 5d and e.
The spectrograms in Fig. 6 further illustrate the effectof walking and artifact reduction. Fig. 6a shows that step-rate related frequency components appear in ppgbpf [n] duringwalking in addition to the PR related frequency components.The component at half the step rate was due to guiding thesensor wire behind the left ear, causing pulling of the sensoreach time the head turned right. Fig. 6b shows that maest[n]captured all step-rate related components, with slight leakageof PR related components. Fig. 6c shows that subtracting
maest[n] from ppgbpf [n] effectively removed the artifacts.
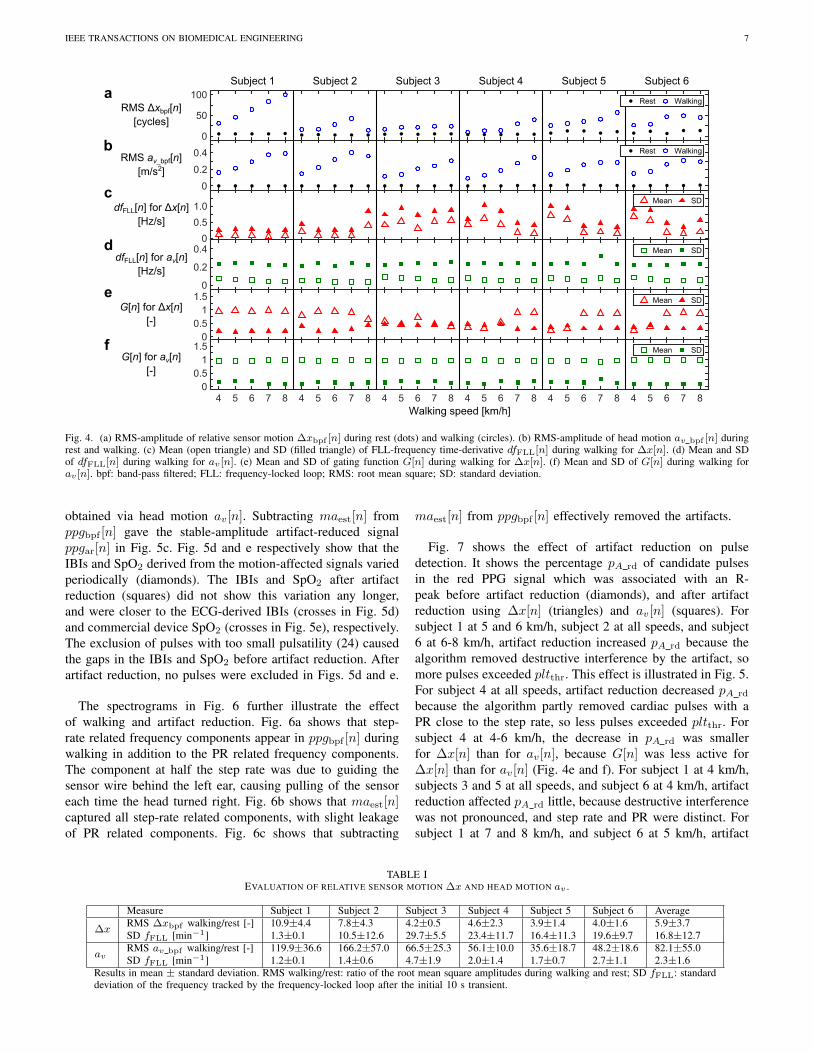
Fig. 7 shows the effect of artifact reduction on pulsedetection. It shows the percentage pA rd of candidate pulsesin the red PPG signal which was associated with an R-peak before artifact reduction (diamonds), and after artifactreduction using ∆x[n] (triangles) and av[n] (squares). Forsubject 1 at 5 and 6 km/h, subject 2 at all speeds, and subject6 at 6-8 km/h, artifact reduction increased pA rd because thealgorithm removed destructive interference by the artifact, somore pulses exceeded pltthr. This effect is illustrated in Fig. 5.For subject 4 at all speeds, artifact reduction decreased pA rd
because the algorithm partly removed cardiac pulses with aPR close to the step rate, so less pulses exceeded pltthr. Forsubject 4 at 4-6 km/h, the decrease in pA rd was smallerfor ∆x[n] than for av[n], because G[n] was less active for∆x[n] than for av[n] (Fig. 4e and f). For subject 1 at 4 km/h,subjects 3 and 5 at all speeds, and subject 6 at 4 km/h, artifactreduction affected pA rd little, because destructive interferencewas not pronounced, and step rate and PR were distinct. Forsubject 1 at 7 and 8 km/h, and subject 6 at 5 km/h, artifact
TABLE IEVALUATION OF RELATIVE SENSOR MOTION ∆x AND HEAD MOTION av .
Measure Subject 1 Subject 2 Subject 3 Subject 4 Subject 5 Subject 6 Average
∆xRMS ∆xbpf walking/rest [-] 10.9±4.4 7.8±4.3 4.2±0.5 4.6±2.3 3.9±1.4 4.0±1.6 5.9±3.7SD fFLL [min−1] 1.3±0.1 10.5±12.6 29.7±5.5 23.4±11.7 16.4±11.3 19.6±9.7 16.8±12.7
avRMS av bpf walking/rest [-] 119.9±36.6 166.2±57.0 66.5±25.3 56.1±10.0 35.6±18.7 48.2±18.6 82.1±55.0SD fFLL [min−1] 1.2±0.1 1.4±0.6 4.7±1.9 2.0±1.4 1.7±0.7 2.7±1.1 2.3±1.6
Results in mean ± standard deviation. RMS walking/rest: ratio of the root mean square amplitudes during walking and rest; SD fFLL: standarddeviation of the frequency tracked by the frequency-locked loop after the initial 10 s transient.
IEEE TRANSACTIONS ON BIOMEDICAL ENGINEERING 8
-3
0
3
-3
0
3
-3
0
3
550
600
650 ecg ppgbpf
ppgar
100 105 110 115 120 125 13096
100
104 commercialudevice ppgbpf
ppgar
a
c
d
e
Timeu[s]
EffectuofumotionuartifactureductionuonuPPGusignal,uIBIsuanduSpO2
b
IBI[ms]
SpO2
[B]
ppgbpf[n][mV]
ppgar[n][mV]
maest[n][mV]
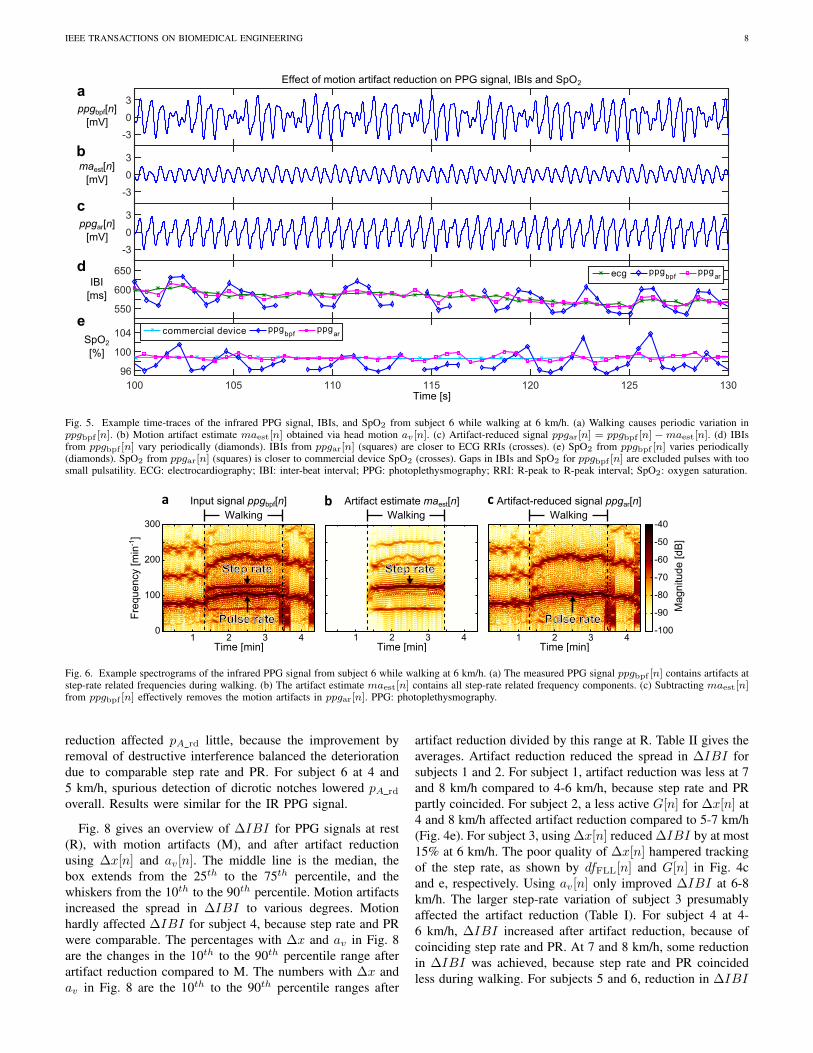
Fig. 5. Example time-traces of the infrared PPG signal, IBIs, and SpO2 from subject 6 while walking at 6 km/h. (a) Walking causes periodic variation inppgbpf [n]. (b) Motion artifact estimate maest[n] obtained via head motion av [n]. (c) Artifact-reduced signal ppgar[n] = ppgbpf [n] −maest[n]. (d) IBIsfrom ppgbpf [n] vary periodically (diamonds). IBIs from ppgar[n] (squares) are closer to ECG RRIs (crosses). (e) SpO2 from ppgbpf [n] varies periodically(diamonds). SpO2 from ppgar[n] (squares) is closer to commercial device SpO2 (crosses). Gaps in IBIs and SpO2 for ppgbpf [n] are excluded pulses with toosmall pulsatility. ECG: electrocardiography; IBI: inter-beat interval; PPG: photoplethysmography; RRI: R-peak to R-peak interval; SpO2: oxygen saturation.
Timel[min] Timel[min] Timel[min]
-100
-90
-80
-70
-60
-50
-40
1 2 3 4
Pulse rate
1 2 3 41 2 3 40
100
200
300
Mag
nitu
del[d
B]
Artifactlestimatelmaest[n] Artifact-reducedlsignallppgar[n]Inputlsignallppgbpf[n]a b c
Pulse rate
Step rate
Fre
quen
cyl[m
in-1
]
Walking WalkingWalking
Step rate
Fig. 6. Example spectrograms of the infrared PPG signal from subject 6 while walking at 6 km/h. (a) The measured PPG signal ppgbpf [n] contains artifacts atstep-rate related frequencies during walking. (b) The artifact estimate maest[n] contains all step-rate related frequency components. (c) Subtracting maest[n]from ppgbpf [n] effectively removes the motion artifacts in ppgar[n]. PPG: photoplethysmography.
reduction affected pA rd little, because the improvement byremoval of destructive interference balanced the deteriorationdue to comparable step rate and PR. For subject 6 at 4 and5 km/h, spurious detection of dicrotic notches lowered pA rd
overall. Results were similar for the IR PPG signal.
Fig. 8 gives an overview of ∆IBI for PPG signals at rest(R), with motion artifacts (M), and after artifact reductionusing ∆x[n] and av[n]. The middle line is the median, thebox extends from the 25th to the 75th percentile, and thewhiskers from the 10th to the 90th percentile. Motion artifactsincreased the spread in ∆IBI to various degrees. Motionhardly affected ∆IBI for subject 4, because step rate and PRwere comparable. The percentages with ∆x and av in Fig. 8are the changes in the 10th to the 90th percentile range afterartifact reduction compared to M. The numbers with ∆x andav in Fig. 8 are the 10th to the 90th percentile ranges after
artifact reduction divided by this range at R. Table II gives theaverages. Artifact reduction reduced the spread in ∆IBI forsubjects 1 and 2. For subject 1, artifact reduction was less at 7and 8 km/h compared to 4-6 km/h, because step rate and PRpartly coincided. For subject 2, a less active G[n] for ∆x[n] at4 and 8 km/h affected artifact reduction compared to 5-7 km/h(Fig. 4e). For subject 3, using ∆x[n] reduced ∆IBI by at most15% at 6 km/h. The poor quality of ∆x[n] hampered trackingof the step rate, as shown by dfFLL[n] and G[n] in Fig. 4cand e, respectively. Using av[n] only improved ∆IBI at 6-8km/h. The larger step-rate variation of subject 3 presumablyaffected the artifact reduction (Table I). For subject 4 at 4-6 km/h, ∆IBI increased after artifact reduction, because ofcoinciding step rate and PR. At 7 and 8 km/h, some reductionin ∆IBI was achieved, because step rate and PR coincidedless during walking. For subjects 5 and 6, reduction in ∆IBI
IEEE TRANSACTIONS ON BIOMEDICAL ENGINEERING 9
4 5 6 7 8 4 5 6 7 8 4 5 6 7 8 4 5 6 7 8 4 5 6 7 8 4 5 6 7 860
70
80
90
100
Artifact ∆ x av
Walking]speed][km/h]
Subject]1 Subject]2 Subject]3 Subject]4 Subject]5 Subject]6
pA_
rd][2
]
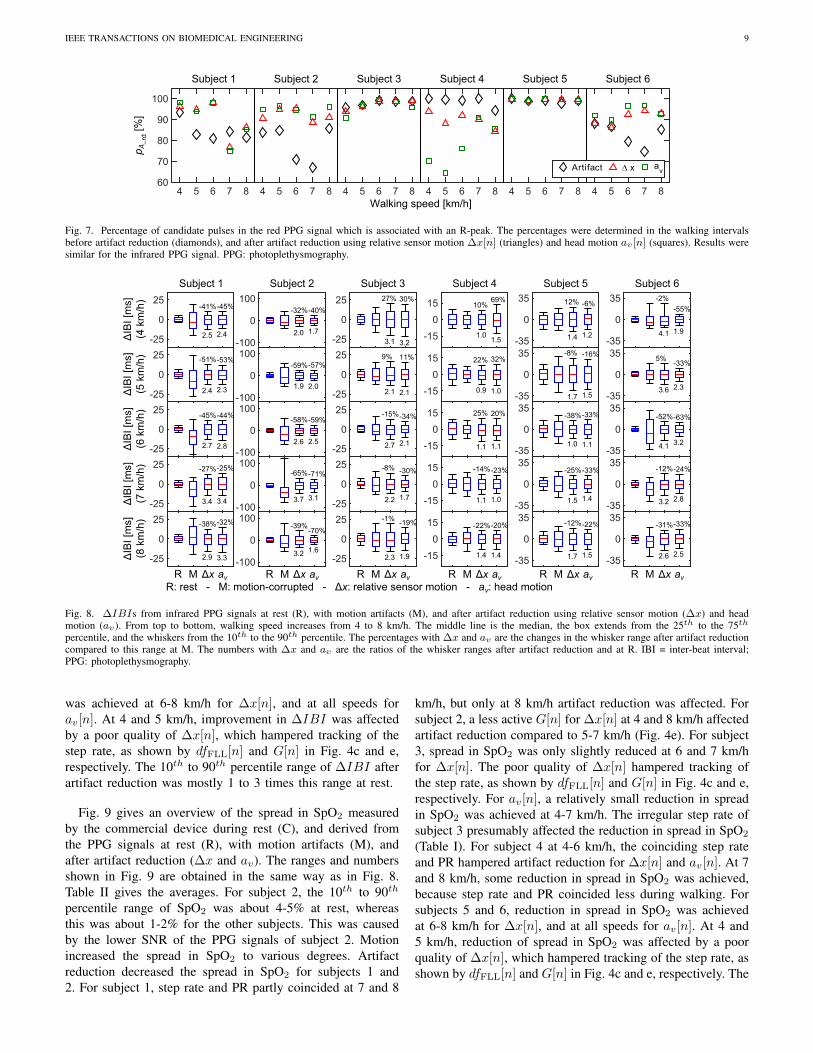
Fig. 7. Percentage of candidate pulses in the red PPG signal which is associated with an R-peak. The percentages were determined in the walking intervalsbefore artifact reduction (diamonds), and after artifact reduction using relative sensor motion ∆x[n] (triangles) and head motion av [n] (squares). Results weresimilar for the infrared PPG signal. PPG: photoplethysmography.
-25
0
25-41o-45o
2.5 2.4
-25
0
25 -51o-53o
2.4 2.3
-25
0
25-45o-44o
2.7 2.8
-25
0
25 -27o-25o
3.4 3.4
-25
0
25 -38o-32o
2.9 3.3
-100
0
100-32o-40o
2.0 1.7
-100
0
100-59o-57o
1.9 2.0
-100
0
100-58o-59o
2.6 2.5
-100
0
100-65o-71o
3.7 3.1
-100
0
100-39o
-70o
3.2 1.6
-25
0
25 27o 30o
3.1 3.2
-25
0
25 9o 11o
2.1 2.1
-25
0
25 -15o-34o
2.7 2.1
-25
0
25 -8o -30o
2.2 1.7
-25
0
25 -1o-19o
2.3 1.9
-15
0
15 10o69o
1.01.5
-15
0
15 22o 32o
0.9 1.0
-15
0
15 25o 20o
1.1 1.1
-15
0
15 -14o-23o
1.1 1.0
-15
0
15 -22o-20o
1.4 1.4
-35
0
35 12o -6o
1.4 1.2
-35
0
35 -8o -16o
1.7 1.5
-35
0
35-38o-33o
1.0 1.1
-35
0
35-25o-33o
1.5 1.4
-35
0
35-12o-22o
1.7 1.5
-35
0
35 -2o
-55o
4.1 1.9
-35
0
355o
-33o
3.6 2.3
-35
0
35-52o-63o
4.1 3.2
-35
0
35-12o-24o
3.2 2.8
-35
0
35-31o-33o
2.6 2.5
ΔIB
It[m
s]p4
tkm
/hd
ΔIB
It[m
s]p5
tkm
/hd
ΔIB
It[m
s]p6
tkm
/hd
ΔIB
It[m
s]p7
tkm
/hd
ΔIB
It[m
s]p8
tkm
/hd
Subjectt1 Subjectt2 Subjectt3 Subjectt4 Subjectt5 Subjectt6
R M Δx av R M Δx av R M Δx av R M Δx av R M Δx av R M Δx avR:trestttt-tttM:tmotion-corruptedttt-tttΔx:trelativetsensortmotionttt-tttav:theadtmotion
Fig. 8. ∆IBIs from infrared PPG signals at rest (R), with motion artifacts (M), and after artifact reduction using relative sensor motion (∆x) and headmotion (av). From top to bottom, walking speed increases from 4 to 8 km/h. The middle line is the median, the box extends from the 25th to the 75thpercentile, and the whiskers from the 10th to the 90th percentile. The percentages with ∆x and av are the changes in the whisker range after artifact reductioncompared to this range at M. The numbers with ∆x and av are the ratios of the whisker ranges after artifact reduction and at R. IBI = inter-beat interval;PPG: photoplethysmography.
was achieved at 6-8 km/h for ∆x[n], and at all speeds forav[n]. At 4 and 5 km/h, improvement in ∆IBI was affectedby a poor quality of ∆x[n], which hampered tracking of thestep rate, as shown by dfFLL[n] and G[n] in Fig. 4c and e,respectively. The 10th to 90th percentile range of ∆IBI afterartifact reduction was mostly 1 to 3 times this range at rest.
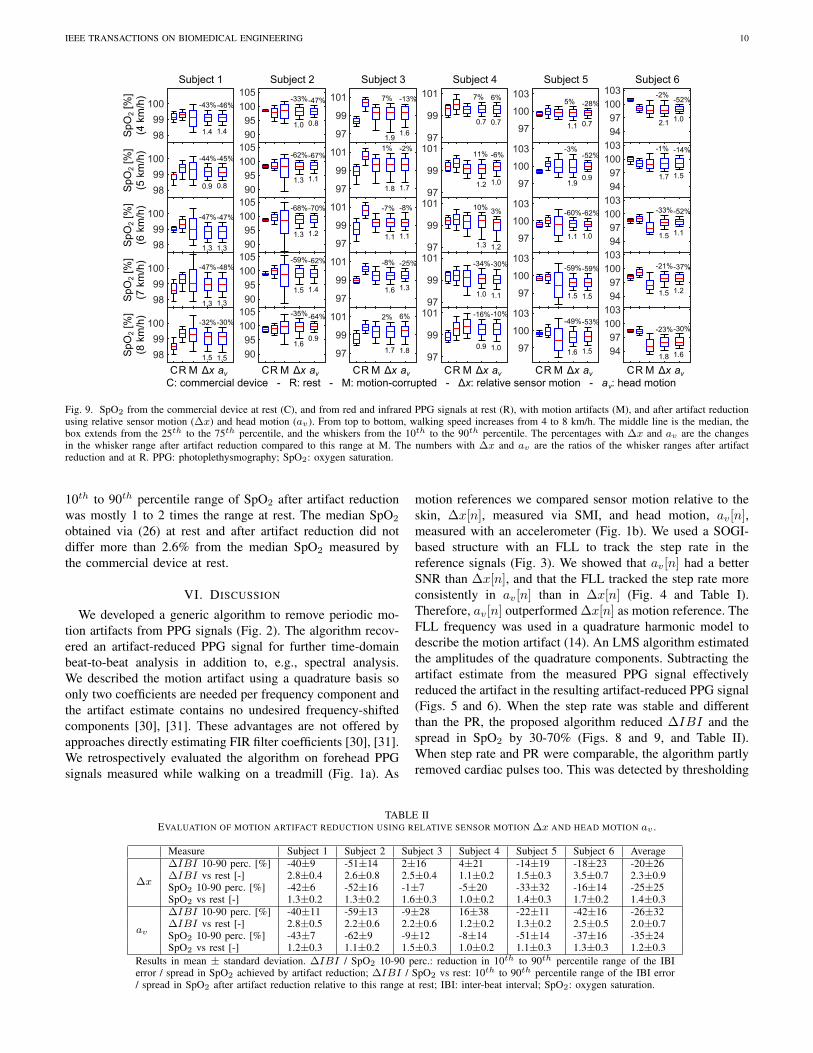
Fig. 9 gives an overview of the spread in SpO2 measuredby the commercial device during rest (C), and derived fromthe PPG signals at rest (R), with motion artifacts (M), andafter artifact reduction (∆x and av). The ranges and numbersshown in Fig. 9 are obtained in the same way as in Fig. 8.Table II gives the averages. For subject 2, the 10th to 90th
percentile range of SpO2 was about 4-5% at rest, whereasthis was about 1-2% for the other subjects. This was causedby the lower SNR of the PPG signals of subject 2. Motionincreased the spread in SpO2 to various degrees. Artifactreduction decreased the spread in SpO2 for subjects 1 and2. For subject 1, step rate and PR partly coincided at 7 and 8
km/h, but only at 8 km/h artifact reduction was affected. Forsubject 2, a less active G[n] for ∆x[n] at 4 and 8 km/h affectedartifact reduction compared to 5-7 km/h (Fig. 4e). For subject3, spread in SpO2 was only slightly reduced at 6 and 7 km/hfor ∆x[n]. The poor quality of ∆x[n] hampered tracking ofthe step rate, as shown by dfFLL[n] and G[n] in Fig. 4c and e,respectively. For av[n], a relatively small reduction in spreadin SpO2 was achieved at 4-7 km/h. The irregular step rate ofsubject 3 presumably affected the reduction in spread in SpO2
(Table I). For subject 4 at 4-6 km/h, the coinciding step rateand PR hampered artifact reduction for ∆x[n] and av[n]. At 7and 8 km/h, some reduction in spread in SpO2 was achieved,because step rate and PR coincided less during walking. Forsubjects 5 and 6, reduction in spread in SpO2 was achievedat 6-8 km/h for ∆x[n], and at all speeds for av[n]. At 4 and5 km/h, reduction of spread in SpO2 was affected by a poorquality of ∆x[n], which hampered tracking of the step rate, asshown by dfFLL[n] and G[n] in Fig. 4c and e, respectively. The
IEEE TRANSACTIONS ON BIOMEDICAL ENGINEERING 10
98
99
100 -43a-46a
1.4 1.4
98
99
100 -44a-45a
0.9 0.8
98
99
100 -47a-47a
1.3 1.3
98
99
100 -47a-48a
1.3 1.3
98
99
100 -32a-30a
1.5 1.5
90
95
100
105-33a-47a
1.0 0.8
90
95
100
105-62a-67a
1.3 1.1
90
95
100
105-68a-70a
1.3 1.2
90
95
100
105 -59a-62a
1.5 1.4
90
95
100
105 -35a-64a
1.60.9
97
99
101 7a -13a
1.91.6
97
99
101 1a -2a
1.8 1.7
97
99
101 -7a -8a
1.1 1.1
97
99
101 -8a -25a
1.6 1.3
97
99
101 2a 6a
1.7 1.8
97
99
101 7a 6a
0.7 0.7
97
99
10111a -6a
1.2 1.0
97
99
101 10a 3a
1.3 1.2
97
99
101-34a-30a
1.0 1.1
97
99
101 -16a-10a
0.9 1.0
97
100
1035a -28a
1.1 0.7
97
100
103 -3a-52a
1.90.9
97
100
103-60a-62a
1.1 1.0
97
100
103-59a-59a
1.5 1.5
97
100
103-49a-53a
1.6 1.5
9497
100103 -2a
-52a
2.1 1.0
9497
100103 -1a -14a
1.7 1.5
9497
100103
-33a-52a
1.5 1.1
9497
100103
-21a-37a
1.5 1.2
9497
100103
-23a-30a
1.8 1.6
SpO
2C[a
]v4
Ckm
/hR
SpO
2C[a
]v5
Ckm
/hR
SpO
2C[a
]v6
Ckm
/hR
SpO
2C[a
]v7
Ckm
/hR
SpO
2C[a
]v8
Ckm
/hR
SubjectC1 SubjectC2 SubjectC3 SubjectC4 SubjectC5 SubjectC6
C:CcommercialCdeviceCCC-CCCR:CrestCCC-CCCM:Cmotion-corruptedCCC-CCCΔx:CrelativeCsensorCmotionCCC-CCCav:CheadCmotionR M Δx avC R M Δx avC R M Δx avC R M Δx avC R M Δx avC R M Δx avC
Fig. 9. SpO2 from the commercial device at rest (C), and from red and infrared PPG signals at rest (R), with motion artifacts (M), and after artifact reductionusing relative sensor motion (∆x) and head motion (av). From top to bottom, walking speed increases from 4 to 8 km/h. The middle line is the median, thebox extends from the 25th to the 75th percentile, and the whiskers from the 10th to the 90th percentile. The percentages with ∆x and av are the changesin the whisker range after artifact reduction compared to this range at M. The numbers with ∆x and av are the ratios of the whisker ranges after artifactreduction and at R. PPG: photoplethysmography; SpO2: oxygen saturation.
10th to 90th percentile range of SpO2 after artifact reductionwas mostly 1 to 2 times the range at rest. The median SpO2
obtained via (26) at rest and after artifact reduction did notdiffer more than 2.6% from the median SpO2 measured bythe commercial device at rest.
VI. DISCUSSION
We developed a generic algorithm to remove periodic mo-tion artifacts from PPG signals (Fig. 2). The algorithm recov-ered an artifact-reduced PPG signal for further time-domainbeat-to-beat analysis in addition to, e.g., spectral analysis.We described the motion artifact using a quadrature basis soonly two coefficients are needed per frequency component andthe artifact estimate contains no undesired frequency-shiftedcomponents [30], [31]. These advantages are not offered byapproaches directly estimating FIR filter coefficients [30], [31].We retrospectively evaluated the algorithm on forehead PPGsignals measured while walking on a treadmill (Fig. 1a). As
motion references we compared sensor motion relative to theskin, ∆x[n], measured via SMI, and head motion, av[n],measured with an accelerometer (Fig. 1b). We used a SOGI-based structure with an FLL to track the step rate in thereference signals (Fig. 3). We showed that av[n] had a betterSNR than ∆x[n], and that the FLL tracked the step rate moreconsistently in av[n] than in ∆x[n] (Fig. 4 and Table I).Therefore, av[n] outperformed ∆x[n] as motion reference. TheFLL frequency was used in a quadrature harmonic model todescribe the motion artifact (14). An LMS algorithm estimatedthe amplitudes of the quadrature components. Subtracting theartifact estimate from the measured PPG signal effectivelyreduced the artifact in the resulting artifact-reduced PPG signal(Figs. 5 and 6). When the step rate was stable and differentthan the PR, the proposed algorithm reduced ∆IBI and thespread in SpO2 by 30-70% (Figs. 8 and 9, and Table II).When step rate and PR were comparable, the algorithm partlyremoved cardiac pulses too. This was detected by thresholding
TABLE IIEVALUATION OF MOTION ARTIFACT REDUCTION USING RELATIVE SENSOR MOTION ∆x AND HEAD MOTION av .
Measure Subject 1 Subject 2 Subject 3 Subject 4 Subject 5 Subject 6 Average
∆x
∆IBI 10-90 perc. [%] -40±9 -51±14 2±16 4±21 -14±19 -18±23 -20±26∆IBI vs rest [-] 2.8±0.4 2.6±0.8 2.5±0.4 1.1±0.2 1.5±0.3 3.5±0.7 2.3±0.9SpO2 10-90 perc. [%] -42±6 -52±16 -1±7 -5±20 -33±32 -16±14 -25±25SpO2 vs rest [-] 1.3±0.2 1.3±0.2 1.6±0.3 1.0±0.2 1.4±0.3 1.7±0.2 1.4±0.3
av
∆IBI 10-90 perc. [%] -40±11 -59±13 -9±28 16±38 -22±11 -42±16 -26±32∆IBI vs rest [-] 2.8±0.5 2.2±0.6 2.2±0.6 1.2±0.2 1.3±0.2 2.5±0.5 2.0±0.7SpO2 10-90 perc. [%] -43±7 -62±9 -9±12 -8±14 -51±14 -37±16 -35±24SpO2 vs rest [-] 1.2±0.3 1.1±0.2 1.5±0.3 1.0±0.2 1.1±0.3 1.3±0.3 1.2±0.3
Results in mean ± standard deviation. ∆IBI / SpO2 10-90 perc.: reduction in 10th to 90th percentile range of the IBIerror / spread in SpO2 achieved by artifact reduction; ∆IBI / SpO2 vs rest: 10th to 90th percentile range of the IBI error/ spread in SpO2 after artifact reduction relative to this range at rest; IBI: inter-beat interval; SpO2: oxygen saturation.
IEEE TRANSACTIONS ON BIOMEDICAL ENGINEERING 11
the magnitude of the baseline-normalized pulses in the artifact-reduced PPG signal, to exclude too small pulses for furtheranalysis (Fig. 7).
Degradation of the algorithm performance occurred in threeoccasions. Motion artifacts were removed to a lesser extent,when a low-quality motion reference signal hampered trackingof the step rate, or when the step rate varied faster than thealgorithm could track. Cardiac pulses were partly removedwhen step rate and PR were comparable. However, when thestep rate was stable and distinct from the PR, and the motionreference signal consistently contained a component at the steprate, the proposed algorithm considerably reduced ∆IBI andthe spread in SpO2. Therefore, the proposed algorithm canfacilitate analysis of IBIs and SpO2 during periodic motion in,e.g., ADL, sports, CPX, or CPR. Coinciding motion frequencyand PR can furthermore be identified when pulses in theartifact-reduced PPG signal become too small.
The relative sensor motion ∆x[n] was not a stable motionreference signal. The FLL did not steadily track the step ratein ∆x[n] in 14 out of 30 measurements (Fig. 4). This mayindicate little relative sensor motion in these cases. Insufficientoptical feedback into the LD may also contribute to a poorsignal quality of ∆x[n]. Therefore, we recommend usingan accelerometer as a motion reference for (quasi-)periodicmotion.
After successful artifact reduction, the spread in ∆IBIwas larger compared to measurements at rest (Fig. 8 andTable II). This may result from residual motion artifacts,or from physiological fluctuations in IBIs during walkingcaused by variations in pre-ejection time and pulse transittime [22]. Inaccuracies in the ECG signal during walking mayalso contribute, resulting from electrode-skin motion, and theelectromyogram [58].
The spread in SpO2 after artifact reduction was about 1 to2 times the spread at rest, and was therefore smaller than thespread in ∆IBI after artifact reduction, which was about 1to 3 times the spread at rest (Figs. 8 and 9, and Table II).This is presumably caused by the different nature of theperformance measures. We only considered the spread in SpO2
without direct comparison to a reference, and we thereforedo not have a measure of the SpO2 accuracy. In contrast,∆IBI was a beat-to-beat comparison of IBIs and ECG-derived RRIs. Consequently, although the spread in SpO2 afterartifact reduction is more comparable to the spread at rest, thisdoes not indicate a better performance for SpO2 than for IBIs.
The proposed solution has some limitations. The algorithmcan only deal with slowly-varying periodic motion artifacts.When the motion frequency and PR coincide, no improvementcan be obtained. In a real-world application, an additionalalgorithm may be required which first assesses presence andperiodicity of motion to determine whether the proposedalgorithm should be initiated. Furthermore, a limited numberof measurements have been performed on a limited numberof subjects, resulting in only a preliminary validation of thealgorithm. Also, the periodic motion artifacts generated onthe treadmill may be more periodic than encountered in ADL.SpO2 accuracy has not been assessed. Only the variation inSpO2 has been quantified, assuming a relatively constant SpO2
for healthy subjects.
VII. CONCLUSIONS
The proposed generic algorithm can effectively removeperiodic motion artifacts from PPG signals measured whilewalking on a treadmill. A SOGI-based structure with an FLLcan track the step rate in a motion reference signal. Anaccelerometry-derived motion reference signal outperforms anSMI-derived motion reference signal, which measures sensormotion relative to the skin. Periodic motion artifacts can bedescribed by a harmonic model of quadrature components withfrequencies related to the tracked step rate. Subtracting theharmonic model from the measured PPG signal effectivelyremoves the motion artifacts. More stable IBI and SpO2 mea-surements can be derived from the resulting artifact-reducedPPG signals if the step rate and PR are distinct. If step rateand PR are comparable, also cardiac pulses are partly removed,which can be detected by thresholding the magnitude of thebaseline-normalized pulses in the artifact-reduced PPG signal.
ACKNOWLEDGEMENTS
This work was supported by NL Agency, IOP PhotonicDevices, IPD083359 HIP, Hemodynamics by InterferometricPhotonics. We thank Dr J. Veen from the HAN University ofApplied Sciences, Dr A. van der Lee, Dr P. Woerlee, Dr W.Peeters and Dr J. Muhlsteff from Philips Research, and Prof J.Bergmans from the Eindhoven University of Technology forthe valuable discussions, and Mr B. Wassink from VDL ETGResearch bv for customizing the forehead sensor.
REFERENCES
[1] J. Allen, “Photoplethysmography and its application in clinical physio-logical measurement,” Physiol. Meas., vol. 28, no. 3, pp. R1–39, Mar.2007.
[2] A. Reisner, P.A. Shaltis, D. McCombie, and H.H. Asada, “Utility ofthe photoplethysmogram in circulatory monitoring,” Anesthesiology, vol.108, no. 5, pp. 950–58, May 2008.
[3] R. Sahni, “Noninvasive monitoring by photoplethysmography,” Clin.Perinatol., vol. 39, no. 3, pp. 573–83, Sep. 2012.
[4] P. S. Addison, J. N. Watson, M. L. Mestek, J. P. Ochs, A. A. Uribe, andS. D. Bergese, “Pulse oximetry-derived respiratory rate in general carefloor patients,” J. Clin. Monit. Comput., vol. 29, no. 1, pp. 113–20, Feb.2015.
[5] T. Tamura, Y. Maeda, M. Sekine, and M. Yoshida, “Wearable photo-plethysmographic sensors - past and present,” Electronics, vol. 3, no. 2,pp. 282–302, Apr. 2014.
[6] A. B. Hertzman “The blood supply of various skin areas as estimatedby the photoelectric plethysmograph,” Am. J. Physiol., vol. 124, no. 2,pp. 328–40, July 1938.
[7] Y. Mendelson, “Pulse oximetry: theory and applications for noninvasivemonitoring,” Clin. Chem., vol. 38, no. 9, pp. 1601–7, Sep. 1992.
[8] K. Nakajima, T. Tamura, and H. Miike, “Monitoring of heart and respira-tory rates by photoplethysmography using a digital filtering technique,”Med. Eng. Phys., vol. 18, no. 5, pp. 365–72, Jul. 1996.
[9] T.L. Rusch, R. Sankar, and J. E. Scharf, “Signal processing methods forpulse oximetry,” Comput. Biol. Med., vol. 26, no. 2, pp. 143–59, Mar.1996.
[10] J. A. Pologe, “Pulse oximetry: technical aspects of machine design,” Int.Anesthesiol. Clin., vol. 25, no. 3, pp. 137–53, Feb. 1987.
[11] J. G. Webster, Ed., Design of pulse oximeters(Medical Science Series).New York, NY, USA: Taylor & Francis Group, 1997.
[12] T. Aoyagi, “Pulse oximetry: its invention, theory, and future,” J. Anesth.,vol. 17, no. 4, pp. 259–66, Jan. 2003.
[13] P. D. Mannheimer, “The light-tissue interaction of pulse oximetry,”Anesth. Analg., vol. 105, no. 6 Suppl, pp. S10–7, Dec. 2007.
IEEE TRANSACTIONS ON BIOMEDICAL ENGINEERING 12
[14] M. Nitzan, A. Romem, and R. Koppel, ”Pulse oximetry: fundamentalsand technology update,” Med. Devices (Auckl)., vol. 7, pp. 231–9, Jul.2014.
[15] H. H. Asada, P. Shaltis, A. Reisner, S. Rhee, and R. C. Hutchinson,“Mobile monitoring with wearable photoplethysmographic biosensors,”IEEE Trans. Biomed. Eng., vol. 22, no. 3, pp. 28–40, July 2003.
[16] G. J. Balady, R. Arena, K. Sietsema, J. Myers, L. Coke, G. F. Fletcher,D. Forman, B. Franklin, M. Guazzi, M. Gulati, S. J. Keteyian,C. J. Lavie, R. Macko, D. Mancini, and R. V. Milani, “Clinician’s Guideto cardiopulmonary exercise testing in adults: a scientific statement fromthe American Heart Association,” Circulation, vol. 122, no. 2, pp. 191–225, July 2010.
[17] D. E. Forman, J. Myers, C. J. Lavie, M. Guazzi, B. Celli, and R. Arena,“Cardiopulmonary exercise testing: relevant but underused,” Postgrad.Med., vol. 122, no. 6, pp. 68–86, Nov. 2010.
[18] R.W.C.G.R. Wijshoff, T. van der Sar, P.H. Peeters, R. Bezemer, P. Aelen,I.W.F. Paulussen, S.C.M.A. Ordelman, A. Venema, P.F.J. van Berkom,R.M. Aarts, P.H. Woerlee, G.-J. Scheffer, and G.J. Noordergraaf, “Detec-tion of a spontaneous pulse in photoplethysmograms during automatedcardiopulmonary resuscitation in a porcine model,” Resuscitation, vol.84, no. 11, pp. 1625–1632, Nov. 2013.
[19] R. W. C. G. R. Wijshoff, A. M. T. M. Asten, W. H. Peeters,R. Bezemer, G. J. Noordergraaf, M. Mischi, and R. M. Aarts,“Photoplethysmography-based algorithm for detection of cardiogenicoutput during cardiopulmonary resuscitation,” IEEE Trans. Biomed.Eng., vol. 62, no. 3, pp. 909–921, March 2015.
[20] J. Van Andel, C. Ungureanu, R. Aarts, F. Leijten, and J. Arends,“Using photoplethysmography in heart rate monitoring of patients withepilepsy,” Epilepsy Behav., vol. 45, no. 4, pp. 142–145, Apr. 2015.
[21] W.J.C. Van Elmpt, T.M.E. Nijsen, P.A.M. Griep, and J.B.A.M. Arends,“A model of heart rate changes to detect seizures in severe epilepsy,”Seizure, vol. 15, no. 6, pp. 366–375, June 2006.
[22] A. Schafer, and J. Vagedes, “How accurate is pulse rate variability asan estimate of heart rate variability? A review on studies comparingphotoplethysmographic technology with an electrocardiogram,” Int. J.Cardiol. vol. 166, no. 1, pp. 15–29, June 2013.
[23] L. Ferranti, and R. Laureanti, “Atrial fibrillation detection in PPG signalrecorded through a wristband device,” M.S. thesis, Dept. of Electronics,Information and Bioengineering, Politecnico di Milano, Milan, Italy,Dec. 2015.
[24] G. Comtois, Y. Mendelson, and P. Ramuka, “A comparative evaluationof adaptive noise cancellation algorithms for minimizing motion artifactsin a forehead-mounted wearable pulse oximeter,” Conf. Proc. IEEE Eng.Med. Biol. Soc., pp. 1528–31, Aug. 2007.
[25] P. T. Gibbs, and H. H. Asada, “Reducing motion artifact in wearablebio-sensors using MEMS accelerometers for active noise cancellation,”Proc. of the American Control Conf., vol. 3, pp. 1581–6, June 2005.
[26] L. B. Wood, and H. H. Asada, “Low variance adaptive filter for can-celling motion artifact in wearable photoplethysmogram sensor signals,”Conf. Proc. IEEE Eng. Med. Biol. Soc., pp. 652–5, Aug. 2007.
[27] B. Lee, J. Han, H. J. Baek, J. H. Shin, K. S. Park, and W. J. Yi,“Improved elimination of motion artifacts from a photoplethysmographicsignal using a Kalman smoother with simultaneous accelerometry,”Physiol. Meas., vol. 31, no. 12, pp. 1585–603, Dec. 2010.
[28] M.-Z. Poh, N. C. Swenson, and R. W. Picard “Motion-tolerant magneticearring sensor and wireless earpiece for wearable photoplethysmogra-phy,” IEEE Trans. Inf. Technol. Biomed., vol. 14, no. 3, pp. 786–94, Feb.2010.
[29] H. Han, and J. Kim, “Artifacts in wearable photoplethysmographs duringdaily life motions and their reduction with least mean square based activenoise cancellation method,” Comput. Biol. Med., vol. 42, no. 4, pp. 387–93, Apr. 2012.
[30] B. Widrow, J.R. Glover, J.M. McCool, J. Kaunitz, C.S. Williams,R.H. Hearn, J.R. Zeidler, E. Dong, JR., and R.C. Goodlin, “Adaptivenoise cancelling: principles and applications,” Proc. IEEE, vol. 63, no.12, pp. 105–12, Dec. 1975.
[31] J.R. Glover JR, “Adaptive noise cancelling applied to sinusoidal interfer-ences,”, IEEE Trans. Acoust., Speech, Signal Processing, vol. ASSP–25,no. 6, pp. 484–91, Dec. 1977.
[32] M. J. Hayes and P. R. Smith, “Artifact reduction in photoplethysmogra-phy,” Appl. Opt., vol. 37, no. 31, pp. 7437–46, Nov. 1998.
[33] M.J. Hayes, and P.R. Smith, “A new method for pulse oximetrypossessing inherent insensitivity to artifact,” IEEE Trans. Biomed. Eng.,vol. 48, no. 4, pp. 452–61, Apr. 2001.
[34] J. A. C. Patterson, and G.-Z. Yang, “Ratiometric artifact reduction in lowpower reflective photoplethysmography,” IEEE Trans. Biomed. CircuitsSyst., vol. 5, no. 4, pp. 330–8, July 2011.
[35] F. M. Coetzee, and Z. Elghazzawi, “Noise-resistant pulse oximetry usinga synthetic reference signal,” IEEE Trans. Biomed. Eng., vol. 47, no. 8,pp. 1018–26, Aug. 2000.
[36] M. R. Ram, K. V. Madhav, E. H. Krishna, N. R. Komalla, andK. A. Reddy, “A novel approach for motion artifact reduction in PPGsignals based on AS-LMS adaptive filter,” IEEE Trans. Instrum. Meas.,vol. 61, no. 5, pp. 1445–57, May 2012.
[37] R. Yousefi, M. Nourani, S. Ostadabbas, and I. Panahi, “A motion-tolerantadaptive algorithm for wearable photoplethysmographic biosensors,”IEEE J. Biomed. Health Inform., vol. 18, no. 2, pp. 670–81, Mar. 2014.
[38] B. S. Kim, and S. K. Yoo, “Motion artifact reduction in photoplethys-mography using independent component analysis,” IEEE Trans. Biomed.Eng., vol. 53, no. 3, pp. 566–8, Mar. 2006.
[39] R. Krishnan, B. Natarajan, and S. Warren, “Two-stage approach fordetection and reduction of motion artifacts in photoplethysmographicdata,” IEEE Trans. Biomed. Eng., vol. 57, no. 8, pp. 1867–76, Aug.2010.
[40] H.-W. Lee, J.-W. Lee, W.-G. Jung, and G.-K. Lee, “The periodic movingaverage filter for removing motion artifacts from PPG signals,” Int. J.Control Autom., vol. 5, no. 6, pp. 701–6, Dec. 2007.
[41] H. Fukushima, H. Kawanaka, M. S. Bhuiyan, and K. Oguri, “Estimatingheart rate using wrist-type Photoplethysmography and acceleration sen-sor while running,” Conf. Proc. IEEE Eng. Med. Biol. Soc., pp. 2901–4,Aug. 2012.
[42] Z. Zhang, Z. Pi, and B. Liu, “TROIKA: A general framework for heartrate monitoring using wrist-type photoplethysmographic signals duringintensive physical exercise,” IEEE Trans. Biomed. Eng., vol. 62, no. 2,pp. 522–31, Feb. 2015.
[43] Z. Zhang, “Photoplethysmography-based heart rate monitoring in phys-ical activities via joint sparse spectrum reconstruction,” IEEE Trans.Biomed. Eng., vol. 62, no. 8, pp. 1902–10, Aug. 2015.
[44] S.M.A. Salehizadeh, D. Dao, J. Bolkhovsky, C. Cho, Y. Mendelson,and K.H. Chon, “A novel time-varying spectral filtering algorithm forreconstruction of motion artifact corrupted heart rate signals during in-tense physical activities using a wearable photoplethysmogram sensor,”Sensors, vol. 16, no. 10, pp. 1–20, Dec. 2015.
[45] L. Wang, B. P. L. Lo, and G.-Z. Yang, “Multichannel reflective PPGearpiece sensor with passive motion cancellation,” IEEE Trans. Biomed.Circuits Syst., vol. 1, no. 4, pp. 235–41, Dec. 2007.
[46] J. M. Goldman, M. T. Petterson, R. J. Kopotic, and S. J. Barker, “Masimosignal extraction pulse oximetry,” J. Clin. Monit. Comput., vol. 16, no.7, pp. 475–83, Jan. 2000.
[47] Y.-S. Yan, and Y.-T. Zhang, “An efficient motion-resistant method forwearable pulse oximeter,” IEEE T. Inf. Technol. B., vol. 12, no. 3, pp.399–405, May 2008.
[48] Y.-S. Yan, C. C. Poon, and Y.-T. Zhang, “Reduction of motion artifactin pulse oximetry by smoothed pseudo Wigner-Ville distribution,” J.Neuroeng. Rehabil., vol. 2, no. 1, p. 3, Mar. 2005.
[49] P. Rodrıguez, A Luna, I Candela, R Mujal, R Teodorescu, and F Blaab-jerg, “Multiresonant frequency-locked loop for grid synchronization ofpower converters under distorted grid conditions,” IEEE Trans. Ind.Electron., vol. 58, no. 1, pp. 127–38, Jan. 2011.
[50] R. W. C. G. R. Wijshoff, J. Veen, A. M. Van der Lee, L. Mulder,J.M.A. Stijnen, S. Van Tuijl, and R. M. Aarts, “PPG motion artifacthandling using a self-mixing interferometric sensor,” Proc. SPIE, vol.7894, pp. 0F1–13, Jan. 2011.
[51] R. W. C. G. R. Wijshoff, M. Mischi, J. Veen, A. M. Van der Lee, andR. M. Aarts, “Reducing motion artifacts in photoplethysmograms byusing relative sensor motion: phantom study,” J. Biomed. Opt., vol. 17,no. 11, pp. 117007–1–15, Nov. 2012.
[52] R. W. C. G. R. Wijshoff, M. Mischi, P. H. Woerlee, and R. M. Aarts,“Improving pulse oximetry accuracy by removing motion artifactsfrom photoplethysmograms using relative sensor motion: a preliminarystudy,” in Oxygen Transport to Tissue XXXV (Advances in ExperimentalMedicine and Biology vol 789), S. Van Huffel, G. Naelaers, A. Caicedo,D. F. Bruley, and D. K. Harrison, Eds., New York, NY, USA: SpringerScience+Business Media, 2013, pp. 411–7.
[53] Y. Mendelson, and B. D. Ochs, “Noninvasive pulse oximetry utilizingskin reflectance photoplethysmography,” IEEE Trans. Biomed. Eng., vol.35, no. 10, pp. 798–805, Oct. 1988.
[54] R. G. Haahr, S. B. Duun, M. H. Toft, B. Belhage, J. Larsen,K. Birkelund, and E. V. Thomsen, “An electronic patch for wearablehealth monitoring by reflectance pulse oximetry,” IEEE Trans. Biomed.Circuits Syst., vol. 6, no. 1, pp. 45–53, Feb. 2012.
[55] M. Ciobotaru, R. Teodorescu, and F. Blaabjerg, “A new single-phasePLL structure based on second order generalized integrator,” Proc. IEEEPESC, pp. pp. 1–6, June 2006.

IEEE TRANSACTIONS ON BIOMEDICAL ENGINEERING 13
[56] K. Mozdzynski, K. Rafał, and M. Bobrowska-Rafał, “Application of thesecond order generalized integrator in digital control systems,” Archivesof Electrical Engineering, vol. 63, no. 3, pp. 423–37, Sep. 2014.
[57] Y. Xiao, and Y. Tadokoro, “LMS-based notch filter for the estimationof sinusoidal signals in noise,” Signal Processing, vol. 46, no. 2, pp.223–31, Oct. 1995.
[58] J. G. Webster, “Reducing motion artifacts and interference in biopoten-tial recording,” IEEE Trans. Biomed. Eng., vol. 31, no. 12, pp. 823–26,Dec. 1984.